supplementary information supplementary … · this document contains: supplementary figures and...
TRANSCRIPT

In the format provided by the authors and unedited.
1
Supplementary Information
Self-organized amniogenesis by human pluripotent stem cells in a
biomimetic implantation-like niche
Yue Shao1,†, Kenichiro Taniguchi2,†, Katherine Gurdziel3, Ryan F. Townshend2, Xufeng Xue1, Koh
Meng Aw Yong1, Jianming Sang1, Jason R. Spence2, Deborah L. Gumucio2,*, Jianping Fu1,2,4,*
1Department of Mechanical Engineering, University of Michigan, Ann Arbor, MI 48109, USA;
2Department of Cell and Developmental Biology, University of Michigan Medical School, Ann Arbor,
MI 48109, USA; 3Institute of Environmental Health Sciences, Wayne State University, Detroit, MI
48202, USA; 4Department of Biomedical Engineering, University of Michigan, Ann Arbor, MI, 48109,
USA.
†These authors contributed equally to this work;
*Correspondence should be addressed to J. F. ([email protected]) or D. L. G.
This document contains:
Supplementary Figures and Captions
Supplementary Tables
Supplementary References
© 2016 Macmillan Publishers Limited, part of Springer Nature. All rights reserved.
SUPPLEMENTARY INFORMATIONDOI: 10.1038/NMAT4829
NATURE MATERIALS | www.nature.com/naturematerials 1

2
Supplementary Figures and Captions
Supplementary Figure 1
Supplementary Figure 1. Distinct morphogenesis of hPSCs under different culture conditions.
Stacked bar plots showing percentages of hPSC colonies or hPSC-derived epithelial cysts with different
morphologies under different culture conditions as indicated. Semi-quantitative delineation of 3D
columnar versus 3D squamous cysts was provided in Fig. 1e. A 3D intermediate cyst is defined as a cyst
showing morphological transition from columnar to squamous (see also Supplementary Fig. 3a). ncyst
(ncolony) = 100, 502, 469, and 694 for Glass-2D, Gel-2D, Glass-3D, and Gel-3D conditions, respectively.
Data represent the mean ± s.e.m with n = 3 biological replicates from n = 2 independent experiments.
Same observation has been successfully repeated in total n = 16 independent experiments.
© 2016 Macmillan Publishers Limited, part of Springer Nature. All rights reserved.
NATURE MATERIALS | www.nature.com/naturematerials 2
SUPPLEMENTARY INFORMATIONDOI: 10.1038/NMAT4829

3
Supplementary Figure 2
Supplementary Figure 2. Squamous epithelial cysts derived from hPSCs show blunted
transcriptional suppression of pluripotency genes while maintaining epithelial features. qRT-
PCR analysis of pluripotency genes NANOG, OCT4, and SOX2 (a), as well as epithelial markers CDH1
and CLDN6 (b), for hPSCs cultured in indicated conditions. Data were normalized against GAPDH and
plotted as the mean ± s.e.m, with n = 4 - 5 biological replicates indicated by individual dots under each
condition. n = 2 independent experiments. P-values were calculated using unpaired, two-sided Student's
t-test. **: P < 0.01.
© 2016 Macmillan Publishers Limited, part of Springer Nature. All rights reserved.
NATURE MATERIALS | www.nature.com/naturematerials 3
SUPPLEMENTARY INFORMATIONDOI: 10.1038/NMAT4829

4
Supplementary Figure 3
© 2016 Macmillan Publishers Limited, part of Springer Nature. All rights reserved.
NATURE MATERIALS | www.nature.com/naturematerials 4
SUPPLEMENTARY INFORMATIONDOI: 10.1038/NMAT4829

5
Supplementary Figure 3. Morphogenic cytodifferentiation of hPSCs over time in the
implantation-like Gel-3D niche. (a) Confocal micrographs taken at different days (as indicated),
showing immunostaining of ECAD (green) and counterstaining by HOECHST (blue) to examine
morphological evolution of hPSCs cultured in the implantation-like Gel-3D niche. Magnified views of
individual cysts (marked by white arrowheads) at different time points reveal a morphological transition
from columnar to intermediate, to squamous cysts (a1-a6). Some hPSC clusters (marked by magenta
arrows) did not form recognizable open lumens at day 2 or day 3. Such clusters were excluded from the
quantification of time-dependent cyst morphological change in b. (b) Stacked bar plot showing
percentages of hPSC-derived epithelial cysts with different morphologies in the implantation-like Gel-
3D niche at days 2, 3, 4, and 5. Data represent the mean ± s.e.m with ncyst = 424 (day 2), 534 (day 3),
652 (day 4), and 542 (day5). n = 3 biological replicates for each condition. (c) Confocal micrographs
showing co-staining of NANOG (red) and OCT4 (green) for hPSCs cultured in the implantation-like
Gel-3D niche at different days as indicated. HOECHST (blue) counterstains the nucleus. Scale bars in
a&c, 50 µm. n = 2 independent experiments.
© 2016 Macmillan Publishers Limited, part of Springer Nature. All rights reserved.
NATURE MATERIALS | www.nature.com/naturematerials 5
SUPPLEMENTARY INFORMATIONDOI: 10.1038/NMAT4829

6
Supplementary Figure 4
© 2016 Macmillan Publishers Limited, part of Springer Nature. All rights reserved.
NATURE MATERIALS | www.nature.com/naturematerials 6
SUPPLEMENTARY INFORMATIONDOI: 10.1038/NMAT4829

7
Supplementary Figure 4. The implantation-like Gel-3D niche induces spontaneous, self-
organized development of squamous epithelial cysts from multiple hPSC lines. Confocal
micrographs showing immunostaining of pluripotency markers NANOG (red; top), OCT4 (green;
middle), and SOX2 (red; bottom), pan-cell membrane marker WGA (purple; top and middle), and
basolateral membrane marker ECAD (green; bottom), in the UM63-1 hESC line (a), H7 hESC line (c),
and 1196a hiPSC line (e) cultured under indicated conditions. Scale bars, 50 µm. Western blot showing
expression levels of NANOG, OCT4, SOX2, ECAD, and GAPDH in the UM63-1 hESC (b), H7 hESC
(d), and 1196a hiPSC (f) cultured under indicated conditions. Immunofluorescence staining and Western
blotting for each cell line was conducted for n = 2 independent experiments.
© 2016 Macmillan Publishers Limited, part of Springer Nature. All rights reserved.
NATURE MATERIALS | www.nature.com/naturematerials 7
SUPPLEMENTARY INFORMATIONDOI: 10.1038/NMAT4829

8
Supplementary Figure 5
Supplementary Figure 5. Self-organized development of squamous epithelial cystic tissues from
hPSCs in the implantation-like Gel-3D niche requires a thick gel bed. (a) Confocal micrographs
showing immunostaining of WGA (purple), NANOG (red), OCT4 (green), and SOX2 (red) and
counterstaining by HOECHST (blue) for hPSCs cultured in Gel-3D with varying nominal gel bed
thicknesses as indicated. Cartoons show the typical epithelial cyst morphology observed under each
condition. n = 2 independent experiments. Scale bar, 50 µm. (b) Stacked bar plot showing percentages
of hPSC-derived epithelial cysts with different morphologies in Gel-3D as a function of the nominal gel
bed thickness. Data represent the mean ± s.e.m with ncyst = 306, 361, 694, and 492 for gel beds of 20, 60,
© 2016 Macmillan Publishers Limited, part of Springer Nature. All rights reserved.
NATURE MATERIALS | www.nature.com/naturematerials 8
SUPPLEMENTARY INFORMATIONDOI: 10.1038/NMAT4829

9
100, and 150 µm thickness, respectively. n = 3 biological replicates for each condition. n = 2
independent experiments.
© 2016 Macmillan Publishers Limited, part of Springer Nature. All rights reserved.
NATURE MATERIALS | www.nature.com/naturematerials 9
SUPPLEMENTARY INFORMATIONDOI: 10.1038/NMAT4829

10
Supplementary Figure 6
Supplementary Figure 6. An artificial matrix containing an elastomeric micropost array supports
self-organized development of hPSCs into epithelial cystic tissues with squamous, human
amnion-like morphology. (a) Scanning electron microscopy (SEM) image of the elastomeric
polydimethylsiloxane (PDMS) micropost array with a post diameter of 1.83 µm, a post height of 8.4 µm,
and a post center-to-center distance of 4 µm. Scale bar, 10 µm. (b) Stacked bar plot showing
percentages of hPSC colony or hPSC-derived epithelial cysts with different morphologies as a function
of PDMS micropost height and ECM dimensionality. Flat PDMS surfaces without microposts (thus with
a micropost height of 0 µm) were included for comparison. Data represent the mean ± s.e.m with ncolony
= 100 for all three 2D culture conditions and ncyst = 250, 270, and 282 for 3D cultures using flat PDMS,
0.7 µm tall micropost, and 8.4 µm tall micropost, respectively. n = 3 biological replicates for each
condition. n = 3 independent experiments.
© 2016 Macmillan Publishers Limited, part of Springer Nature. All rights reserved.
NATURE MATERIALS | www.nature.com/naturematerials 10
SUPPLEMENTARY INFORMATIONDOI: 10.1038/NMAT4829

11
Supplementary Figure 7
Supplementary Figure 7. Development of squamous cystic tissues by hPSCs in the
implantation-like Gel-3D niche activates a unique subset of epithelial-to-mesenchymal
transition-related transcription factors. (a,b) qRT-PCR analysis of BRACHYURY (BRA), SNAI1,
SNAI2 (a), CDH1, and CDH2 (b), for hPSCs cultured in indicated conditions. Data were normalized
against GAPDH and plotted as the mean ± s.e.m, with n = 3 - 5 biological replicates indicated by
individual dots under each condition, n = 2 independent experiments. Data in b for CDH1 under both
Glass-2D and Gel-3D conditions are the same as those in Supplementary Fig. 2b. (c) Confocal
© 2016 Macmillan Publishers Limited, part of Springer Nature. All rights reserved.
NATURE MATERIALS | www.nature.com/naturematerials 11
SUPPLEMENTARY INFORMATIONDOI: 10.1038/NMAT4829

12
micrographs showing immunostaining of FOXA2 (red) and counterstaining by HOECHST (blue) for
hPSCs cultured in Glass-2D, Gel-3D, and PS-2D conditions as indicated. Scale bar, 50 µm. n = 2
independent experiments. (d) qRT-PCR analysis of FOXA2 for hPSCs cultured in different conditions as
indicated. Data were normalized against GAPDH and plotted as the mean ± s.e.m, with n = 3 - 5
biological replicates indicated by individual dots under each condition. P-values were calculated using
unpaired, two-sided Student's t-test. *: P < 0.05; **: P < 0.01; ***: P < 0.001. n = 2 independent
experiments.
© 2016 Macmillan Publishers Limited, part of Springer Nature. All rights reserved.
NATURE MATERIALS | www.nature.com/naturematerials 12
SUPPLEMENTARY INFORMATIONDOI: 10.1038/NMAT4829

13
Supplementary Figure 8
Supplementary Figure 8. hPSC-derived squamous cystic tissue lacks molecular features
associated with trophoblasts. (a) qRT-PCR analysis of trophoblast markers KRT7, CGA, and HLA-G,
for hPSCs under different culture conditions as indicated. Data were normalized against GAPDH before
being plotted as the mean ± s.e.m, with n = 3 biological replicates indicated by individual dots for each
condition. n = 2 independent experiments. P-values were calculated using unpaired, two-sided Student's
t-test. *: P < 0.05. (b&c) Confocal micrographs showing co-staining of BRA (red) with CDX2 (green; b)
or GATA3 (green; c), for hPSCs under both Glass-3D and Gel-3D culture conditions. HOECHST (blue)
counterstains the nucleus. n = 2 independent experiments. (d) Confocal micrographs showing co-
© 2016 Macmillan Publishers Limited, part of Springer Nature. All rights reserved.
NATURE MATERIALS | www.nature.com/naturematerials 13
SUPPLEMENTARY INFORMATIONDOI: 10.1038/NMAT4829

14
staining of SSEA-4 (green) with SOX2 (red) for hPSCs cultured in different conditions as indicated.
HOECHST (blue) counterstains the nucleus. n = 2 independent experiments. Scale bars in b-d, 50 µm.
© 2016 Macmillan Publishers Limited, part of Springer Nature. All rights reserved.
NATURE MATERIALS | www.nature.com/naturematerials 14
SUPPLEMENTARY INFORMATIONDOI: 10.1038/NMAT4829

15
Supplementary Figure 9
Supplementary Figure 9. Gene ontology (GO) functional annotation clustering. Genes enriched in
hPSC-amnion, 9-week human amnion, human chorion, and human placenta, respectively, relative to
hPSCs, were subjected to functional annotation clustering analysis using DAVID. For each data set, the
four annotation clusters with the highest enrichment scores (plotted along the x-axis and also listed in
parentheses following the annotation term) are presented. The data sets used for 9-week human amnion,
human chorion, and human placenta are from a previous publication (GEO accession number
GSE66302)1.
© 2016 Macmillan Publishers Limited, part of Springer Nature. All rights reserved.
NATURE MATERIALS | www.nature.com/naturematerials 15
SUPPLEMENTARY INFORMATIONDOI: 10.1038/NMAT4829

16
Supplementary Figure 10
Supplementary Figure 10. Gene set enrichment analysis (GSEA) for 35 ALK-pathway genes in
hPSC-amnion. The entire ranked list of genes, ordered by fold change of expression level in hPSC-
amnion relative to hPSCs (as shown in Supplementary Table 1), was queried using the gene set,
BIOCARTA_ALK_PATHWAY, which contains 35 genes associated with BMP signaling. Significant
enrichment of ALK-pathway related genes was observed in hPSC-amnion. (see Supplementary Table
5 for tabulated enrichment analysis results).
© 2016 Macmillan Publishers Limited, part of Springer Nature. All rights reserved.
NATURE MATERIALS | www.nature.com/naturematerials 16
SUPPLEMENTARY INFORMATIONDOI: 10.1038/NMAT4829
17
Supplementary Figure 11
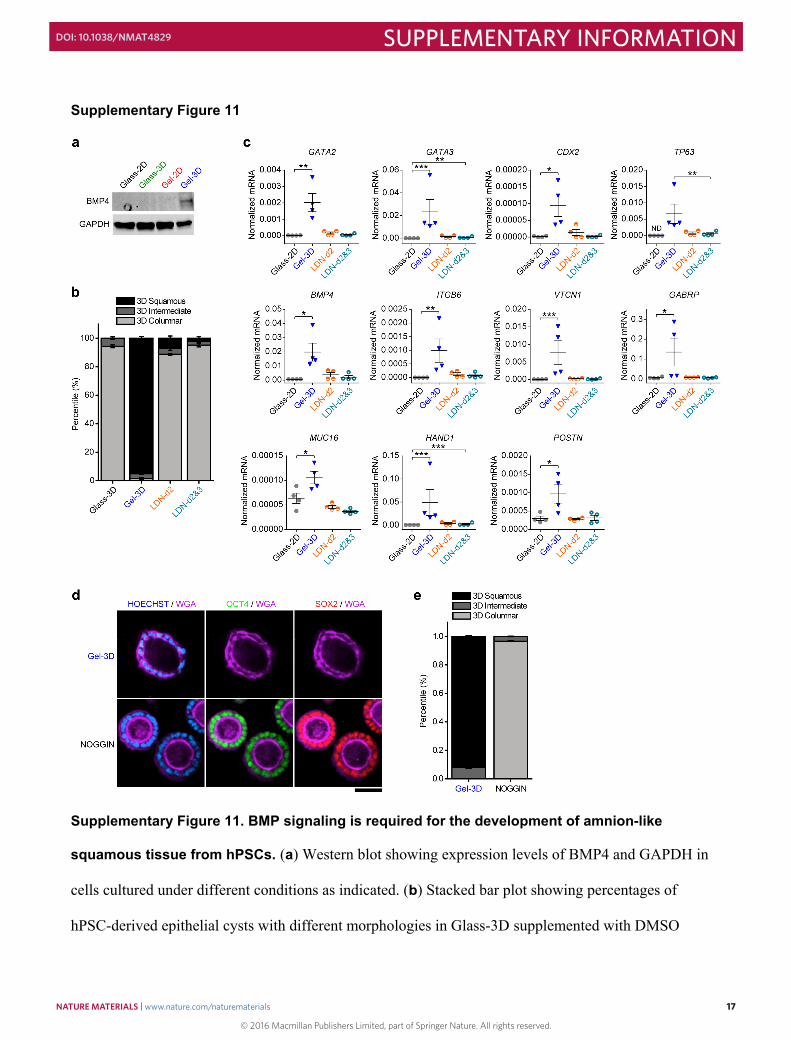
Supplementary Figure 11. BMP signaling is required for the development of amnion-like
squamous tissue from hPSCs. (a) Western blot showing expression levels of BMP4 and GAPDH in
cells cultured under different conditions as indicated. (b) Stacked bar plot showing percentages of
hPSC-derived epithelial cysts with different morphologies in Glass-3D supplemented with DMSO
© 2016 Macmillan Publishers Limited, part of Springer Nature. All rights reserved.
NATURE MATERIALS | www.nature.com/naturematerials 17
SUPPLEMENTARY INFORMATIONDOI: 10.1038/NMAT4829

18
(Glass-3D; negative control), in Gel-3D supplemented with DMSO (Gel-3D; positive control), and in
Gel-3D supplemented with LDN193189 (LDN; 500 nM) on day 2 only (LDN-d2) or on both days 2 and
3 (LDN-d2&3). ncyst = 144, 311, 365, and 320 for Glass-3D, Gel-3D, LDN-d2, and LDN-d2&3,
respectively. n = 3 biological replicates for each condition. n = 2 independent experiments. (c) qRT-
PCR analysis of GATA2, GATA3, CDX2, TP63, BMP4, ITGB6, VTCN1, GABRP, MUC16, HAND1, and
POSTN under Glass-3D, Gel-3D, LDN-d2, and LDN-d2&3 conditions. Data were normalized against
GAPDH and plotted as the mean ± s.e.m, with n = 4 biological replicates indicated by individual dots for
each condition. n = 2 independent experiments. ND, not detected, with its normalized value set to zero.
P-values were calculated using unpaired, two-sided Student's t-test. P-value calculation was not
performed against "ND" result. *: P < 0.05; **: P < 0.01; ***: P < 0.001. (d) Immunofluorescence
analysis of cysts cultured under Gel-3D condition without (top panel) or with (bottom panel) NOGGIN
treatment. Cysts were stained for OCT4 (green), SOX2 (red), and WGA (purple). HOECHST (blue)
counterstains the nucleus. Scale bar, 50 µm. (e) Stacked bar plots show percentages of hPSC-derived
epithelial cysts with different morphologies in the Gel-3D system without ("Gel-3D" group) or with
("NOGGIN" group) NOGGIN treatment. ncyst = 131 and 241 for Gel-3D and NOGGIN groups,
respectively. Data represent the mean ± s.e.m. with n = 3 biological replicates from n = 2 independent
experiments.
© 2016 Macmillan Publishers Limited, part of Springer Nature. All rights reserved.
NATURE MATERIALS | www.nature.com/naturematerials 18
SUPPLEMENTARY INFORMATIONDOI: 10.1038/NMAT4829

19
Supplementary Tables
Supplementary Table 1. Processed RNA-seq reads for control hPSCs (Glass-2D) and hPSC-
amnion (Gel-3D).
(see separate Supplementary File)
© 2016 Macmillan Publishers Limited, part of Springer Nature. All rights reserved.
NATURE MATERIALS | www.nature.com/naturematerials 19
SUPPLEMENTARY INFORMATIONDOI: 10.1038/NMAT4829

20
Supplementary Table 2. List of 108 putative pluripotency genes2 detected in hPSCs and hPSC-
amnion in RNA-seq. Genes are consecutively listed as plotted, from left to right, in Fig. 4f.
1 CUZD1 28 SCLY 55 TOMM40 82 RLIM 2 CER1 29 TXLNG 56 SEPHS1 83 RC3H2 3 CCL26 30 JMJD1C 57 SLIRP 84 PINX1 4 LEFTY2 31 EIF2AK4 58 EMG1 85 RPRM 5 GDF3 32 TARS 59 DDX18 86 GRPR 6 ADD2 33 SNURF 60 MTAP 87 GNPTAB 7 DDX21 34 RRP15 61 TFAM 88 FGF2 8 PNO1 35 USP45 62 NIP7 89 MYO1E 9 DPPA4 36 SHISA9 63 HSPD1 90 LARP7 10 RRAS2 37 NANOG 64 TIMM8A 91 CACHD1 11 GABRB3 38 CCRN4L 65 POU5F1 92 PHC1 12 RPL22L1 39 C10orf76 66 POU5F1P3 93 VRTN 13 MDN1 40 EXOC2 67 DDX6 94 TERF1 14 GAL 41 G3BP2 68 CENPN 95 CHAC2 15 PMAIP1 42 PHAX 69 TUBB2B 96 TDGF1 16 BICD1 43 CDC25A 70 DENR 97 SLC25A2117 AKIRIN1 44 MTHFD1L 71 CASP3 98 USP44 18 FGD6 45 RNASEH1 72 SKP2 99 LEFTY1 19 MRS2 46 L1TD1 73 MKKS 100 NODAL 20 BPTF 47 LRR1 74 NUDT15 101 RRM2 21 KIF13A 48 MRPS30 75 FKBP4 102 GLB1L3 22 RAC3 49 PSME3 76 NUP160 103 C21orf88 23 C9orf85 50 MSH2 77 TMPO 104 SMPDL3B24 DNAH14 51 EEF1E1 78 MMS22L 105 UNC5D 25 METTL21A 52 NLN 79 ESRP1 106 LECT1 26 METTL8 53 LOC100506054 80 SKIL 107 ZIC3 27 BCAT1 54 NOLC1 81 SNX5 108 RTP1
© 2016 Macmillan Publishers Limited, part of Springer Nature. All rights reserved.
NATURE MATERIALS | www.nature.com/naturematerials 20
SUPPLEMENTARY INFORMATIONDOI: 10.1038/NMAT4829

21
Supplementary Table 3. List of 50 most up-regulated genes (UP-50) and 50 most down-regulated
genes (DOWN-50) in hPSC-amnion compared with hPSCs. Genes are consecutively listed as
plotted, from left to right, in Fig. 4f.
UP-50 genes DOWN-50 genes Rank Gene Rank Gene Rank Gene Rank Gene 1 HAND1 26 PLSCR5 1 CUZD1 26 VTN 2 TFAP2B 27 HOXC13 2 CH25H 27 IFITM5 3 ISL1 28 MEIS1 3 PTGFR 28 MIRLET7BHG 4 LUM 29 WNT6 4 TMPRSS3 29 LOC399829 5 C8orf4 30 NR2F2 5 JAKMIP2-AS1 30 XIST 6 EVX1 31 MSX2 6 ANKRD22 31 KCNJ1 7 DLX5 32 CCR1 7 ISL2 32 UCP1 8 TBX3 33 CYSLTR2 8 RXFP1 33 TNFAIP6 9 HOXB2 34 EPAS1 9 PCDHB1 34 C3orf72 10 ERP27 35 KRT23 10 OLIG3 35 SEZ6 11 COL3A1 36 TP63 11 WDR49 36 CBLN4 12 GATA3 37 MEIS1-AS3 12 AQP7 37 LOC10012788813 GUCY1A3 38 BARX2 13 NLRP10 38 FREM3 14 P2RY6 39 HMX1 14 NPTX1 39 TMEM114 15 TNFSF8 40 HOXC6 15 LOC100507387 40 DRD1 16 TFAP2A 41 HOXB-AS1 16 TAC1 41 DSG3 17 DCN 42 IGFBP7 17 GABRA1 42 PRSS56 18 VGLL1 43 DIO3 18 FOXE1 43 CCR9 19 HOXB9 44 HOXB3 19 NXF4 44 GPR17 20 GATA3-AS1 45 LOC642366 20 TPH2 45 PAPLN 21 CDX2 46 ITGA8 21 RUFY4 46 COL20A1 22 PGLYRP4 47 C1orf105 22 HTR1A 47 HMX2 23 SLC40A1 48 ANKRD1 23 SERPINB4 48 LOC10050724424 CHI3L2 49 LCP1 24 NEUROG3 49 TPSB2 25 HAND2 50 DLX6 25 CDH19 50 MPO
© 2016 Macmillan Publishers Limited, part of Springer Nature. All rights reserved.
NATURE MATERIALS | www.nature.com/naturematerials 21
SUPPLEMENTARY INFORMATIONDOI: 10.1038/NMAT4829

22
Supplementary Table 4. List of hierarchically clustered ~4,000 pre-selected genes that have
greater expression in hPSC-amnion than in hPSCs and in fetal extraembryonic tissues1. Genes
are consecutively listed as plotted, from top to bottom, in Fig. 4g.
(See separate Supplementary File)
© 2016 Macmillan Publishers Limited, part of Springer Nature. All rights reserved.
NATURE MATERIALS | www.nature.com/naturematerials 22
SUPPLEMENTARY INFORMATIONDOI: 10.1038/NMAT4829

23
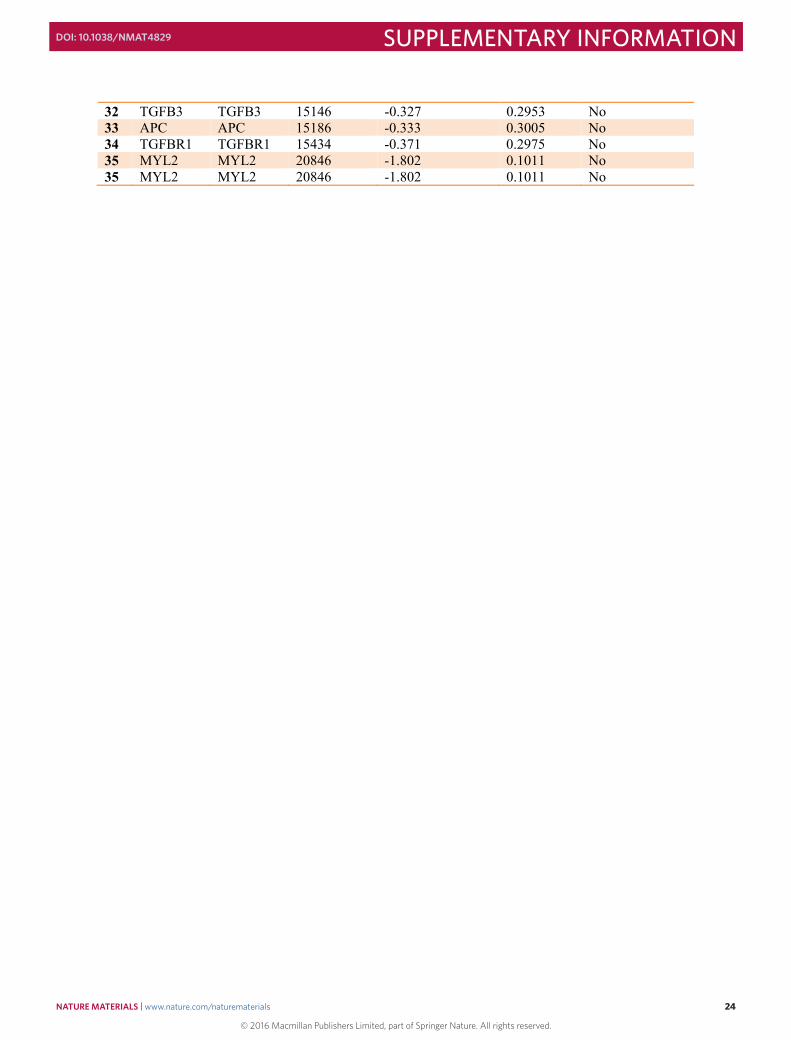
Supplementary Table 5. Tabulated gene set enrichment analysis (GSEA) results. The entire data
set (hPSC-amnion versus hPSCs), as ranked and shown in Supplementary Table 1, was queried
using the gene set, BIOCARTA_ALK_PATHWAY, a collection of 35 genes related to BMP
signaling.
Data set Gene set
Supplementary Table 1 BIOCARTA_ALK_PATHWAY
Enrichment score (ES) 0.7473358 Normalized enrichment score (NES) 2.1402795 Nominal p-value 0 FDR q-value 0 FWER p-value 0
PROBE GENE SYMBOL
RANK IN GENE LIST
RANK METRIC SCORE
RUNNING ES
CORE ENRICHMENT
1 BMP4 BMP4 123 6.028 0.1195 Yes 2 NOG NOG 224 4.789 0.2144 Yes 3 TGFB2 TGFB2 328 3.962 0.2919 Yes 4 SMAD6 SMAD6 348 3.879 0.3714 Yes 5 BMP5 BMP5 434 3.509 0.4404 Yes 6 FZD1 FZD1 618 2.794 0.4904 Yes 7 NKX2-5 NKX2-5 754 2.632 0.5391 Yes 8 NPPB NPPB 1070 1.929 0.5654 Yes 9 BMP10 BMP10 1088 1.924 0.6045 Yes 10 BMP2 BMP2 1517 1.479 0.6166 Yes 11 NPPA NPPA 1598 1.408 0.6424 Yes 12 TGFB1 TGFB1 1638 1.381 0.6693 Yes 13 GATA4 GATA4 1660 1.356 0.6964 Yes 14 CHRD CHRD 1747 1.294 0.7195 Yes 15 BMPR2 BMPR2 2175 1.04 0.7226 Yes 16 BMP7 BMP7 2468 0.935 0.7294 Yes 17 GSK3B GSK3B 2661 0.885 0.7394 Yes 18 CTNNB1 CTNNB1 2873 0.824 0.7473 Yes 19 SMAD1 SMAD1 4004 0.62 0.7114 No 20 BMPR1A BMPR1A 4196 0.593 0.7154 No 21 SMAD5 SMAD5 5296 0.452 0.6773 No 22 MEF2C MEF2C 5496 0.428 0.6776 No 23 MAP3K7 MAP3K7 6985 0.268 0.6188 No 24 HNF1A 7505 0.217 0.6009 No 25 ATF2 ATF2 9280 0.063 0.5256 No 26 SMAD4 SMAD4 9814 0.005 0.5027 No 27 RFC1 RFC1 12640 -0.02 0.3811 No 28 ACVR1 ACVR1 13433 -0.105 0.349 No 29 TGFBR2 TGFBR2 13945 -0.164 0.3304 No 30 AXIN1 AXIN1 14035 -0.175 0.3301 No 31 DVL1 DVL1 14975 -0.301 0.2958 No
© 2016 Macmillan Publishers Limited, part of Springer Nature. All rights reserved.
NATURE MATERIALS | www.nature.com/naturematerials 23
SUPPLEMENTARY INFORMATIONDOI: 10.1038/NMAT4829
24
32 TGFB3 TGFB3 15146 -0.327 0.2953 No 33 APC APC 15186 -0.333 0.3005 No 34 TGFBR1 TGFBR1 15434 -0.371 0.2975 No 35 MYL2 MYL2 20846 -1.802 0.1011 No 35 MYL2 MYL2 20846 -1.802 0.1011 No
© 2016 Macmillan Publishers Limited, part of Springer Nature. All rights reserved.
NATURE MATERIALS | www.nature.com/naturematerials 24
SUPPLEMENTARY INFORMATIONDOI: 10.1038/NMAT4829

25
Supplementary Table 6. List of primary antibodies used in immunocytochemistry (ICC) and
Western blotting (WB).
Protein Species Application Catalog No. Vendor EZRIN Mouse 1:2000 (ICC) E8897 Sigma-Aldrich
E-CADHERIN Mouse 1:500 (ICC) 1:1000 (WB) 610181 BD Biosciences
NANOG Rabbit 1:500 (ICC) 1:2000 (WB) 4903S Cell Signaling Technology
OCT4 Mouse 1:200 (ICC) 1:500 (WB) SC-5279 Santa-Cruz Biotechnology
SOX2 Rabbit 1:1000 (ICC) 1:1000 (WB) 09-0024 Stemgent
GAPDH Rabbit 1:1000 (WB) SC-25778 Santa-Cruz Biotechnology BRACHYURY Rabbit 1:100 (ICC) SC-20109 Santa-Cruz Biotechnology SNAIL Rabbit 1:100 (ICC) SC-28199 Santa-Cruz Biotechnology SLUG Rabbit 1:400 (ICC) 9585 Cell Signaling Technology
N-CADHERIN Rat 1:500 (ICC) MNCD2-c Developmental Studies Hybridoma Bank
FOXA2 Rabbit 1:500 (ICC) WRAB-1200 Seven Hills Bioreagents
pSMAD1/5 Rabbit 1:100 (ICC) 1:1000 (WB) 9516S Cell Signaling Technology
SMAD1/5/8 Rabbit 1:1000 (WB) SC-6031-R Santa-Cruz Biotechnology CDX2 Mouse 1:500 (ICC) MU392A-5UC Biogenex GATA3 Mouse 1:100 (ICC) SC-268 Santa-Cruz Biotechnology SSEA-4 Mouse 1:500 (ICC) MAB4304 EMD Millipore BMP4 Mouse 1:1000 (WB) 4680 Cell Signaling Technology
© 2016 Macmillan Publishers Limited, part of Springer Nature. All rights reserved.
NATURE MATERIALS | www.nature.com/naturematerials 25
SUPPLEMENTARY INFORMATIONDOI: 10.1038/NMAT4829

26
Supplementary Table 7. List of qRT-PCR primers.
Gene Primer Sequences (5' -> 3') Reference NANOG Forward: GATTTGTGGGCCTGAAGAAA NA Reverse: ATGGAGGAGGGAAGAGGAGA NA OCT4 Forward: GTGGAGGAAGCTGACAACAA NA Reverse: GGTTCTCGATACTGGTTCGC NA SOX2 Forward: GCTTAGCCTCGTCGATGAAC NA Reverse: AACCCCAAGATGCACAACTC NA GAPDH Forward: CTCTGCTCCTCCTGTTCGAC NA Reverse: TTAAAAGCAGCCCTGGTGAC NA CDH1 Forward: TCTTCAATCCCACCACGTACA NA Reverse: TGCCATCGTTGTTCACTGGA NA CDH2 Forward: ATCAACCCCATACACCAGCC NA Reverse: GTCGATTGGTTTGACCACGG NA CLDN6 Forward: TGTTCGGCTTGCTGGTCTAC PrimerBank3 Reverse: CGGGGATTAGCGTCAGGAC PrimerBank BRACHYURY Forward: TGCTGCAATCCCATGACA PrimerBank Reverse: CGTTGCTCACAGACCACA PrimerBank SNAI1 Forward: TCGGAAGCCTAACTACAGCGA PrimerBank Reverse: AGATGAGCATTGGCAGCGAG PrimerBank SNAI2 Forward: CGAACTGGACACACATACAGTG PrimerBank Reverse: CTGAGGATCTCTGGTTGTGGT PrimerBank FOXA2 Forward: CGACTGGAGCAGCTACTATGC NA Reverse: TACGTGTTCATGCCGTTCAT NA GATA2 Forward: CAGCAAGGCTCGTTCCTGTT PrimerBank Reverse: GGCTTGATGAGTGGTCGGT PrimerBank GATA3 Forward: GCCCCTCATTAAGCCCAAG PrimerBank Reverse: TTGTGGTGGTCTGACAGTTCG PrimerBank CDX2 Forward: GACGTGAGCATGTACCCTAGC PrimerBank Reverse: GCGTAGCCATTCCAGTCCT PrimerBank TP63 Forward: CTGGAAAACAATGCCCAGA Li et al.4 Reverse: AGAGAGCATCGAAGGTGGAG Li et al.4 GATA4 Forward: CGACACCCCAATCTCGATATG PrimerBank Reverse: GTTGCACAGATAGTGACCCGT PrimerBank GATA6 Forward: CTCAGTTCCTACGCTTCGCAT PrimerBank Reverse: GTCGAGGTCAGTGAACAGCA PrimerBank KRT7 Forward: AGGATGTGGATGCTGCCTAC Li et al.4
© 2016 Macmillan Publishers Limited, part of Springer Nature. All rights reserved.
NATURE MATERIALS | www.nature.com/naturematerials 26
SUPPLEMENTARY INFORMATIONDOI: 10.1038/NMAT4829

27
Reverse: CACCACAGATGTGTCGGAGA Li et al.4 CGA Forward: CACTCCACTAAGGTCCAAGAAGA PrimerBank Reverse: CCGTGTGGTTCTCCACTTTGA PrimerBank HLA-G Forward: GAGGAGACACGGAACACCAAG PrimerBank Reverse: GTCGCAGCCAATCATCCACT PrimerBank ITGB6 Forward: CTCAACACAATAAAGGAGCTGGG PrimerBank Reverse: AAAGGGGATACAGGTTTTTCCAC PrimerBank VTCN1 Forward: TCTGGGCATCCCAAGTTGAC PrimerBank Reverse: TCCGCCTTTTGATCTCCGATT PrimerBank GABRP Forward: TTTCTCAGGCCCAATTTTGGT PrimerBank Reverse: GCTGTCGGAGGTATATGGTGG PrimerBank MUC16 Forward: GGAGCACACGCTAGTTCAGAA PrimerBank Reverse: GGTCTCTATTGAGGGGAAGGT PrimerBank HAND1 Forward: CCAAGGATGCACAGTCTGG PrimerBank Reverse: AGGAGGAAAACCTTCGTGCTG PrimerBank POSTN Forward: GAAAGGGAGTAAGCAAGGGAG Dobreva et al.5 Reverse: ATAATGTCCAGTCTCCAGGTTG Dobreva et al.5 TFAP2A Forward: GCATATCCGTTCACGCCGAT Tadeu et al.6 Reverse: GGGAGATTGACCTACAGTGCC Tadeu et al.6 TFAP2B Forward: AGCAAATGTCACGTTACTCACC PrimerBank Reverse: TGTGCTGCCGGTTCAAATACT PrimerBank KRT17 Forward: AAGATCCGTGACTGGTACCAGAGG Sankar et al.7 Reverse: GATGTCGGCCTCCACACTCAGG Sankar et al.7 KRT18 Forward: TCGCAAATACTGTGGACAATGC PrimerBank Reverse: GCAGTCGTGTGATATTGGTGT PrimerBank BMP2 Forward: ACTACCAGAAACGAGTGGGAA PrimerBank Reverse: GCATCTGTTCTCGGAAAACCT PrimerBank BMP4 Forward: TCCACAGCACTGGTCTTGAG Xu et al.8 Reverse: GGGATGTTCTCCAGATGTTCTT Xu et al.8 BMP6 Forward: AGCGACACCACAAAGAGTTCA PrimerBank Reverse: GCTGATGCTCCTGTAAGACTTGA PrimerBank BMP7 Forward: TCGGCACCCATGTTCATGC PrimerBank Reverse: GAGGAAATGGCTATCTTGCAGG PrimerBank
NA: not applicable.
© 2016 Macmillan Publishers Limited, part of Springer Nature. All rights reserved.
NATURE MATERIALS | www.nature.com/naturematerials 27
SUPPLEMENTARY INFORMATIONDOI: 10.1038/NMAT4829

28 Supplem
entary Table 8. Summ
ary of normalized gene expression fold change (G
ene FC, blue) and corresponding P-values
(red) in qRT-PC
R results show
n in Fig. 4a-e and Fig. 5c.
Gene FC
* G
lass-2D
Gel-2D
Glass-3D
Gel-3D
PS-2DP-V
alue* G
el-2DG
lass-3DG
el-3D
PS-2DN
ANO
G
1 1.1522
0.9595 0.4603
0.0578N
ANO
G
0.0598 0.7934
0.0012 2E-05
OCT4
1 0.9478
1.0273 0.7412
0.3924O
CT4 0.6499
0.8433 0.1212
0.0008SO
X2 1
0.6568 0.6266
0.2098 NT
SOX2
0.1442 0.1137
0.0098 NT
CDH
1 1
0.7587 0.6224
1.8445 0.464
CDH
1 0.0735
0.0154 0.059
0.001 CD
H2
1 0.7448
0.801 0.2637
11.195CD
H2
0.0622 0.1887
0.0007 5E-07
CLDN6
1 0.8372
1.05 1.4517
NT CLD
N6 0.4658
0.8044 0.1833
NT BRA
1 0.5262
0.3759 18.8
1585.6BRA
0.0544 0.0373
0.0006 2E-06
SNAI1
1 0.9643
1.1466 1.4097
7.6408SN
AI1 0.6599
0.1172 0.1472
2E-07 SN
AI2 1
1 1.0984
2.5537 1.4433
SNAI2
0.9806 0.0914
0.0238 0.0052
FOXA2
1 0.6132
1.2135 0.0437
8.4235FO
XA2 0.5387
0.8252 0.1609
9E-05 G
ATA2 1
1.8771 2.0677
160.32 NT
GATA2
0.1114 0.034
0.0005 NT
GATA3
1 8.1577
6.3796 3040.2
NT
GATA3
0.0931 0.0992
0.0008 NT
CD
X2 1
9.0195 19.566
530.69 NT
CD
X2 0.088
0.2608 0.0011
NT TP63
1 71.724
12.463 23429
NT
TP63 0.1116
0.0099 0.0295
NT G
ATA4 1
0.1935 0.0778
1.7343 NT
GATA4
0.1331 0.093
0.2494 NT
GATA6
1 5.0452
0.4693 3.3463
NT
GATA6
0.0718 0.4822
0.2649 NT
KRT7
1 0.5512
0.3986 1.9239
NT K
RT7 0.0021
0.0004 0.3007
NT CG
A 1
0.4663 0.7821
3.304 NT
CGA
0.1149 0.6359
0.214 NT
HLA-G
1
0.3727 0.3892
0.4052 NT
HLA-G
0.0018
0.0033 0.0277
NT ITG
B6 1
4.7892 0.9671
591.74 N
T ITG
B6 0.248
0.9684 0.0044
NT G
ABRP 1
0.869 1.1178
24.297 NT
GABRP
0.2839 0.4897
0.0155 NT
VTCN1 1
0.7895 0.0355
104.82 NT
VTCN1 0.6431
0.0102 0.0043
NT M
UC
16 1
0.3802 0.786
2.9286 NT
MU
C16
0.0201 0.3676
0.0107 NT
HAND
1 1
135.68 116.46
30774 NT
HAND
1 0.0786
0.1017 0.0014
NT K
RT17 1
0.5576 0.4645
2.9104 NT
KRT17
0.0377 0.0256
0.001 NT
KRT18
1 0.9496
1.071 3.3393
NT
KRT18
0.7013 0.4844
0.0091 NT
© 2016 Macmillan Publishers Limited, part of Springer Nature. All rights reserved.
NATURE MATERIALS | www.nature.com/naturematerials 28
SUPPLEMENTARY INFORMATIONDOI: 10.1038/NMAT4829

29
POSTN
1
1.0868 0.8867
3.2717 NT
POSTN
0.8399
0.7694 0.012
NT TFAP2A
1 72.791
21.807 14184
NT
TFAP2A 0.0665
0.1232 0.0023
NT TFAP2B
ND
1
0.1237 111.7
NT TFAP2B
NA 0.1047**
0.0097**NT
BMP2
1 0.7732
0.4749 2.9862
NT
BMP2
0.2583 0.0147
0.0041 NT
BMP4
1 1.3545
0.8368 66.177
NT BM
P4 0.4753
0.6676 6E-06
NT BM
P6 1
0.7351 0.5598
0.1727 N
T BM
P6 0.2505
0.0473 0.0029
NT BM
P7 1
1.0348 0.9192
1.7012 NT
BMP7
0.8611 0.5411
0.0132 NT
ND: not detected;
NA: not applicable;
NT: not tested;
*: Norm
alized gene expression fold change and P-values were all calculated in com
parison to the Glass-2D
condition, unless noted
otherwise. P-values w
ere calculated using un-paired, two-sided Student's t-test;
**: P-values were calculated in com
parison to the Gel-2D
condition.
© 2016 Macmillan Publishers Limited, part of Springer Nature. All rights reserved.
NATURE MATERIALS | www.nature.com/naturematerials 29
SUPPLEMENTARY INFORMATIONDOI: 10.1038/NMAT4829

30 Supplem
entary Table 9. Summ
ary of normalized gene expression fold change (G
ene FC, blue) and corresponding P-values
(red) in qRT-PC
R results of the B
MP inhibition assay (Supplem
entary Fig. 11c).
Gene FC
* G
lass-2D
Gel-3D
LD
N-d2
LD
N-d2&
3P-value*
Gel-3D
LD
N-d2
LD
N-d2&
3G
ATA2 1
172.7417 14.0872
4.3722 G
ATA2 0.0098
0.0538 0.2703
GATA3
1 1531.6606
90.6801 43.6863
GATA3
7.44E-067.02E-04
1.20E-03 C
DX2
1 49.4718
7.3310 1.1481
CD
X2 0.0281
0.2280 0.8820
TP63 N
D
12446.11971497.5686
1046.1600 TP63
0.0067**0.5894**
NA BM
P4 1
29.9719 5.8027
3.2391 BM
P4 0.0238
0.0945 0.2471
ITGB6
1 723.4922
91.4117 55.6471
ITGB6
0.0016 0.0133
0.0772 VTCN1
1 105.4589
3.1638 1.7348
VTCN1 0.0004
0.0610 0.9567
GABRP
1 20.6821
1.2107 0.9584
GABRP
0.0302 0.3096
0.9878 M
UC
16 1
1.6520 0.7210
0.5805 M
UC
16 0.0434
0.1593 0.0495
HAND
1 1
21838.72411567.4955
838.0578 H
AND1
4.55E-069.40E-05
1.30E-04 PO
STN
1 3.1656
0.9302 1.0339
POSTN
0.0178
0.8984 0.9944
ND: not detected;
NA: not applicable;
*: Norm
alized gene expression fold change and P-values were all calculated in com
parison to the Glass-2D
condition, unless noted
otherwise. P-values w
ere calculated using un-paired, two-sided Student's t-test;
**: P-values were calculated in com
parison to the LDN
-d2&3 condition.
© 2016 Macmillan Publishers Limited, part of Springer Nature. All rights reserved.
NATURE MATERIALS | www.nature.com/naturematerials 30
SUPPLEMENTARY INFORMATIONDOI: 10.1038/NMAT4829

31
Supplementary References
1. Roost, M. S., et al. KeyGenes, a tool to probe tissue differentiation using a human fetal transcriptional
atlas. Stem Cell Rep. 4, 1112-1124 (2015).
2. Mallon, B. S., et al. StemCellDB: The human pluripotent stem cell database at the National Institutes
of Health. Stem Cell Res. 10, 57-66 (2013).
3. Wang, X. W., Spandidos, A., Wang, H. J. and Seed, B. PrimerBank: A PCR primer database for
quantitative gene expression analysis, 2012 update. Nucleic. Acids. Res. 40, D1144-D1149 (2012).
4. Li, Y. C., et al. BMP4-directed trophoblast differentiation of human embryonic stem cells is mediated
through Delta Np63(+) cytotrophoblast stem cell state. Development 140, 3965-3976 (2013).
5. Dobreva, M. P., et al. Periostin as a biomarker of the amniotic membrane. Stem Cells Int. 2012,
987185 (2012).
6. Tadeu, A. M. B., et al. Transcriptional profiling of ectoderm specification to keratinocyte fate in
human embryonic stem cells. PLoS One 10, e0122493 (2015).
7. Sankar, S., et al. A novel role for keratin 17 in coordinating oncogenic transformation and cellular
adhesion in ewing sarcoma. Mol. Cell Biol. 33, 4448-4460 (2013).
8. Xu, J., et al. Transcriptional regulation of bone morphogenetic protein 4 by tumor necrosis factor and
its relationship with age-related macular degeneration. FASEB J. 25, 2221-2233 (2011).
© 2016 Macmillan Publishers Limited, part of Springer Nature. All rights reserved.
NATURE MATERIALS | www.nature.com/naturematerials 31
SUPPLEMENTARY INFORMATIONDOI: 10.1038/NMAT4829