supplementary materials for - science...
TRANSCRIPT
advances.sciencemag.org/cgi/content/full/2/8/e1501429/DC1
Supplementary Materials for
Microfluidic device for the formation of optically excitable, three-
dimensional, compartmentalized motor units
Sebastien G. M. Uzel, Randall J. Platt, Vidya Subramanian, Taylor M. Pearl, Christopher J. Rowlands,
Vincent Chan, Laurie A. Boyer, Peter T. C. So, Roger D. Kamm
Published 3 August 2016, Sci. Adv. 2, e1501429 (2016)
DOI: 10.1126/sciadv.1501429
The PDF file includes:
Supplementary Materials and Methods
fig. S1. DNA construct design, ESC colony morphology, DNA integration
validation, and pluripotency characterization.
fig. S2. Electrophysiological characterization of the ChR-HBG3-MN.
fig. S3. Optogenetic activation of NMJs in adherent cocultures.
fig. S4. Modes of tissue ablation.
fig. S5. Photosensitization of the C2C12 myoblasts.
fig. S6. Influence of the hydrogel on the force measured by the pillar.
fig. S7. Motor neurite outgrowth in the microfluidic device.
fig. S8. Opposite gradients as a mean to provide cell-specific medium.
Legends for movies S1 to S4
Other Supplementary Material for this manuscript includes the following:
(available at advances.sciencemag.org/cgi/content/full/2/8/e1501429/DC1)
movie S1 (.avi format). Muscle contraction upon optical stimulation of ChR-
HBG3-MN in adherent cultures.
movie S2 (.avi format). ECM compaction and muscle bundle formation over the
first 96 hours of the experiment.
movie S3 (.wmv format). 3D neurite outgrowth in the gel region bridging the
neurosphere and the muscle strip.
movie S4 (.avi format). Muscle bundle contraction upon light simulation of the
ChR-HBG3-MN in the microfluidic device.
Supplementary Materials and Methods
Glial feeder layer cultures
CD1 Mouse cortical glial cultures were provided by Dr. L.B. Wood, Beth Israel Deaconess
Medical Center. Cultures were received in minimum essential medium (Sigma) with 10% horse
serum (Sigma), 0.3% Anhydrous Dextrose (Fisher), 1x antibiotic antimycotic solution (Sigma).
Post deflection characterization
The measurement device was previously described (79). Briefly, copper wire (Remington
Industries, Johnsburg, IL) at 40 AWG size (87 µm diameter), was cut approximately 2 cm in
length and mounted on a 3-axis translation stage assembled from one MT1 (X-axis) and two
DT12 dovetail (Y- and Z- axes) series manual translators (Thorlabs, Newton, NJ). The copper
probe was calibrated by hanging known wire weights against gravity on the probe tip. The
measurements were used to generate a load vs. displacement curve, which was then fit using
linear regression. The stiffness of the copper probe was determined to be 0.155 μN.μm-1.
The posts were immersed in cell culture medium. The probe tip was gently positioned and in
contact with the top-center of the posts. The probe tip was directed to translate at 10 μm intervals
with return from 0 μm (origin) to 200 μm (20% post deflection) in the X-axis using the linear
translator. A laser-optical sensor (optoNCDT 1401-1, Micro-Epsilon Optronic, Ortenburg,
Germany) was used to measure position and displacement of the probe base. Software from the
manufacturer (ILD1401 Tool v2.09, Micro-Epsilon Optronic, Ortenburg, Germany) was used to
measure and record output values. Image sequences of the probe tip’s position and displacement
were captured on the microscope stage (IX81, Olympus, Center Valley, PA 18034) by video
capture software (Debut Video Capture, NCH Software, Greenwood Village CO) from a live
acquisition software feed (MetaMorph, Molecular Devices, Sunnyvale, CA) using a digital CCD
camera (ORCA-R2C10600-10B, Hamamatsu Photonics, Bridgewater, NJ).
The deflection of the post using the copper probe of known stiffness was used to determine the
post stiffness. The post stiffness was measured to be 0.36 ± 0.08 µN.μm-1 (n = 14), within the
range of values reported in previous studies (43, 88). For such a bending stiffness, the Young’s
modulus determined as a fitting parameter to the analytical solutions and computational
simulations was found to be 1.26 and 1.11 MPa respectively, consistent with the 1 MPa
measurement reported in the literature for a 5:1 mixing ratio (89).
Muscle bundle ablation
Manual ablation: After 2 days in the microfluidic device, the reversibly bonded top layer of the
device was gently peeled off and the tissue strips reminiscent of the gel filling channels and
connector channel were ablated with a gauge 26 needle under a stereomicroscope. Medium was
gently aspirated around the 2 muscle strips and a PDMS annulus was positioned on top of the
bottom membrane in order to form a large medium reservoir (Fig. 4).
2P-ablation: Beside imaging (90) or local photoactivation of light-sensitive channels (91, 92) or
3D resolved photodynamic therapy (93), two-photon excitation has been used to generate
microtrack by collagen ablation (94). We used a similar principle to ablate muscle tissue. Two-
photon ablation was performed on a custom-built ablation setup. The beam from an ultrafast
laser (Spectra Physics, Mai Tai HP) of a 750 nm wavelength was expanded by a factor of 2 using
two lenses in a 4f configuration (Newport, KPX094AR.16 and KPX106AR.16), then through a
half waveplate (Newport, 10RP02-46) and Glan Thompson polarizer (Newport, 10GT04AR.16)
for power control, before passing through a shutter (Oriel, 76992). The beam was further
expanded by a factor of 3 using a beam expander (Thorlabs, BE03M-B) so as to fill the back
aperture of the microscope objective. The resulting beam was then coupled into the back
(fluorescence) port of a microscope body (Zeiss, Axiovert 40 CFL), where it reflected off the
dichroic mirror (Semrock, FF750-SDi02-25x36) and passed into a 20x 0.5 numerical aperture air
immersion objective (Zeiss, 440340-9904-000). The sample was simultaneously illuminated
using brightfield illumination in order to image the ablation process; a camera (Thorlabs,
DCC1545M) was used to capture the image. The sample was mounted on an automated
microscope stage (Prior Scientific, HK01SKOP) however the stage was controlled manually. In
order to perform tissue ablation, the microscope was first calibrated using a sample consisting of
polymer nanospheres on a glass coverslip, in order to determine the location of the beam focus.
The sample was then placed on the microscope and brought into focus, and the ablation turned
on using the shutter. The beam was manually rastered across the sample in order to fully cut the
tissue at the desired location (fig. S4, A and B). Care was taken so as to avoid ablating the PDMS
and destroying the sample.
This technique has the advantage of performing ablation non-invasively in a closed environment
and should be considered as the best alternative when opening the device is not an option. It
could also be automated to carry out computer-aided multiple ablations.

Both manual and 2P technique yielded comparable results in terms of tissue tail resorption (fig.
S4C), and muscle differentiation.
Supplementary Figures
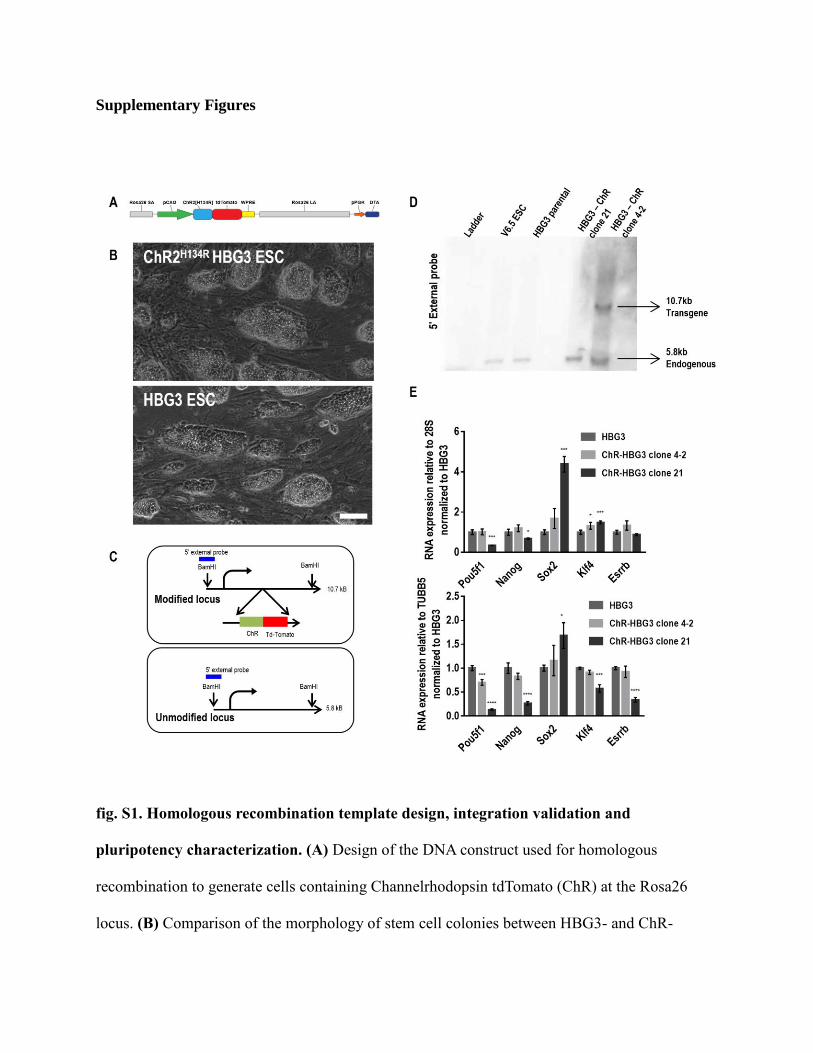
fig. S1. Homologous recombination template design, integration validation and
pluripotency characterization. (A) Design of the DNA construct used for homologous
recombination to generate cells containing Channelrhodopsin tdTomato (ChR) at the Rosa26
locus. (B) Comparison of the morphology of stem cell colonies between HBG3- and ChR-
HBG3-ESC. Scale bar: 100 µm. (C) Schematic illustrating the southern blot strategy used to
identify the clones that are rightly targeted at the Rosa26 locus. (D) Southern blots using
radiolabeled probes against the Rosa26 promoter demonstrates the presence of a 10.8kb band in
clone HBG3-ChR clone 4-2 suggesting the correct targeting of ChR at one of the Rosa26 allele
(5.8kb band corresponds to the unmodified Rosa26 allele, seen in the wild type cells labeled-
HGB3 parental). Contrastingly, the lack of this band in clone HBG3-Chr-21 suggests that
targeting of the ChR gene did not occur at the Rosa26 locus. (E) Relative gene expression
analyses using reverse transcription quantitative PCR for five pluripotency markers (Pou5f1,
Nanog, Sox2, Kl4 and Esrrb) in the unmodified and recombined HGB3 cell lines. Unlike found
in clone 21, the presence of the transgene in clone 4-2 has a minimal effect on the levels of
expression of these markers. * p<0.05, ** p<0.005, *** p<0.0005, **** p<0.0001 (analysis of
variance with respect to the control HBG3).
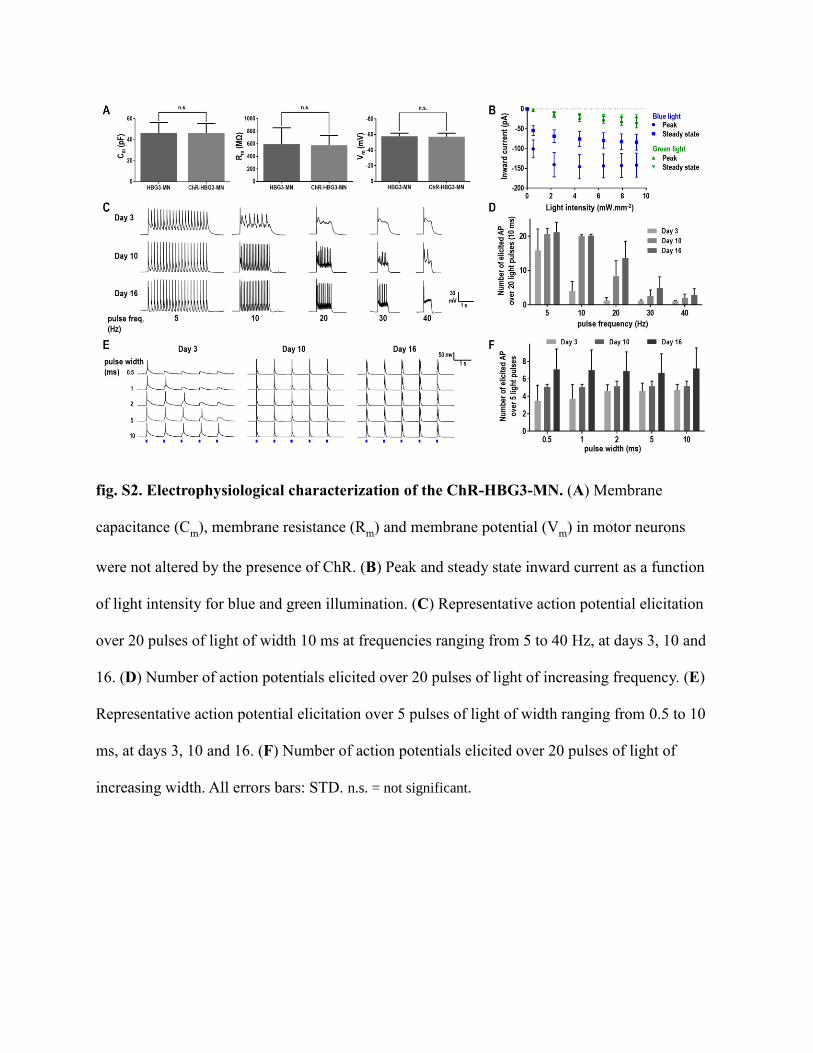
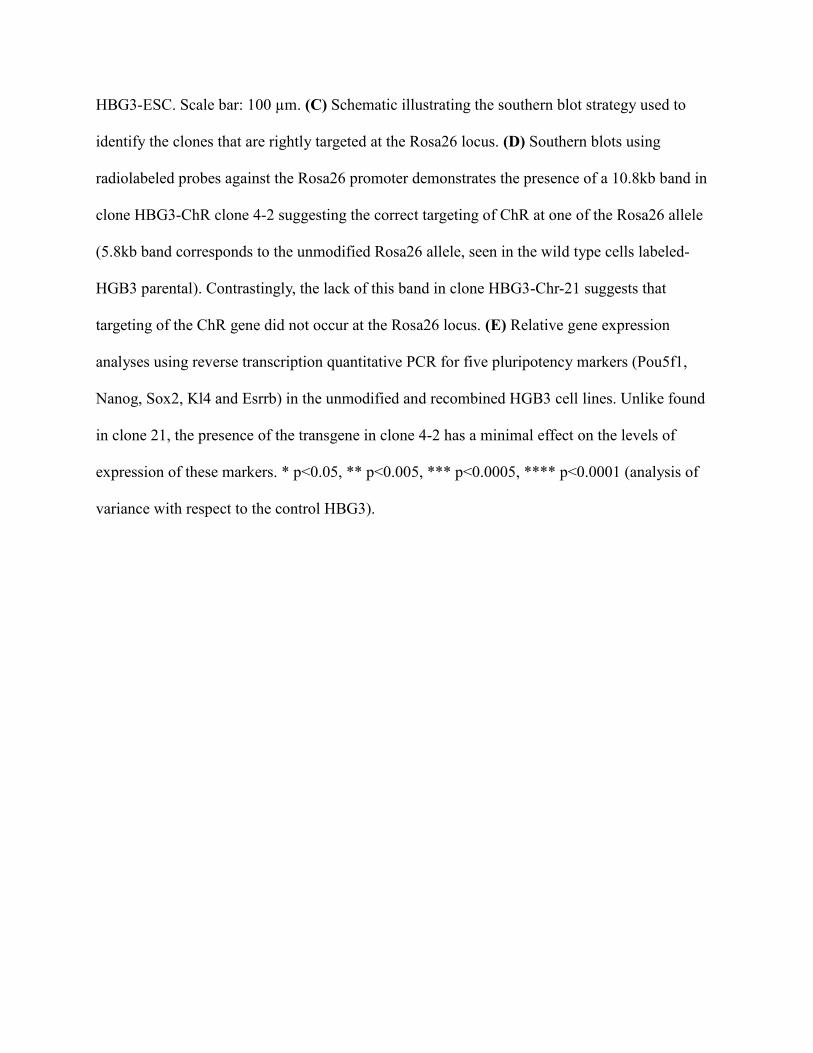
fig. S2. Electrophysiological characterization of the ChR-HBG3-MN. (A) Membrane
capacitance (Cm), membrane resistance (Rm) and membrane potential (Vm) in motor neurons
were not altered by the presence of ChR. (B) Peak and steady state inward current as a function
of light intensity for blue and green illumination. (C) Representative action potential elicitation
over 20 pulses of light of width 10 ms at frequencies ranging from 5 to 40 Hz, at days 3, 10 and
16. (D) Number of action potentials elicited over 20 pulses of light of increasing frequency. (E)
Representative action potential elicitation over 5 pulses of light of width ranging from 0.5 to 10
ms, at days 3, 10 and 16. (F) Number of action potentials elicited over 20 pulses of light of
increasing width. All errors bars: STD. n.s. = not significant.

fig. S3. Optogenetic activation of NMJs in adherent cocultures. (A) Representative data
illustrating the synchronization between the tracking of muscle contraction (black curve, left Y-
axis) and the optical stimulation depicted as the average pixel intensity of the gray scale image
(blue curve, right Y-axis). The blue bars represent the period of time during which the light is
“on”, namely above the resting background pixel intensity. (B) Example of an optogenetic
neuronal stimulation of a muscle cell before and after BTX treatment. The presence of a
spontaneous twitch indicate that the myofiber was still contractile after BTX application and that
the absence of contraction upon illumination is only due to NMJ inhibition.
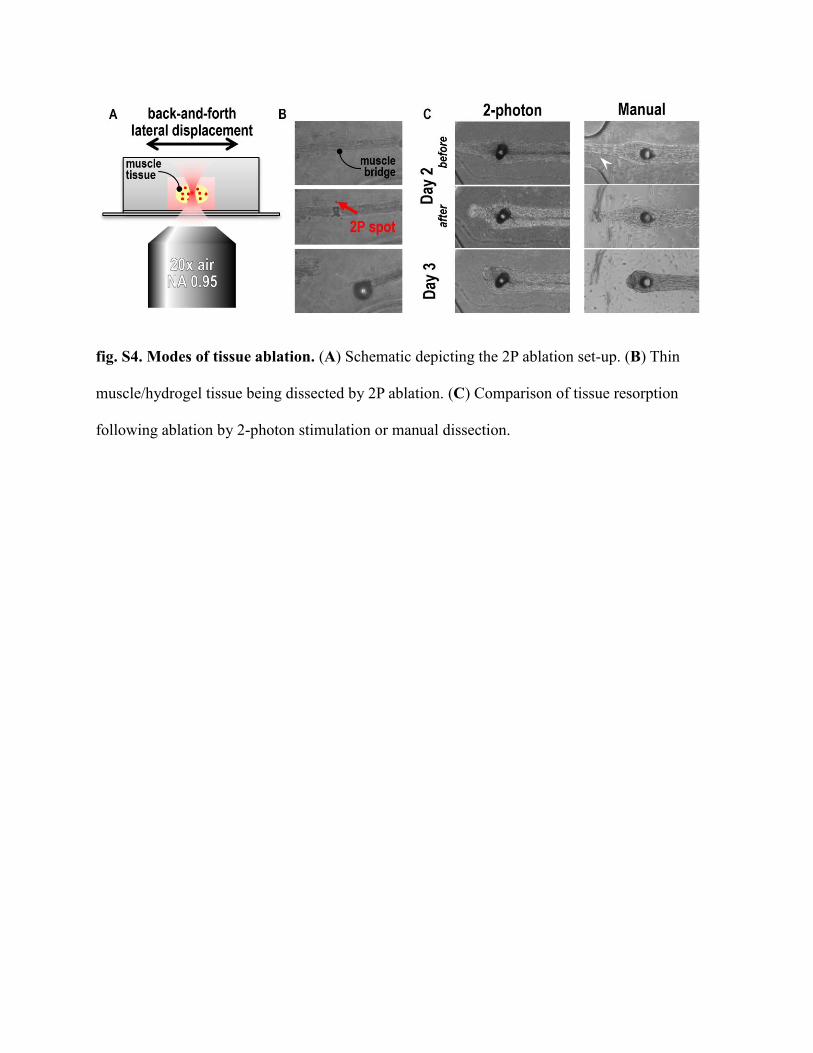
fig. S4. Modes of tissue ablation. (A) Schematic depicting the 2P ablation set-up. (B) Thin
muscle/hydrogel tissue being dissected by 2P ablation. (C) Comparison of tissue resorption
following ablation by 2-photon stimulation or manual dissection.
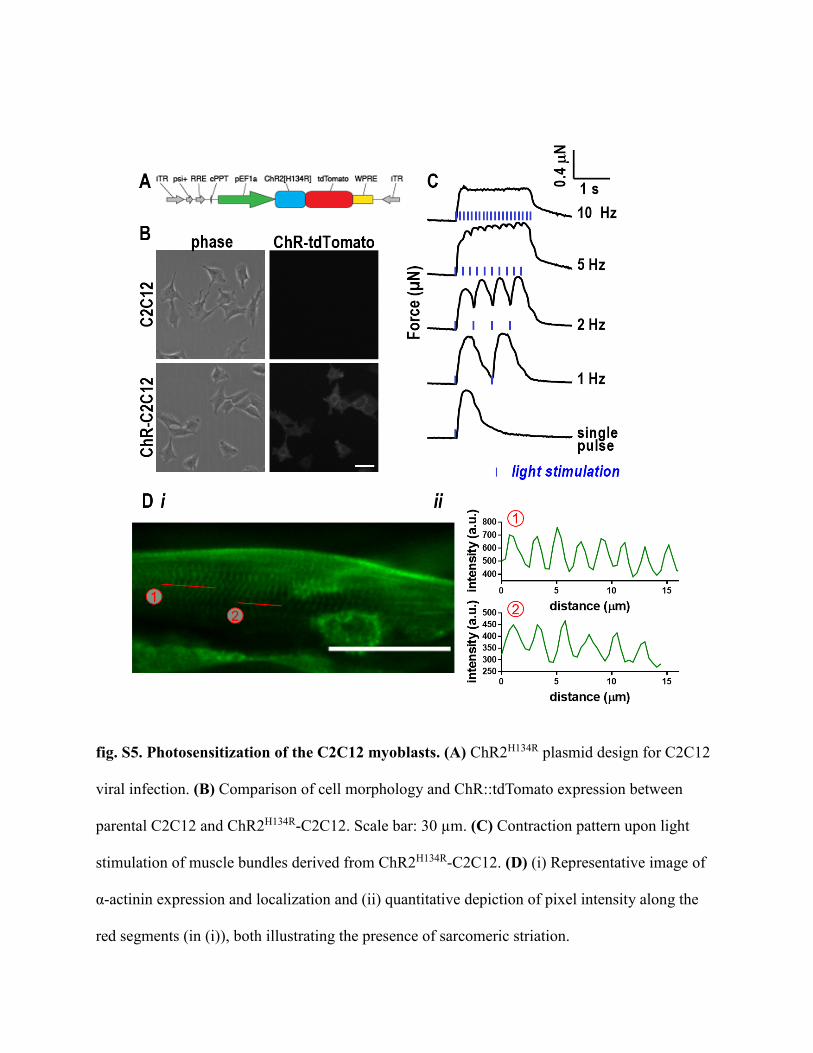
fig. S5. Photosensitization of the C2C12 myoblasts. (A) ChR2H134R plasmid design for C2C12
viral infection. (B) Comparison of cell morphology and ChR::tdTomato expression between
parental C2C12 and ChR2H134R-C2C12. Scale bar: 30 µm. (C) Contraction pattern upon light
stimulation of muscle bundles derived from ChR2H134R-C2C12. (D) (i) Representative image of
α-actinin expression and localization and (ii) quantitative depiction of pixel intensity along the
red segments (in (i)), both illustrating the presence of sarcomeric striation.
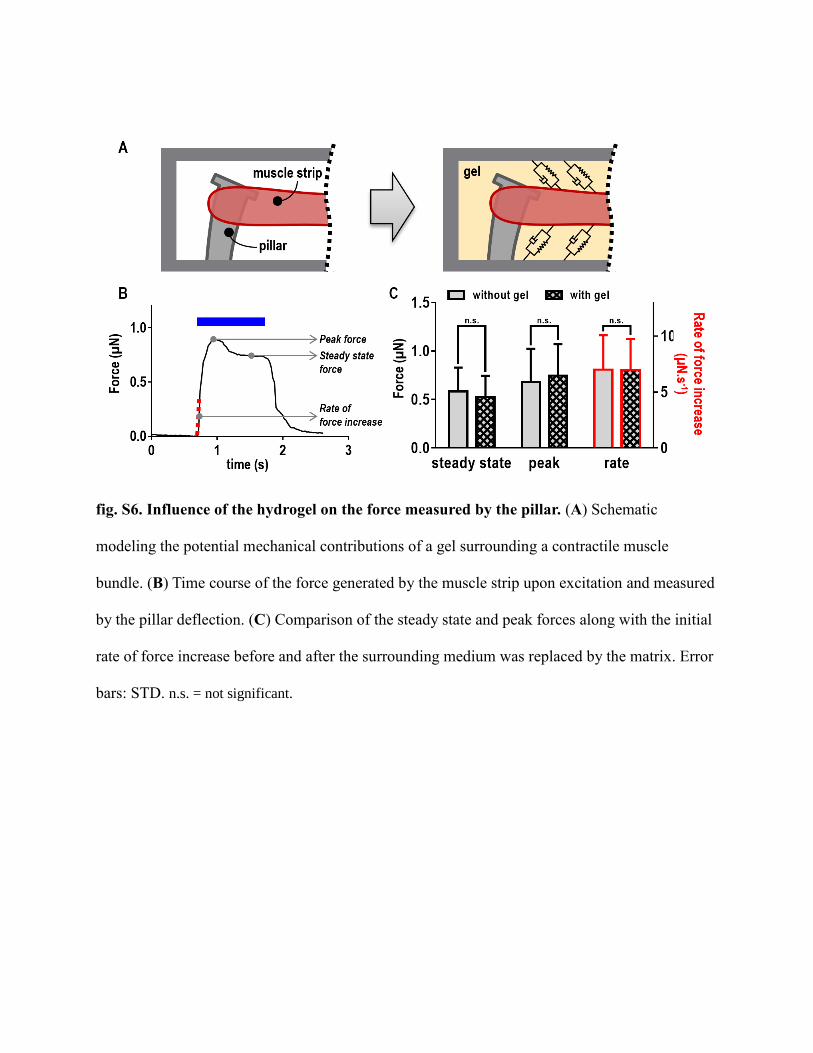
fig. S6. Influence of the hydrogel on the force measured by the pillar. (A) Schematic
modeling the potential mechanical contributions of a gel surrounding a contractile muscle
bundle. (B) Time course of the force generated by the muscle strip upon excitation and measured
by the pillar deflection. (C) Comparison of the steady state and peak forces along with the initial
rate of force increase before and after the surrounding medium was replaced by the matrix. Error
bars: STD. n.s. = not significant.
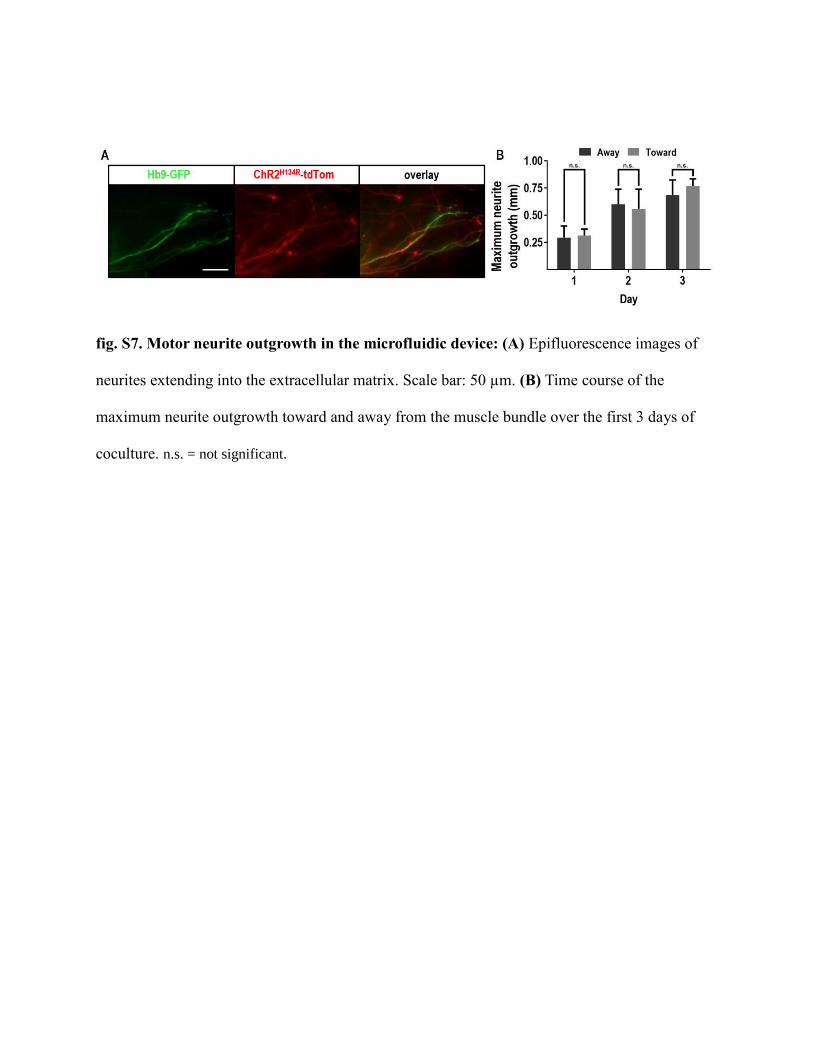
fig. S7. Motor neurite outgrowth in the microfluidic device: (A) Epifluorescence images of
neurites extending into the extracellular matrix. Scale bar: 50 µm. (B) Time course of the
maximum neurite outgrowth toward and away from the muscle bundle over the first 3 days of
coculture. n.s. = not significant.
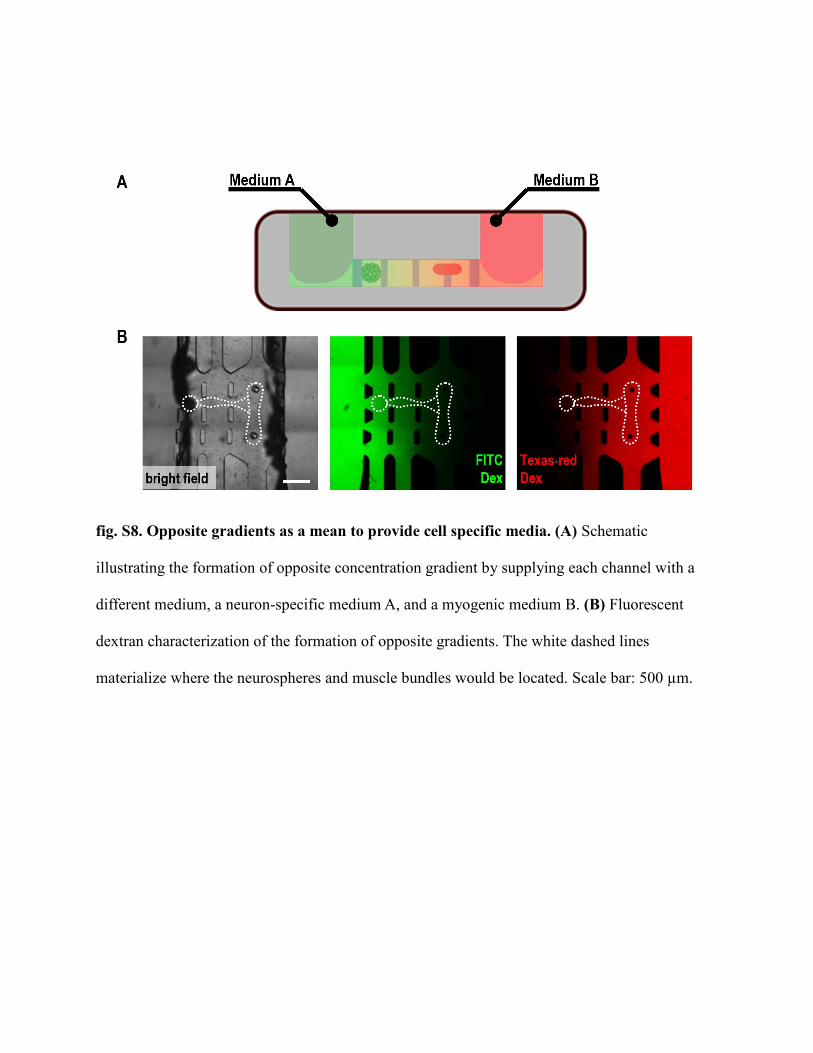
fig. S8. Opposite gradients as a mean to provide cell specific media. (A) Schematic
illustrating the formation of opposite concentration gradient by supplying each channel with a
different medium, a neuron-specific medium A, and a myogenic medium B. (B) Fluorescent
dextran characterization of the formation of opposite gradients. The white dashed lines
materialize where the neurospheres and muscle bundles would be located. Scale bar: 500 µm.
Supplementary Movie Legends
movie S1. Muscle contraction upon optical stimulation of ChR-HBG3-MN in adherent
cultures. C2C12-derived myofiber innervated by light activatable motor neurons contracting
upon blue light excitation (blue frame and bars). The red dots, indicating the positions of the
centers of the regions used for motion tracking, were used to calculate the myotube deformation,
as depicted in the graph on the right.
movie S2. ECM compaction and muscle bundle formation over the first 96 h of the
experiment. C2C12 cells are seeded in the microfluidic device at a density of 5x10⁶ cells.ml-1.
The device is placed in an environmental chamber and images are acquired every 30 min. For
this experiment, the optogenetically modified ChR2H134R-C2C12 cells were used so as to follow
each cell via its fluorescence signal. Scale bar: 500 μm.
movie S3. 3D neurite outgrowth in the gel region bridging the neurosphere and the muscle
strip. Confocal reconstruction of the 3D outgrowth of motor neurites (in green) towards the
muscle bundle (in red).
movie S4. Muscle bundle contraction upon light simulation of the ChR-HBG3-MN in the
microfluidic device. Upon illumination of the photosensitized motor neurons located in the
leftmost region of the device (not shown on the movie frame), innervated muscle cells contract,
causing deflection of the flexible pillar to which the muscle strip is anchored. Scale bar: 200 μm.