supplementary information molecular characterization of...
TRANSCRIPT

1
Supplementary Information Molecular Characterization of Neuroendocrine Prostate Cancer and Identification of New Drug Targets Himisha Beltran1*, David S. Rickman2*, Kyung Park2, Sung Suk Chae2, Andrea Sboner4, Theresa Y. MacDonald2, Yuwei Wang5, Karen L. Sheikh2, Stéphane Terry2, Scott T Tagawa1,3, Rajiv Dhir6, Joel B. Nelson7, Alexandre de la Taille8, Yves Allory8, Mark B. Gerstein3,9,10, Sven Perner11, Kenneth J. Pienta12,13, Arul M. Chinnaiyan13, 14, Yuzhuo Wang5, Colin C. Collins5, Martin E. Gleave5, Francesca Demichelis2,15, David M. Nanus1,3, Mark A. Rubin2,3 1 Department of Medicine, Weill Cornell Medical College, New York, New York, 10065, USA 2 Department of Pathology and Laboratory Medicine, Weill Cornell Medical College, New York, New York, 10065, USA 3 Weill Cornell Cancer Center, New York, New York, 10065, USA 4 Department of Molecular Biophysics & Biochemistry, Yale University, New Haven, Connecticut, 06520, USA 5 Department of Urological Sciences and Vancouver Prostate Centre. University of British Columbia, Vancouver, BC. V6H 3Z6, Canada. 6Department of Pathology, University of Pittsburgh School of Medicine, Pittsburgh, Pennsylvania 15232, USA 7 Department of Urology, University of Pittsburgh School of Medicine, Pittsburgh, Pennsylvania 15232, USA 8 INSERM, U955, Equipe 07, AP-HP, Hôpital Henri Mondor, Creteil, 94000, France. INSERM U955Eq07 Chu Mondor Assistance Publique des Hospitaux de Paris, Creteil, France. 9 Program in Computational Biology and Bioinformatics, Yale University, New Haven, Connecticut, 06520, USA
10 Department of Computer Science, Yale University, New Haven, Connecticut, 06520, USA 11 Institute of Pathology, Center for Integrated Oncology, University Hospital of Bonn, Bonn, Germany
12Department of Medicine, University of Michigan, Ann Arbor, Michigan, 48109, USA 13Michigan Center for Translational Pathology, University of Michigan, Ann Arbor, Michigan, 48109, USA 14Howard Hughes Medical Institute, Chevy Chase, MD, 20815, USA 15Institute for Computational Biomedicine, Weill Cornell Medical College, New York, New York, 10021, USA * These Authors Contributed Equally

2
Supplementary Information Index Supplementary Figure 1: Histology of NEPC and mixed NEPC and PCA ..................................3 Supplementary Table 1: Clinical Demographics NEPC ...............................................................4 Supplementary Table 2: Clinical Demographics PCA .................................................................4 Supplementary Table 3: Overexpressed genes: NEPC vs PCA (Attached) ..................................5 Supplementary Figure 2: AURKA Amplification in NEPC .........................................................5 Supplementary Figure 3: AURKA Overexpression and Relation to Copy Number Gain ...........6 Supplementary Figure 4: AURKA and MYCN Co-Amplification ..............................................7 Supplementary Figure 5: N-myc ChIP of LNCaP-MYCN and IMR-32 ......................................7 Supplementary Figure 6: Knockdown of AURKA with siRNA ...................................................8 Supplementary Figure 7: RNA-Seq of cell lines and FISH NCI-H660 ........................................9 Supplementary Figure 8: Viability of NCI-H660 after shRNA AURKA ...................................10 Supplementary Figure 9: FACs analysis following PHA-739358 treatment. .............................11 Supplementary Figure 10: H&E and SYP IHC of LNCaP and VCaP xenografts ......................11 Supplementary Figure 11: H&E, ERG IHC and FISH of NCI-H660 and VCaP xenografts .....12 Supplementary Figure 12: Tumor size after PHA-739358 in VCaP and NCI-H660 ..................13 Supplementary Figure 13: Tumor sizes and body weights after PHA-739358 ..........................14 Supplementary Figure 14: AURKA and MYCN association with clinical features of PCA .....15 Supplementary Figure 15: Primer sets that target E-boxes mapped to the promoter regions ....15 Supplementary Methods ....................................................................................................... 16-23 References .....................................................................................................................................24

3
Supplementary Figure 1. Core biopsy (A) with NEPC (upper half) mixed with conventional
acinar PCA (bottom). At higher magnification (B), tumor cells have hyperchromatic nuclei and
nuclear molding, characteristic features of NEPC. (20x and 40x). Section of prostatectomy
specimen (C) with a NEPC (right) invading into the seminal vesicle (left), and (D) at higher
magnification 40x.

4
Supplementary Table 1. Clinical Features of frozen NEPC tumors (n=7) that were sequenced
by RNA-Seq using Illumina Genome Analyzer II.
Supplementary Table 2. Clinical Features of frozen PCA tumors (n=30) that were sequenced
by RNA-Seq using Illumina Genome Analyzer II.
STID # Age at Dx Gleason
Score T Stage Serum PSA
ErgRearrang
FISH
T2-ERG RT-PCR
Total ReadsMapped Reads
097_T 63 5 2c 19.9 NEG NEG 40296258 161721742621 51 7 2c 5 POS NEG 22079700 118999852682 71 7 2c 7.6 NEG NEG 24506581 11832466
2741_B 73 9 3a 5 NEG NEG 21398780 109845192743_D 65 7 2c 8.1 POS POS 42715472 21561194
3035_B53 34 7 2c 4.2 POS POS 24137156 118359682525_A 46 7 2c 4.67 POS NEG 41159746 224565062620_D 69 6 2c 9 POS NEG 57263072 306388282832_B 66 7 2c 6.6 POS POS 100695745 53150521
3023_B62 67 8 2c 5 NEG NEG 49936734 285216183027_B57 66 8 3b 10.2 NEG NEG 52824859 282720893034_C51 70 7 2c 14.6 NEG NEG 24584010 137753183042_H51 67 7 2c 3.3 NEG NEG 26442544 140989383043_B56 69 7 2c 7.2 NEG NEG 24704009 129627383051_B51 60 7 2c 20 NEG NEG 22109737 126546983071_B51 55 7 3a 3 NEG NEG 53957766 250730543085_B57 68 7 3a 4.9 NEG NEG 53804736 188035873134_B58 64 7 2c 5.5 NEG NEG 26092816 13883568
2740_A 58 7 2c 2.8 NEG NEG 39198207 159743092858_C 52 7 3a 5.3 POS POS 38444691 19052852
3026_B56 56 8 3b 24.2 NEG NEG 37242885 189641352761_D 56 7 2c 4.3 NEG NEG 42309407 21943354
3048_B50 64 7 2c 3.5 NEG NEG 44193276 233305602849_D 52 7 2c 6.1 NEG NEG 50794664 214932602844_D 64 7 2a 5.4 NEG NEG 45657613 218389452872_D 62 7 3a 6 POS POS 42552504 18618017
3050_B51 50 7 2c 1.7 POS POS 43014556 248141033132_B51 52 7 2c 4.5 NEG NEG 43706638 25609328
2660_B 58 7 3a 5 POS NEG 25141860 114866581783_B 66 8 2c 9.8 NEG NEG 68297519 30883518
Clinical Features frozen NEPC (n=7)
STID #Age at
Diagnosis Tissue Histology
Primary or Secondary
PSA IHC SYP IHC CgA IHCSerum PSA
(ng/mL)Serum CgA
(ng/mL)TMPRSS2-ERG
FusionOverall Survival
Total Reads
Mapped Reads
4240 74 Met Mixed Primary NEG POS POS 1.93 103 NEG 13 mo 1.25E+08 64860618
7520 56 Met Mixed Secondary NEG POS NEG 0.06 POS Alive 71872928 403780927820 --- Met NEPC Primary NEG POS NEG NEG 9 mo 69879907 376903968740 59 Met Mixed Secondary NEG POS NEG 48.5 2028 NEG 3 mo 65420885 328247477800 48 Prostate NEPC Primary NEG POS NEG 3.9 69 NEG 5 mo 64512728 383855777821 --- Met NEPC Primary NEG POS POS NEG 9 mo 66451843 407212968220 --- Xenograft NEPC Primary NEG POS NEG NEG --- 67582717 33309138
5
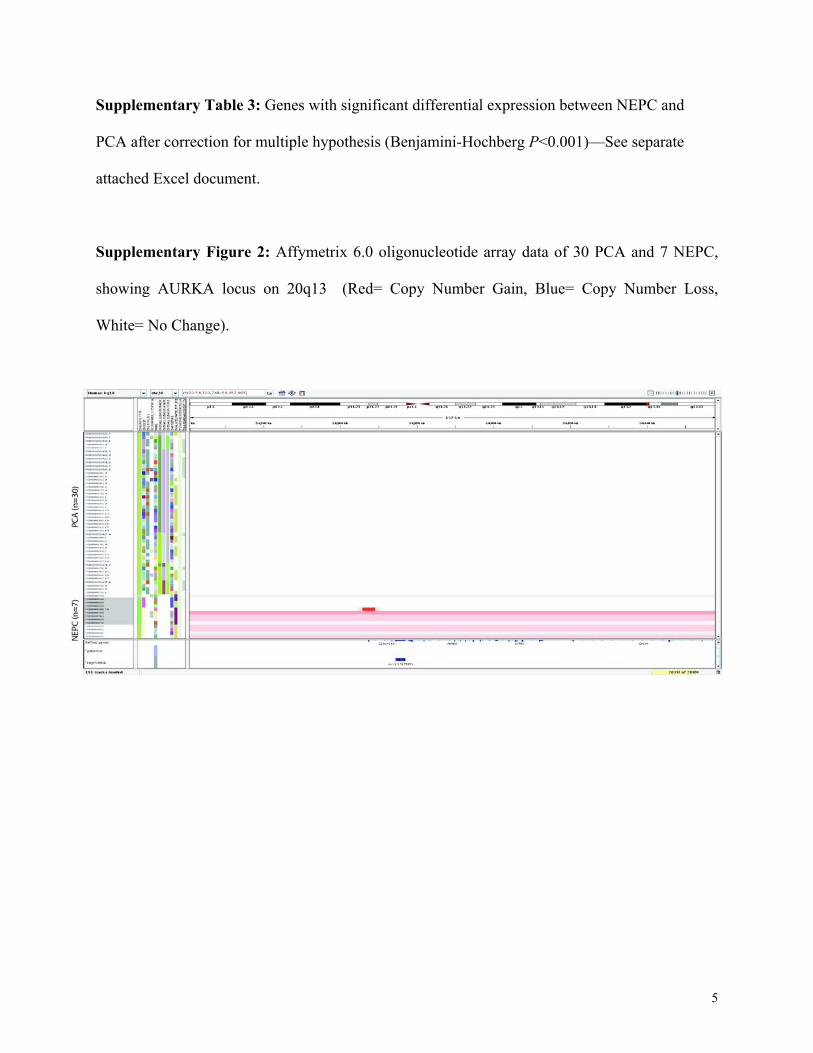
Supplementary Table 3: Genes with significant differential expression between NEPC and
PCA after correction for multiple hypothesis (Benjamini-Hochberg P<0.001)—See separate
attached Excel document.
Supplementary Figure 2: Affymetrix 6.0 oligonucleotide array data of 30 PCA and 7 NEPC,
showing AURKA locus on 20q13 (Red= Copy Number Gain, Blue= Copy Number Loss,
White= No Change).

6
Supplementary Figure 3: (A) mRNA expression of AURKA in Benign Prostate Tissue, PCA,
and NEPC, as measured by RNA-Seq, annotated below for cases harboring AURKA gene
amplification. (B) The levels of AURKA, B and C mRNAs as measured by real-time quantified
RT-PCR of 6 out of the 7 NEPC tissue samples (1 NEPC sample had mixed NEPC/PCA
phenotype and so was not included) relative to 7 PCA samples.

7
Supplementary Figure 4: FISH data for AURKA and MYCN copy number gain in 22 Benign
Prostate Tissue, 169 PCA, and 37 NEPC, showing concordance of AURKA and MYCN
amplification in >90% of cases.
Supplementary Figure 5: Chromatin immunoprecipation (ChIP) of LNCaP cells stably
transfected with MYCN and IMR-32 (MYCN amplified neuroblastoma cells). N-myc binds E-
box binding elements associated with the N-myc-responsive promoter of telomerase reverse
transcriptase (hTERT), but does not bind the E-box sites of AURKA promoter (grey and black
circles). ChIP performed with either anti-N-Myc or anti-IgG antibodies. The AURKA
transcription start site is indicated with an arrow.

8
Supplementary Figure 6: Quantitative PCR after siRNA transfection of AURKA or control
nonsilencing siRNA (Scr) in NCI-H660 cells. This confirms effective knockdown of AURKA
mRNA expression after siRNA transfection, and resultant decrease in the neuroendocrine
marker, neuron-specific enolase (NSE), expression following siRNA AURKA transfection.

9
Supplementary Figure 7: (A) RNA-Seq of benign prostate epithelial cell line (RWPE), 4 PCA
cell lines (LNCaP, VCaP, PC3, 22Rv1), and the NEPC cell line (NCI-H660). (B) FISH on NCI-
H660 cell line showing gene amplification of AURKA and MYCN (Green= Centromeric Control
Probes, Red = AURKA or MYCN loci). C. Western blot analysis of Aurora A, B, and C as well
as phosphorylated forms of Aurora A, B, C levels in the different cell lines. GAPDH levels were
assayed as a control for protein loading.

10
Supplementary Figure 8. Levels of AURKA mRNA in (A) and viability of (B) NCI-H660
cells following infection with different lentiviruses harboring short hairpins (sh) targeting either
GFP (control) or AURKA mRNA (for this 2 independent shAURKA were used). Viability was
assessed at the indicated time points following infection. mRNA levels were assessed at day 2
following infection.

11
Supplementary Figure 9. FACs analysis of the indicated cells following 48 hours of PHA-
739358 treatment.
Supplementary Figure 10. H&E photomicrographs and Synaptophysin IHC analysis of LNCaP
and VCaP xenografts (40x).

12
Supplementary Figure 11: H&E of NCI-H660 and VCaP xenografts. Both are ERG fusion
positive by FISH break-apart assay (inset). ERG protein expression is positive in VCaP and
negative in NCI-H660 tumor (expression limited to endothelial cells, known to express ERG).

13
Supplementary Figure 12: (A) Tumor size after treatment of VCaP (gray) and NCI-H660 (red)
xenografts with vehicle (dotted lines) or PHA-739358 30 mg/kg IP BID (solid lines) for 5 days.
(B) Luciferase imaging at day 8 and tumor photographs at day 17 of representative tumors
following treatment with either vehicle or PHA-739358.

14
Supplementary Figure 13: Table summarizing tumor sizes and weight at day 17 of
LNCaP,VCaP, NCI-H660 xenograft studies. P values were calculated using a Student’s t test.
Below is summary of tumor sizes of LTL-352 study and graphical representation of body weight
changes.

15
Supplementary Figure 14: Table summarizing association between AURKA and MYCN gene
expression in PCA and prognostic factors
Supplementary Figure 15: Primer sets that target E-boxes mapped to the promoter regions

16
Supplementary Methods
A. RNA-Sequencing (RNA-Seq). RNA was prepared for RNA-Seq using the Illumina
Genome Analyzer II as detailed in the manufacturers instructions. mRNA was isolated from
frozen tissue using Trizol (Invitrogen, Carlsbad, CA). Total RNA was prepared in accordance
with Illumina’s sample preparation protocol for paired end (PE) sequencing of mRNA unless
described otherwise. In brief, 5-10 ug of total RNA was fragmented by heat during 2.5 minutes,
reverse transcribed and transformed to double stranded cDNA by reverse transcription using
Superscript 2 Double-Stranded cDNA Synthesis kit (Invitrogen, USA) and random hexamer
primers (Invitrogen). We also integrated the use of T4 ligase (Enzymatics Inc., Beverly, MA) to
improve the efficiency of adapter ligation. The gel dissolutions of all gel-based purification steps
were conducted at room temperature under slight agitation as described by Quail et al(1). After
the enrichment of cDNA template by PCR, the concentrations and the sizes of the libraries were
measured using DNA 1000 Kit (Agilent Technologies, Santa Clara, CA) on Agilent 2100
Bioanalyzer respectively. PE RNA-Seq was performed with the Genome Analyzer II (Illumina,
San Diego, CA) generating PE reads of 54 bp. PE reads were then processed and mapped to the
reference human genome (hg18) using ELAND alignment software. Gene expression was
quantified by using RSEQtools (2). Briefly, reads mapped on exonic regions were considered to
computed gene expression via RPKM (reads per kilobase of exonic region per million reads) (3).
We employed the UCSC known Gene annotation set as gene model reference. To account for
multiple transcripts, we defined the composite model, i.e. the union of all exonic nucleotides.
B. Affymetrix Genome-Wide Human SNP Array 6.0. High quality DNA was extracted from

17
tumor tissue as well as peripheral blood mononuclear cells (when available), using the Qiagen
DNA extraction kit per manufacturers instructions. DNA quality and quantity were evaluated by
electrophoresis and Nanodrop (NanoDrop Technologies, Wilmington, DE) spectrophotometer.
The 6.0 SNP arrays were run at the Cornell University Microarray Core facility in Ithaca, NY
and assessed for focal and broad areas of genomic gain and loss per sample and across samples.
C. Immunohistochemistry (IHC). Formalin fixed paraffin embedded (FFPE) tissue sections
were de-paraffinized and endogenous peroxidase was inactivated. Antigen retrieval was
accomplished by heat/pressure cook for 10 minutes (Aurora-A), and using the Bond Epitope
Retrieval Solution 1 (ER1) at 99-100°C for 30 minutes (Leica Microsystems) for the other three
antibodies. Following retrieval, the sections were incubated sequentially with the primary
antibody for 25 minutes, post-primary for 15 minutes and polymer for 25 minutes ending with
colorimetric development with diaminobenzidine (DAB) for 10 minutes (Bond Polymer Refine
Detection; Leica Microsystems). Antibodies used were: Abcam ab13824, dilution 1:800 (Aurora
kinase A), Abcam ab14955, dilution 1:2000 (Histone H3 phospho S10), Epitomics 28051,
dilution 1:100 (ERG). IHC was quantified on scale 0-3 and overexpression was defined as any
staining intensity seen of target cells above background (similar methodology as was used in
Park et al, Neoplasia 2010 (4)).
D. Fluorescent In Situ Hybridization (FISH). Interphase nuclei were evaluated for AURKA
or MYCN amplification and ERG rearrangement using the following BAC clones: AURKA
(RP11-158017), MYCN (RP11-635A14), ERG (RP11-24A11 (red) and RP11-372017 (green)).
Reference probe used when assessing AURKA and MYCN was located at 10q25 and was BAC

18
RP11431P18, spanning a stable region of the chromosome. AURKA and MYCN were evaluated
using Flourescence microscope (Olympus BX51). Amplification was defined as the presence 3
to 4 copies on average for gene-specific (i.e. AURKA or N-MYC) signals per nuclei compared
to two reference signals. At least 100 nuclei were evaluated per core/tissue section. ERG
rearrangement was assessed using dual-color break-apart interphase FISH assay as described
previously(5-6), which involves labeling two probes that span the telomeric and centromeric
neighboring regions of the ERG locus. A nucleus that lacks ERG rearrangement demonstrates
two pairs of juxtaposed red and green signals (which can form yellow signals). A nucleus with
ERG rearrangement shows either split of one red-green (yellow) signal pair (indicating
rearrangement through insertion), or one single red signal for the rearranged allele (indicating
rearrangement through deletion). Note, frozen cases or unevaluable cases were evaluated for
TMPRSS2-ERG gene fusion using reverse transcriptase PCR to screen for fusion transcript
expression (as described in Tomlins et al. 2005)(5).
E. Transfection. Transient transfections of Aurora kinase A and N-myc were performed using
Lipofectamine 2000 (Invitrogen) according to the manufacturers instructions (plasmids kindly
provided by Dr Steffi Herold, Theodor-Boveri-Institute, Biocenter. Am Hubland). siRNA
transfection was performed using 60nM AURKA siRNA (ON-TARGETplus SMARTpool L-
003545-01-0005, Human AURKA, NM_198437; Thermo Scientific, Waltham, MA) or 100 nM
control nonsilencing siRNA (ON-TARGETplus Non-targeting Pool D-001810; Thermo
Scientific, Waltham, MA). siRNA was introduced into cells using Mirus TransIT-TKO
transfection reagent were performed following the manufacturer’s protocol. Briefly 105 NCI-
H660 cells were seeded in 12-wells in 1mL medium and transfected with siRNA targeting
19
AURKA mRNA or scrambled siRNA as a negative control. Following 48 hours RNA was
extracted and quantitative RT-PCR was performed. All experiments were performed in
duplicate. We used the pBABE vector (kind gift of Dr. William Hahn at the Broad Institute and
the Dana Farber Cancer Center) to generate stable LNCaP cells expressing N-myc. The
retroviral construct was transfected into 293FT cells with Lipofectamine 2000 (Invitrogen,
Carlsbad, CA) according to the manufacturer’s instructions. The virus was harvested 72 hours
later and used to infect LNCaP cells. Selection was carried out with 1 ug/mL Puromycin. For
virus-induced knock-down of AURKA mRNA in NCI-H660 cells, , pLKO.1 vectors containing
short hairpin(sh) Aurora A were purchased from Openbiosystems and viral particles were
packaged by co-transfecting HEK 293 FT cells with pLKO.1-sh-Aurora A, delta 8.9 and VSV-G
plasmids. Viral supernatant was collected, filtered through 0.45μl filter and concentrated using
Lenti-X-Concentrator (Clontech). NCI-H660 cells were plated in 6 well plates and transduced
with lentivirus containing sh-Aurora A or GFP.
F. Quantitative PCR. Quantitative PCR was performed using SYBR Green dye on Applied
Biosystems 7500 Real Time PCR system (Applied Biosystems, Foster City, CA). The primer
sequences for AURKA were GCCCTGTCTTACTGTCATTCG (forward) and
AGAGAGTGGTCCTCCTGGAAG (reverse). Primers for MYCN were
CTGGGAACTGTGTTGGAG (forward) and CGACTGAGGGCTTCTTTC (reverse). Primers
for NSE were CTGGCTAAATACAACCAGCTCA (forward) and
CACAGCACACTGGGATTACG (reverse). All primers were designed using Beacon Designer
and purchased from Invitrogen.

20
G. Immunoblot Analysis. Protein lysates were prepared in the RIPA buffer
(radioimmunoprecipitation assay lysis buffer) supplemented with protease inhibitor cocktail and
phosphatase inhibitors (Thermo Scientific, Waltham, MA). The total protein concentration of the
soluble extract was determined using the BCA protein assay Kit (Thermo Scientific). Each
protein sample (30ug) was resolved to SDS–PAGE, transferred onto a polyvinylidene difluoride
membrane (Millipore) and incubated overnight at 4°C with primary antibodies. The antibodies
used were: Abcam ab1287 (Aurora kinase A), Santa Cruz sc53993 (B8.4.B,N-Myc), Upstate
biotechnology 05-806 (histone H3 phospho S10), Cell Signaling 4329 (synaptophysin), Millipore
MAB324 (NSE), Cell Signaling #2914S (phospho-Aurora A (Thr288)/Aurora B
(Thr232)/Aurora C (Thr198)), Epitomics, #1805-1 (Aurora-C), Abcam, #ab2254 (Aurora-B) and
Epitomics, #2251-1 (GAPDH). Following three washes with TBS-T, the blot was incubated with
horseradish peroxidase-conjugated secondary antibody and immune complexes were visualized
by enhanced chemiluminescence detection (ECL plus kit, GE Healthcare, UK). The blot was
reprobed with monoclonal antibody against beta-actin (Sigma). Total protein was extracted and
separated by gel electrophoresis. Protein was then transferred to nitrocellulose membranes and
probed overnight using the appropriate primary antibodies.
H. Co-immunopreciptiation. Cell lysates were prepared by lysing cells in buffer containing 50
mM Tris (pH 7.5), 120 mM NaCl, 0.5% NP-40, 5 mM EDTA and protease and phosphatase
inhibitors (Thermo Scientific), followed by sonication. 500 ug of total protein extract was
incubated with 1 ug of anti N-Myc or control IgG overnight. Antigen-antibody complexes were
pulled down using Protein A conjugated agarose bead (Roche Applied Science) and washed 5
times using lysis buffer.

21
I. Protein Stability. Cells were treated with 50 ug of cycloheximide (Sigma-Aldrich) for
indicated times and lysed in 50 mM Tris (pH 8.0), 150 mM NaCl, 1% NP-40 and protease
inhibitors. Proteins were separated in SDS-PAGE, transferred to PVDF membrane and blotted
with anti N-Myc (1:1,000, Santa Cruz Biotechnology) or anti Aurora A(1:1,000, Cell Signaling).
Protein loading was determined by stripping blotted membrane using Restore PLUS buffer
(Thermo Scientific) and blotting with anti alpha-Tubulin antibodies (1:5,000,
Epitomics). Normalized percent of Aurora kinase A was calculated from the immunoblot by
dividing the intensity of each Aurora A band by that of beta-tubulin and then dividing this ratio
from that calculated for 0 time point. ). Bands were quantified using Versadoc Imaging System
(BioRad) and QuantityOne (BioRad) software.
J. Chromatin Immunoprecipitation
For the ChIP assays we followed the procedure from a previous publication (7). Briefly, we used
MatInspector (version 8.0; Genomatix Software GmbH, Munich) (8) to identify N-myc binding
sites in the promoter regions of NSE (864 base pairs) and SYP (721 base pairs) and AR (760
base pairs) of genomic sequence near the respective transcription start sites in silico. Briefly, 50
x106 LNCaP_nMyc or LNCaP_EV (empty vector control) cells were washed in PBS twice and
then fixed using 1% formaldehyde for 10 minutes at room temperature and quenched using 125
mM glycine. The cells were centrifuged and the cell pellet was resuspended in 2 milliliters of
dilution buffer (165mM NaCl, 0.01% SDS. 1.1% Triton X-100, 1.2mM EDTA pH 8.0, 16.7mM
Tris HCl pH8.0, 1mM PMSF). Protein-bound chromatin was fragmented by sonication for 10
minutes (cycles of 30 seconds pulses of sonication followed by 30 seconds of rest). Equal

22
volumes of chromatin were immunoprecipitated with either mouse anti-N-Myc (Santa Cruz
sc53993 (B8.4.B,N-Myc) or mouse IgG (Santa Cruz sc2025) as a negative control. Following
extensive washing the DNA was eluted using 100 mM NaHCO3 and 1% SDS and the crosslinks
were reversed using 300 mM NaCl at 65°C for 16 hours. The eluted DNA was purified using
Qiagen PCR Qiaquick kit following manufacturer’s protocol. For qPCR amplification we used
the ABI 7500fast system and the relative standard curve method in a 96-well format. For this,
we designed primer sets that target each of the E-boxes mapped to the promoter regions
(Supplementary Fig.15). Two microliters of either eluted DNA or a 1:10 dilution of the input
chromatin preparation from each cell line was assayed in order to calculate the percentage of
enrichment. Primers targeting a copy number stable chromosomal region in ARHGEF11
(chr1:155205397-155205600, hg18) were used as a negative control as previously described (9).
Input DNA was also analyzed at 5 concentrations (0.004 ng – 40ng) to generate the standard
curve per primer pair and per 96-well plate. All reactions were run in triplicates.
K. Cell Cycle analysis
Cells were treated with PHA-739358 for 48 hrs. After treatment, cells were washed with cold
PBS and fixed in 70% EtOH at -20oC overnight. Cells were washed and suspended in 500 μl
PBS containing 0.1% Triton X-100, 20 μg/ml Propidium Iodide (PI) and 200 μg/ml RNase A,
incubated for 30 min at room temperature and subjected to FACS analysis using a LSR II
Analyzer (BD Biosciences).
L. Xenografts. 1 million NCI-H660 cells, VCaP cells, or LNCaP cells were injected into
NU/J mice (Jackson Laboratories, Bar Harbor, Maine). LTL-362 xenografts were established

23
at BC Cancer Center Living Tumor Laboratory as previously described(10), and 3x3x2 mm2
tissue fragments were subcutaneously engrafted into fourteen 6-8 week old NOD/SCID mice.
Three different studies were performed comparing the effect of PHA-739358 on tumor growth
of NCI-H660 and LNCaP xenograft tumors (study 1), NCI-H660 and VCaP xenografts (study
2), and LT-362 xenografts (study 3). Study 3 was conducted at University of British
Columbia BC Cancer Center. Tumors were allowed to grow to an average tumor weight of
100 mm3. For each study 14-20 mice bearing tumors from each cell type were randomized to
treatment with PHA-739358 (Nerviano Medical Sciences, Milan, Italy) at 30 mg/kg
intraperitoneal dosing on days 1-5 or vehicle. Body weight, tumor volume based on caliper
measurements (0.5236 x length x width) and luciferase imaging were performed every 3 or 4
days after treatment. Mice were sacrificed on day 17, and tumors were evaluated for weight,
gross pathology, histology, and IHC. 3 tumors were processed during treatment (on day 4) to
evaluate for phosphorylated histone 3 expression by IHC. In order to image viable tumor cells
optimize tumor volume measurements we injected VCaP with retrovirus particles containing
the sgfn-TGL triple reporter vector as previously described(11). LNCaP and NCI-H660 cells
were engineered to express luciferase using a transposable element vector (kind gift from John
Ohlfest, University of Minnesota Medical School, Minneapolis, MN) as described
previously(12). On the day of imaging, we injected (intraperitoneal) 100-microliters of D-
Luciferin (75mg/kg) into anesthetized mice. Ten minutes later the mice animals were placed
on their ventral side and bioluminescence images were acquired with the IVIS Imaging
System (Xenogen). Analysis was performed using LivingImage software (Xenogen) by
measurement of the average photon flux (measured in photons/s/cm2/steradian) within a
region of interest.

24
References
1. Quail MA, Kozarewa I, Smith F, Scally A, Stephens PJ, Durbin R, et al. A large genome center's improvements to the Illumina sequencing system. Nat Methods. 2008;5:1005-10.
2. Habegger L, Sboner A, Gianoulis TA, Rozowsky J, Agarwal A, Snyder M, et al. RSEQtools: a modular framework to analyze RNA-Seq data using compact, anonymized data summaries. Bioinformatics. 2011;27:281-3.
3. Mortazavi A, Williams BA, McCue K, Schaeffer L, Wold B. Mapping and quantifying mammalian transcriptomes by RNA-Seq. Nat Methods. 2008;5:621-8.
4. Park K, Tomlins SA, Mudaliar KM, Chiu YL, Esgueva R, Mehra R, et al. Antibody-based detection of ERG rearrangement-positive prostate cancer. Neoplasia. 2010;12:590-8.
5. Tomlins SA, Rhodes DR, Perner S, Dhanasekaran SM, Mehra R, Sun XW, et al. Recurrent fusion of TMPRSS2 and ETS transcription factor genes in prostate cancer. Science. 2005;310:644-8.
6. Perner S, Demichelis F, Beroukhim R, Schmidt FH, Mosquera JM, Setlur S, et al. TMPRSS2:ERG fusion-associated deletions provide insight into the heterogeneity of prostate cancer. Cancer Res. 2006;66:8337-41.
7. Rickman DS, Chen YB, Banerjee S, Pan Y, Yu J, Vuong T, et al. ERG cooperates with androgen receptor in regulating trefoil factor 3 in prostate cancer disease progression. Neoplasia. 2010;12:1031-40.
8. Quandt K, Frech K, Karas H, Wingender E, Werner T. MatInd and MatInspector: new fast and versatile tools for detection of consensus matches in nucleotide sequence data. Nucleic Acids Res. 1995;23:4878-84.
9. Rickman DS, Pflueger D, Moss B, VanDoren VE, Chen CX, de la Taille A, et al. SLC45A3-ELK4 is a novel and frequent erythroblast transformation-specific fusion transcript in prostate cancer. Cancer Res. 2009;69:2734-8.
10. Tung WL, Wang Y, Gout PW, Liu DM, Gleave M. Use of irinotecan for treatment of small cell carcinoma of the prostate. Prostate. 2010.
11. Ponomarev V, Doubrovin M, Serganova I, Vider J, Shavrin A, Beresten T, et al. A novel triple-modality reporter gene for whole-body fluorescent, bioluminescent, and nuclear noninvasive imaging. Eur J Nucl Med Mol Imaging. 2004;31:740-51.
12. Wu A, Oh S, Ericson K, Demorest ZL, Vengco I, Gharagozlou S, et al. Transposon-based interferon gamma gene transfer overcomes limitations of episomal plasmid for immunogene therapy of glioblastoma. Cancer Gene Ther. 2007;14:550-60.