supplementary information - media.nature.com · supplementary information microrna-33 regulates...
TRANSCRIPT
Supplementary Information
MicroRNA-33 regulates sterol regulatory element-binding
protein 1 expression in mice
Takahiro Horie, Tomohiro Nishino, Osamu Baba, Yasuhide Kuwabara, Tetsushi
Nakao, Masataka Nishiga, Shunsuke Usami, Masayasu Izuhara, Naoya Sowa,
1Naoya Yahagi, Hitoshi Shimano, Shigenobu Matsumura, Kazuo Inoue, Hiroyuki
Marusawa, Tomoyuki Nakamura, Koji Hasegawa, Noriaki Kume, Masayuki
Yokode, Toru Kita, Takeshi Kimura, and Koh Ono
a
R2=0.9610
bEpi-fat+ Mes-fat weight (g)
Visc
eral
fat w
eigh
tfr
om C
T va
lue
(g)
0 1 2 3 40
2
4
6
8
miR-33+/+ (HFD)miR-33-/- (HFD)
Tota
l fat
wei
ght
from
CT
valu
e (g
)
0
2
4
6
8
10
Visc
eral
fat w
eigh
tfr
om C
T va
lue
(g)
0
1
2
3
4
5
Sub-
fat w
eigh
tfr
om C
T va
lue
(g)
0
1
2
3
4
5
Mus
cle
wei
ght
from
CT
valu
e (g
)
0
5
10
15
20
% fa
t(t
otal
fat w
eigh
t/bod
y w
eigh
t)
0
10
20
30
40
* **
*
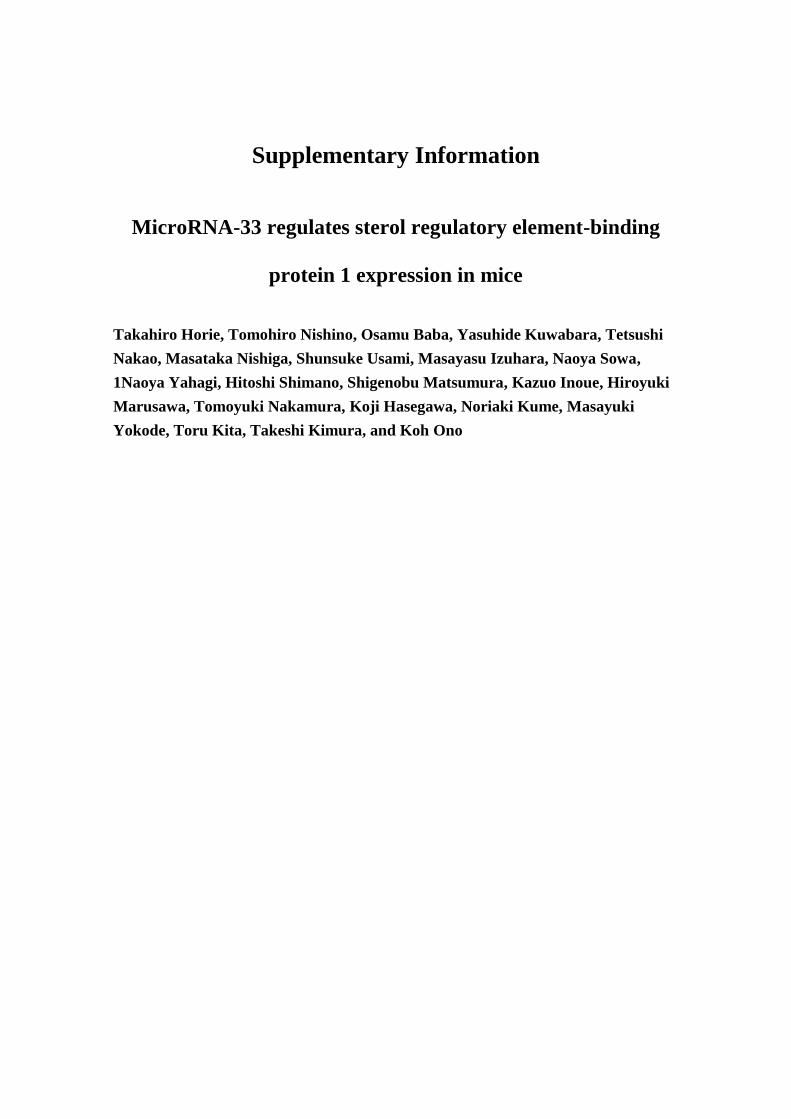
Supplementary Figure S1. Estimation of fat weight from CT images.
(a) Relationship between estimated fat weight and actual weight. (b) Estimated fat weight of miR-33+/+ and miR-33−/− mice fed HFD. Values are the means ± s.e.m. (n = 8 each, *p<0.05 in Student’s t-test).

aFood intake (NC)
Food
inta
ke (g
/day
/mou
se)
8 9 10 11 12 13 14 15 16 17 18 190
1
2
3
4miR-33+/+
miR-33-/-
Week
Food intake (HFD)
Food
inta
ke (g
/day
/mou
se)
8 9 10 11 12 13 14 15 16 17 18 190
1
2
3
4miR-33+/+
miR-33-/-
Week
b
miR-33+/+
miR-33-/-
miR-33+/+
miR-33-/-
NC
Food
inta
ke (g
/day
/mou
se)
0
1
2
3
4
HFD
Food
inta
ke (g
/day
/mou
se)
0
1
2
3
4
**
Supplementary Figure S2. Food intake of miR-33+/+ and miR-33−/− mice.
(a) Serial changes in food intake associated with NC feeding. (b) Serial changes of food intake associated with HFD feeding. Values are the means ± s.e.m. Statistical comparisons were made by Student’s t-test (n=5, **p < 0.01).

b
Sreb
f1 3
'UTR
-luc
(%)
miR
-Con
miR
-146
a
0
20
40
60
80
100
120
miR-33
*******
c
Sreb
f1 3
'UTR
-luc
(%)
miR
-Con
miR
-33
miR
-Con
miR
-33
0
20
40
60
80
100
120
**
MutantWild
aFa
tty
acid
syn
thes
is(d
.p.m
. / li
ver
wei
ght (
g))
+/+
miR-33
-/-
miR-33
0
50,000
100,000
150,000
200,000**
Supplementary Figure S3. miR-33 deficiency increased fatty acid synthesis in vivo
and miR-33 targets the 3’UTR of Srebf1 in COS-7 cells.
(a) De novo fatty acid synthesis in the livers of miR-33+/+ and miR-33−/− mice (n = 4 each, **p < 0.01 in Student’s t-test). (b) Luciferase reporter activity of mouse Srebf1 3′UTR in COS-7 cells. miR-control (miR-Con) and miR-146a were used as negative controls (n = 4 each, ***p < 0.001, ****p < 0.0001 in one-way analysis of valiance test).(c) Luciferase reporter activity of wild-type or mutant Srebf1 3′UTR at the potential miR-33 binding site in COS-7 cells (n = 4 each, **p < 0.01 in Student’s t-test). Values are the mean ± s.e.m.

Supplementary Figure S4. The expressions of lipid metabolism-associated genes in
HepG2 cells and primary hepatocytes transduced with miR-Con or miR-33
expression vector and in miR-33+/+ and miR-33−/− mice.
(a) ABCA1, SREBP-1, and IRS-2 expression levels in HepG2 cells transduced with miR-Con or miR-33 expression vector. (b) ABCA1, SREBF1, SREBF1a, and SREBF1c expression levels in HepG2 cells transduced with miR-Con or miR-33 expression vector. *p<0.05, **p<0.01. (c) ABCA1, SREBP-1, and IRS-2 expression levels in primary hepatocytes transduced with miR-Con or miR-33 expression vector. *p<0.05. (d) ABCA1, SREBP-1, and IRS-2 expression levels in primary hepatocytes prepared from miR-33+/+ and miR-33−/− mice. *p<0.05. (e) Relative expression levels of lipid metabolism-related genes in primary hepatocytes transduced with miR-Con or miR-33 expression vector. (f) Relative expression levels of lipid metabolism-related genes in primary hepatocytes prepared from miR-33+/+ and miR-33−/− mice. Values are the means ± s.e.m. Statistical comparisons were made by Student’s t-test.
a b
*
**
Den
sito
met
ry (%
)
0
50
100
150
Rel
ativ
e Ex
pres
sion
(%)
0
20
40
60
80
100
120
** **
*
c d miR-33+/+
miR-33-/-
**
*
Den
sito
met
ry (%
)
0
50
100
150
200
250
miR-ConmiR-33
* *
miR-ConmiR-33
miR-ConmiR-33
Den
sito
met
ry (%
)
0
50
100
150
e f
Rel
ativ
e Ex
pres
sion
(% C
ompa
ired
with
miR
-33+/
+ )Sreb
f1
Srebf1a
Srebf1cFas
nScd
1Acc
1Irs
2Abca
1Cro
tCpt1a
Prkaa1Nrip
1PpargCd36
VldlrCidea
Cidec
Srebf2
Ldlr
Hmgcr0
50
100
150
200
Rel
ativ
e Ex
pres
sion
(% C
ompa
ired
with
miR
-Con
)
Srebf1
Srebf1a
Srebf1cFas
nScd
1Acc
1Irs
2Abca
1Cro
tCpt1a
Prkaa1Nrip
1PpargCd36
VldlrCidea
Cidec
Srebf2
Ldlr
Hmgcr0
50
100
150

Supplementary Figure S5. Western blotting analysis of ABCA1, SREBP-1, IRS-2, 1
AMPKα, and PPARγ. 2
(a) ABCA1 and SREBP-1 protein levels in the livers of miR-33+/+ and miR-33−/− mice 3 fed NC or HFD. (b) AMPKα and IRS-2 protein levels in the livers of miR-33+/+ and 4 miR-33−/− mice. (c) PPARγ protein levels in HepG2 cells transduced with miR-Con or 5 miR-33 expression vector. (d) PPARγ protein levels in primary hepatocytes transduced 6 with miR-Con or miR-33 expression vector and primary hepatocytes prepared from 7 miR-33+/+ and miR-33−/− mice. (e) Luciferase reporter activity of PPRE in HepG2 cells. 8 HepG2 cells with or without 3 μM pioglitazone treatment were transfected with the 9 PPRE luciferase construct, along with expression plasmids for miR-Con (negative 10 control), miR-33, or PPARγ (positive control). Values are the mean ± s.e.m. Statistical 11 comparisons were made by one-way analysis of valiance test (n = 4 each, *p < 0.05, **p 12 < 0.01, ***p < 0.001). 13
a Normal Chow High Fat Diet
ABCA1
miR-33+/+ miR-33-/-
GAPDH
PrecursorSREBP-1
MatureSREBP-1
β-actin
miR-33+/+ miR-33-/-
IRS-2
AMPKα
GAPDH
miR-33+/+ miR-33-/-
b
c d e
miR
-Con
miR
-33
miR
-Con
miR
-33
PPARγ
GAPDH
TF2B
Whole Nuclear
HepG2
β-actin
PPARγ
miR
-Con
miR
-33
PrimaryHepatocyte
miR
-33+/
+
miR
-33-/
-
PPRE
-luc
(%)
miR
-Con
miR
-33 γ
PPA
R
miR
-Con
miR
-33 γ
PPA
R
0
100
200
300
(-) 3µMPioglitazone
*
****
*****
kDa
200
116
55
36
42
kDa200
55
36
55 55
kDa kDa
36
36
42
b Scap
Rel
ativ
e Ex
pres
sion
(A.U
.)
0.0
0.5
1.0
1.5
2.0miR-33+/+ Srebf1+/+
miR-33+/+ Srebf1+/-
miR-33-/- Srebf1+/+
miR-33-/- Srebf1+/-
SCAP
miR-33+/+
Srebf1+/+miR-33+/+
Srebf1+/-miR-33-/-
Srebf1+/+miR-33-/-
Srebf1+/-
β-actin
c
aHsa (Human) CAGGGCCUCCUUGCCCAGGCAGGAGGCUGGG-GUGCUGUGUGGGGGC---CAAUGCACUG-AACCUGGACUUGGGGGAAAGAG
Ptr (Chimpanzee) CAGGGCCUCCUUGCCCAGGCAGGAGGCUGGG-GUGCUGUGUGGGGGC---CAAUGCACUG-AACCUGGACUUGGGGGAAAGAG
Mmu (Mouse) CAGGUCCCUUUCCCCCAUCCCAAGG--UGGG-GCAC-----AGGGGAUAGCAACUCUUUG-GACCUAGACUAGAGGC-AAUAG
Rno (Rat) CAGGGCC-UUUCCCCCAUCCCAAGG--UGGG-GCAC-----UGGGGAUUGCAACUCUUUG-GACCUAGACUGGAGGC-AAUAG
Cfa (Dog) CGGG-CAG---------------GAGCUGUG---------------------GUGCA-----------------------GAG
Bta (Cow) UGGG-CCUUCCCCACCCCUC---UGGCUGGG-GCGCUCGGUUGG------CAACGCAUGG-GACCUGGAC-GGGG--GGAGUG
** * ** * **** * * ** ** **** * *** * * **** **** * ** * *
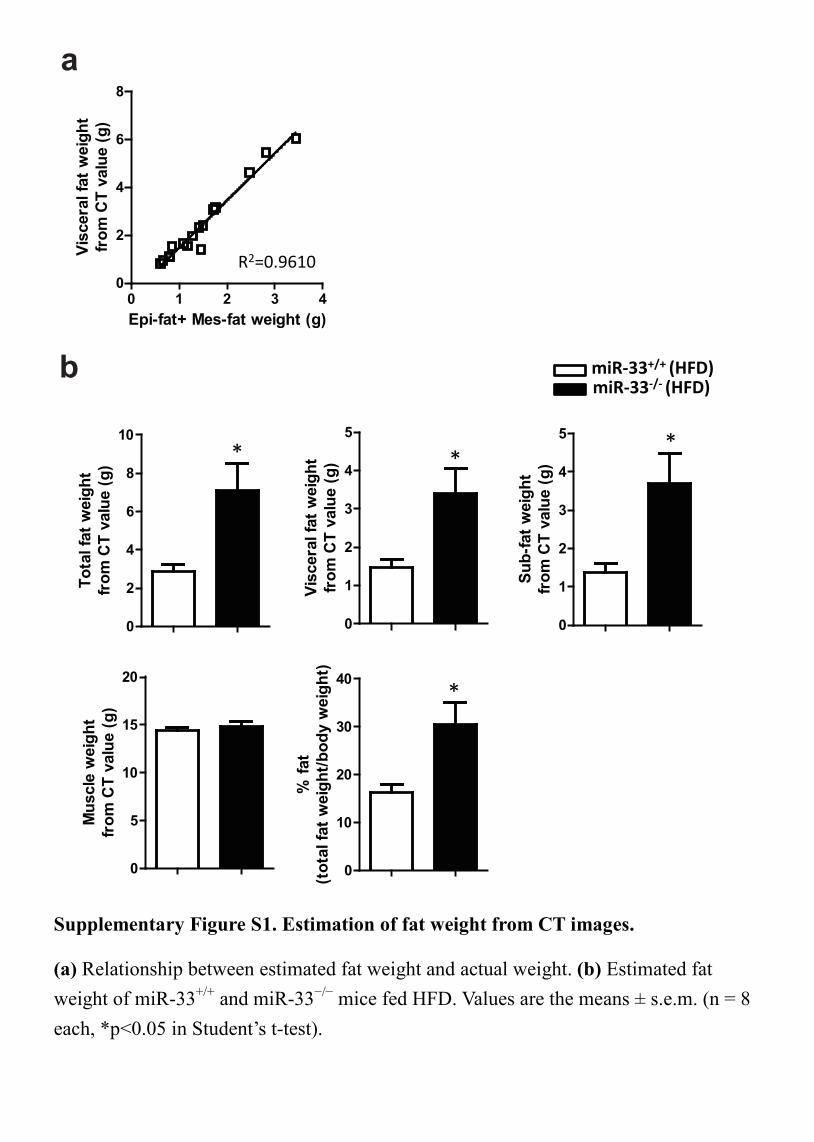
Supplementary Figure S6. The expression of SCAP in miR-33+/+Srebf1+/+,
miR-33+/+Srebf1+/−, miR-33−/−Srebf1+/+, and miR-33−/− Srebf1+/− mice fed HFD.
(a) Sequence alignment of Scap 3′UTR at the potential miR-33 binding site. * indicates the conservation among species. (b) Quantitative real-time PCR analysis of Scap. Values are the mean ± s.e.m. (n = 6−8 each). (c) Western blotting analysis of SCAP levels. β-actin was used as a loading control.
116
42
kDa

a
Sreb
f1-/
-
miR
-33+/
+
miR
-33-/
-
PrecursorSREBP-1
MatureSREBP-1
AberrantSREBP-1
TF2B
GAPDH
b
c d
T ime (min)
Insu
lin (
pg/m
l)
0 30 60 90 1200
500
1,000
1,500
2,000
miR-33-/- Srebf1+/+
miR-33-/- Srebf1+/-
AU
C o
f In
sulin
(%
miR
-33-/
- Sre
bf1
+/+)
0
50
100
150
miR-33-/-
Srebf1+/+miR-33-/-
Srebf1+/-
emiR-33+/+
Srebf1+/+miR-33+/+
Srebf1+/-miR-33-/-
Srebf1+/+miR-33-/-
Srebf1+/-
SIRT6
β-actin
AMPKα
miR-33-/- Srebf1+/+
miR-33-/- Srebf1+/-
116
kDa
55
36
36
42
kDa
36
55
42
Supplementary Figure S7. Phenotypic changes by the reduction of SREBP-1 levels 1
in miR-33−/− mice. 2
(a) Western blotting analysis of SREBP-1 in the liver of miR-33+/+, miR-33-/- and 3
Srebf1-/- mice fed NC. (b) Representative picture of miR-33−/−
Srebf1+/+ and 4 miR-33
−/−Srebf1+/− mice fed HFD. (c) Serial changes of insulin levels after 5
intraperitoneal injection of glucose in miR-33−/−Srebf1+/+ and miR-33−/−Srebf1+/− mice 6 fed HFD (n = 5 each). (d) AUC of insulin levels after intraperitoneal injection of 7 glucose in miR-33−/−Srebf1+/+ and miR-33−/−Srebf1+/− mice fed HFD (n = 5 each). (e) 8 Western blotting analysis of SIRT6 and AMPKα in miR-33+/+Srebf1+/+, 9 miR-33+/+Srebf1+/−, miR-33−/−Srebf1+/+, and miR-33−/−Srebf1+/− mice fed HFD. β-actin 10 was used as a loading control. Values are the means ± s.e.m. 11
Rel
ativ
e Ex
pres
sion
(A.U
.)
Srebf1
Srebf1c Fas
nAcc
1Scd
1
Spot14Pparg
0
10
20
30
40 miR-33+/+ (HFD)miR-33-/- (HFD)
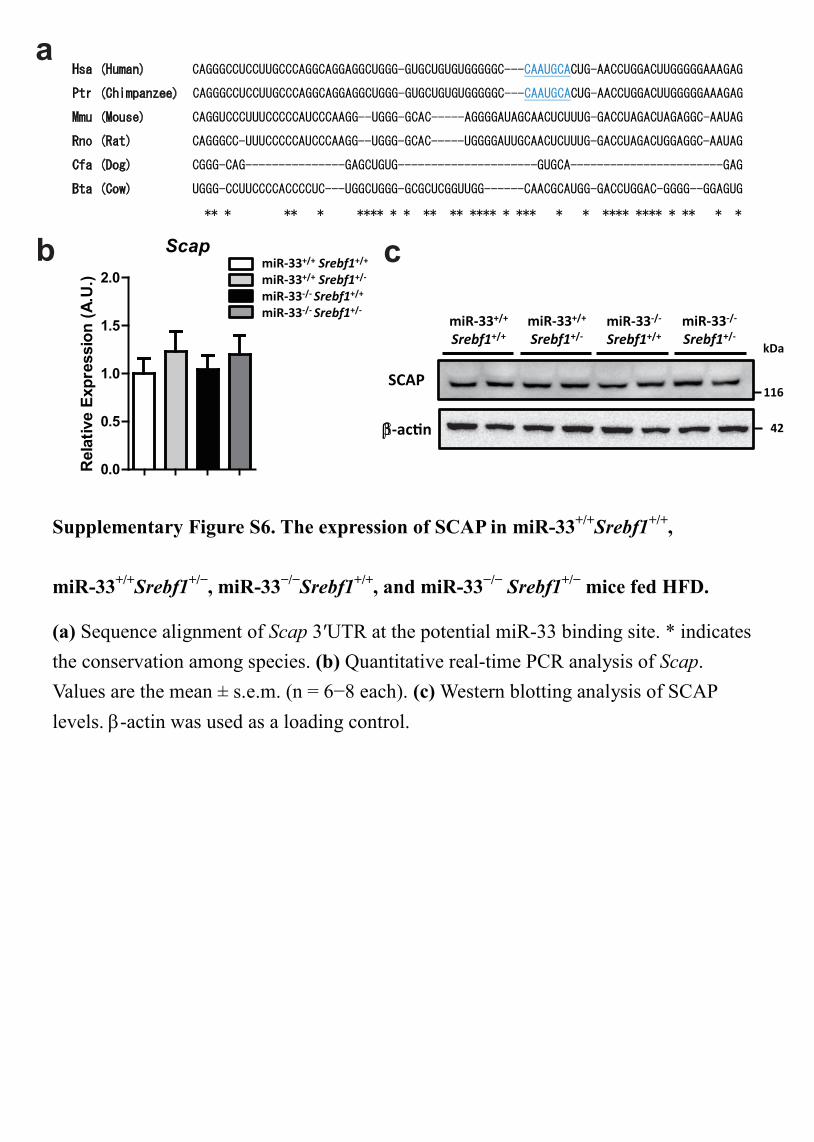
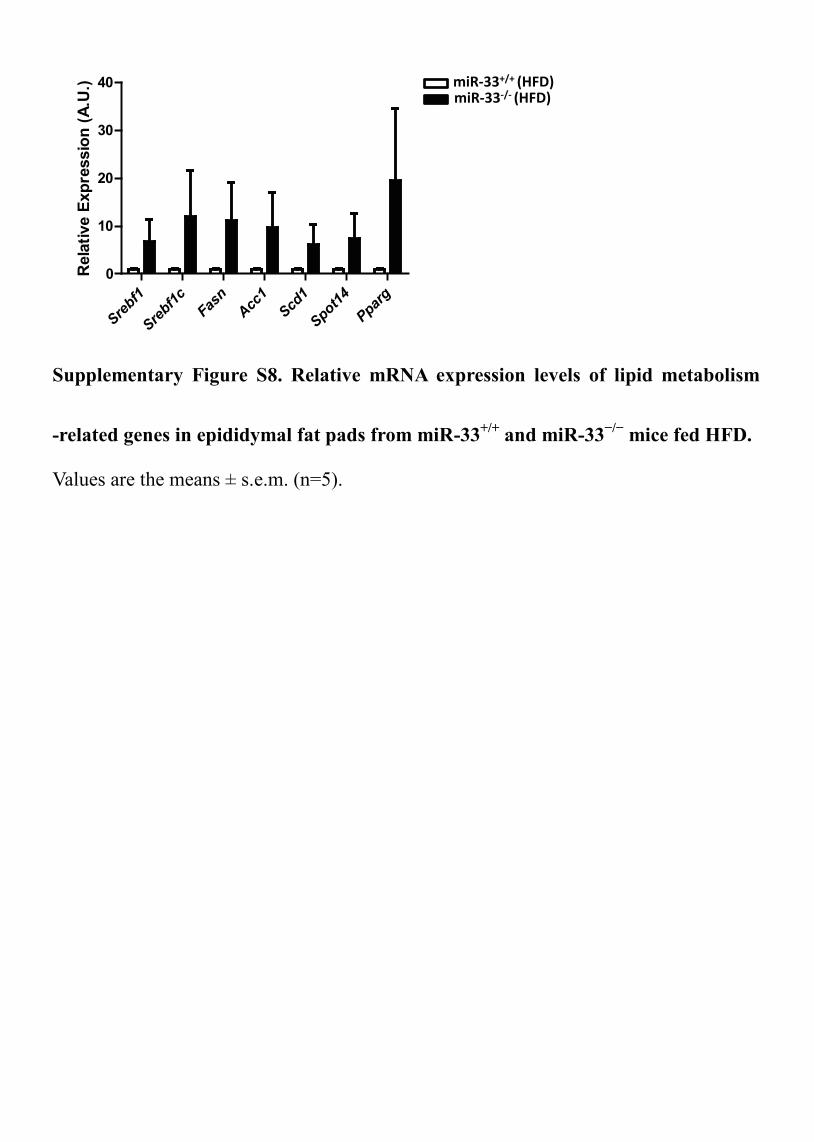
Supplementary Figure S8. Relative mRNA expression levels of lipid metabolism
-related genes in epididymal fat pads from miR-33+/+ and miR-33−/− mice fed HFD.
Values are the means ± s.e.m. (n=5).

a
bAcetyl-CoA
Mevalonicacid
Malonyl-CoA
HMG-CoAreductase
ACC1
Fatty Acids
Cholesterol
FASNELOVL6SCD1
SREBP2
SREBP1 miR-33
LDLR
ABCA1ABCG1
Triglyceride LXR
Cholesterol-loaded or overeating states
Acetyl-CoA
Mevalonicacid
Malonyl-CoA
HMG-CoAreductase
ACC1
Fatty Acids
Cholesterol
FASNELOVL6SCD1
SREBP2
SREBP1 miR-33
LDLR
ABCA1ABCG1
Triglyceride LXR
Regulation of cholesterol and fatty acid synthesis by miR-33
Acetyl-CoA
Mevalonicacid
Malonyl-CoA
HMG-CoAreductase
ACC1
Fatty Acids
Cholesterol
FASNELOVL6SCD1
SREBP2SREBP1 miR-33
LDLR
ABCA1ABCG1
Triglyceride LXR
Cholesterol-depleted or fasting states
miR-33
SREBP1 ↑
de novo Lipogenesis
FasnAcc1Scd1
Lipid droplet formation
TG accumulation
Cidea
Pparg
FA uptake de novo LipogenesisCd36
Vldlr Mogat1
Liver steatosis
Lipid droplet formation
TG accumulation
Cidec
KO
Supplementary Figure S9. Schematic overview of the function of miR-33 in the
regulation of SREBP-1 expression levels.
(a) Overview of the function of miR-33 deficiency on liver steatosis. (b) Context-dependent change of the role of miR-33 on lipid metabolism.

200kDa
116kDa97kDa
55kDa
PrecursorSREBP-1
MatureSREBP-1
GAPDH 36kDa
36kDaTF2B
T0901317 (µM) 0 1 10 0 10 0 10
Whole Cytosol Nuclear
Supplementary Figure S10. Western blotting for SREBP-1, GAPDH, TF2B in
T0901317-stimulated HepG2 cells.
HepG2 cells were stimulated with the indicated concentrations of T0901317 for 24 h.
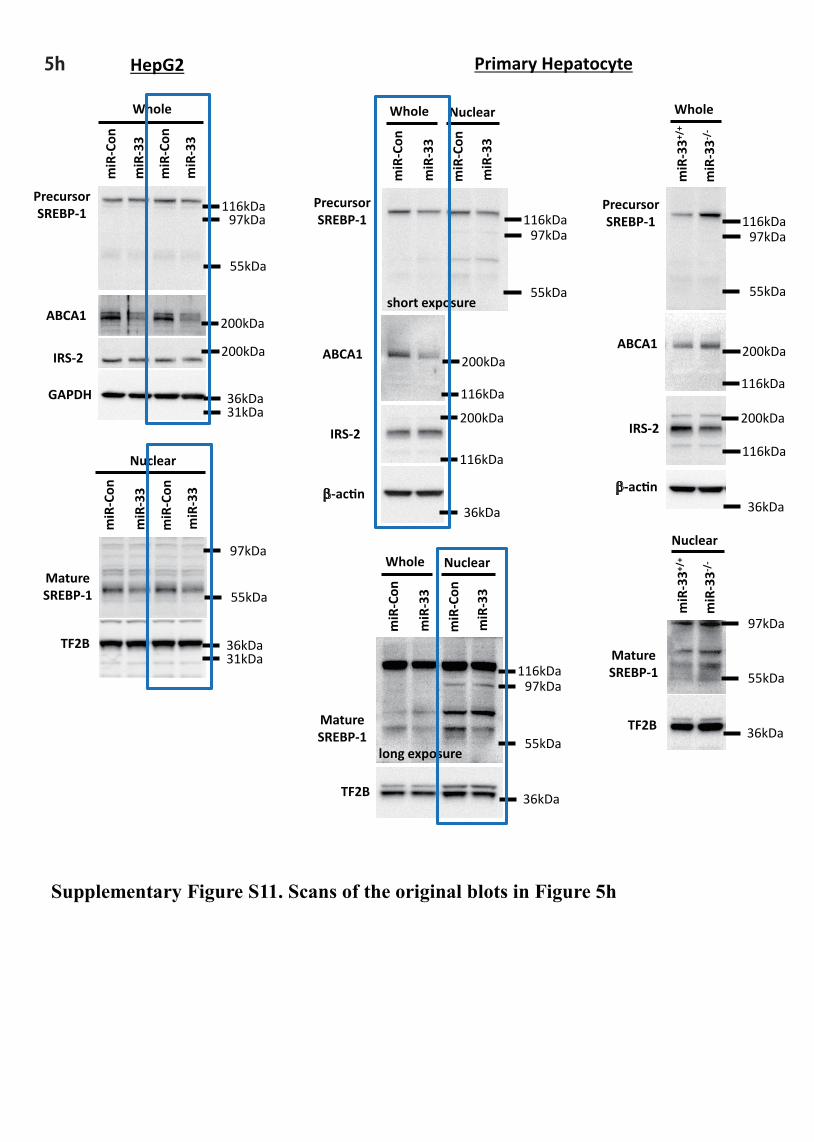
200kDa
116kDa97kDa
55kDa
200kDa
ABCA1
PrecursorSREBP-1
IRS-2
36kDa31kDa
GAPDH
miR
-Con
miR
-33
Wholem
iR-C
on
miR
-33
97kDa
55kDaMatureSREBP-1
36kDa31kDa
TF2B
miR
-Con
miR
-33
Nuclear
miR
-Con
miR
-33
short exposure
PrecursorSREBP-1
miR
-Con
miR
-33
miR
-Con
miR
-33
Whole Nuclear
β-actin36kDa
IRS-2200kDa
ABCA1 200kDa
116kDa
116kDa
116kDa97kDa
55kDa
116kDa97kDa
55kDalong exposure
miR
-Con
miR
-33
miR
-Con
miR
-33
Whole Nuclear
TF2B 36kDa
MatureSREBP-1
IRS-2200kDa
ABCA1 200kDa
116kDa
116kDa
PrecursorSREBP-1 116kDa
97kDa
55kDa
β-actin36kDa
miR
-33+/
+
miR
-33-/
-
Whole
97kDa
55kDa
MatureSREBP-1
36kDaTF2B
miR
-33+/
+
miR
-33-/
-
Nuclear
HepG2 Primary Hepatocyte
Supplementary Figure S11. Scans of the original blots in Figure 5h
5h

200kDa
116kDa97kDa
55kDa
36kDa
PrecursorSREBP-1
β-actin
97kDa
55kDaMatureSREBP-1
TF2B36kDa
200kDaABCA1
PrecursorSREBP-1 116kDa
97kDa
36kDaβ-actin
97kDa
55kDa
36kDa
MatureSREBP-1AberrantSREBP-1
36kDaTF2B
Supplementary Figure S12. Scans of the original blots in Figure 6b and 7a
6b 7a

200kDa
116kDa97kDa
55kDa
36kDa
PrecursorSREBP-1
ABCA1
116kDa97kDa
MatureSREBP-1
GAPDH
36kDa
β-actin
55kDa
200kDa
116kDa97kDa
IRS-2
55kDa
36kDa
AMPKα
GAPDH
55kDa
36kDa
36kDa
PPARγ
GAPDH
TF2B β-actin36kDa
55kDa
miR
-Con
miR
-33
miR
-33+/
+
miR
-33-/
-
PPARγ
200kDa
116kDaSCAP
36kDaβ-actin
116kDa97kDa
55kDaMatureSREBP-1
PrecursorSREBP-1
AberrantSREBP-1
36kDa
36kDa
TF2B
GAPDHSr
ebf1
-/-
miR
-33+/
+
miR
-33-/
-
36kDa
AMPKα55kDa
36kDaβ-actin
SIRT6 36kDa31kDa
S5a
S5b
S5c
S6c
S7a
S7e
S5d
Supplementary Figure S13. Scans of the original blots in Supplementary Figure
S5a-d, S6c, S7a and S7e
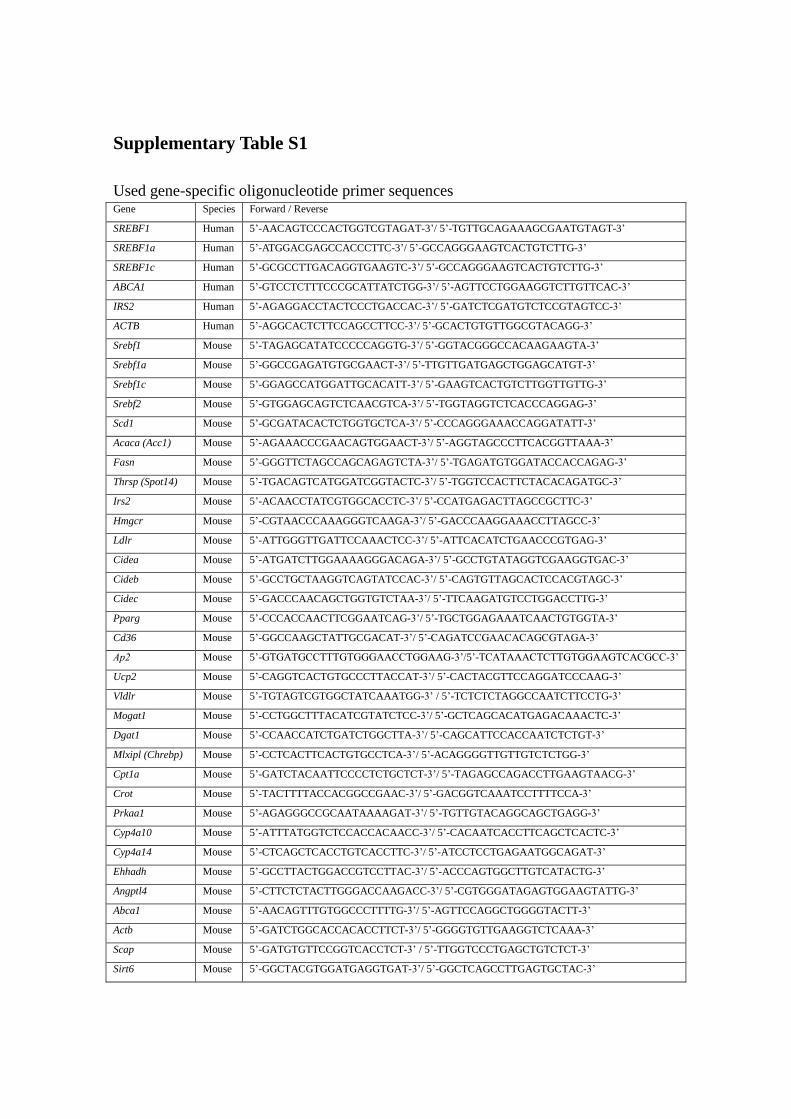
Supplementary Table S1
Used gene-specific oligonucleotide primer sequences Gene Species Forward / Reverse
SREBF1 Human 5’-AACAGTCCCACTGGTCGTAGAT-3’/ 5’-TGTTGCAGAAAGCGAATGTAGT-3’
SREBF1a Human 5’-ATGGACGAGCCACCCTTC-3’/ 5’-GCCAGGGAAGTCACTGTCTTG-3’
SREBF1c Human 5’-GCGCCTTGACAGGTGAAGTC-3’/ 5’-GCCAGGGAAGTCACTGTCTTG-3’
ABCA1 Human 5’-GTCCTCTTTCCCGCATTATCTGG-3’/ 5’-AGTTCCTGGAAGGTCTTGTTCAC-3’
IRS2 Human 5’-AGAGGACCTACTCCCTGACCAC-3’/ 5’-GATCTCGATGTCTCCGTAGTCC-3’
ACTB Human 5’-AGGCACTCTTCCAGCCTTCC-3’/ 5’-GCACTGTGTTGGCGTACAGG-3’
Srebf1 Mouse 5’-TAGAGCATATCCCCCAGGTG-3’/ 5’-GGTACGGGCCACAAGAAGTA-3’
Srebf1a Mouse 5’-GGCCGAGATGTGCGAACT-3’/ 5’-TTGTTGATGAGCTGGAGCATGT-3’
Srebf1c Mouse 5’-GGAGCCATGGATTGCACATT-3’/ 5’-GAAGTCACTGTCTTGGTTGTTG-3’
Srebf2 Mouse 5’-GTGGAGCAGTCTCAACGTCA-3’/ 5’-TGGTAGGTCTCACCCAGGAG-3’
Scd1 Mouse 5’-GCGATACACTCTGGTGCTCA-3’/ 5’-CCCAGGGAAACCAGGATATT-3’
Acaca (Acc1) Mouse 5’-AGAAACCCGAACAGTGGAACT-3’/ 5’-AGGTAGCCCTTCACGGTTAAA-3’
Fasn Mouse 5’-GGGTTCTAGCCAGCAGAGTCTA-3’/ 5’-TGAGATGTGGATACCACCAGAG-3’
Thrsp (Spot14) Mouse 5’-TGACAGTCATGGATCGGTACTC-3’/ 5’-TGGTCCACTTCTACACAGATGC-3’
Irs2 Mouse 5’-ACAACCTATCGTGGCACCTC-3’/ 5’-CCATGAGACTTAGCCGCTTC-3’
Hmgcr Mouse 5’-CGTAACCCAAAGGGTCAAGA-3’/ 5’-GACCCAAGGAAACCTTAGCC-3’
Ldlr Mouse 5’-ATTGGGTTGATTCCAAACTCC-3’/ 5’-ATTCACATCTGAACCCGTGAG-3’
Cidea Mouse 5’-ATGATCTTGGAAAAGGGACAGA-3’/ 5’-GCCTGTATAGGTCGAAGGTGAC-3’
Cideb Mouse 5’-GCCTGCTAAGGTCAGTATCCAC-3’/ 5’-CAGTGTTAGCACTCCACGTAGC-3’
Cidec Mouse 5’-GACCCAACAGCTGGTGTCTAA-3’/ 5’-TTCAAGATGTCCTGGACCTTG-3’
Pparg Mouse 5’-CCCACCAACTTCGGAATCAG-3’/ 5’-TGCTGGAGAAATCAACTGTGGTA-3’
Cd36 Mouse 5’-GGCCAAGCTATTGCGACAT-3’/ 5’-CAGATCCGAACACAGCGTAGA-3’
Ap2 Mouse 5’-GTGATGCCTTTGTGGGAACCTGGAAG-3’/5’-TCATAAACTCTTGTGGAAGTCACGCC-3’
Ucp2 Mouse 5’-CAGGTCACTGTGCCCTTACCAT-3’/ 5’-CACTACGTTCCAGGATCCCAAG-3’
Vldlr Mouse 5’-TGTAGTCGTGGCTATCAAATGG-3’ / 5’-TCTCTCTAGGCCAATCTTCCTG-3’
Mogat1 Mouse 5’-CCTGGCTTTACATCGTATCTCC-3’/ 5’-GCTCAGCACATGAGACAAACTC-3’
Dgat1 Mouse 5’-CCAACCATCTGATCTGGCTTA-3’/ 5’-CAGCATTCCACCAATCTCTGT-3’
Mlxipl (Chrebp) Mouse 5’-CCTCACTTCACTGTGCCTCA-3’/ 5’-ACAGGGGTTGTTGTCTCTGG-3’
Cpt1a Mouse 5’-GATCTACAATTCCCCTCTGCTCT-3’/ 5’-TAGAGCCAGACCTTGAAGTAACG-3’
Crot Mouse 5’-TACTTTTACCACGGCCGAAC-3’/ 5’-GACGGTCAAATCCTTTTCCA-3’
Prkaa1 Mouse 5’-AGAGGGCCGCAATAAAAGAT-3’/ 5’-TGTTGTACAGGCAGCTGAGG-3’
Cyp4a10 Mouse 5’-ATTTATGGTCTCCACCACAACC-3’/ 5’-CACAATCACCTTCAGCTCACTC-3’
Cyp4a14 Mouse 5’-CTCAGCTCACCTGTCACCTTC-3’/ 5’-ATCCTCCTGAGAATGGCAGAT-3’
Ehhadh Mouse 5’-GCCTTACTGGACCGTCCTTAC-3’/ 5’-ACCCAGTGGCTTGTCATACTG-3’
Angptl4 Mouse 5’-CTTCTCTACTTGGGACCAAGACC-3’/ 5’-CGTGGGATAGAGTGGAAGTATTG-3’
Abca1 Mouse 5’-AACAGTTTGTGGCCCTTTTG-3’/ 5’-AGTTCCAGGCTGGGGTACTT-3’
Actb Mouse 5’-GATCTGGCACCACACCTTCT-3’/ 5’-GGGGTGTTGAAGGTCTCAAA-3’
Scap Mouse 5’-GATGTGTTCCGGTCACCTCT-3’ / 5’-TTGGTCCCTGAGCTGTCTCT-3’
Sirt6 Mouse 5’-GGCTACGTGGATGAGGTGAT-3’/ 5’-GGCTCAGCCTTGAGTGCTAC-3’

Supplementary Table S2
Serum profile of NC-fed aged mice
miR-33+/+
NC 50W (n=5) miR-33-/-
NC 50W (n=5)
AST (IU/L) 53.40±4.11 62.00±8.07
ALT (IU/L) 36.20±3.65 63.20±16.83
ALP (IU/L) 201.80±12.28 237.00±19.77
T-CHO (mg/dL) 89.60±4.70 137.60±8.42 **
TG (mg/dL) 25.00±1.52 18.80±1.66 *
NEFA (Eq/L) 807.8±72.94 976.2±53.30
LDL-C (mg/dL) 5.40±0.40 11.2±1.28 **
HDL-C (mg/dL) 55.80±3.01 66.20±2.35 *
Values are the means ± s.e.m. Statistical comparisons were made by Student’s t-test (*p
< 0.05, **p < 0.01).
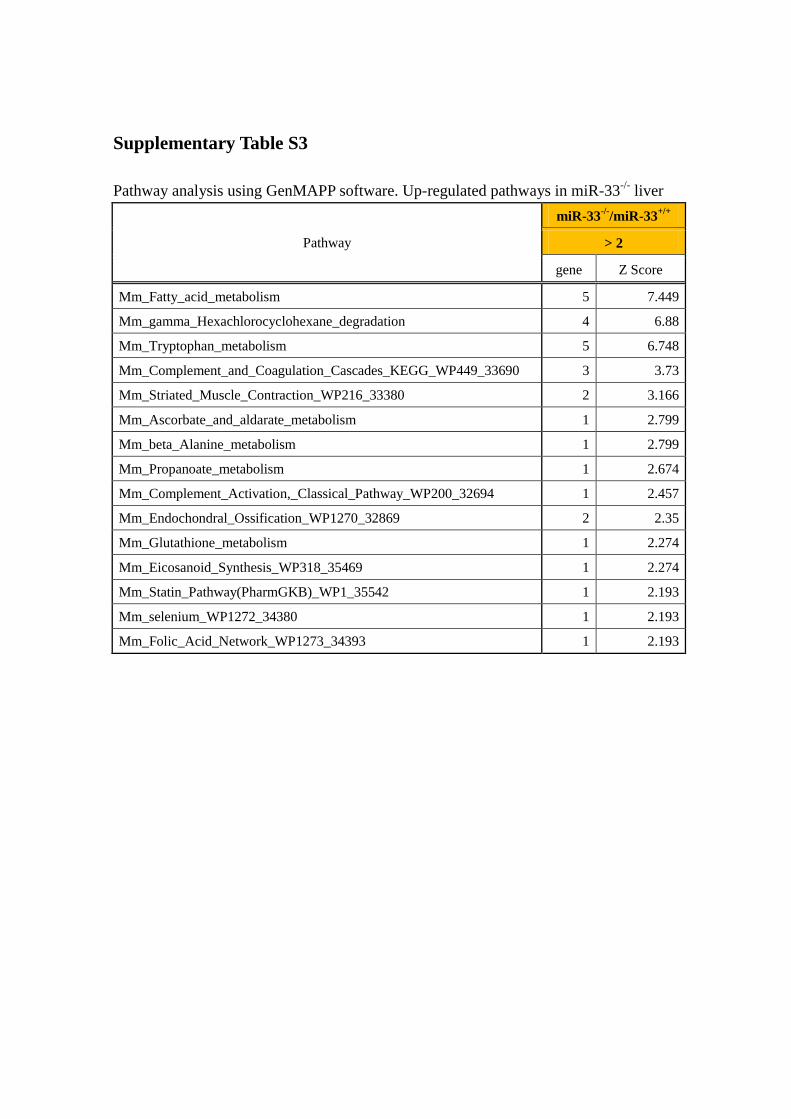
Supplementary Table S3
Pathway analysis using GenMAPP software. Up-regulated pathways in miR-33-/-
liver
Pathway
miR-33-/-
/miR-33+/+
> 2
gene Z Score
Mm_Fatty_acid_metabolism 5 7.449
Mm_gamma_Hexachlorocyclohexane_degradation 4 6.88
Mm_Tryptophan_metabolism 5 6.748
Mm_Complement_and_Coagulation_Cascades_KEGG_WP449_33690 3 3.73
Mm_Striated_Muscle_Contraction_WP216_33380 2 3.166
Mm_Ascorbate_and_aldarate_metabolism 1 2.799
Mm_beta_Alanine_metabolism 1 2.799
Mm_Propanoate_metabolism 1 2.674
Mm_Complement_Activation,_Classical_Pathway_WP200_32694 1 2.457
Mm_Endochondral_Ossification_WP1270_32869 2 2.35
Mm_Glutathione_metabolism 1 2.274
Mm_Eicosanoid_Synthesis_WP318_35469 1 2.274
Mm_Statin_Pathway(PharmGKB)_WP1_35542 1 2.193
Mm_selenium_WP1272_34380 1 2.193
Mm_Folic_Acid_Network_WP1273_34393 1 2.193

Supplementary Table S4
Serum profile of mice with indicated genotype
miR-33
+/+
Srebf1+/+
miR-33+/+
Srebf1+/-
miR-33-/-
Srebf1+/+
miR-33-/-
Srebf1+/-
AST (IU/L) 60.2±3.94 66.17±4.09 101.67±33.60 53.50±3.10
ALT (IU/L) 22.67±2.53 37.67±4.76 73.33±45.79 25.50±5.38
ALP (IU/L) 144.83±8.77 144.33±5.06 188.33±10.93* 144.83±12.93
T-CHO (mg/dL) 140.33±15.88 141.83±16.32 164.00±20.30 167.83±8.74
TG (mg/dL) 18.67±4.89 14.00±1.84 17.83±1.74 15.00±2.18
NEFA (Eq/L) 505.33±60.80 473.83±45.38 480.33±65.29 421.67±36.62
LDL-C (mg/dL) 12.83±2.80 10.00±1.37 13.83±2.83 13.67±1.48
HDL-C (mg/dL) 68.17±5.36 70.00±5.54 76.50±7.12 73.00±2.07
Values are the means ± s.e.m. Statistical comparisons were made by one-way analysis of
valiance test (n= 6 each, *p < 0.05).