supplementary figure s1 | size distribution of fpt ... · supplementary figure s1 ... the...
TRANSCRIPT
1
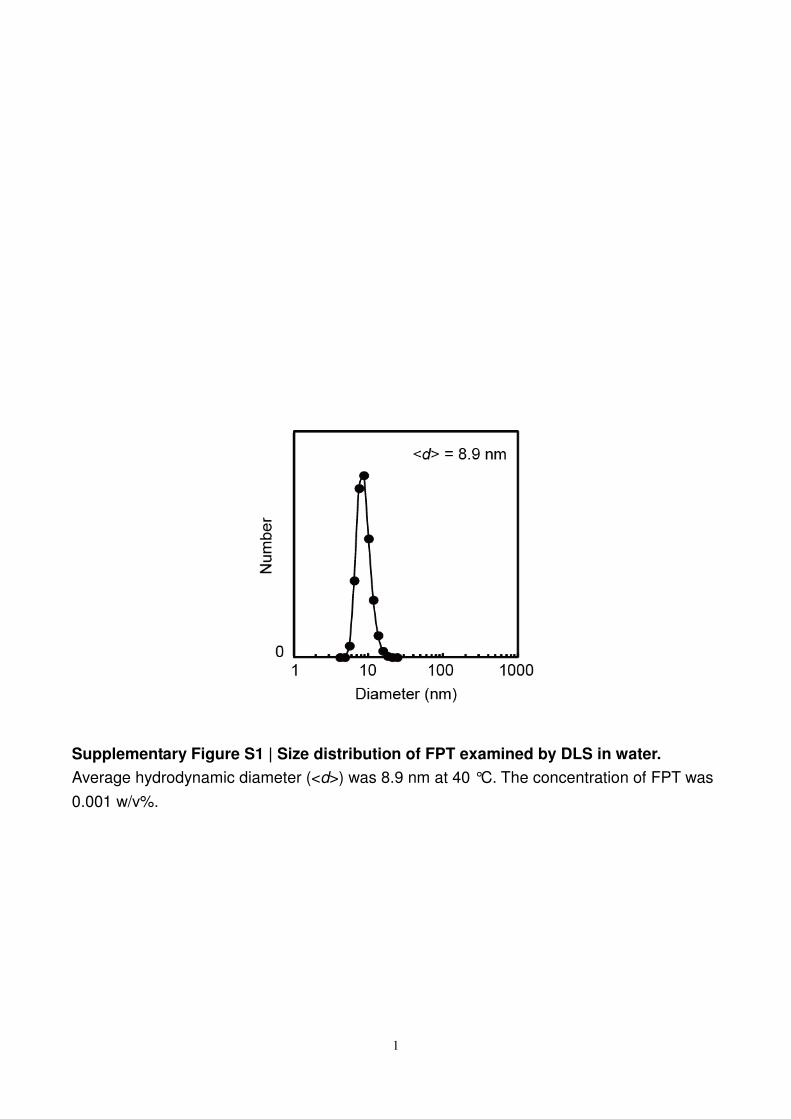
Supplementary Figure S1 | Size distribution of FPT examined by DLS in water.
Average hydrodynamic diameter (<d>) was 8.9 nm at 40 °C. The concentration of FPT was
0.001 w/v%.
2
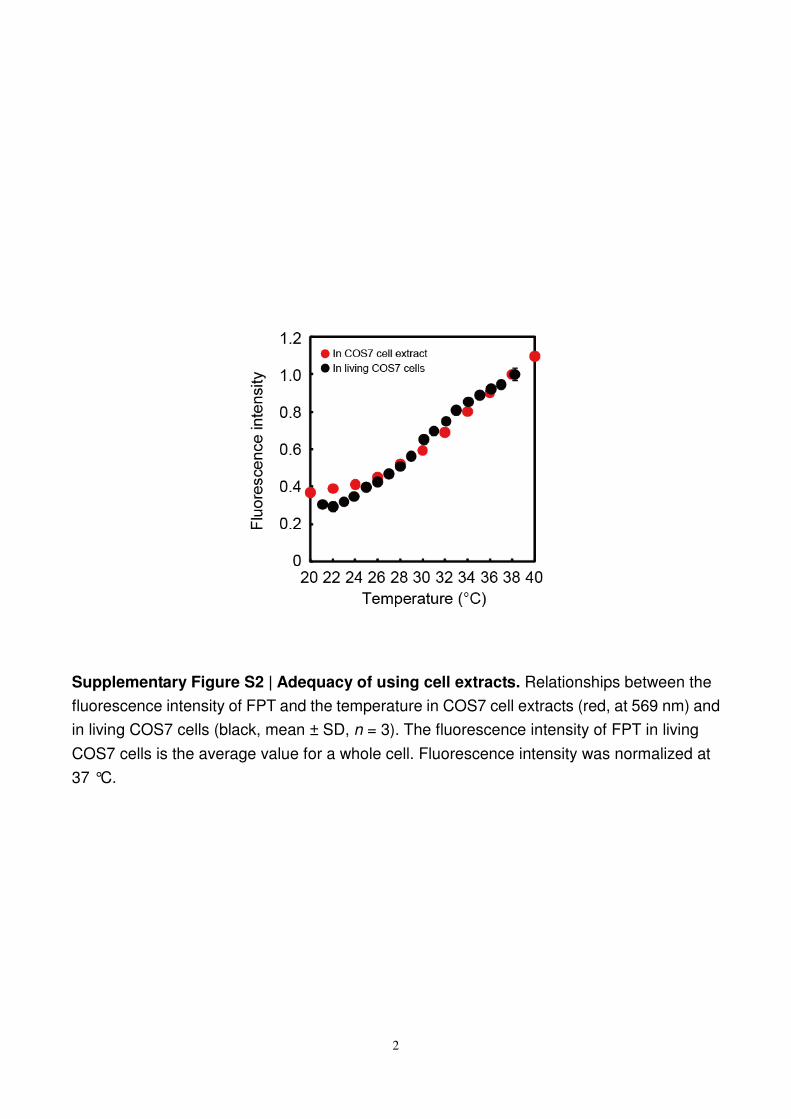
Supplementary Figure S2 | Adequacy of using cell extracts. Relationships between the
fluorescence intensity of FPT and the temperature in COS7 cell extracts (red, at 569 nm) and
in living COS7 cells (black, mean ± SD, n = 3). The fluorescence intensity of FPT in living
COS7 cells is the average value for a whole cell. Fluorescence intensity was normalized at
37 °C.
3
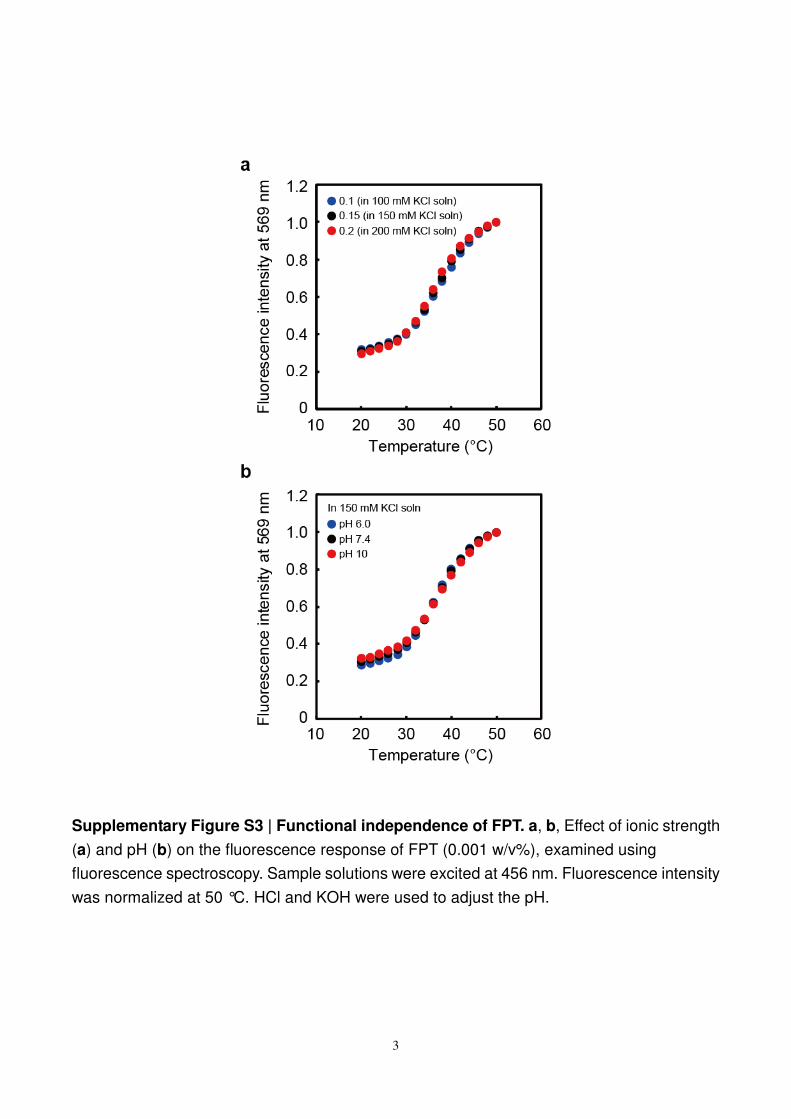
Supplementary Figure S3 | Functional independence of FPT. a, b, Effect of ionic strength
(a) and pH (b) on the fluorescence response of FPT (0.001 w/v%), examined using
fluorescence spectroscopy. Sample solutions were excited at 456 nm. Fluorescence intensity
was normalized at 50 °C. HCl and KOH were used to adjust the pH.

4
Supplementary Figure S4 | Representative reversibility of the fluorescence response
of FPT to temperature variations in a COS7 cell extract. The concentration of FPT was
0.001 w/v%.

5
Supplementary Figure S5 | Effects of surrounding proteins on the fluorescence lifetime
of FPT. Bovine serum albumin (BSA) was used as a model protein. The concentration of FPT
in the COS7 cell extract (C.E.) was 0.001 w/v%.

6
Supplementary Figure S6 | Effects of environmental viscosity on the fluorescence
lifetime of FPT. Ficoll was added into the KCl solution (150 mM) to vary the viscosity of the
solution. The concentration of FPT was 0.002 w/v%. The relative standard deviations in
fluorescence lifetimes obtained with the variation of viscosity (n = 7) were 2.1, 1.2, and 0.6 %
at 25, 30, 35 °C, respectively.

7
Supplementary Figure S7 | Fluorescence decay curves of FPT in living COS7 cells. a-c,
Fluorescence lifetime images (left) and fluorescence decay curves (right) obtained at the point
(+) indicated in the fluorescence lifetime images. Each fluorescence decay curve was fitted to
a double exponential function. The temperatures of the culture medium are indicated in the
images. Bar, 10 µm.

8
Supplementary Figure S8 | Negligible photon count in the cell without FPT. Bright field
image (left), fluorescence lifetime image (middle) and fluorescence decay curves (right)
obtained at the pixels in the cell with FPT (F), the cell without FPT (N) and the background (B)
indicated by crosses (+) in the fluorescence lifetime image. The photon count in the cell
without FPT is the same level as background. Bar,10 µm.

9
Supplementary Figure S9 | Fluorescence lifetime imaging of an FPT solution.
Fluorescence lifetime images of FPT in a COS7 cell extract (left) and histograms of
fluorescence lifetime in the images (right). <τf> and RSD represent the average and the
relative standard deviation of the histogram, respectively.

10
Supplementary Figure S10 | Fluorescence lifetime imaging of dividing COS7 cells. a,
Fluorescence lifetime images of FPT (left) and histograms of fluorescence lifetime in whole
living cells (right). b, Fluorescence lifetime images of the control copolymer (left) and
histograms of fluorescence lifetime in whole living cells (right). <τf> represents the average of
the histogram. The temperatures indicated in the images were those of the culture medium.
Bars, 10 µm.

11
Supplementary Figure S11 | Heat-induced aggregation of FNT near the mitochondria in
living COS7 cells. a, Phase contrast image (left) and epi-fluorescence image of FNT (middle
and right). The temperatures indicated in the fluorescence images are those of the culture
medium. b, Phase contrast image (left) and epi-fluorescence image (right) of FNT (green) and
MitoTracker Deep Red FM (red). c, Confocal fluorescence images of FNT (green) and
MitoTracker Deep Red FM (red). Bars, 10 µm.

12
Supplementary Figure S12 | Co-visualization of FNT and organelles in living COS7
cells. a-c, Phase contrast images (left) and epi-fluorescence images (right) of FNT (green)
and CellLight BacMam 2.0 for lysosome C10597 (a, red), ER-tracker Red (b, red), or BODIPY
TR C5 ceramide complexed to BSA (c, red). The dyes stained lysosomes, endoplasmic
reticulum (ER), and the Golgi apparatus, respectively. Bars, 10 µm.

13
Supplementary Figure S13 | Response of fluorescence lifetime to temperature
variation in HeLa cell extracts. a, Calibration curve (closed, left axis) and temperature
resolution (open, right axis) of FPT. b, Relationship between the fluorescence lifetime of the
control copolymer and temperature. a,b, mean ± SD, n = 3.
14
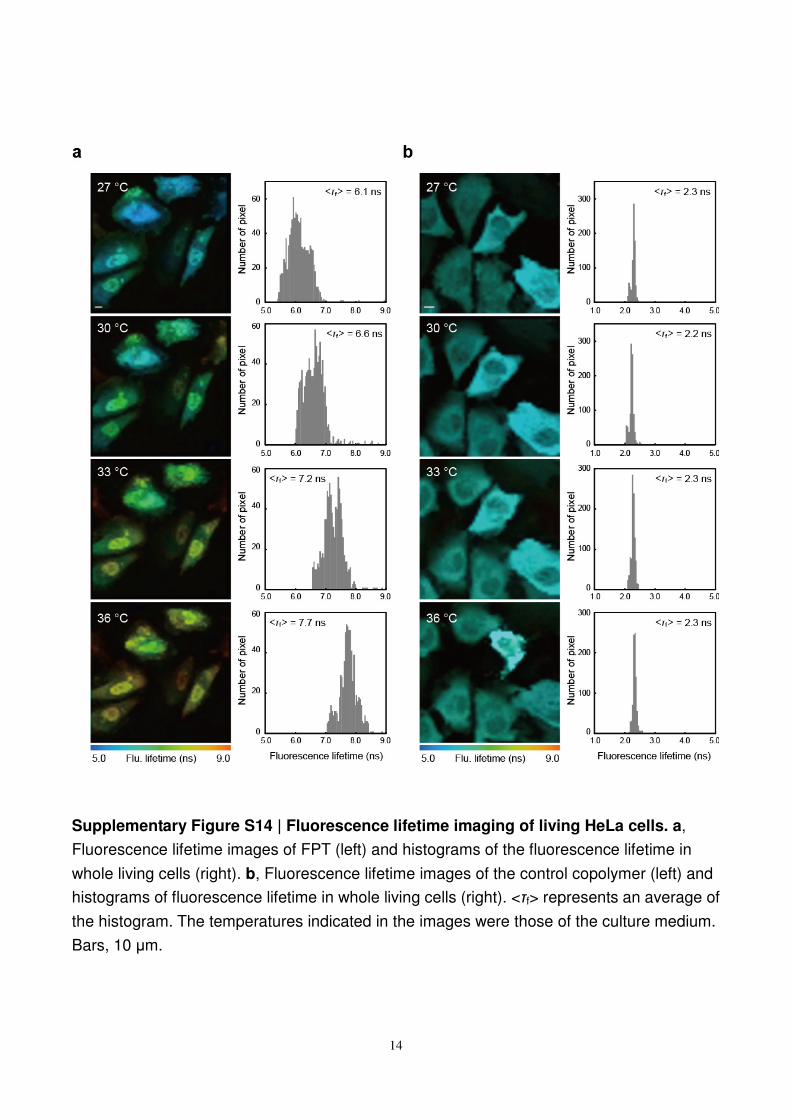
Supplementary Figure S14 | Fluorescence lifetime imaging of living HeLa cells. a,
Fluorescence lifetime images of FPT (left) and histograms of the fluorescence lifetime in
whole living cells (right). b, Fluorescence lifetime images of the control copolymer (left) and
histograms of fluorescence lifetime in whole living cells (right). <τf> represents an average of
the histogram. The temperatures indicated in the images were those of the culture medium.
Bars, 10 µm.

15
Supplementary Figure S15 | Temperature imaging of organelles in living HeLa cells.
Confocal fluorescence image (left, bar, 10 µm), fluorescence lifetime image (middle) of FPT
and the histogram of the temperature difference between the nucleus and the cytoplasm (right,
n = 59). ∆Temperature was calculated by subtracting the average temperature of the
cytoplasm from that of the nucleus with the potential maximum error of 0.25 °C. <∆T>
represents an average of the histogram. The medium temperature was maintained at 30 °C.
Bar, 10 µm.
16
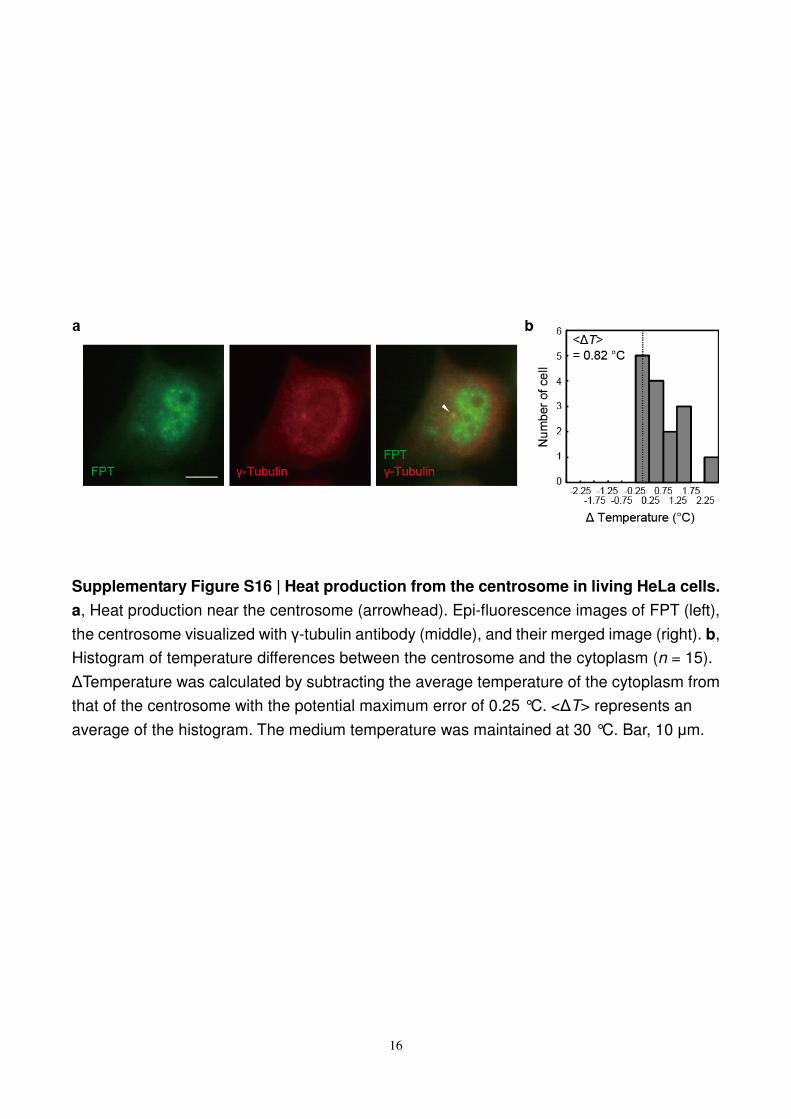
Supplementary Figure S16 | Heat production from the centrosome in living HeLa cells.
a, Heat production near the centrosome (arrowhead). Epi-fluorescence images of FPT (left),
the centrosome visualized with γ-tubulin antibody (middle), and their merged image (right). b,
Histogram of temperature differences between the centrosome and the cytoplasm (n = 15).
∆Temperature was calculated by subtracting the average temperature of the cytoplasm from
that of the centrosome with the potential maximum error of 0.25 °C. <∆T> represents an
average of the histogram. The medium temperature was maintained at 30 °C. Bar, 10 µm.
17
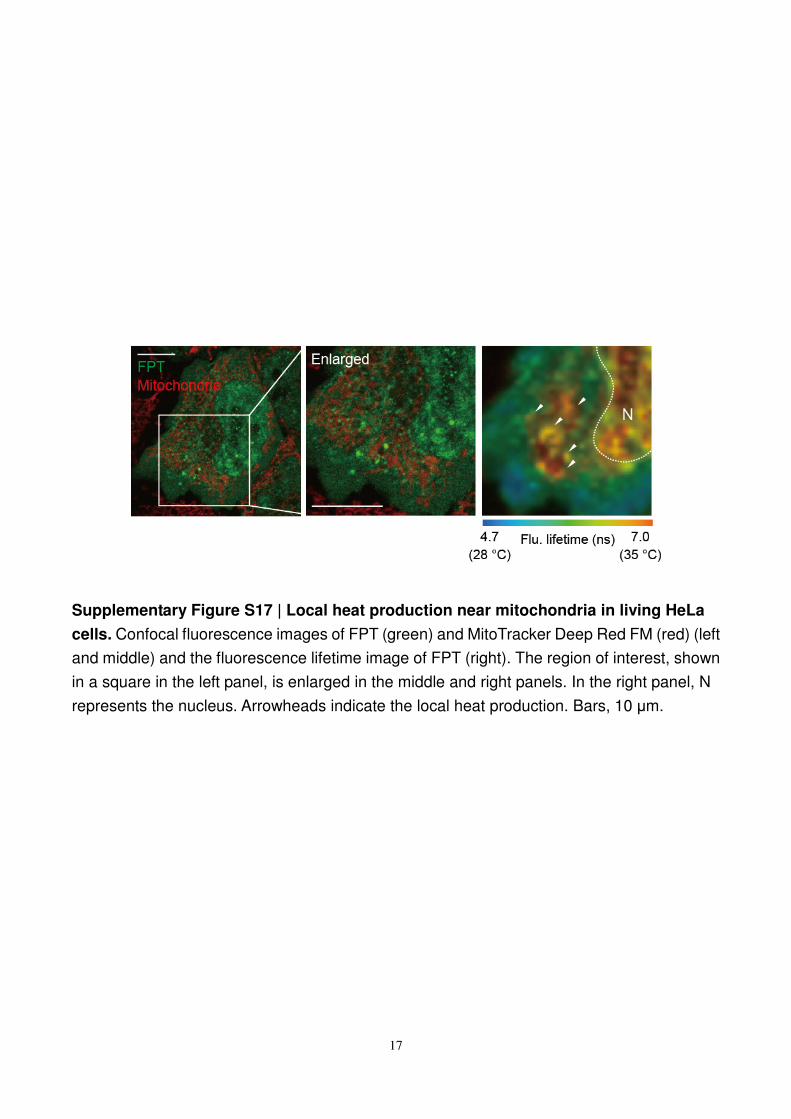
Supplementary Figure S17 | Local heat production near mitochondria in living HeLa
cells. Confocal fluorescence images of FPT (green) and MitoTracker Deep Red FM (red) (left
and middle) and the fluorescence lifetime image of FPT (right). The region of interest, shown
in a square in the left panel, is enlarged in the middle and right panels. In the right panel, N
represents the nucleus. Arrowheads indicate the local heat production. Bars, 10 µm.
18
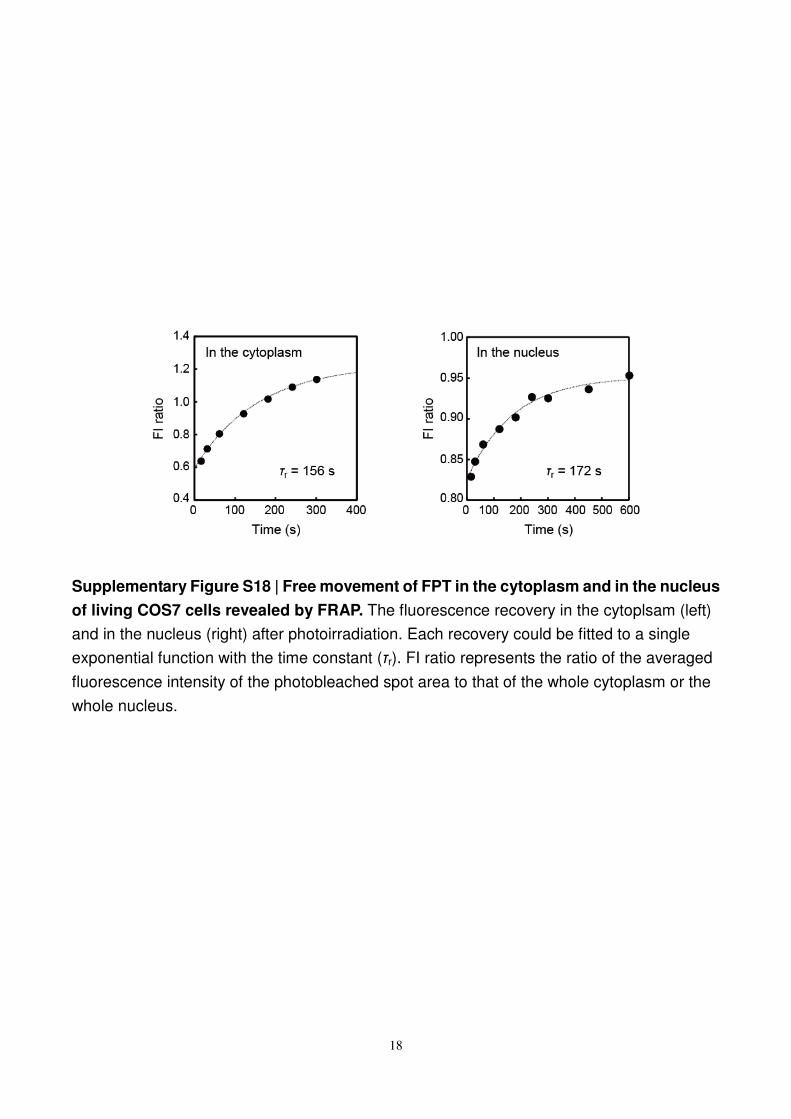
Supplementary Figure S18 | Free movement of FPT in the cytoplasm and in the nucleus
of living COS7 cells revealed by FRAP. The fluorescence recovery in the cytoplsam (left)
and in the nucleus (right) after photoirradiation. Each recovery could be fitted to a single
exponential function with the time constant (τr). FI ratio represents the ratio of the averaged
fluorescence intensity of the photobleached spot area to that of the whole cytoplasm or the
whole nucleus.

19
Supplementary Figure S19 | Insufficient photon count in the peripheral regions of the
cells. Fluorescence lifetime image (left) and fluorescence decay curves (right) obtained at the
pixels in the nucleus (N), the cytoplasm (C) and the cell periphery (P) indicated by crosses (+)
in the fluorescence lifetime image. The photon count at the cell periphery was not sufficient for
acquiring reliable fluorescence lifetime.

20
Supplementary Methods
Fluorescence measurements with a spectrofluorometer. Fluorescence spectra were obtained using
an FP-6500 spectrofluorometer (JASCO) with an optional R-7029 photomultiplier tube (Hamamatsu,
operative range: 200–850 nm). The temperature was controlled by an ETC-273T controller (JASCO)
and monitored with a platinum resistance thermometer. The samples (0.001 w/v%) were equilibrated
at each temperature for at least 1 min. Bovine serum albumin (BSA, Sigma) was used in the solution to
study the effect of co-existing proteins. The fluorescence quantum yield was determined with
4-methylamino-7-nitro-2,1,3-benzoxadiazole (0.38 in acetonitrile with excitation at 458 nm47
) as a
reference.
Cell culture. COS7 cells (African green monkey SV40-transformed kidney fibroblast cell line) and
HeLa cells (human epithelial carcinoma cell line) were cultured on a 35 mm glass base dish (No.
3910-035, ASAHI Techno GLASS) in Dulbecco’s Modified Eagle Medium (DMEM, Gibco No.
11965), supplemented with 5% fetal bovine serum (Gibco), penicillin–streptomycin (Gibco),
L-glutamine (Gibco), sodium pyruvate (Gibco) and non-essential amino acids (Gibco). Before live cell
imaging, the medium was replaced by phenol red-free culture medium (2 mL, Gibco No. 21063 was
used instead of No. 11965 in the above recipe). Cell cycles were synchronized to G1 and S/G2 phases
using thymidine (Sigma)–nocodazole (Sigma) and thymidine, respectively48
.
Temperature imaging of living HeLa cells. The procedures for temperature imaging of COS7 cells
were also used for HeLa cells. The calibration curve for the temperature imaging of HeLa cells was
τf(T) = 1.841 × 10⁻⁶
T6 − 5.257 × 10
−4 T
5 + 5.789 × 10
−2 T
4 − 3.236 T
3
+ 9.822 × 101 T
2 − 1.548 × 10
3 T + 9.946 × 10
3 (S1)
Study on the effects of environmental viscosity on the fluorescence response of FPT. The
mobility of FPT in living cells was investigated by fluorescence recovery after photobleaching
(FRAP). In the FRAP experiments49
, a small round area in living COS7 cells microinjected with FPT
was photobleached for 10 seconds with the sapphire laser light (Model 488-30 CDRH, Coherent)
focused onto the area either in the cytoplasm or in the nucleus, followed by time-lapse
epi-fluoresccence imaging (described in Methods) over 5 minutes (in the cytoplasm) or 10 minutes
(in the nucleus) with a Q505LP dichroic mirror (Chroma technology) and a HQ535/50X emission
filter (Chroma technology). In the image analysis, the fluorescence recovery was determined using
the ratio of the averaged fluorescence intensity of the photobleached spot area to that of the whole
cytoplasm or the whole nucleus calculated for each time point after the subtraction of the averaged
background intensity. The time course of fluorescence recovery (F(t)) was fitted by a single
exponential function using KaleidaGraph 3.6 (Synergy Software):
F(t) = − B1 exp(−t/τr) + B2 (S2)
The effects of environmental viscosity on the fluorescence lifetime of FPT were studied using

21
Ficoll solutions with various concentrations. In the fluorescence lifetime measurements, FPT (0.002
w/v%) and Ficoll (0–35 mg/mL, Sigma) were dissolved in 150 mM KCl solution. The fluorescence
lifetime of the solution was measured using a FluoroCube 3000U with an ETC-273T temperature
controller. The samples were excited with a light emitting diode (NanoLED-460, Horiba, 456 nm) at a
repetition rate of 1 MHz, and emissions from 574 to 576 nm were collected. The viscosity of the
solution was measured using a torsional oscillation viscometer VM-10A-L (Sekonic).
Supplementary References
47. Uchiyama, S., Santa, T. & Imai, K. Fluorescence characteristics of six 4,7-disubstituted
benzofurazan compounds: an experimental and semi-empirical MO study. J. Chem. Soc., Perkin
Trans. 2 2525–2532 (1999).
48. Whitfield, M. L. et al. Identification of genes periodically expressed in the human cell cycle and
their expression in tumors. Mol. Biol. Cell 13, 1977–2000 (2002).
49. Meyvis, T. K. L., De Smedt, S. C., Oostveldt, P. V. & Demeester J. Fluorescence recovery after
photobleaching: a versatile tool for mobility and interaction measurements in pharmaceutical
research. Pharm. Res. 16, 1153–1162 (1999).