supplementary assessment reportgis.geosurv.gov.nl.ca/geofilepdfs/batch2017/lab_1700.pdf · and...
TRANSCRIPT

Supplementary Assessment Report
NI 43-101 Technical Report, Resource Estimation
Howells Lake Properties:
021228M, 8th
year
020411M, 2nd
year
Howells River North Properties:
015977M, 12th
year
018380M, 3rd
year
020427M, 2nd
year
020412M, 2nd
year
NTS Map Sheets: 23O03, 23J14
T (BK) Balakrishnan, P. Geo
Chief Geologist, New Millennium Iron Corp.
New Millennium Iron Corporation
Assessment Report June 2013
i
Table of Contents
1.0 Project Summary .................................................................................................................. 1
2.0 Summary of Expenditures and Cost Breakdown ................................................................. 2
Appendix A: Figure 1 – Howells River North & Howells Lake ................................................. A1
Appendix B: SGS NI 43-101 Amended Technical Report Resource Estimation ......................... B1

New Millennium Iron Corporation
Assessment Report June 2013
1
1.0 Project Summary
New Millennium Iron Corp. (“NML”) drilled in 2012 the Howells Lake and Howells River
North properties which coincide with prominent airborne magnetic anomalies. This area formed
part of a high resolution magnetic survey conducted by Fugro Airborne Surveys of Ottawa,
Ontario, over the Millennium Iron Range (“MIR”). The drilling revealed the presence of a
continuous magnetite rich taconite ore body over a length of approximately 8 km with an
average width of 4.5 km, between the KéMag (QC) and LabMag (NL) properties. NML
submitted an assessment report on the drilling program to the NL Government (March 11, 2013)
NML engaged SGS Canada Inc. to prepare a NI 43-101 compliant Resource Estimates for both
the Howells Lake and Howells River North properties. Maxime Dupéré, P. Geo, submitted a
report “NI 43-101 Amended Technical Report: Resource Estimation, Howells Lake and Howells
River North Properties, Labrador, Canada” on June 10th
, 2013. This report was filed on SEDAR
and appended to this Supplementary Assessment Report.
The licenses included in the Howells Lake Property are: 015976M, 020411M, 018113M and
018379M. The licenses included in the Howells River North Property are: 015977M, 018380M,
020427M and 020412M. The total claims that make up these licenses are 143 and 309
respectively.
The Technical Report gives the following Resource estimates at a DTWR cut-off grade of
18.00% for the Howells Lake and Howells River North Properties.
Table 1: Estimated Resources Howells Lake
COG Category Volume Tonnage Density Fe Head Wt. Rec. Fe_C SiO2_C
Wt. Rec(%) (Mm³) (Mt) (t/m³) % % % %
18 Indicated 1,937 6,502 3.36 30.31 28.72 69.65 2.63
18 Inferred 219 734 3.35 30.07 25.89 69.67 2.69
Table 2: Estimated Resources Howells River North
COG Category Volume Tonnage Density Fe Head Wt. Rec. Fe_C SiO2_C
Wt. Rec(%) (Mm³) (Mt) (t/m³) % % % %
18 Indicated 335 1,129 3.37 30.87 29.83 69.86 2.40
18 Inferred 772 2,576 3.34 29.77 27.56 69.84 2.50

New Millennium Iron Corporation
Assessment Report June 2013
2
Table 3: Combined Estimated Resources, Howells Lake and Howells River North
COG Category Volume Tonnage Density Fe Head Wt. Rec. Fe_C SiO2_C
Wt. Rec(%) (Mm³) (Mt) (t/m³) % % % %
18 Indicated 2,272 7,631 3.36 30.39 28.88 69.68 2.60
18 Inferred 991 3,310 3.34 29.83 27.19 69.80 2.54
2.0 Summary of Expenditures and Cost Breakdown
The cost of the program for Howells Lake property is $13,077.24 and $5,192.76 for Howells
River North property. The cost breakdown is based on the number of licenses and the total
claims in each license.
Table 4: Cost Breakdown
License No No. of Claims Costs Allotted ($) Property
015976M 88 8,042.50 Howells Lake
020411M 21 1,922.35 Howells Lake
018113M 12 1,098.49 Howells Lake
018379M 22 2,013.89 Howells Lake
Total 143 13,077.24 Howells Lake
015977M 256 4,302.09 Howells River North
018380M 29 487.35 Howells River North
020427M 1 16.81 Howells River North
020412M 23 386.52 Howells River North
Total 309 5,192.76 Howells River North

New Millennium Iron Corporation
Assessment Report June 2013
A1
Appendix A: Figure 1 – Howells River North & Howells Lake

FILE, VERSION, DATE, AUTHOR/FICHIER, VERSION, DATE, AUTEUR:
SOURCES:
0 2.5 51.25
KILOMETRES/KILOMÈTRES
UTM 19N NAD 27
FSCALE/ÉCHELLE:
1:100,000
GIS-0392-01 , 2013-06-17 , L.C.
CONFIDENTIAL & COMMERCIALLY PROTECTEDCONFIDENTIEL & PROTÉGÉ COMMERCIALEMENT
New Millennium Iron Corp.Gov. NL - GEOSURVGov. QC - GESTIMGroupe Hémisphères
021228M
015977M
018380M
020412M
020411M
020427M
023J14
023O03
023J13
67°10'W
67°10'W
67°15'W
67°15'W
67°20'W
67°20'W
67°25'W
67°25'W
67°30'W
67°30'W55
°5'N 55
°5'N
55°N
55°N
54°5
5'N 54°5
5'N
600000
600000
610000
610000
6080
000
6080
000
6090
000
6090
000
6100
000
6100
000
QC
NL
Location/Localisation
LEGEND/LÉGENDEBorder/Frontière: Québec - LabradorClaim: Howells Area/la région HowellsClaim: DSOClaim: Taconite & other/autreClaim: other owner/autre détenteurNTS Map Sheet Index
Figure 1: Howells River Northand Howells Lake Claims

New Millennium Iron Corporation
Assessment Report June 2013
B1
Appendix B: SGS NI 43-101 Amended Technical Report Resource Estimation

Respectfully Submitted To: New Millennium Iron Corp.
Amendment Date:
June 10th, 2013
Effective Date: April 30th, 2013
Prepared By:
Maxime Dupéré P.Geo.
NI 43-101 Amended Technical Report: Resource Estimation
Howells Lake and Howells River North Taconite Properties
Labrador, Canada
Minerals Services 10 boul. de la Seigneurie Est, Suite 203, Blainville, Québec Canada, J7C3V5
t (450) 433 1050 f (450) 433 1048 www.geostat.com www.sgs.com
Member of SGS Group (SGS SA)
SGS Canada Inc.

Resource Estimation of the Howells Taconite Properties Page ii
SGS Canada Inc.
Table of Contents
1 Summary ...................................................................................................................................................... 1
2 Introduction .............................................................................................................................................. 11
2.1 General ............................................................................................................................................... 11 2.2 Terms of Reference .......................................................................................................................... 11 2.3 Source of Information ..................................................................................................................... 11 2.4 Currency, Units, abbreviations and Definitions ........................................................................... 12
3 Reliance on Other Experts...................................................................................................................... 13
4 Property Description and Location ....................................................................................................... 14
4.1 Location and Ownership ................................................................................................................. 14 4.2 Property Description and Ownership ........................................................................................... 16 4.3 Permits ................................................................................................................................................ 16
5 Accessibility, Climate, Local Resources, Infrastructure and Physiography...................................... 19
5.1 Accessibility ....................................................................................................................................... 19 5.2 Climate................................................................................................................................................ 19 5.3 Local Resources and Infrastructure ............................................................................................... 19 5.4 Physiography ..................................................................................................................................... 20
6 History........................................................................................................................................................ 21
6.1 IOCC Field Work ............................................................................................................................. 21
7 Geological Setting and Mineralization................................................................................................... 22
7.1 Regional Geology .............................................................................................................................. 22 7.2 Property Geology .............................................................................................................................. 25
7.2.1 General........................................................................................................................................ 25 7.2.2 Lithology ..................................................................................................................................... 27 7.2.3 Structure ..................................................................................................................................... 28 7.2.4 Mineralization ............................................................................................................................ 28
8 Exploration ................................................................................................................................................ 30
8.1 Exploration 2008 – 2009, Licence 015977M ................................................................................ 30 8.2 Exploration 2008 - 2009, licence 015976M .................................................................................. 31 8.3 Exploration 2010 .............................................................................................................................. 32
9 Drilling ....................................................................................................................................................... 34
10 Sample Preparation, Analyses and Security ...................................................................................... 36
10.1 NML QA/QC ............................................................................................................................... 36 10.1.1 Duplicate samples at MRC ...................................................................................................... 36
11 Data Verification .................................................................................................................................. 39
11.1 SGS independent sampling and assaying ................................................................................... 39
12 Mineral Processing and Metallurgical Testing .................................................................................. 42

Resource Estimation of the Howells Taconite Properties Page iii
SGS Canada Inc.
13 Mineral Resource Estimates ................................................................................................................ 43
13.1 Drill Hole and Sample Data ........................................................................................................ 43 13.2 Specific Gravity ............................................................................................................................. 44 13.3 Lateral Extent of Deposit ............................................................................................................ 46 13.4 3D Modeling .................................................................................................................................. 48 Compositing, and Statistical Analysis ........................................................................................................ 50 13.5 Block Grade Interpolation ........................................................................................................... 57 13.6 Block Categorization and Mineral Inventory ............................................................................ 65 13.7 Estimated Resources .................................................................................................................... 69
14 Adjacent Properties .............................................................................................................................. 76
15 Other Relevant Data and Information .............................................................................................. 78
16 Interpretation and Conclusions .......................................................................................................... 79
17 Recommendations ................................................................................................................................ 81
18 References .............................................................................................................................................. 82
19 Certificate of Qualified Person ........................................................................................................... 84

Resource Estimation of the Howells Taconite Properties Page iv
SGS Canada Inc.
List of tables
Table 2-1: List of Abbreviations .................................................................................................................... 12 Table 4-1: Summary of NML Licences Holding at Howells Lake and Howells River North.............. 16 Table 7-1: Regional Stratigraphic Column ................................................................................................... 24 Table 7-2 Stratigraphic Sequence (Economic) Based on Drill Hole Intersections ................................ 27 Table 8-1: Surface Sample Location and Results ........................................................................................ 31 Table 9-1: Drilling Summary ......................................................................................................................... 34 Table 10-1 Statistics of NML Duplicated Data ........................................................................................... 37 Table 11-1: Statistics of SGS Check Sample Data ...................................................................................... 40 Table 13-1: Statistics of Drill Hole lithological Intervals ........................................................................... 44 Table 13-2: Summary of SG Regression....................................................................................................... 45 Table 13-3: Volumetric of the Lithological Units in the Resource Model .............................................. 48 Table 13-4: Statistics of Sample Data According to Lithological Units................................................... 52 Table 13-5: Statistics of Composites According to Lithological Units .................................................... 52 Table 13-6: Block Model Origin .................................................................................................................... 58 Table 13-8: Estimation Settings Search Parameters.................................................................................... 60 Table 13-9: Estimation Settings Ellipse Parameters. .................................................................................. 60 Table 13-10: Statistics of Interpolated Block values according to litho units ......................................... 62 Table 13-11: Mineral Inventory of Howells River North and Howells Lake at Various Weight
Recovery Cut-Offs ................................................................................................................................... 67 Table 13-12: Howells (All) Base Case (COG 15% WtRec) ....................................................................... 70 Table 13-13: Howells Lake Base Case MRE (COG 15% WtRec) ............................................................ 71 Table 13-14: Howells River North Base Case MRE (COG 15% WtRec)............................................... 71 Table 13-15: Howells (all) MRE (Previous COG 18% WtRec) ................................................................ 73 Table 13-16: Howells Lake MRE (Previous COG 18% WtRec) .............................................................. 74 Table 13-17: Howells River North MRE (Previous COG 18% WtRec) ................................................. 75 Table 16-1: Howells Lake & Howells River North Mineral Resources Estimates................................. 80

Resource Estimation of the Howells Taconite Properties Page v
SGS Canada Inc.
List of Figures
Figure 4-1: Howells Properties Location Map............................................................................................. 15 Figure 4-2: Howells River Properties & Others Owners ........................................................................... 18 Figure 7-1: Geological map of the Labrador Through ............................................................................... 23 Figure 7-2: Howells River and Howells Lake geology ................................................................................ 26 Figure 8-1: Taconite Targets on the Residual Magnetic Grid of Howells River and Howells Lake
Area ............................................................................................................................................................ 33 Figure 9-1: Drilling Program and Section Lines of Howells Area ............................................................ 35 Figure 10-1: Correlation Plots of Results from NML Duplicates ............................................................ 38 Figure 11-1: Correlation plots of results from SGS check samples ......................................................... 41 Figure 13-1: Map of Howells Properties Drill Holes.................................................................................. 46 Figure 13-2 Howells Lake & Howells River North Inferred and Indicated Zones ............................... 47 Figure 13-3 : Howells Modelled Area of Mineralized Lithological Units ............................................... 49 Figure 13-4 : Howells Combined 3D Model of Mineralized Lithological Units ................................... 50 Figure 13-5: Histogram of % Fe_Head Composites of Various Lithological Units .............................. 53 Figure 13-6: Histogram of %WtRec Composites of Various Lithological Units ................................... 54 Figure 13-7: Histogram of %Fe_C Composites of Various Lithological Units ..................................... 55 Figure 13-8: Histogram of %SiO2_C Composites of Various Lithological Units .................................. 56 Figure 13-9: Correlation of 6 m Composite Values in the LC Unit ......................................................... 57 Figure 13-10: LRGC Unit Block Estimates of a Bench ............................................................................. 63 Figure 13-11: Drill Sections through Block Model ..................................................................................... 64 Figure 13-12: Mineral Inventory with Weight Recovery Cut-Off ............................................................ 68 Figure 13-13 Perspective View of Optimized Pit Shell .............................................................................. 72 Figure 14-1: Map of adjacent Properties ...................................................................................................... 77

Resource Estimation of the Howells Taconite Properties Page 1
SGS Canada Inc.
1 Summary
This Technical Report is an amended report from the May 17th, 2013 dated Technical Report titled “NI 43-101 Technical Report: Resource Estimation Howells Lake and Howells River North Taconite Properties Labrador, Canada”. This amended Technical Report updates Table 13-16 and Table 13-17 as there were errors introduced in the stated mineral resources of Howells Lake and Howells River North at a cut-off grade (COG) of 18% Weight Recovery. Table 13-16 and Table 13-17 are there to show continuity with NML resources statement from past work on similar deposits and current stated mineral resources remain current at a COG of 15% Weight Recovery and do not differ from the previous Technical Report. The errors were strictly literal in nature and did not affect in any way the underlying work. None of the other sections of the report have been changed and remain current at the date of this report. The SGS office (SGS Geostat) in Blainville (QC), part of SGS Canada Inc. (“SGS”) was commissioned by New Millennium Iron Corp. (“NML”) on July 25th, 2012 to prepare an independent estimate of the mineral resources of their Howells Lake and Howells River North Taconite properties (“Properties” or “Property” or “Howells Properties”) in Labrador (NL) close to the northern Québec (QC) provincial boundary. The mineral resource estimate was completed by SGS Geostat based on data available from drilling data completed in the spring of 2011 and 2012. The mineral resource estimate was completed in accordance with National Instrument 43-101: Standards and Disclosure for Mineral Projects. This report represents the first NI 43-101 compliant resource estimation on the Howells Lake and Howells River North properties. This report on the mineral resource estimation of the Howells Properties was prepared by Maxime Dupéré, P. Geo. Mr. Dupéré is responsible for the data quality sections, the geological modelling and resource estimation. Mr. Dupéré visited the Property between August 20th to 22nd, 2012 for a review of exploration methodology, sampling procedures and; to conduct an independent check sampling of selected mineralized drill intervals. Property description and location The Howells Lake and Howells River North properties area is located approximately 47 km northwest of Schefferville, QC, 247 km north of Labrador City, NL and 547 km north of Sept-Îles, QC. The Properties are situated in unorganized territory, straddling NTS map sheets 23O03 and 23J14 and centered at 67°21’W, 55°01’N. There has been no mining activity on the Properties and as such there are no mine workings, tailings impoundment areas, waste piles or other infrastructure on or near the Property Accessibility, Climate, Local Resources, Infrastructure and Physiography Access to the exploration drilling area was by truck and snowmobile. A few lakes in the vicinity of the Properties are accessible from Schefferville via a chartered fixed-wing float aircraft, which NML used to support their 2011 and 2012 drilling programs along with a helicopter for drill crew moves. The Howells Lake, and Howells River North area has a sub-Arctic climate. There is ample room available on the Properties for the establishment of mining and processing operations, waste piles and a tailings management area. Topography is flat to gently rolling, with the occasional more precipitous area. The area is well drained, has a few swampy areas and is covered by sparse northern boreal forest consisting of stunted spruce, alders and willows.

Resource Estimation of the Howells Taconite Properties Page 2
SGS Canada Inc.
Regional geology The Howells Lake and Howells River North properties are located in the Churchill Province, of the Labrador Trough ("Trough") adjacent to Archean basement gneiss. The Trough comprises a sequence of Proterozoic sedimentary rocks, including iron formation, volcanic rocks and mafic intrusions. NML’s Howells Lake and Howells River North properties are located north of the Grenville Front in the Churchill Province where the Trough rocks have only been subject to greenschist or sub-greenschist grade metamorphism. The principal iron formation unit is known as the Sokoman Formation. Iron formations in this part of the Trough are taconites, which are weakly metamorphosed. Property geology and Mineralogy The taconite iron formation in the Howells Lake and Howells River North area is part of the Sokoman Formation occurring at the western margin of the trough. The taconite is well-exposed as a long linear belt 1.5 to 2.0 km wide for a total length of approximately 6 km in a northwest-southeast trend that constitutes the anomalous zone identified from airborne magnetic survey data. Within the Howells Lake and Howells River North properties the structure is very simple, the iron formation is generally northwest-southeast striking and dipping 5⁰ to 12⁰ to northeast. At the central part of the valley, Menihek Slate overlies the UIF. Within oxide iron formation units, the most notable feature in mineral composition is the changes from dominantly magnetite (LC) to dominantly hematite/magnetite (URC, JUIF), and corresponding change of the silica from chert over to jasper. These oxidation potential variations and changes in iron grade define the member lithology units. The occurrence of iron carbonate minerals, principally siderite, ferro-dolomite and ankerite are widespread but are more abundant in the upper (LC) and lower (LRGC) units. Iron silicates, minnesotaite and stilpnomelane occur in LC, GC and LRGC units. These features all appear to be related to primary deposition. Folds, where present, are broad monoclonal flexures with low amplitudes and shallow dipping limbs. One fault with major displacement intersects the taconite formation. The fault is vertical with pronounced dextral displacement and trends in a northeast-southwest direction and parallel to the prominent joint directions. One major thrust fault on the east side of the Howells River was intersected in several drill holes. The movement along the thrust plane is considerable. The complete stratigraphic sequence is repeated on the east side of Howells River (tripled in one area). The contacts between the various units of the Sokoman Formation are gradational. The GC contacts with JUIF and URC are very sharp. The GC unit is a good marker horizon. The unit LRC is not traced throughout the property. It tends to grade into the LRGC unit. The contact between the Menihek Formation and the Sokoman Formation is a thrust fault. The slate shows high deformation near the contact. Exploration During 2010 New Millennium Iron Corp (“NML”) carried out Airborne High Resolution Magnetic Survey (“AM”) over the Millennium Iron Range (“MIR”) to identify additional, potential magnetic taconite deposits similar to the two deposits already proven in the MIR: LabMag in the Howells River Area and KéMag in Québec. The survey covered the taconite belt over a length of 150 km starting south of Perault Lake, to north of Lac Ritchie in Québec.

Resource Estimation of the Howells Taconite Properties Page 3
SGS Canada Inc.
The magnetic taconite formation of the MIR occurs as a linear strip approximately 4 km wide, starting west of Menihek Lake and extending northwest to Lac Otelnuk in Québec over a length of 210 km. The Airborne survey conducted by Fugro covers all the licences and claims west of longitude 67⁰W in NL and QC. Several strong magnetic anomalies were outlined by Jean Hubert, Geophysical Consultant for NML, who interpreted the survey data. Drilling In 2006 one hole, 06HR1279D, was drilled in this area to check the grade of the iron formation. In 2011, three (3) holes for a total of 347 m were drilled. A detailed exploration drilling program was undertaken in early June 2012 in the Howells Lake, Kivivic Lake AM anomaly area which encompasses licences 015976M, 018113M, 018379M, 015977M and 018380M. The area covered by the major part of the drilling is approximately 8 km long and 4 km wide. The program started on 1st June with 2 drills provided by the contractor Downing Estate Drilling Ltd. of Grenville-Sur-la-Rouge, QC and finished on September 27th 2012. The drilling was carried out on a grid of lines spaced 1 km apart with 4 to 6 holes spaced 500 to 600 m on each section line. Prior to drilling all the holes were spotted on the ground using handheld GPS unit. During the 2012 program 1,010 half core samples and 41 half core duplicate samples were collected and sent to Midland Research Center (“MRC”), Nashwauk, Minnesota, USA, for Davis Tube testing and chemical analysis. The sample lengths varied from 1 to 6m. All the units were sampled individually. The duplicate samples were sent as a check under QA/QC program. The Certificate of Analysis provided by MRC is appended to the report. Fifty three (53) crude ore samples and 89 Davis Tube magnetite concentrate samples were sent by MRC to SGS, Lakefield, Ontario for whole rock analysis and elemental analysis respectively. QA/QC by NML and Data verification Over the course of the 2012 drilling and sampling program, NML sent 41 duplicate samples to the Midland Research Center lab. Those samples were taken from the second half of the core. At MRC, those samples were subjected to the same Davis Tube testing as the original half core for the same intervals. Duplicate samples were done on 31 of the 56 holes. Their length varies from 2.2 to 8.5 metres with an average of 5.4 metres. Most of duplicate samples are in the LRGC (8, PGC (8) and LC unit (8) followed by the JUIF (6), LIF units (5), URC (3) and GC units (3). Since most reported resources are in the LC, PGC and LRGC units with some in the URC unit (see section 13); future duplicate samples should concentrate on those units. During the site visit conducted from August 24th to 26th, 2012, SGS Geostat completed 32 analytical checks of drill core duplicate samples taken from selected NML 2012 diamond drill holes on the Howells River North property as well as the nearby Sheps Lake and Perault Lake properties (not part of this report) as part of the independent data verification program. SGS Geostat also conducted verification of the laboratories analytical certificates and validation of the data set supplied by NML for errors and discrepancies. A small bias was observed by SGS Geostat on Howells check sample data, but the relative difference between the two labs was on the order of only 1-2%, which is not considered consequential. %Fe_Head and %Fe_C, MRC values were almost systematically higher than SGS Lakefield values while for %WtRec and %SiO2_C, MRC values are almost systematically lower than SGS Lakefield values. These apparent differences between MRC and SGS are similar to observations on the Lac Ritchie and the Sheps & Perault properties owned by NML (see the corresponding SGS Geostat Technical Reports, 2012 and 2013) and may be linked to the way that quality is measured in the two labs (titration and thermo-

Resource Estimation of the Howells Taconite Properties Page 4
SGS Canada Inc.
gravimetry at MRC and XRF for SGS Lakefield). Although the standard operating procedures from MRC and SGS Lakefield are similar, some differences might have been unintentionally created from grinding (size reduction) or from calibration of the magnetic separator (Davis Tube) on either laboratory. A detailed investigation of these differences is recommended. Resource Estimation- General The mineral resources estimates (MRE) reported herein are derived from a computerized resource block model. The construction of the block model was built using drill hole data, serving as a basis for 3D definition of the 3D solids. The MRE were limited to the material inside the selected 3D solids. Regular length composites were created from the validated drill hole database. Block grade interpolation was done on a regular grid. A block percentage inside each of the 3D solids was also considered in the MRE. Blocks under the topographic Overburden/Bedrock contact were considered in the MRE. Classification was done according to proximity to composites and corresponding precision/confidence level. An optimized pit shell was done to verify the validity of the WtRec cut-off grade used (although not considered) in the MRE statement. Limits of Resource model The resource model corresponds to a sedimentary multilayered mineral deposit. Up to 7 layers corresponding to lithological units have been interpreted and modeled by NML geologists. Starting From top to bottom: LC = lean chert, JUIF = jasper upper iron formation, GC = green chert, URC = upper red chert, PGC = pink-green cherty, LRC = lower red chert and LRGC = lower red green chert. Units below LRGC (i.e. LIF, RS, BC and QTE) have not been modeled. They are present only in a few holes and do not show any obvious mineralization. NML produced 3D solids for each lithological unit. The bottom interpreted 3D solid of the resource model is the LRGC layer. All of the solids were verified by SGS Geostat. No major discrepancies were found. Resource Estimation- Assay data and compositing Most of samples are in the three units LC, PGC, and LRGC however all seven units were used in the block grade interpolation. The %Fe_Head averages about 30% to 32% in JUIF, URC, PGC, LRC and LRGC but it is lower in the LC marker horizon (28.3%) and much lower in the GC marker horizon (16.7% average). Average recovery is high in URC (31.3%) and PGC (32.5%), moderate to high in LC (24.9%), JUIF (25.6%), LRC (23.5%), and LRGC (26.5%), and expectedly low in GC (6.1%). The quality of the magnetic concentrates is about the same in all units, even in those with very low recoveries. For samples in all zones presented, the average %Fe_C is around 69%-71% and the average %SiO2_C between 2.2% and 3.3%. Although the majority of original samples are 6 metres long, there exists both some shorter and some longer samples. Therefore, statistics might be biased by some high or low values measured on short or long intervals. The standardization of sample size is done by numerical compositing. The most natural composite length is 6 m, which is the composite length of the majority of samples. Statistics of composite data in the seven units of interest are consistent with statistics of sample data in the same unit. Resource Estimation- Correlations and variography Correlations between composite values are about the same in all units. There is a correlation (R=+0.7) between WtRec and %Fe_Head. However no clear correlation between %Fe_Head and %Fe_C (R=+0.3). There is no correlation between %Fe_C and the WtRec thus indicating the quality of iron concentrate has no bearing on the weight recovery. There is a very strong and expected negative correlation (R=-0.79 to -0.94) between the %Fe_C and %SiO2_C.

Resource Estimation of the Howells Taconite Properties Page 5
SGS Canada Inc.
Resource estimation- Block interpolation The %Fe_Head, WtRec, Fe_C and SiO2_C were interpolated in blocks on a regular grid. That grid is oriented parallel to the drill sections i.e. columns are numbered along a rotated x-axis along the N56 azimuth and rows along a rotated y-axis along the N326 azimuth. The origin of the grid i.e. the center of the block in the first column (numbered from west to east) and first row (numbered from south to north) has the following UTM coordinates: 604,000 mE and 6,095,000 mN. The selected block size is 25 m along the rotated x and 50 m along the rotated y. That size is obviously tiny when compared to the drill hole grid of 500 m x 1000 m. The main reason to choose blocks with such a small size is to better reflect the geometry of litho units slowly dipping to the NE. It is also the size of blocks used in the resource modeling of the LabMag and KéMag deposits further to the south and to the north which both belong to NML – see Geostat (2005) and Geostat (2007a). Vertically, blocks are 15 m high. Although the bench heights previously used for the KéMag and LabMag Pre-Feasibility studies was 13 m, the most recent work by mining consultant Met-Chem on those projects has suggested that a bench height of 15 m would be more suitable. All together, the mineral deposit is covered by blocks in up to 263 columns, 224 rows and 41 benches from elevations z=100 to z=700 (Each block per each lithological units above the footwall of LRGC i.e. LC, JUIF, GC, URC, PGC, LRC, and LRGC). Secondly, the four quality parameters were interpolated from the lithological unit composite data. The interpolation method used was inverse distance squared (ISD2). With sample data on a regular grid (no sample clustering in high grade), low nugget effects and long ranges, ISD2 is known to provide block estimates very similar to ordinary kriging (OK). The basic search ellipsoid is a flat 1200m x 600m x 50m tilted by 6° to the N56 (a review of interpreted litho units on sections shows an average 6° dip angle for most of the units). The 1200 m x 600 m elliptic outline on sub-horizontal planes is designed to capture composites from at least 4 neighbor holes on the 1000x500 m nominal grid. In the first interpolation pass, a minimum of 5 composites was needed (3 in GC, URC and LRC units) in a minimum of 3 drill holes (maximum number of composites from the same drill hole is 2) within the 1200 m x 600 m x 50 m ellipsoid for allowing the block to be interpolated. The maximum number of composites retained was 25 (15 in GC, URC and LRC units). In LC, 35% of the blocks are interpolated in the first pass. Blocks that did not meet the minimum requirements of the first pass were interpolated in the second pass with a 2400 m x 1200 m x 100 m ellipsoid of similar orientation and parameters except of a minimum maximum number set to 30 (20 in GC, URC and LRC units) in at least 3 drill holes within the larger ellipsoid. In LC, 52.5% of the blocks are interpolated in the second pass. The remaining un-interpolated blocks were interpolated in a third and last pass with a 4800 m x 2400 m x 200 m ellipsoid and a minimum number of composites and holes being one. Resource Estimation- Categorization The Howells lake and Howells River North magnetite bearing taconite formation is currently recognized by 56 vertical drill holes on the database, on a grid of 1km by 0.5 km, 4 of which were abandoned or do not have any assays. The drill hole database covers a NW-SE area with a strong magnetic anomaly recognized by the Fugro airborne survey of 2010. This area is crossed by a major fault zone easily recognizable from the survey. The area is also affected by a major thrust fault with a northwest-southeast trend which pushed a whole sequence above the west side band. The geological continuity of the mineralized units has been demonstrated by the results from the 56 holes. In most holes with the occasional disappearance of the marker horizon of the thinner units (predominantly GC, URC, PGC and LRC), the stratigraphic sequence of (from top to bottom) LC + JUIF + GC + URC + PGC + LRC + LRGC can be recognized with similar thickness data for all intercepts in the same unit. That stratigraphic sequencing is not arbitrary since it is supported by a

Resource Estimation of the Howells Taconite Properties Page 6
SGS Canada Inc.
mineral signature particular to each unit i.e. medium Fe + med magnetite in LC, high Fe + high magnetite in JUIF, low Fe + low magnetite in GC, high Fe + medium-high magnetite in URC, medium Fe + medium-high magnetite in PGC, high Fe + high magnetite in LRC, high Fe + medium-high magnetite in LGRC. Given the well-documented geological interpretation of the area by the Company, the relatively low variability of the Fe_Head data, and the overall continuity of the mineralization between sections and the 56 holes on the 1000 m x 500 m grid, the qualified person classified the mineralized material recognized by those holes in the indicated category. Hence the mineral inventory made of blocks within the 500 m x250 m cells of influence of holes is classified as indicated. The remaining mineral inventory was classified in the inferred category. The average value of %Fe_Head, WtRec, Fe_C and SiO2_C was interpolated for the unit fraction in each block (25m x 50m x 15m) of the resource model. Interpolation was done separately on the selected lithological units (layers) by inverse squared distance from calculated length 6 m composites. The geological interpretation and grade continuity (Fe_Head) allowed classifying all the blocks within the 1 x 0.5 km classification contour over all of any given hole into the inferred category. Blocks within a 500 m to 250 m contour were classified as indicated for a total of two areas. The block Unit volumes were converted into tonnages using a calculated density for every block according to % Fe_Head. The calculated densities were derived from a linear regression formula based on % Fe_Head but restricted to each unit. The measurements made on the similar deposit (LabMag & KéMag) which is under feasibility on the specific unit vary from an average of 3.29 t/m3 in LC, 3.43 t/m3 in the JUIF, 3.15 t/m3 in the GC, 3.53 t/m3 in URC, 3.43 t/m3 in the PGC, 3.40 t/m3 in the LRC and finally 3.33 t/m3 in LRGC. The calculated densities show a strong to moderate correlation with the %Fe of head but are not derived directly from the Howells Properties deposits. Resource Estimation- Final estimates SGS Geostat considers that mineral resources (MRE) defined at Howells are meeting the requirement of a reasonable prospect for economic extraction. Traditionally, the cut-off used by NML to report MRE in the taconite deposits of the Labrador Trough is a minimum 18% weight recovery of the magnetic concentrate from Davis Tube test on material ground to 325 mesh (see WGM (2006), Geostat (2007a+b) and BBA (2009)). According to BBA (2009) the unit cost and concentrate values used in the PFS of KéMag suggest a lower marginal cut-off (such that the concentrate value pays for the processing cost to produce that concentrate). In that study, a pit optimization is run with a C$4.03/t ROM total processing + G&A cost and a concentrate value of C$49.92/t CC (unit mining cost is C$1.75/t ROM) hence a marginal weight recovery cut-off of : 4.03/49.92 = 8%. For Howells, NML is currently proposing the following tentative parameters: concentrate value = $68.41/t CC, crushing and concentration = $11.45/t CC, concentrate handling (pipeline + filtration + port/loading) + G&A = $3.21/t CC, mining cost (ore and waste) = $2.50/t ROM and mining cost (overburden) = $1.70/t OVBD. Given that the crushing and concentration cost is given for an average weight recovery of 28% (above the traditional COG of 18%), it translates into a crushing + concentration cost of: 11.45*0.28 = $3.21/t ROM hence a marginal cut-off of: 3.21/ 68.41 = 4.69%. SGS Geostat has run a Whittle optimized pit shell based on the mineral inventory. The optimized pit shell includes most of the mineral inventory and 89% of all blocks with an estimated weight

Resource Estimation of the Howells Taconite Properties Page 7
SGS Canada Inc.
recovery above 15% recovery cut-off. As a result, the proposed MRE for Howells are made of all the blocks of the mineral inventory above 15% minimum recovery cut-off (not restrained by any pit shell). As expected from the statistics of sample data in each unit, there are no resources above 15% recovery in the GC. The 0 tonnage in the following tables for the indicated GC unit in the following tables corresponds to a tonnage less than 500,000 tonnes and is therefore described as 0. The 0 tonnage in the indicated and inferred LRC Units in correspond absence of material above COG. Further work is required to potentially upgrade these mineral resources to mineral reserves, and it has not yet been demonstrated that these mineral resources have economic viability.

Resource Estimation of the Howells Taconite Properties Page 8
SGS Canada Inc.
Estimated Resources Howells Lake
COG Category Volume Tonnage Density Fe_Head WtRec Fe_C SiO2_C
WtRec(%) (Mm3) (Mt) (t/m
3) % % % %
15 Indicated 2,081 6,972 3.35 30.10 27.91 69.61 2.67
15 Inferred 251 838 3.34 29.97 24.75 69.67 2.68
Estimated Resources Howells River North
COG Category Volume Tonnage Density Fe_Head WtRec Fe_C SiO2_C
WtRec(%) (Mm3) (Mt) (t/m
3) % % % %
15 Indicated 339 1,143 3.37 30.82 29.67 69.85 2.40
15 Inferred 836 2,783 3.33 29.55 26.75 69.82 2.51
Estimated Resources Howells Lake & Howells River North
COG Category Volume Tonnage Density Fe_Head WtRec Fe_C SiO2_C
WtRec(%) (Mm3) (Mt) (t/m
3) % % % %
15 Indicated 2,420 8,115 3.35 30.20 28.16 69.64 2.63
15 Inferred 1,087 3,621 3.33 29.65 26.29 69.78 2.55
Dated April 30th, 2013
Estimated resources of the Howells Lake and Howells River North Properties
Conclusions and Recommendations New Millennium Iron Corp. (NML) holds the 11,300 ha Howells Lake and Howells River North properties about 47 km to the northwest of Schefferville in Labrador and along the so-called Millennium Iron Range (MIR) that comprises their LabMag and KéMag deposits to the southeast and extends to the Lac Otelnuk deposit of Adriana Resources to the northwest. On these properties, NML has drilled a 9 km stretch of the MIR corresponding to a strong magnetic anomaly recognized by a 2010 airborne survey by Fugro. 56 vertical holes totaling 8,060.8 m have been drilled on 9 SW-NE sections 2 km apart, mostly having at least 5 holes per section; and on 2 SW-NE intermediate sections 1km apart and with a spacing of about 0.5 km between one or two holes on the same section (average of 2 drill holes per section). The logging and magnetic scanning of BQ and NQ drill cores has allowed establishing the stratigraphic sequence of the Sokoman and Ruth iron formations. The main unit is the top Lean Chert (LC) followed from top to bottom by the Jasper Upper Iron Formation (JUIF), the Green Chert (GC) marker horizon, the Upper Red Chert (URC) unit, the Pinky Green Cert (PGC) unit, the Lower Red Chert (LRC) unit and finally the Lower Red Green Chert (LRGC) unit for a total average thickness of about 70 m. The thickness of individual units does not vary much from hole to hole but is lost during several sections. However, the geological continuity over kilometric distances is well-demonstrated. The unit package dips gently by 6° to the northeast on all sections. The geological continuity of the mineralized units has been demonstrated by the results from the 56 holes. In most holes with the occasional disappearance of the marker horizon of the thinner units (predominantly GC, URC, PGC and LRC), the stratigraphic sequence of (from top to bottom) LC + JUIF + GC + URC + PGC + LRC + LRGC can be recognized with similar thickness data for all intercepts in the same unit. That stratigraphic sequencing is not arbitrary since it is supported by a mineral signature particular to each unit i.e. medium Fe + med magnetite in LC, high Fe + high magnetite in JUIF, low Fe + low magnetite in GC, high Fe + medium-high magnetite in URC, medium Fe + medium-high magnetite in PGC, high Fe + high magnetite in LRC, high Fe + medium-high magnetite in LGRC. Additionally, the presence of the thrust fault is well-defined from the drill hole geological information.

Resource Estimation of the Howells Taconite Properties Page 9
SGS Canada Inc.
Check samples were sent to the SGS Lakefield laboratory for preparation and Davis Tube testing with a protocol similar to that of the Midland Research Center laboratory. Results from SGS Lakefield related to the four variables (Fe_Head, WtRec, Fe_C and SiO2_C) were compared to MRC data. A bias was observed by SGS Geostat from test results on all of the four variables. The %Fe_Head MRC values were almost systematically higher than SGS Lakefield values while for the %WtRec MRC values were almost systematically lower than SGS Lakefield values. The % Fe_C MRC values were almost systematically higher than SGS Lakefield values. The %SiO2_C MRC values were almost systematically lower than SGS Lakefield values. These apparent differences between MRC and SGS Lakefield for all four variables are somewhat similar to observations on the Lac Ritchie and the Sheps & Perault properties owned by NML (see NML Technical Report, 2012 and 2013) and may be linked to the way that quality is measured in the two labs (titration and thermo-gravimetry at MRC and XRF for SGS Lakefield). Although the standard operating procedures from MRC and SGS Lakefield are similar, some differences might have been unintentionally created from grinding (size reduction) or from calibration of the magnetic separator (Davis Tube) on either laboratory. A detailed investigation of these differences is recommended. Previously, on other similar deposits owned by NML (LabMag and KéMag) as well as Adriana’s Lac Otelnuk, the MRE were a result of all blocks having a combined interpolated weight recovery (all units combined) above the traditional cut-off of 18% weight recovery. Given the most recent figures for concentrate values and unit processing costs, the 18% minimum weight recovery was reduced to 15%. A Whittle optimized pit shell based on those figures as well as a 50° maximum slope includes most of the indicated and inferred blocks of the mineral inventory above the 15% weight recovery cut-off, thus demonstrating their reasonable prospect of economic extraction. Hence the final estimated resources which appear in the next table are made of all the blocks above the 15% weight recovery cut-off and not restricted to any optimised shell. SGS Geostat offers the following recommendations for further evaluation of Howells Lake and Howells River North:
• Measured densities are currently restricted to the LabMag and KéMag properties based on the feasibility in 2012. SGS Geostat recommends carrying density measurements on the Howells Lake and Howells River North properties with standard water immersion of core fragments and pycnometer on pulps. If a higher confidence relationship can be made with more density measurements on individual samples in each unit, it could replace the ones used in the resource model to (1) better combine estimates of different litho unit fractions in the same block (2) have tonnage and, to some extent, weight recovery estimates above cut-off that would reflect a slight expected increase of density with the weight recovery cut-off since we have a mild positive correlation of weight recovery and %Fe_Head. We suggest submitting 250 pulps rejects (45 LC, 45 LRGC and at least 30 for the other units using a large range of %Fe_Head in each unit) to pycnometer measurement. These results would be used to build density regression formulas according to %Fe_Head in each unit. Affecting and updating each of the the current resource blocks. The estimated and conceptual cost of this operation is about CAD$15,000.
• An economic analysis (PEA or PFS) should be conducted with the current MRE. This study
would help determine with higher confidence the economic factors such as product value and unit mining/processing costs and lead to more robust affirmation that a realistic cut-off

Resource Estimation of the Howells Taconite Properties Page 10
SGS Canada Inc.
of 15% minimum weight recovery is adequate to report resources. The estimated and conceptual cost of the economic study is ranging from CAD$150,000 to CAD$275,000.
• Although the current data demonstrates sufficient geological and grade continuity for classification of all the material recognized by holes on the 1km x 0.5km grid in the indicated category, we recommend additional drilling before starting a preliminary feasibility study (PFS) with the current MRE. That program would have a magnitude similar to the 2012 drilling program of 25 additional NQ holes totaling about 2,500 m. The Half of them (10) would be drilled on the first 3 (2 km spaced) sections to the SE where only a few DDH are present. The drilling campaign should focus also on the drilling (10) of the present intermediate 500 m sections following the same spacing between holes. The aim is the better understanding of the geological model as well as the classification upgrade. The remaining meterage (5 DDH, 500 m) would be on the lateral limits of the fault present in the middle of the model for a better understanding its displacement. With 50% more data, geological discontinuities (barren dikes, faults, etc) may show up and the spatial distribution may change significantly. Also, with a 500m x 500m drilling grid, the indicated resources would have a drilling density similar to indicated resources of Lac Otelnuk, LabMag and KéMag deposits to the north, all in a similar geological environment. Moreover, the additional and validated data could allow reclassification to the SW from inferred to indicated resources. The estimated and conceptual cost for this additional drilling is about CAD$850,000.
• SGS Geostat recommends a detailed investigation of the differences between SGS and MRC check sampling results. At his stage the author is unable to estimate any costs for this study.

Resource Estimation of the Howells Taconite Properties Page 11
SGS Canada Inc.
2 Introduction
This Technical Report is an amended report from the May 17th, 2013 dated Technical Report titled “NI 43-101 Technical Report: Resource Estimation Howells Lake and Howells River North Taconite Properties Labrador, Canada”. This amended Technical Report updates Table 13-16 and Table 13-17 as there were errors introduced in the stated mineral resources of Howells Lake and Howells River North at a cut-off grade (COG) of 18% Weight Recovery. Table 13-16 and Table 13-17 are there to show continuity with NML resources statement from past work on similar deposits and current stated mineral resources remain current at a COG of 15% Weight Recovery and do not differ from the previous Technical Report. The errors were strictly literal in nature and did not affect in any way the underlying work. None of the other sections of the report have been changed and remain current at the date of this report.
2.1 General
This technical report was prepared by SGS Geostat for NML to support the first disclosure of mineral resources completed for the Howells Lake and Howells River North properties. The report describes the basis and methodology used for modeling and estimating of the Howells Lake and Howells River North resources. The report presents a summary of the history, geology, sample preparation and analysis, data verification, metallurgical work and resource estimations completed on the Howells Lake and Howells River North properties (“Properties” or “Property” or “Howells Properties”). The report also provides recommendations for future work.
2.2 Terms of Reference
This report was prepared by Maxime Dupéré, P.Geo. Mr. Dupéré is responsible for the site visit, independent sampling verification, resource estimation and all sections of this technical report. Mr. Dupéré acknowledges the help of Mr. Michel Dagbert, Eng. and senior geostatistician for SGS Geostat for his helpful advice on the mineral resource estimates in this technical report. This technical report was prepared according to the guidelines set under “Form 43-101F1 Technical Report” of National Instrument 43-101 Standards and Disclosure for Mineral Projects. The certificate of qualification for the Qualified Person responsible for this technical report have been supplied to NML as a separate document and can also be found at the very end of the report. Mr. Dupéré visited the Property between August 20th to 22nd 2012, for a review of exploration methodology, sampling procedures and to conduct an independent check sampling of selected mineralized drill intervals.
2.3 Source of Information
Information in this report is based on critical review of the documents, information and maps provided by personnel of NML, in particular T. (BK) Balakrishnan, P.Geo., Chief Geologist and

Resource Estimation of the Howells Taconite Properties Page 12
SGS Canada Inc.
Michael Spleit, Eng, Mining Engineer. Drilling data was provided by NML and validated against information obtained during the field visit and certificates from the analytical laboratories.
2.4 Currency, Units, abbreviations and Definitions
All measurements in this report are presented in the Système International d’Unités (SI) metric units, including metric tonnes (tonnes) or grams (g) for weight, meters (m) or kilometers (km) for distance, hectare (ha) for area, and cubic metres (m3) for volume. All currency amounts are Canadian Dollars (C$) unless otherwise stated. Abbreviations used in this report are listed in Table 2-1.
Table 2-1: List of Abbreviations
Tonnes or t Metric tonnes kg Kilograms g Grams km Kilometers m Meters µm Micrometers ha Hectares m³ Cubic meters % Percentage $ Dollars (CAD unless otherwise specified) ° Degree °C Degree Celsius ppm Parts per million BQ Drill core size (3.65 cm in diameter) NQ Drill core size (4.76 cm in diameter) SG Specific Gravity UTM Universal Transverse Mercator

Resource Estimation of the Howells Taconite Properties Page 13
SGS Canada Inc.
3 Reliance on Other Experts
The author of this Technical Report is not qualified to comment on issues related to legal agreements, royalties, permitting, and environmental matters. The author has relied upon the representations and documentations supplied by the Company’s management. The author assumes that the documents, reports and other data listed are substantially accurate and complete in all material aspects. The author has reviewed the mining titles (claims), their status, the legal agreement and technical data supplied by the Company, and any public sources of relevant technical information.

Resource Estimation of the Howells Taconite Properties Page 14
SGS Canada Inc.
4 Property Description and Location
4.1 Location and Ownership
The Howells Lake and Howells River North properties area is located approximately 47 km northwest of Schefferville, QC, 247 km north of Labrador City, NL and 547 km north of Sept-Îles, QC. The Properties are situated in unorganized territory, straddling NTS map sheets 23O03 and 23J14 and centered at 67°21’W, 55°01’N. There has been no mining activity on the Properties and as such there are no mine workings, tailings impoundment areas, waste piles or other infrastructure on or near the Property. The Property location is shown on Figure 4-1.

Resource Estimation of the Howells Taconite Properties Page 15
SGS Canada Inc.
Figure 4-1: Howells Properties Location Map
Resource Estimation of the Howells Taconite Properties Page 16
SGS Canada Inc.
4.2 Property Description and Ownership
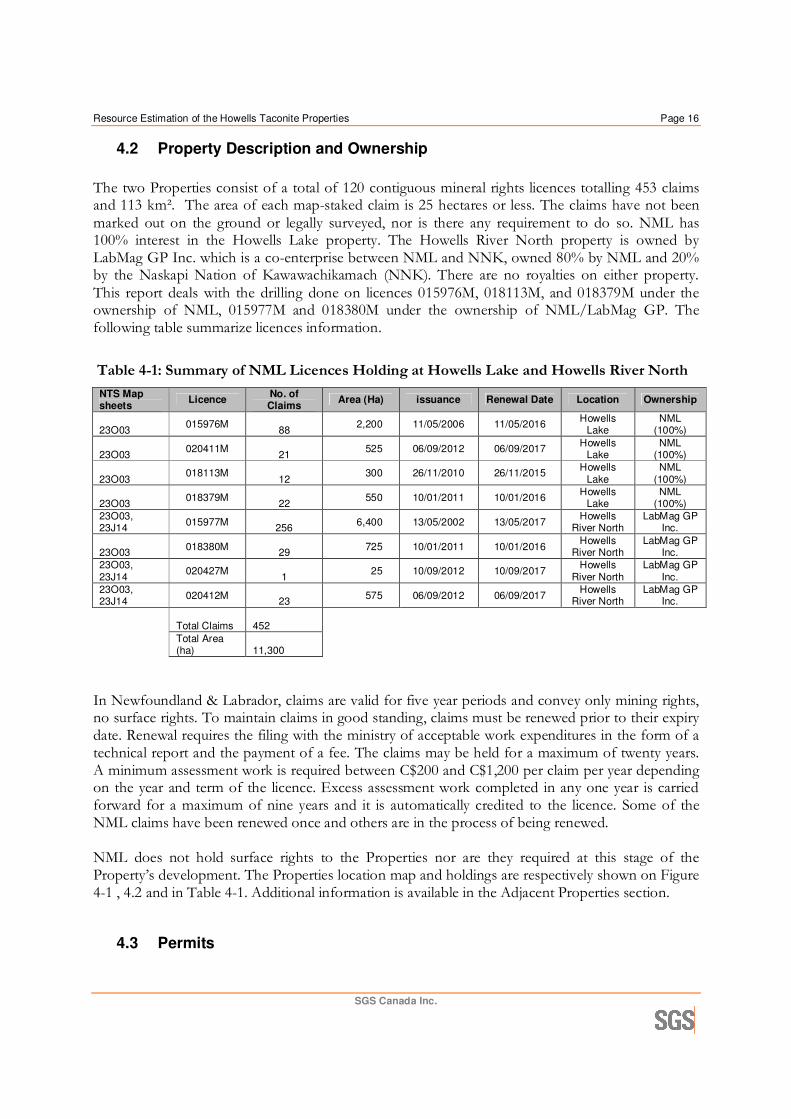
The two Properties consist of a total of 120 contiguous mineral rights licences totalling 453 claims and 113 km². The area of each map-staked claim is 25 hectares or less. The claims have not been marked out on the ground or legally surveyed, nor is there any requirement to do so. NML has 100% interest in the Howells Lake property. The Howells River North property is owned by LabMag GP Inc. which is a co-enterprise between NML and NNK, owned 80% by NML and 20% by the Naskapi Nation of Kawawachikamach (NNK). There are no royalties on either property. This report deals with the drilling done on licences 015976M, 018113M, and 018379M under the ownership of NML, 015977M and 018380M under the ownership of NML/LabMag GP. The following table summarize licences information.
Table 4-1: Summary of NML Licences Holding at Howells Lake and Howells River North
NTS Map sheets
Licence No. of Claims
Area (Ha) issuance Renewal Date Location Ownership
23O03 015976M
88
2,200 11/05/2006 11/05/2016 Howells
Lake NML
(100%)
23O03 020411M
21
525 06/09/2012 06/09/2017 Howells
Lake NML
(100%)
23O03 018113M
12
300 26/11/2010 26/11/2015 Howells
Lake NML
(100%)
23O03 018379M
22
550 10/01/2011 10/01/2016 Howells
Lake NML
(100%)
23O03, 23J14
015977M
256 6,400 13/05/2002 13/05/2017
Howells River North
LabMag GP Inc.
23O03 018380M
29
725 10/01/2011 10/01/2016 Howells
River North LabMag GP
Inc.
23O03, 23J14
020427M
1 25 10/09/2012 10/09/2017
Howells River North
LabMag GP Inc.
23O03, 23J14
020412M
23 575 06/09/2012 06/09/2017
Howells River North
LabMag GP Inc.
Total Claims 452
Total Area (ha)
11,300
In Newfoundland & Labrador, claims are valid for five year periods and convey only mining rights, no surface rights. To maintain claims in good standing, claims must be renewed prior to their expiry date. Renewal requires the filing with the ministry of acceptable work expenditures in the form of a technical report and the payment of a fee. The claims may be held for a maximum of twenty years. A minimum assessment work is required between C$200 and C$1,200 per claim per year depending on the year and term of the licence. Excess assessment work completed in any one year is carried forward for a maximum of nine years and it is automatically credited to the licence. Some of the NML claims have been renewed once and others are in the process of being renewed. NML does not hold surface rights to the Properties nor are they required at this stage of the Property’s development. The Properties location map and holdings are respectively shown on Figure 4-1 , 4.2 and in Table 4-1. Additional information is available in the Adjacent Properties section.
4.3 Permits

Resource Estimation of the Howells Taconite Properties Page 17
SGS Canada Inc.
For its diamond drilling program, NML required work permits from Newfoundland & Labrador Government, Approval №E120023, dated April 12, 2012. It was valid until December 31st, 2012.

Resource Estimation of the Howells Taconite Properties Page 18
SGS Canada Inc.
Figure 4-2: Howells River Properties & Others Owners

Resource Estimation of the Howells Taconite Properties Page 19
SGS Canada Inc.
5 Accessibility, Climate, Local Resources, Infrastructure and Physiography
5.1 Accessibility
Access to exploration drilling area was by truck and snowmobile. A few lakes around to the Properties are accessible from Schefferville via chartered fixed-wing float aircraft and such aircraft was used to support NML’s 2011 and 2012 drilling programs along with a helicopter for drill crew moves. During 2012, the drilling program equipment was transported on site by helicopter and with a dozer. There is daily scheduled air service to Sept-Îles and from there to Québec City, Montréal and beyond. There is twice-a-week round-trip train service for passengers and freight between Schefferville and Sept-Îles.
5.2 Climate
The Properties area has a sub-Arctic climate with temperatures which average 12°C in July and 25°C in December. The average annual temperature is -6°C. Average annual rainfall is approximately 410 mm and snowfall 440 cm.
5.3 Local Resources and Infrastructure
The Properties have no inhabitants. The nearest Hydro-Québec transmission lines are in Schefferville, where local needs are served by hydroelectric power from the Menihek Lake power plant located nearby in Labrador. There is a more than adequate supply of water available for exploration and mining purposes; however, there is no harvestable timber on either Property. There is ample room available on each Property for the establishment of mining and processing operations, waste piles and a tailings management area. Schefferville, Québec is the closest population centre and has a population of approximately 300. The Matimekush (Innu) Reserve is contiguous with the village and is in effect a part of it. The total Schefferville area population is approximately 1,500 including that of the Kawawachikamach (Naskapi) Reserve, which is a few km east of Schefferville by road. There is a very small, unskilled labor pool in Schefferville. Extensive training would be required for any mining operation and the bulk of the workforce would have to come from the south. Schefferville was built in the early 1950s to serve as the residential and service centre for the Iron Ore Company of Canada ("IOCC") iron mining operations and is the northern terminus of the Quebec North Shore & Labrador Railway ("QNS&L"). There are several stores, a hotel, a "Bed and Breakfast"-type inn, a restaurant and some services available. There are primary and secondary schools and a health clinic. There are dwellings available for rent, a seasonal charter float-plane service and there are daily scheduled flights to Sept-Îles in a small commercial aircraft. The village is served by reliable hydroelectricity and there is twice-a-week rail service to and from Sept-Îles. The 588.5 km journey takes approximately 15 hours one-way and delays are frequent as trains hauling
Resource Estimation of the Howells Taconite Properties Page 20
SGS Canada Inc.
iron ore concentrate and pellets from Wabush to Sept-Îles have priority on the line. Ross Bay Junction (the Wabush corner) is 228 km south by rail from Schefferville and Sept-Îles is a further 360.5 km. The rail bed from Ross Bay Junction to Schefferville has deteriorated since 1982 when IOCC closed its Schefferville operation and heavy-duty rail was replaced by lighter-gauge rail. A consortium of First Nations groups purchased the Ross Bay to Schefferville portion of the line and operating under the name of Tshiuetin Railways. It is expected that there will be Federal Government assistance in upgrading the track for heavy duty transportation of NML/TSMC DSO ore and Labrador Iron Mines, which is now shipped in small volumes.
5.4 Physiography
Topography is flat to gently rolling from west to east and is rough, with the occasional more precipitous area. For Sheps Lake, the taconite is well-exposed as a long linear belt 1.5 to 2 km. The properties are well-drained, have a few swampy areas and are covered by sparse northern boreal forest consisting of stunted spruce, alders and willows. The area is dominated by elevation tundra with rare stunted black spruce, which increase in number and size as one goes from west to east. The dominant ground cover is caribou moss with blue berries and shrubs.

Resource Estimation of the Howells Taconite Properties Page 21
SGS Canada Inc.
6 History
6.1 IOCC Field Work
Field work in LM&E Block 143 was done between July 26 and July 30, 1978 by IOCC personnel. This work was done out of a fly camp situated 4800 feet (1.5km) SW of Claire Lake, Labrador. This area of investigation is located in the SW part of the Howells Lake-Howells River North properties. Field work done included the following:
• A study of the geology in the area SW of Claire Lake was done in order to determine the stratigraphy and economic (taconite) potential. A number of 6 channel and chip samples were collected for D.T determination and analysis.
• Seven lines spread approximately 1000 ft. Apart and extending South-west of Claire and Marquise Lake were flagged and surveyed with fluxgate magnetometer.
The magnetometer profiles and the % DTWR results of the samples collected suggest that the area warrants further work. A report was submitted by G. Cuddy, (IOCC, 1978) to the NL Govt. “Block No. 143 – Geological, Geophysical & Other Work, for L. M. & E

Resource Estimation of the Howells Taconite Properties Page 22
SGS Canada Inc.
7 Geological Setting and Mineralization
The following information is based on the assessment reports of magnetic taconites in Labrador submitted by NML to the NL Government and on the observations by Thiagarajan Balakrishnan P.Geo., NML’s Chief Geologist. Mr. Balakrishnan is a member of the PEGNL (Professional Engineers and Geoscientists Newfoundland and Labrador).
7.1 Regional Geology
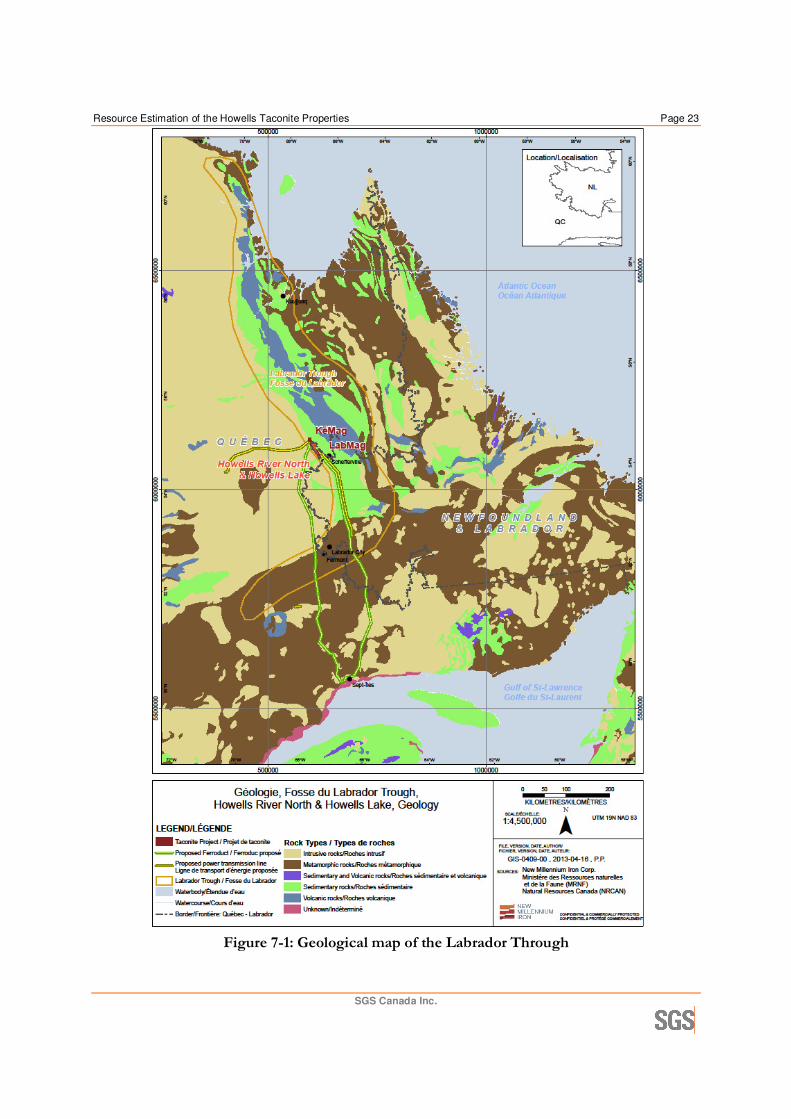
The Property is situated in the Churchill Province, of the Labrador Trough ("Trough") adjacent to the Archean basement gneiss (Ashuanipi complex), Figure 7-1. The Trough, otherwise known as the Labrador-Québec Fold Belt, extends for more than 1,000 km along the eastern margin of the Superior Craton from Ungava Bay to Lake Pletpi, Québec. The belt is about 100 km wide in its central part and narrows considerably to the north and south. The Trough comprises a sequence of Proterozoic sedimentary rocks, including iron formation, volcanic rocks and mafic intrusions. The southern part of the Trough is crossed by the Grenville Front representing a metamorphic fold-thrust belt formed during the 1,000 Ma Grenvillian Orogeny. Trough rocks in the Grenville Province are highly metamorphosed and complexly folded. Iron deposits in the Grenville part of the Trough; include Lac Jeannine, Fire Lake, Mont-Wright, Mont-Reed, and Bloom Lake in the Manicouagan-Fermont area and the Luce, Humphrey and Scully deposits in the Wabush-Labrador City area shown on Figure 7-1. The high-grade metamorphism of the Grenville Province is responsible for re-crystallization of both iron oxides and silica in primary iron formation, producing coarse-grained sugary quartz, magnetite, and specular hematite schists (meta-taconites) that are amenable for coarse grinding and concentration by gravity methods.
Resource Estimation of the Howells Taconite Properties Page 23
SGS Canada Inc.
Figure 7-1: Geological map of the Labrador Through

Resource Estimation of the Howells Taconite Properties Page 24
SGS Canada Inc.
NML’s Howells Lake and Howells River North Properties are located north of the Grenville Front in the Churchill Province where the Trough rocks have been only subject to greenschist or sub-greenschist grade metamorphism. The principal iron formation unit is known as the Sokoman Formation. The Sokoman Formation, member of the Ferriman Sub-Group, is overlain by the Menihek Sub-Group (mudstone and shales) and underlain by the Wishart Formation (quartzite), the Denault Formation (dolomite) and the Attikamagen Formation (shale). The regional stratigraphic column is shown on Table 7-1. Iron formations in this part of the Trough are taconites, which are weakly metamorphosed. Magnetic taconite iron deposits in the Trough include NML’s KéMag and LabMag deposits (Howells River Deposit) and the December Lake deposit. The Direct Shipping Ore deposits (“DSO”) occurring near Schefferville were derived from highly folded and faulted taconite iron formations which were leached of silica and other gangue minerals by percolating meteoric waters and by secondary enrichment.
Table 7-1: Regional Stratigraphic Column
Eon Age Super Group
Group Sub-Group Formation Unit
Proterozoic
Aphebian
Kaniapiskau
Knob Lake
Menihek
Shale
Ferriman
Sokoman
LC
GC
URC
LRGC
Ruth
JSP
RS
BC
Wishart Quartzite
Attikamagen
Swampy Bay
Pistolet
Seward Archean Churchill Province
After Dimroth, 1978

Resource Estimation of the Howells Taconite Properties Page 25
SGS Canada Inc.
7.2 Property Geology
7.2.1 General
The taconite in the Howells River and Howells Lake, Kivivik Lake areas is part of the Sokoman Formation occurring at the western margin of the Trough. The taconite is well-exposed on the west side of the Howells River valley and on the east side the outcrops are sporadic and under overburden cover. The taconite occurs over an area with an average width of 4km, and a total length of approximately 8km. This wider width of the taconite is due to a thrust fault with a northwest-southeast trend which pushed a whole sequence above the west side band. At the central part of the valley, Menihek Slate overlies the UIF. The airborne magnetometer survey conducted in 2010 over this area shows several prominent magnetic anomalies. Among the members of the Knob Lake Group, the Attikamagen and Denault Formations are not exposed in this area. The Ruth Formation followed by Sokoman Formation overlies the Wishart Formation, which is a fine to medium grained quartzose sandstone with varying amounts of feldspar grains. Some minor layers of shaley, arkosic and carbonate intervals occur within the unit. A sharp angular unconformity marks the contact between the Wishart Formation and the Ashuanipi Complex. Based on the drill hole intersections of the lithological units, the following stratigraphic sequence is established in the properties investigated.

Resource Estimation of the Howells Taconite Properties Page 26
SGS Canada Inc.
Figure 7-2: Howells River and Howells Lake geology

Resource Estimation of the Howells Taconite Properties Page 27
SGS Canada Inc.
7.2.2 Lithology
The taconite iron formation in the properties is part of the Sokoman Formation occurring at the western margin of the trough. Among the members of the Knob Lake Group, the Attikamagen Formation and the Denault Formation are not exposed and absent all along the 210 km long magnetic iron ore (taconite) belt called the Millennium Iron Range (MIR) located near Schefferville, Quebec. The Ruth Formation followed by Sokoman Formation overlie the Wishart Formation, which is a fine to medium grained sand stone sometimes arkosic containing feldspar grains. The Wishart Formation overlies unconformably the basement Archean gneisses. The following stratigraphic sequence was established using the drill hole data in the properties investigated (Table 7-2).
Table 7-2 Stratigraphic Sequence (Economic) Based on Drill Hole Intersections
Unit Estimated Average True Thickness and Range
(m) Description
Menihek Formation > 79.2
Dark grey to black shale with minor interbedded greywacke and carbonate lithofacies, carbonaceous pyretic shale. (Shale) (MS)
Thrust Fault
Sokoman Formation
UIF Member
Lean Chert Sub-member (LC) 22.0m to62.4m Average 44.1m
Greenish, green to grey-green and pink-grey magnetite-chert iron formation with local zones of laminated to shaley bedded (siderite-magnetite) chert iron formation. This unit contains stromatolite bearing purple-red and green chert band with magnetite less than 3m thick. Stilpnomelane bearing magnetite-rich shales occur both above and below the stromatolitic band.
Jasper Upper Iron Formation (JUIF)
3.9m to 12.1m Average 6.5m
Layered to laminated, magnetite-chert iron formation. Red-grey-pink in colour, red chert and oolites. Magnetite-Carbonate Facies
Green Chert (GC) 1.2m to 5.0m Average 2.7m
Silicate-rich, green chert unit, laterally continuous and an excellent marker horizon. Magnetite-Carbonate Facies
MIF Member Upper Red Cherty (URC) 2.0m to 21.0m
Average 5.5m
Massive to layered, jasper-magnetite-chert iron formation. Red-grey to reddish purple. Hematite-Carbonate Facies
Pink-Grey Cherty (PGC)
5.0m to 37.8m Average 26.1m
Disseminated magnetite-chert iron formation. Grey to pink-grey to green-grey.
Magnetite-Carbonate Facies
Hematite-Carbonate Facies

Resource Estimation of the Howells Taconite Properties Page 28
SGS Canada Inc.
Unit Estimated Average True Thickness and Range
(m) Description
LIF Member
Lower Red Green Cherty (LRGC) 7.4m to 83.0m Average 32.5m
Layered silicate-magnetite-carbonate, magnetite-chert iron formation. Pink to reddish-grey to green-grey. More silicates in lower part, more oxides in upper part. Lower contact transitional with LIF.
Magnetite-Carbonate Facies
Lower Iron Formation (LIF) 0.9m to 23.1m Average 8.7m
Massive to layered green to grey-green silicate-carbonate-magnetite-chert iron formation.
Silicate Facies
Ruth Formation (RF) *2.9m to 8.7m Average 5.2
*Thin bedded to laminated chert-siderite, with thin bands of shale. Note – Zajac (1974) argues the term Ruth Formation should be abandoned because it is for most part equivalent to LIF. Sulphide Facies -
Wishart Formation *14.6m to 20.4m
Average 17.7 *Black chert 1.4 m (0.62 - 4.0m). Quartzites and /or re-crystallized cherts.
UNCONFORMITY
Ashuanipi Complex – Archean - *Granites and Granodioritic gneiss and mafic intrusives. Paleosol on contact between Proterozoic Assemblage and Archean basement.
* Based on Howells Data
7.2.3 Structure
The Wishart, Ruth and Sokoman formations are essentially un-deformed and strike approximately northwest-southeast and dip 5° to 12° northeast. Folds, where present, are broad monoclonal flexures with low amplitudes and shallow dipping limbs. One fault with major displacement intersects the taconite formation. The fault is vertical with pronounced dextral displacement and trends in a northeast-southwest direction and parallel to the prominent joint directions. One major thrust fault on the east side of the Howells River was intersected in several drill holes. The movement along the thrust plane is considerable. The complete stratigraphic sequence is repeated on the east side of Howells River (tripled in one area). The contacts between the various units of the Sokoman Formation are gradational. The GC contacts with JUIF and URC are very sharp. The GC unit is a good marker horizon. The unit LRC is not traced throughout the property. It tends to grade into the LRGC unit. The contact between the Menihek Formation and the Sokoman Formation is a thrust fault. The slate shows high deformation near the contact.
7.2.4 Mineralization
The taconite formation consists mostly of varicolored recrystallized chert, jasper and the predominant iron oxide mineral magnetite with subordinate amounts of hematite. In weathered

Resource Estimation of the Howells Taconite Properties Page 29
SGS Canada Inc.
zones secondary iron oxides goethite and limonite are present. However, they are not prevalent. Other gangue minerals present are iron silicates, minnesotaite and stilpnomelane, iron carbonate, siderite and manganese carbonates rhodochrosite and kutnahorite. The unit PGC contains the highest concentrations of magnetite. Units URC and JUIF show higher total iron content. Siderite occurs in LC, GC and LIF units

Resource Estimation of the Howells Taconite Properties Page 30
SGS Canada Inc.
8 Exploration
8.1 Exploration 2008 – 2009, Licence 015977M
The following information is based on the assessment reports provided by NML. During the summer of 2008 New Millennium Capital Corp. (NML) personnel carried out an exploration program looking for magnetic taconite iron. This work was a follow-up of the mapping and sampling work done from 2005 to 2008. Work in 2009 concentrated on geological mapping and rock sampling in the taconite area on strike to the north of the LabMag Deposit. Outcrops mapped in 2005 and 2008 in the area were investigated. In some areas, large zones of Lean Chert float were noted. Mapping south of 6,093,000N NAD83 found fair outcrop exposures. In this area a total 14 samples were collected. All units but the JUIF and GC were sampled. Most samples showed fair to strong magnetic response in samples with representative iron grades. A total of 21 magnetic iron taconite samples were collected across the geological section.
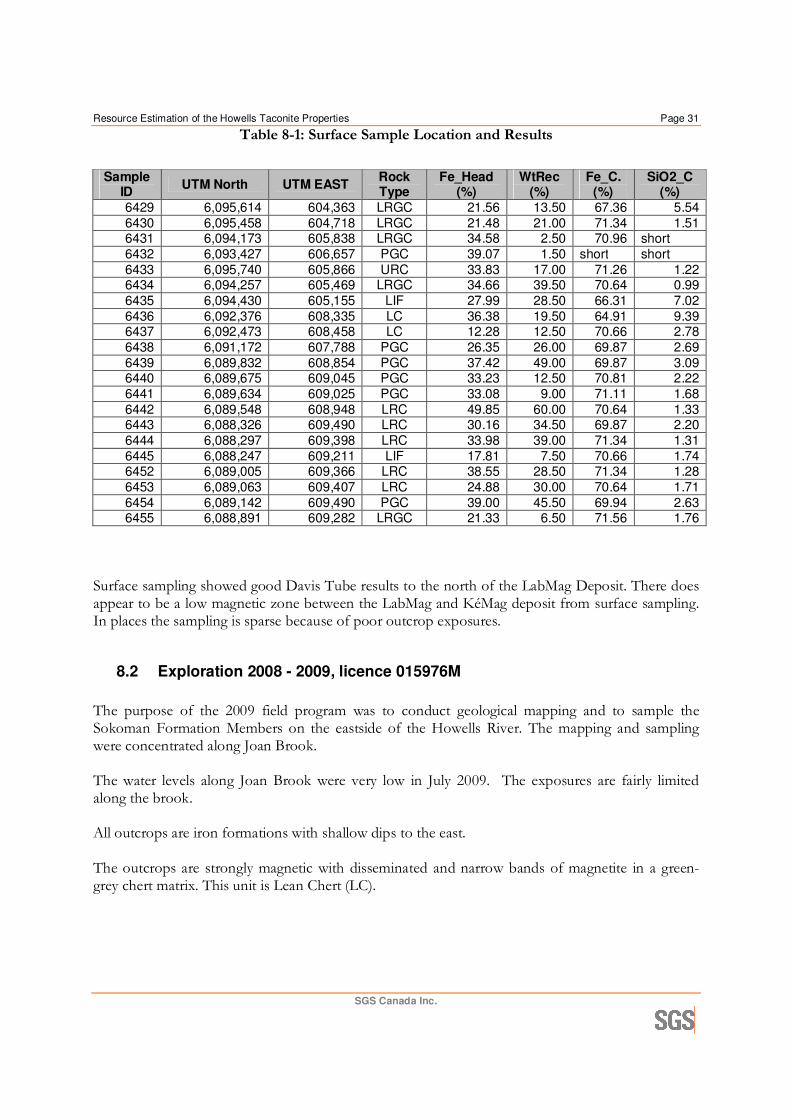
Resource Estimation of the Howells Taconite Properties Page 31
SGS Canada Inc.
Table 8-1: Surface Sample Location and Results
Sample
ID UTM North UTM EAST
Rock Type
Fe_Head (%)
WtRec (%)
Fe_C. (%)
SiO2_C (%)
6429 6,095,614 604,363 LRGC 21.56 13.50 67.36 5.54 6430 6,095,458 604,718 LRGC 21.48 21.00 71.34 1.51 6431 6,094,173 605,838 LRGC 34.58 2.50 70.96 short 6432 6,093,427 606,657 PGC 39.07 1.50 short short 6433 6,095,740 605,866 URC 33.83 17.00 71.26 1.22 6434 6,094,257 605,469 LRGC 34.66 39.50 70.64 0.99 6435 6,094,430 605,155 LIF 27.99 28.50 66.31 7.02 6436 6,092,376 608,335 LC 36.38 19.50 64.91 9.39 6437 6,092,473 608,458 LC 12.28 12.50 70.66 2.78 6438 6,091,172 607,788 PGC 26.35 26.00 69.87 2.69 6439 6,089,832 608,854 PGC 37.42 49.00 69.87 3.09 6440 6,089,675 609,045 PGC 33.23 12.50 70.81 2.22 6441 6,089,634 609,025 PGC 33.08 9.00 71.11 1.68 6442 6,089,548 608,948 LRC 49.85 60.00 70.64 1.33 6443 6,088,326 609,490 LRC 30.16 34.50 69.87 2.20 6444 6,088,297 609,398 LRC 33.98 39.00 71.34 1.31 6445 6,088,247 609,211 LIF 17.81 7.50 70.66 1.74 6452 6,089,005 609,366 LRC 38.55 28.50 71.34 1.28 6453 6,089,063 609,407 LRC 24.88 30.00 70.64 1.71 6454 6,089,142 609,490 PGC 39.00 45.50 69.94 2.63 6455 6,088,891 609,282 LRGC 21.33 6.50 71.56 1.76
Surface sampling showed good Davis Tube results to the north of the LabMag Deposit. There does appear to be a low magnetic zone between the LabMag and KéMag deposit from surface sampling. In places the sampling is sparse because of poor outcrop exposures.
8.2 Exploration 2008 - 2009, licence 015976M
The purpose of the 2009 field program was to conduct geological mapping and to sample the Sokoman Formation Members on the eastside of the Howells River. The mapping and sampling were concentrated along Joan Brook. The water levels along Joan Brook were very low in July 2009. The exposures are fairly limited along the brook. All outcrops are iron formations with shallow dips to the east. The outcrops are strongly magnetic with disseminated and narrow bands of magnetite in a green-grey chert matrix. This unit is Lean Chert (LC).
Resource Estimation of the Howells Taconite Properties Page 32
SGS Canada Inc.
8.3 Exploration 2010
During 2010 New Millennium Iron Corp (“NML”) carried out Airborne High Resolution Magnetic Survey (“AM”) over the Millennium Iron Range (“MIR”) to identify additional, potential magnetic taconite deposits similar to the proven LabMag deposit in the Howells River Area and the KéMag deposit in Québec. The survey covered the taconite belt over a length of 150 km starting south of Perault Lake, to north of Lac Ritchie in Québec. The magnetic taconite formation of the MIR occurs as a linear strip approximately 4 km wide, starting west of Menihek Lake and extending northwest to Lac Otelnuk in Québec over a length of 210 km. The Airborne survey conducted by Fugro covers all the licences and claims west of longitude 67⁰W in NL and QC. Several strong magnetic anomalies were outlined by Jean Hubert, Geophysical Consultant for NML, who interpreted the survey data. Based on his recommendation in 2012, several anomalous areas were drilled. This report deals with the drilling done on licences 015976M, 018113M, 018379M under the ownership of NML, 015977M and 018380M under the ownership of LabMag LGP.
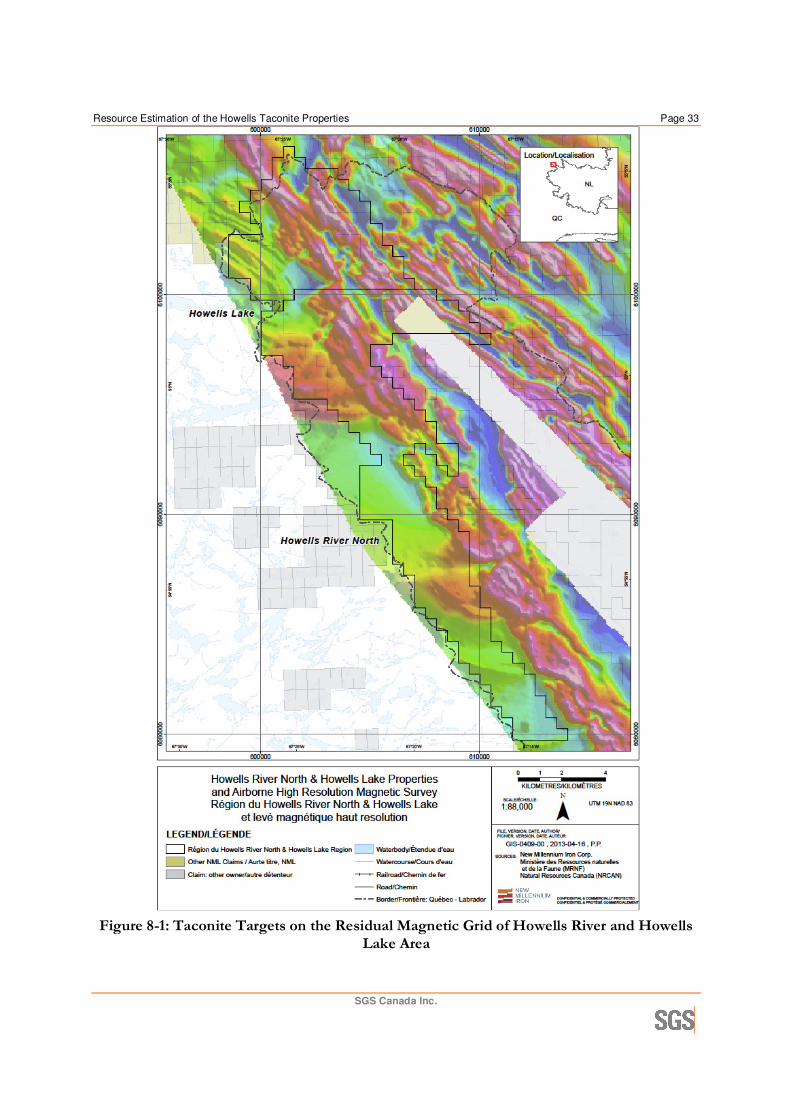
Resource Estimation of the Howells Taconite Properties Page 33
SGS Canada Inc.
Figure 8-1: Taconite Targets on the Residual Magnetic Grid of Howells River and Howells
Lake Area

Resource Estimation of the Howells Taconite Properties Page 34
SGS Canada Inc.
9 Drilling
In 2006 one hole, 06HR1279D, was drilled in this area to check the grade of the iron formation. Three (3) holes were drilled in 2011 for a total of 347 m. A detailed exploration drilling program was undertaken in early June 2012 in the Howells Lake, Kivivik Lake AM anomaly area which encompasses licences 015976M, 018113M, 018379M, 015977M and 018380M. The area covered by major part of the drilling is approximately 8 km long and 4 km wide (Figure 9-1). The program started on 1st June with 2 drills provided by the contractor Downing Estate Drilling Ltd. of Grenville-Sur-la-Rouge, QC and finished on September 27th 2012. The drilling was carried out on a grid of lines spaced 1 km apart with 4 to 6 holes spaced 500 to 600 m on each section line. Prior to drilling all the holes were spotted on the ground using handheld GPS unit. At the conclusion of drilling all the drilled holes were re-surveyed by N. E. Parrott Surveys Ltd. of Happy Valley-Goose Bay, NL. During the 2012 program 1,010 half core samples and 41 half core duplicate samples were collected and sent to Midland Research Center (“MRC”), Nashwauk, Minnesota, USA, for Davis Tube testing and chemical analysis. The sample lengths varied from 1 to 6m. All the units were sampled individually. The duplicate samples were sent as a check under QA/QC program. The Certificate of Analysis provided by MRC is appended to the report. Fifty three (53) crude ore samples and 89 Davis Tube magnetite concentrate samples were sent by MRC to SGS, Lakefield, Ontario for whole rock analysis and elemental analysis respectively. Table 9-1 gives the drill hole summary.
Table 9-1: Drilling Summary
Property Licence Claims Number
Holes Number
Samples number
Length (m)
Howells Lake
015976M 88 34 657 4929.5 020411M 21 - - - 018113M 12 1 65 401.5 018379M 22 10 164 1605.7
Howells River North
015977M 256 10 132 828.5 018380M 29 2 65 486.0 020427M 1 - - -
020412M 23 - - -
Both Properties 8 licences 452 57 1083 8251.2

Resource Estimation of the Howells Taconite Properties Page 35
SGS Canada Inc.
Figure 9-1: Drilling Program and Section Lines of Howells Area
Resource Estimation of the Howells Taconite Properties Page 36
SGS Canada Inc.
10 Sample Preparation, Analyses and Security
All the split core samples were sent to the Midland Research Center (MRC) in Nashwauk, Minnesota for chemical and Davis Tube (DT) analysis. A total of 326 core samples including 17 duplicate check samples were collected on the Sheps Lake property and a total of 618 core samples including 32 duplicate check samples were collected on the Perault Lake property. The following test work and sample analyses were completed for all samples by MRC:
• Head assay for total iron (%Fe_Head) • Determination of magnetic weight recovery (%WtRec) on -325 mesh concentrate • Determination of total iron (%Fe_C) and silica (%SiO2C) in concentrate
MRC sample preparation and analysis flowsheet consisted of the following steps:
• Individual core samples crushed to 3/8” with a 4”x6” jaw crusher • Split of 1500g for test work • Save the balance • Roll crush 1500g to 100% -10 mesh • Split 50g for DT test and head sample analysis • Save the balance • Stage grind 50 g to -325 mesh as per MRC procedure (Hanna Procedure) • DT weight recovery test on 25-30 g sample as per MRC procedure (Hanna procedure) • Analyze DT concentrate for total %Fe and SiO2 (non-mercury titrimetric method for total
iron and SiO2 determination using hydrofluoric acid) The security measures to protect the sample integrity are adequate and consist in identifying of sample bags with drill hole name, from-to and sample number, referencing sample locations in core boxes and direct shipment of sample bags containing half core pieces to the MRC laboratory. No sample preparation was done on site.
10.1 NML QA/QC
10.1.1 Duplicate samples at MRC
Over the course of the 2012 drilling and sampling program, NML sent 41 duplicate samples to the Midland Research Center lab. Those samples were taken from the second half of the core. At MRC, those samples were subjected to the same Davis Tube testing as the original half core for the same intervals. Duplicate samples were done on 31 of the 56 holes. Their length varies from 2.2 to 8.5 metres with an average of 5.4 metres. Most of duplicate samples are in the LRGC (8), PGC (8) and LC unit (8) followed by the JUIF (6), LIF units (5), URC (3) and GC units (3). Since most reported resources are in the LC, PGC and LRGC units with some in the URC unit (see section 13); future duplicate samples should concentrate on those units.
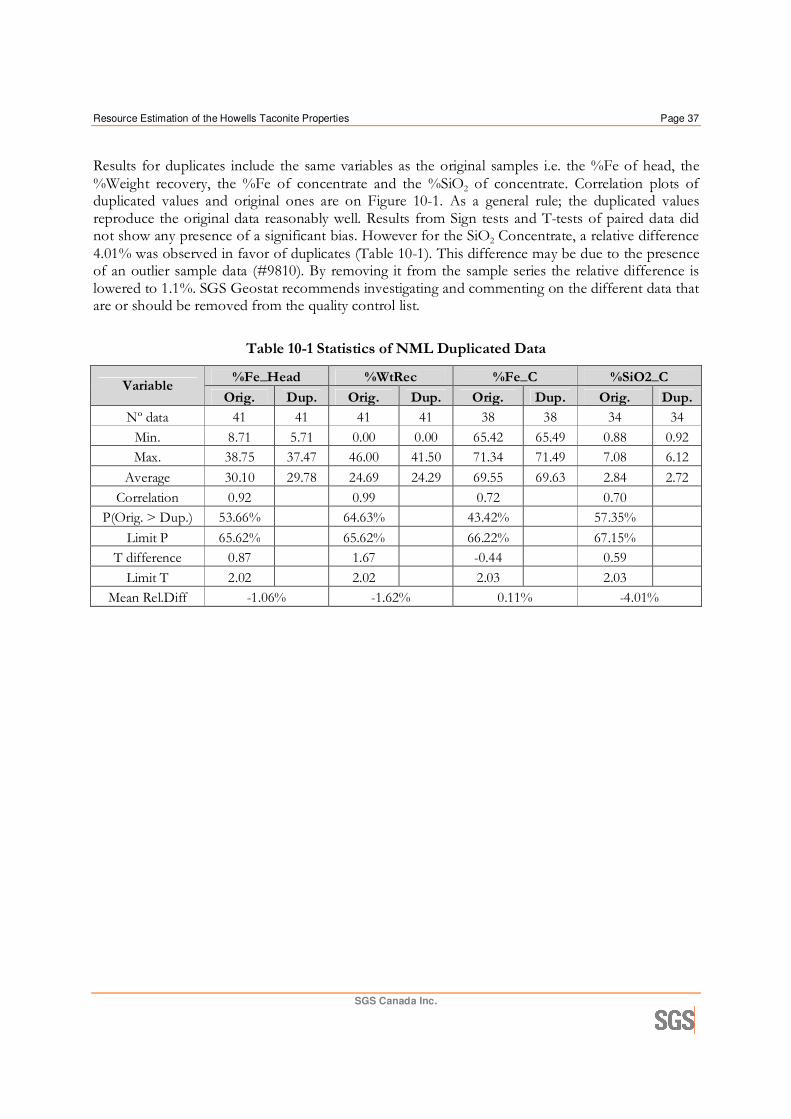
Resource Estimation of the Howells Taconite Properties Page 37
SGS Canada Inc.
Results for duplicates include the same variables as the original samples i.e. the %Fe of head, the %Weight recovery, the %Fe of concentrate and the %SiO2 of concentrate. Correlation plots of duplicated values and original ones are on Figure 10-1. As a general rule; the duplicated values reproduce the original data reasonably well. Results from Sign tests and T-tests of paired data did not show any presence of a significant bias. However for the SiO2 Concentrate, a relative difference 4.01% was observed in favor of duplicates (Table 10-1). This difference may be due to the presence of an outlier sample data (#9810). By removing it from the sample series the relative difference is lowered to 1.1%. SGS Geostat recommends investigating and commenting on the different data that are or should be removed from the quality control list.
Table 10-1 Statistics of NML Duplicated Data
Variable %Fe_Head %WtRec %Fe_C %SiO2_C
Orig. Dup. Orig. Dup. Orig. Dup. Orig. Dup.
Nº data 41 41 41 41 38 38 34 34
Min. 8.71 5.71 0.00 0.00 65.42 65.49 0.88 0.92 Max. 38.75 37.47 46.00 41.50 71.34 71.49 7.08 6.12
Average 30.10 29.78 24.69 24.29 69.55 69.63 2.84 2.72
Correlation 0.92 0.99 0.72 0.70 P(Orig. > Dup.) 53.66% 64.63% 43.42% 57.35%
Limit P 65.62% 65.62% 66.22% 67.15% T difference 0.87 1.67 -0.44 0.59
Limit T 2.02 2.02 2.03 2.03 Mean Rel.Diff -1.06% -1.62% 0.11% -4.01%

Resource Estimation of the Howells Taconite Properties Page 38
SGS Canada Inc.
Figure 10-1: Correlation Plots of Results from NML Duplicates
5
10
15
20
25
30
35
40
5 10 15 20 25 30 35 40
%Fe Head Dup.
%Fe Head Orig.
Howells - DT Duplicates check at MRC
0
5
10
15
20
25
30
35
40
45
50
0 10 20 30 40 50
%Wrec. Dup.
%Wrec. Orig.
Howells -DT Duplicates check at MRC
65
66
67
68
69
70
71
72
73
74
75
65 67 69 71 73 75
%Fe Conc. DT Dup.
%Fe Con. DT Orig.
Howells - DT duplicates check at MRC
0
1
2
3
4
5
6
7
8
0 1 2 3 4 5 6 7 8
%SiO2 DT
Dup.
%SiO2 DT Orig.
Howells - DT Duplicates check at MRC
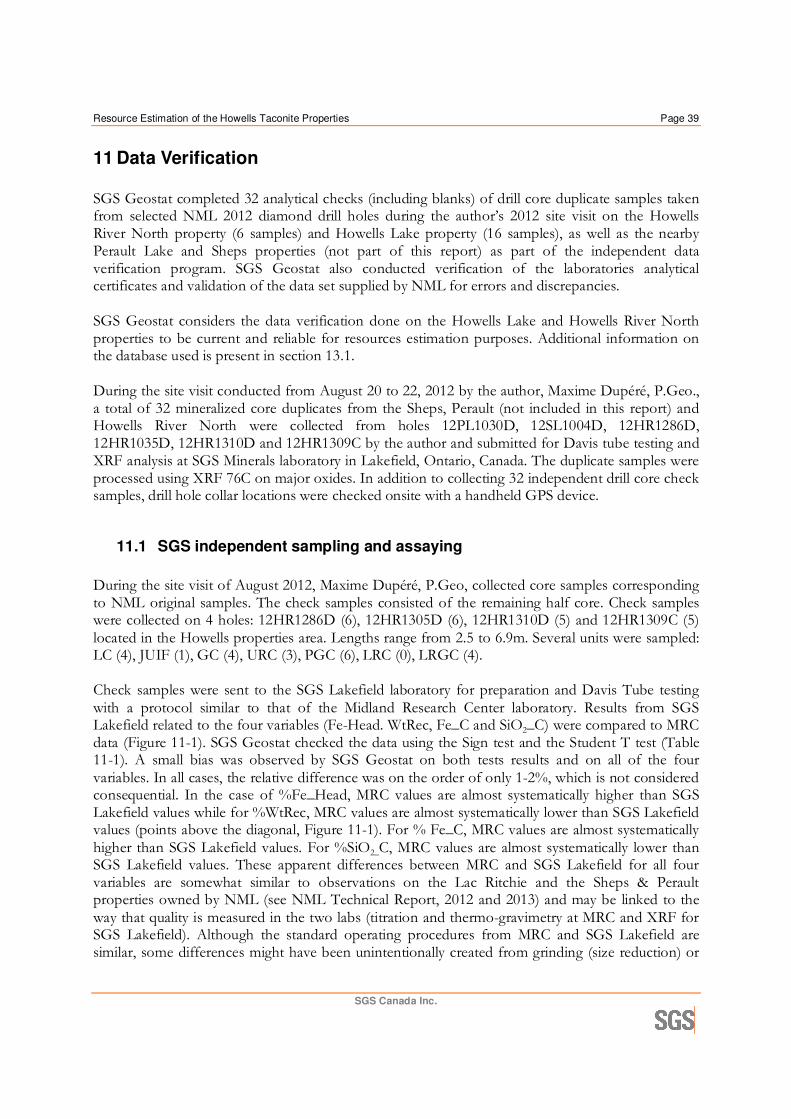
Resource Estimation of the Howells Taconite Properties Page 39
SGS Canada Inc.
11 Data Verification
SGS Geostat completed 32 analytical checks (including blanks) of drill core duplicate samples taken from selected NML 2012 diamond drill holes during the author’s 2012 site visit on the Howells River North property (6 samples) and Howells Lake property (16 samples), as well as the nearby Perault Lake and Sheps properties (not part of this report) as part of the independent data verification program. SGS Geostat also conducted verification of the laboratories analytical certificates and validation of the data set supplied by NML for errors and discrepancies. SGS Geostat considers the data verification done on the Howells Lake and Howells River North properties to be current and reliable for resources estimation purposes. Additional information on the database used is present in section 13.1. During the site visit conducted from August 20 to 22, 2012 by the author, Maxime Dupéré, P.Geo., a total of 32 mineralized core duplicates from the Sheps, Perault (not included in this report) and Howells River North were collected from holes 12PL1030D, 12SL1004D, 12HR1286D, 12HR1035D, 12HR1310D and 12HR1309C by the author and submitted for Davis tube testing and XRF analysis at SGS Minerals laboratory in Lakefield, Ontario, Canada. The duplicate samples were processed using XRF 76C on major oxides. In addition to collecting 32 independent drill core check samples, drill hole collar locations were checked onsite with a handheld GPS device.
11.1 SGS independent sampling and assaying
During the site visit of August 2012, Maxime Dupéré, P.Geo, collected core samples corresponding to NML original samples. The check samples consisted of the remaining half core. Check samples were collected on 4 holes: 12HR1286D (6), 12HR1305D (6), 12HR1310D (5) and 12HR1309C (5) located in the Howells properties area. Lengths range from 2.5 to 6.9m. Several units were sampled: LC (4), JUIF (1), GC (4), URC (3), PGC (6), LRC (0), LRGC (4). Check samples were sent to the SGS Lakefield laboratory for preparation and Davis Tube testing with a protocol similar to that of the Midland Research Center laboratory. Results from SGS Lakefield related to the four variables (Fe-Head. WtRec, Fe_C and SiO2_C) were compared to MRC data (Figure 11-1). SGS Geostat checked the data using the Sign test and the Student T test (Table 11-1). A small bias was observed by SGS Geostat on both tests results and on all of the four variables. In all cases, the relative difference was on the order of only 1-2%, which is not considered consequential. In the case of %Fe_Head, MRC values are almost systematically higher than SGS Lakefield values while for %WtRec, MRC values are almost systematically lower than SGS Lakefield values (points above the diagonal, Figure 11-1). For % Fe_C, MRC values are almost systematically higher than SGS Lakefield values. For %SiO2_C, MRC values are almost systematically lower than SGS Lakefield values. These apparent differences between MRC and SGS Lakefield for all four variables are somewhat similar to observations on the Lac Ritchie and the Sheps & Perault properties owned by NML (see NML Technical Report, 2012 and 2013) and may be linked to the way that quality is measured in the two labs (titration and thermo-gravimetry at MRC and XRF for SGS Lakefield). Although the standard operating procedures from MRC and SGS Lakefield are similar, some differences might have been unintentionally created from grinding (size reduction) or

Resource Estimation of the Howells Taconite Properties Page 40
SGS Canada Inc.
from calibration of the magnetic separator (Davis Tube) on either laboratory. A detailed investigation of these differences is recommended. SGS Geostat considers that the number of samples checked (22) is relatively small and conclusions should be interpreted accordingly. SGS Geostat recommends increasing the number of check samples in future verifications when additional holes are available.
Table 11-1: Statistics of SGS Check Sample Data
Variable %Fe_Head %WtRec %Fe_C %SiO2_C
MRC SGS MRC SGS MRC SGS MRC SGS
Nº data 22 22 22 22 22 22 22 22
Min. 14.36 10.42 0.00 0.01 67.29 65.40 1.06 0.34
Max. 36.80 38.19 0.41 0.42 71.04 70.60 5.46 6.59 Average 29.05 29.48 0.28 0.28 69.95 69.13 2.36 2.38
Correlation 0.72 0.75 0.56 0.44 P(MRC > SGS) 9.09% 18.18% 95.00% 45.00%
Limit P 28.68% 28.68% 27.64% 27.64% T difference -0.38 0.34 1.54 0.39
Limit T 2.08 2.08 2.08 2.08 Rel. Diff 1.49% -2.20% -1.18% 1.05%

Resource Estimation of the Howells Taconite Properties Page 41
SGS Canada Inc.
Figure 11-1: Correlation plots of results from SGS check samples
20
25
30
35
40
20 25 30 35 40
% Fe Head SGS
% Fe Head MRC
Howells-DT Independent check samples
0.00
0.10
0.20
0.30
0.40
0.50
0.00 0.10 0.20 0.30 0.40 0.50
% Wt rec. SGS
% Wt rec. MRC
Howells -DT Independent check samples
65
66
67
68
69
70
71
72
73
74
75
65 66 67 68 69 70 71 72 73 74 75
%Fe conc. DT SGS
% Fe conc. DT MRC
Howells -DT Independent check samples
0
1
2
3
4
5
0 1 2 3 4 5
% SiO2 conc. DT SGS
% SiO2 conc. DT MRC
Howells -DT Independent check samples

Resource Estimation of the Howells Taconite Properties Page 42
SGS Canada Inc.
12 Mineral Processing and Metallurgical Testing
Apart from the Davis Tube testing, there has been no mineral processing or metallurgical test work performed on Howells Lake & Howells River North mineralised material. However, The Howells Lake and Howells River North mineralized material is structurally and mineralogically similar to New Millennium Iron’s KéMag, Sheps & Perault Lake deposits and the reader can refer to the 43-101 Technical Report on the Pre-Feasibility Study of the KéMag Iron Ore Project, Québec (BBA, 2009) for related information. With a conventional HPGR + Ball Mill circuit, a processing plant would be expected to produce a concentrate at 2300 Blaine with approximately 1% higher silica than the Davis Tube values. The silica in the magnetic concentrate would thus be approximately 5.5% silica unless a silica cut-off is used to reduce the silica in the feed. The expected weight recovery from the plant would be approximately the same as the Davis Tube weight recovery, if not slightly higher (an increase of 0 to 0.5%). To further reduce the product silica, a flotation circuit could be used. In this case, it is expected that the plant could reach 3.0 – 3.5% silica with a loss in weight recovery of 1.5%. Specific test work on Howells Lake and Howells River North mineralized material should be performed at more advanced stages of development.

Resource Estimation of the Howells Taconite Properties Page 43
SGS Canada Inc.
13 Mineral Resource Estimates
The mineral resources estimates (MRE) reported herein are derived from a computerized resource block model. The construction of the block model was built using drill hole data, serving as a basis for 3D definition of the 3D solids. The MRE were limited to the material inside the selected 3D solids. Regular length composites were created from the validated drill hole database. Block grade interpolation was done on a regular grid. A block percentage inside each of the 3D solids was also considered in the MRE. Blocks under the topographic Overburden/Bedrock contact were considered in the MRE. Classification was done according to proximity to composites and corresponding precision/confidence level. An optimized pit shell was done to verify the validity of the WtRec cut-off grade used (although not considered) in the MRE statement.
13.1 Drill Hole and Sample Data
Sample data used in the construction of the proposed resource model was in drill hole database tables received from NML during SGS Geostat site visit and form documents received up to April 30, 2013. Data tables used for resource estimation are:
• A drill hole collar table with collar coordinates, orientations, and lengths of 56 (including 5 holes re-drilled) holes totaling 8060.8m. The effective number of holes is 49 tags from XXHRXXXXD, 1 tag XXHRXXXXA and 2 tags XXHRXXXXC totaling 8060.8 m from 2006 to 2012. Also, 4 entries included in the database were early attempts which had to be aborted (12HR1297A -6.6 m, 12HR1309D – 50 m, 12HR1317B – 30 m, 12HR1317D – 48 m). Drill holes are all vertical, 29 are BQ type and 26 NQ type. There are no deviation surveys in the drill holes. As illustrated on Figure 13-1, holes are on 11 NE-SW sections separated by 500 m-1000 m with spacing of approximately 500 m between holes on the same section.
• A drill hole assay table with 1083 entries. Sample numbers range from 5023 to 5037, 7216 to
7236, 7993 to 8088, 8110 to 8850, 9472 to 9900, 10001 to 10288, 10343 to 10376, 10436 to 1439 and 1513 to 1630. Assay interval length ranges from 0.9 m to 22.9 m with an average length of 5.54 m. Up to four assay values from Davis Tube tests at Midland Research Center (MRC) are available for each interval:
o (1) The %Fe_Head with values from 3.60% to 40.35%. o (2) The %WtRec with values from 0 to 49%. o (3) The %Fe_C (missing in 67 samples from lack of concentrate) with values from
54.49% to 71.93%. o (4) The %SiO2_C (missing in 111 samples from lack of concentrate) with values
from 0.76% to 19.4%. A total of 6 of the 8 Assay records having lengths over 9 metres had a very poor core recovery and an average %weight recovery of less than 3.5%.
• A drill hole lithological table description of 530 lithological intervals (hole name, from-to,
litho code) totaling 8059.8 m in the 56 holes. The litho intervals correspond to the

Resource Estimation of the Howells Taconite Properties Page 44
SGS Canada Inc.
stratigraphic units described section 7 of this report. Table 13-1 shows some statistics on the number and length of intercepts of holes with those units.
Table 13-1: Statistics of Drill Hole lithological Intervals
Unit Description Count Length (m)
Min. Max. Avg.
BC Black Chert 44 0.80 38.30 6.90 GC Green Chert 37 0.10 5.00 2.68
GRGN Granitic/Gneissic 7 0.30 20.70 9.89 JUIF Jasper Upper Iron formation 35 3.50 16.80 6.68
LC Lean Chert 46 3.80 141.90 41.48
LIF Lower Iron Formation 58 0.60 34.00 9.27
LRC Lower Red Cherty 5 2.20 6.00 4.76
LRGC Lower Red-Green Cherty 65 3.50 83.00 26.55 MS Menihek Shale 25 4.40 103.40 25.01
OB Overburden 56 0.50 30.00 5.59
PGC Pink-Grey Cherty 50 5.00 43.80 24.23 QTE/QTZ Quartzite 36 0.50 74.10 20.29
RS Ruth Slate 27 0.40 8.00 2.53
URC Upper Red Chert 39 0.60 21.00 5.39
13.2 Specific Gravity
In addition to the collar, assay and litho drill hole data, the regressions of measured S.G. by immersion on similar NML taconite deposits (LabMag and KéMag) have been supplied for various lithological units. Linear Regression Formulas (LRF) were calculated from numerous samples from each lithological unit (from 20 to 58 samples). This data is available in NML’s prefeasibility study (2012) on the LabMag and KéMag properties. Please see Table 13-2.
• 55 samples were considered for the LRF on LC lithology. From SGS ranging from 3.02 to 3.59 t/m3 and Iron grades from 19.14% to 37%, a LRF of 0.0271 x %Fe_Head + 2.5049 was established.
• 58 samples were considered for the LRF on JUIF lithology. From SGS ranging from 3.12 to 3.69 t/m3 and Iron grades from 23.10% to 38.96%, a LRF of 0.0369 x %Fe_Head + 2.2649 was established.
• 20 samples were considered for the LRF on GC lithology. From SGS ranging from 2.83 to 3.41 t/m3 and Iron grades from 8.93% to 34.41%, a LRF of 0.0239 x %Fe_Head + 2.6077 was established.
• 49 samples were considered for the LRF on URC lithology. From SGSs ranging from 3.29 to 3.69 t/m3 and Iron grades from 26.9% to 40.39%, a LRF of 0.0250 x %Fe_Head + 2.6661 was established.

Resource Estimation of the Howells Taconite Properties Page 45
SGS Canada Inc.
• 51 samples were considered for the LRF on PGC lithology. From SGs ranging from 3.29 to 3.69 t/m3 and Iron grades from 26.9% to 40.39%, a LRF of 0.0252 x %Fe_Head + 2.6114 was established.
• 54 samples were considered for the LRF on LRC lithology. From SGs ranging from 3.19 to 3.55 t/m3 and Iron grades from 24.56% to 36.29%, a LRF of 0.0304 x %Fe_Head + 2.4632was established.
• 53 samples were considered for the LRF on LRGC lithology. From SGs ranging from 3.11 to 3.33 t/m3 and Iron grades from 21.70% to 36.64%, a LRF of 0.0287 x %Fe_Head + 2.4937 was established.
Table 13-2: Summary of SG Regression
UNIT # of
Samples
% Fe_Head SG Regression R2
Min. Max. Ave. Min. Max. Ave.
LC 55 19.14 37 29.04 3.02 3.59 3.29 0.0271 x %Fe_Head + 2.5049 0.7451
JUIF 58 23.10 38.96 31.60 3.12 3.69 3.43 0.0369 x %Fe_Head + 2.2649 0.7720
GC 20 8.93 34.41 22.69 2.83 3.41 3.15 0.0239 x %Fe_Head + 2.6077 0.9683
URC 49 26.90 40.39 34.75 3.29 3.69 3.54 0.0250 x %Fe_Head + 2.6661 0.7544
PGC 51 23.19 44.04 32.64 3.19 3.64 3.43 0.0252 x %Fe_Head + 2.6114 0.7865
LRC 54 24.56 36.29 30.78 3.19 3.55 3.40 0.0304 x %Fe_Head + 2.4632 0.8887
LRGC 53 21.70 36.64 29.06 3.11 3.59 3.33 0.0287 x %Fe_Head + 2.4937 0.7609
As with many iron ore deposits, the individual density data clearly show a strong correlation of density and %Fe_Head grade. It is thus recommended that future density measurements be done on individual samples in addition to composites using water dispersion and pycnometer.

Resource Estimation of the Howells Taconite Properties Page 46
SGS Canada Inc.
Figure 13-1: Map of Howells Properties Drill Holes
13.3 Lateral Extent of Deposit
The natural boundary for lateral extent of mineralized units at Howells is the presence of outcrops on the west side. There is also a normal fault to the E of the deposit corresponding to a physical limit. There is also a major dextral strike-slip fault in the center of the deposit. Although this fault is visible on the field and on magnetic survey, this structure is not present in the 3D geological interpretation solids. With only one or two drill holes close enough to the fault, there is insufficient information available to incorporate the fault into the 3D interpretation. Drilling information to the Eastern limit was limited but sufficient to establish the presence of a normal fault dipping steeply to the East and the presence of quartzite. Given the 500m x 1000m nominal grid of available drill holes and the available geological information, NML used upon SGS Geostat recommendations a relative lateral extent of 500m EW x 1000m NS for the modeling of the different lithological 3D solids. This extent was considered in the 3D solid creation by considering a 1000 m long radius along N326 and
Resource Estimation of the Howells Taconite Properties Page 47
SGS Canada Inc.
500 m long short radius along N56 centered on each hole. Furthermore, claim boundaries were considered when creating this contour (see Figure 13-1 & Figure 13-3 & Figure 13-4). Similarly, a 3D solid was custom fit, defined around points or cells within a 500 m long radius along N326 and short radius 250 m along N56 centered on each hole i.e. the geometrical zone of influence of drill holes on their grid. This contour is labeled “indicated” (Figure 13-2). Section 13.6 further describes why this contour can be used to limit potential indicated resources recognized by the drill hole. All 3D solids made by NML were verified. SGS Geostat verified that no solids were above the interpreted overburden/Bedrock contact surface. Additionally, the topographic surface was also verified by SGS Geostat. No major discrepancies were found. The topography covers the Property.
Figure 13-2 Howells Lake & Howells River North Inferred and Indicated Zones

Resource Estimation of the Howells Taconite Properties Page 48
SGS Canada Inc.
13.4 3D Modeling
The resource model corresponds to a sedimentary multilayered mineral deposit. Up to 7 layers corresponding to lithological units have been interpreted and modeled by NML geologists. Starting From top to bottom: LC = lean chert, JUIF = jasper upper iron formation, GC = green chert, URC = upper red chert, PGC = pink-green cherty, LRC = lower red chert and LRGC = lower red green chert. Units below LRGC (i.e. RS, BC and QTE) have not been modeled. They are present only in a few holes and do not show any obvious mineralization. NML produced 3D solids for each lithological unit. The bottom interpreted 3D solid of the resource model is the LRGC layer. All of the solids were verified by SGS Geostat. No major discrepancies were found. The 3D solids were created following the contact surfaces between lithological units. The modeling of contact surfaces between retained layers is based on the interpreted geological contact lines by NML geologists on drill sections (Figure 13-11). Those lines were created on every section containing relevant drill hole data. All lithological contact lines were linked together to form surfaces and 3D solids. Figure 13-3 shows the different 3D solids used for the mineral resource estimation. The thickness of each layer narrows towards the western border, and effectively pinches out at the intersection of the layer with the surface. Table 13-3 provides the volumetric characteristics of the proposed resource model i.e. volume, and corresponding average thickness of material in each of the 7 layers of the model. As expected, LC and LRGC are the layers with most material (about 1,392 Mm3 and 1,233 Mm3 respectively). As described in Section 7.2.1, the presence of a thrust fault augments the thickness of almost all layers.
Table 13-3: Volumetric of the Lithological Units in the Resource Model
Unit Description Thickness* (m) Volume
m3 Mm3
LC Lean Chert 41.48 1,392,539,366.66 1,393 JUIF Jasper Upper Iron formation 6.68 191,692,238.89 192 GC Green Chert 2.68 80,919,662.79 81 URC Upper Red Chert 5.39 146,670,849.51 147 PGC Pink Green Chert 24.23 1,157,874,331.80 1,158 LRC Lower Red Chert 4.76 9,264,757.47 9 LRGC Lower Red-Green Chert 26.55 1,232,623,441.42 1,233
Total 4,211,584,648.54 4,212
*Calculated from average thickness of lithological units.
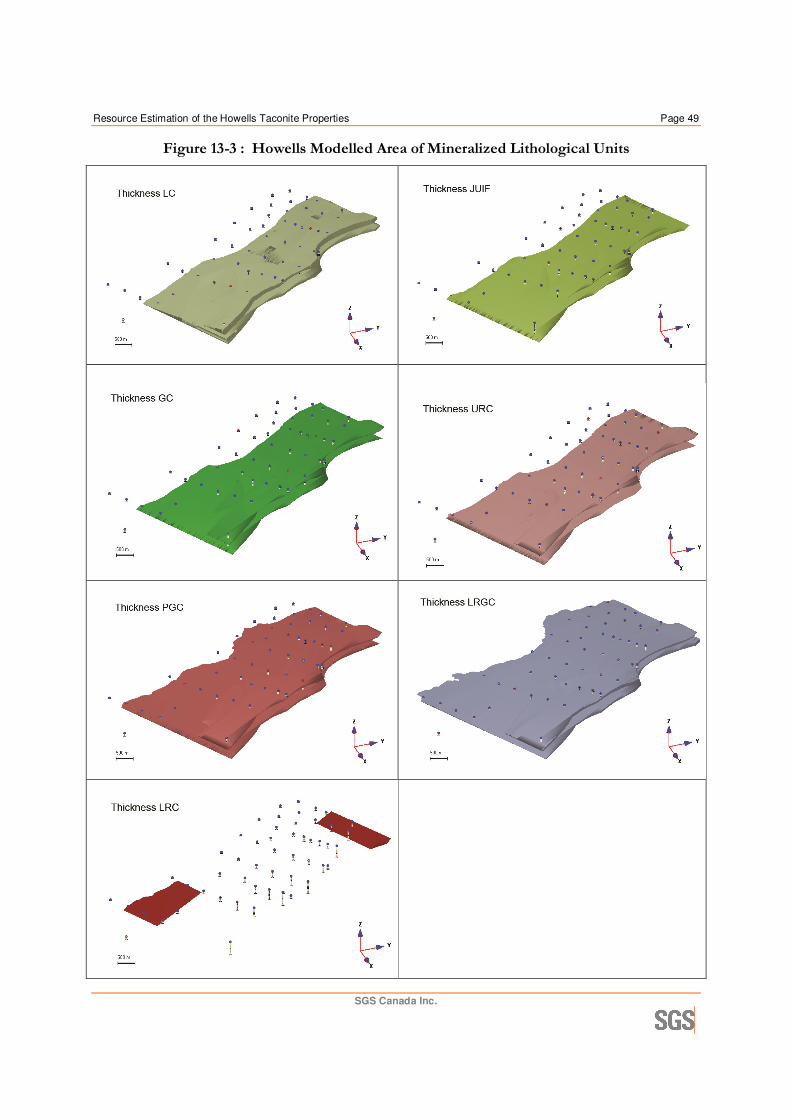
Resource Estimation of the Howells Taconite Properties Page 49
SGS Canada Inc.
Figure 13-3 : Howells Modelled Area of Mineralized Lithological Units
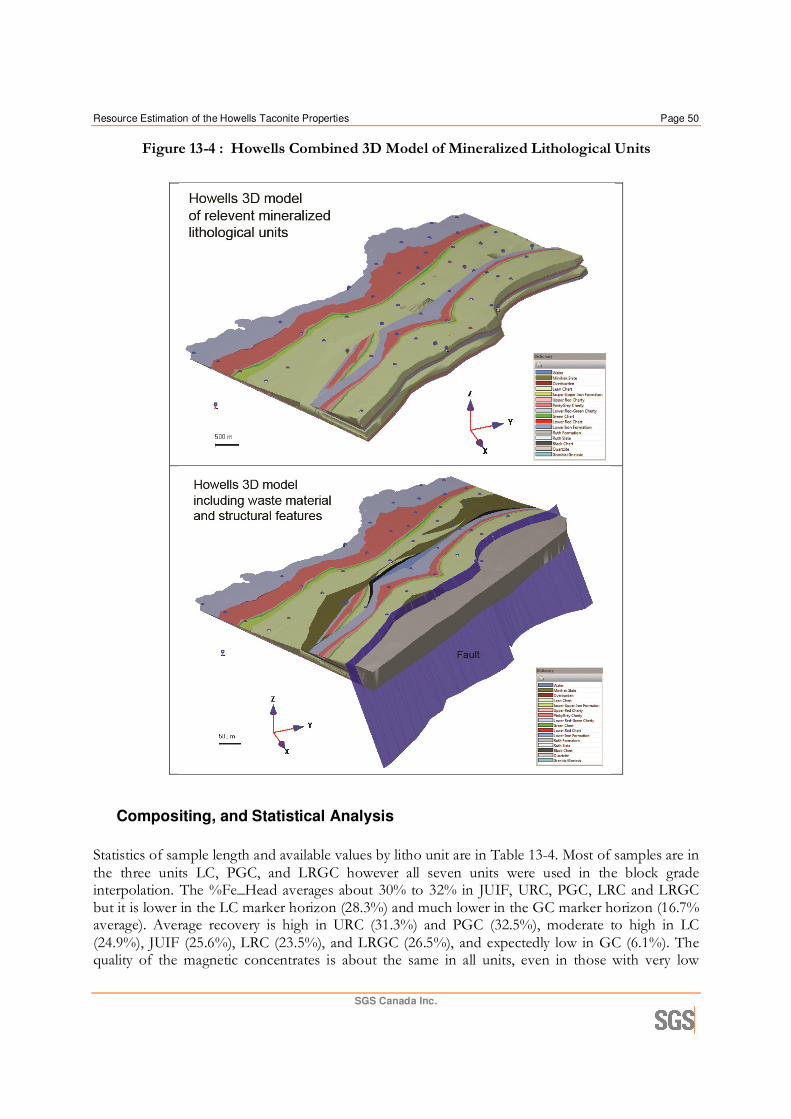
Resource Estimation of the Howells Taconite Properties Page 50
SGS Canada Inc.
Figure 13-4 : Howells Combined 3D Model of Mineralized Lithological Units
Compositing, and Statistical Analysis
Statistics of sample length and available values by litho unit are in Table 13-4. Most of samples are in the three units LC, PGC, and LRGC however all seven units were used in the block grade interpolation. The %Fe_Head averages about 30% to 32% in JUIF, URC, PGC, LRC and LRGC but it is lower in the LC marker horizon (28.3%) and much lower in the GC marker horizon (16.7% average). Average recovery is high in URC (31.3%) and PGC (32.5%), moderate to high in LC (24.9%), JUIF (25.6%), LRC (23.5%), and LRGC (26.5%), and expectedly low in GC (6.1%). The quality of the magnetic concentrates is about the same in all units, even in those with very low

Resource Estimation of the Howells Taconite Properties Page 51
SGS Canada Inc.
recoveries. For samples in all zone presented, the average %Fe_C is around 69%-71% and the average %SiO2_C between 2.2% and 3.3%. Composites were built from selected lithological intercepts (layer intervals). Most of the original samples are approximately 6 m long. There are some shorter and longer samples present in the database and statistics might be biased by some high or low values measured on short or long intervals. A standardization of sample size was done by numerical compositing. In order not to dismiss any assay information, each lithological intercept (layer interval) was composited according to an average calculated length of 6 m. The compositing was completed using the “calculated length” method. The mineralized intervals are divided into composites representing equal lengths that most closely match the desired composite length, in this case 6 metres. This is established individually, intercepts by intercepts, which implies that some intercepts will have slightly longer or shorter composite lengths. The advantage of this approach is that all assays are accounted for in the compositing (no leftovers). Given the relatively long composites for this project, the leftovers have a high potential impact on the end result. The %Fe_ head and % Weight Recovery of composites are standard averages weighted by length while the %Fe_C and %SiO2_C are averages weighted by both length and recovery of the sample fractions within the limits of composites. In the GC and LRC units, the final composites are actually the original samples. Statistics of composite data in the seven units of interest are shown in Table 13-5. They are consistent with statistics of sample data in the same unit. Histograms of composite grades in the same seven units are shown in Figure 13-5 to Figure 13-8. As noted before, the variability of %Fe head is quite limited around 32% Fe for JUIF, URC, PGC and LRC, 28% Fe for LC, 29% for LRGC and 17% for GC with just a few low outliers in the GC. The GC has a distribution around 17% and is wide for the sample population, with some highs and lows. The different Coefficients of variation (i.e. standard deviation divided by mean) do not exceed 15% except in the thin GC unit (31%). Recovery has a high variability; most units have a coefficient of variability above 25%. Despite significant differences of mean %Fe head and weight recovery, %Fe_C and %SiO2_C are rather uniform in all units with typical negatively skewed (mostly high with a tail of low value) histograms for %Fe and corresponding positively skewed (mostly low with a tail of high values) histograms for %SiO2. The presence of two relatively distinct populations in the WtRec histograms of the LC unit can be explained by the relative difference between top, thrusted portion, having higher WtRec values than the bottom portion. The presence of two relatively distinct populations in the WtRec histograms of the LRGC unit can be explained by the relative difference between the southern (higher values) and northern (lower values) part however, this observation is debatable. As for LRC, containing only 5 composites, it is not possible to comment. Correlations between composite values are about the same in all units (Figure 13-9 for unit LC). There is a correlation (R=+0.7) between WtRec and %Fe_Head. However no clear correlation between %Fe_Head and %Fe_C (R=+0.3). There is no correlation between %Fe_C and the WtRec thus indicating the quality of iron concentrate has no bearing on the weight recovery. There is a really strong and expected negative correlation (R=-0.79 to -0.94) between the %Fe_C and %SiO2_C.
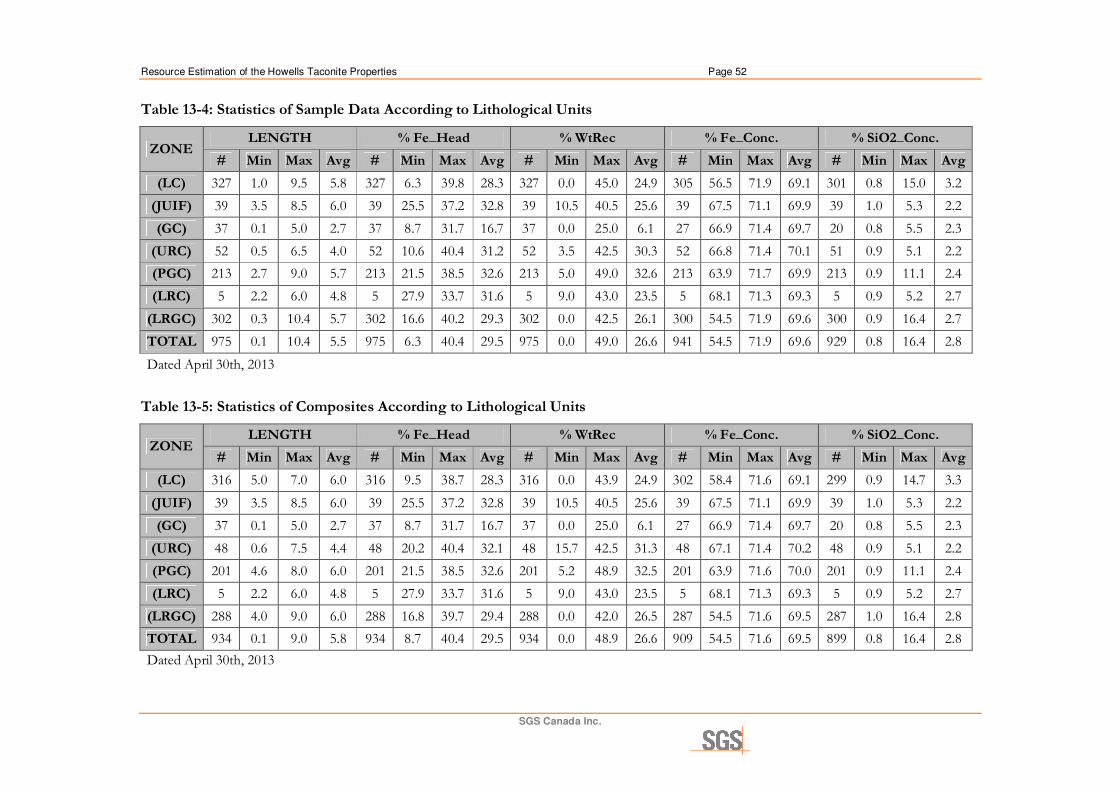
Resource Estimation of the Howells Taconite Properties Page 52
SGS Canada Inc.
Table 13-4: Statistics of Sample Data According to Lithological Units
ZONE LENGTH % Fe_Head % WtRec % Fe_Conc. % SiO2_Conc.
# Min Max Avg # Min Max Avg # Min Max Avg # Min Max Avg # Min Max Avg
(LC) 327 1.0 9.5 5.8 327 6.3 39.8 28.3 327 0.0 45.0 24.9 305 56.5 71.9 69.1 301 0.8 15.0 3.2
(JUIF) 39 3.5 8.5 6.0 39 25.5 37.2 32.8 39 10.5 40.5 25.6 39 67.5 71.1 69.9 39 1.0 5.3 2.2
(GC) 37 0.1 5.0 2.7 37 8.7 31.7 16.7 37 0.0 25.0 6.1 27 66.9 71.4 69.7 20 0.8 5.5 2.3
(URC) 52 0.5 6.5 4.0 52 10.6 40.4 31.2 52 3.5 42.5 30.3 52 66.8 71.4 70.1 51 0.9 5.1 2.2
(PGC) 213 2.7 9.0 5.7 213 21.5 38.5 32.6 213 5.0 49.0 32.6 213 63.9 71.7 69.9 213 0.9 11.1 2.4
(LRC) 5 2.2 6.0 4.8 5 27.9 33.7 31.6 5 9.0 43.0 23.5 5 68.1 71.3 69.3 5 0.9 5.2 2.7
(LRGC) 302 0.3 10.4 5.7 302 16.6 40.2 29.3 302 0.0 42.5 26.1 300 54.5 71.9 69.6 300 0.9 16.4 2.7
TOTAL 975 0.1 10.4 5.5 975 6.3 40.4 29.5 975 0.0 49.0 26.6 941 54.5 71.9 69.6 929 0.8 16.4 2.8
Dated April 30th, 2013
Table 13-5: Statistics of Composites According to Lithological Units
ZONE LENGTH % Fe_Head % WtRec % Fe_Conc. % SiO2_Conc.
# Min Max Avg # Min Max Avg # Min Max Avg # Min Max Avg # Min Max Avg
(LC) 316 5.0 7.0 6.0 316 9.5 38.7 28.3 316 0.0 43.9 24.9 302 58.4 71.6 69.1 299 0.9 14.7 3.3
(JUIF) 39 3.5 8.5 6.0 39 25.5 37.2 32.8 39 10.5 40.5 25.6 39 67.5 71.1 69.9 39 1.0 5.3 2.2
(GC) 37 0.1 5.0 2.7 37 8.7 31.7 16.7 37 0.0 25.0 6.1 27 66.9 71.4 69.7 20 0.8 5.5 2.3
(URC) 48 0.6 7.5 4.4 48 20.2 40.4 32.1 48 15.7 42.5 31.3 48 67.1 71.4 70.2 48 0.9 5.1 2.2
(PGC) 201 4.6 8.0 6.0 201 21.5 38.5 32.6 201 5.2 48.9 32.5 201 63.9 71.6 70.0 201 0.9 11.1 2.4
(LRC) 5 2.2 6.0 4.8 5 27.9 33.7 31.6 5 9.0 43.0 23.5 5 68.1 71.3 69.3 5 0.9 5.2 2.7
(LRGC) 288 4.0 9.0 6.0 288 16.8 39.7 29.4 288 0.0 42.0 26.5 287 54.5 71.6 69.5 287 1.0 16.4 2.8
TOTAL 934 0.1 9.0 5.8 934 8.7 40.4 29.5 934 0.0 48.9 26.6 909 54.5 71.6 69.5 899 0.8 16.4 2.8
Dated April 30th, 2013
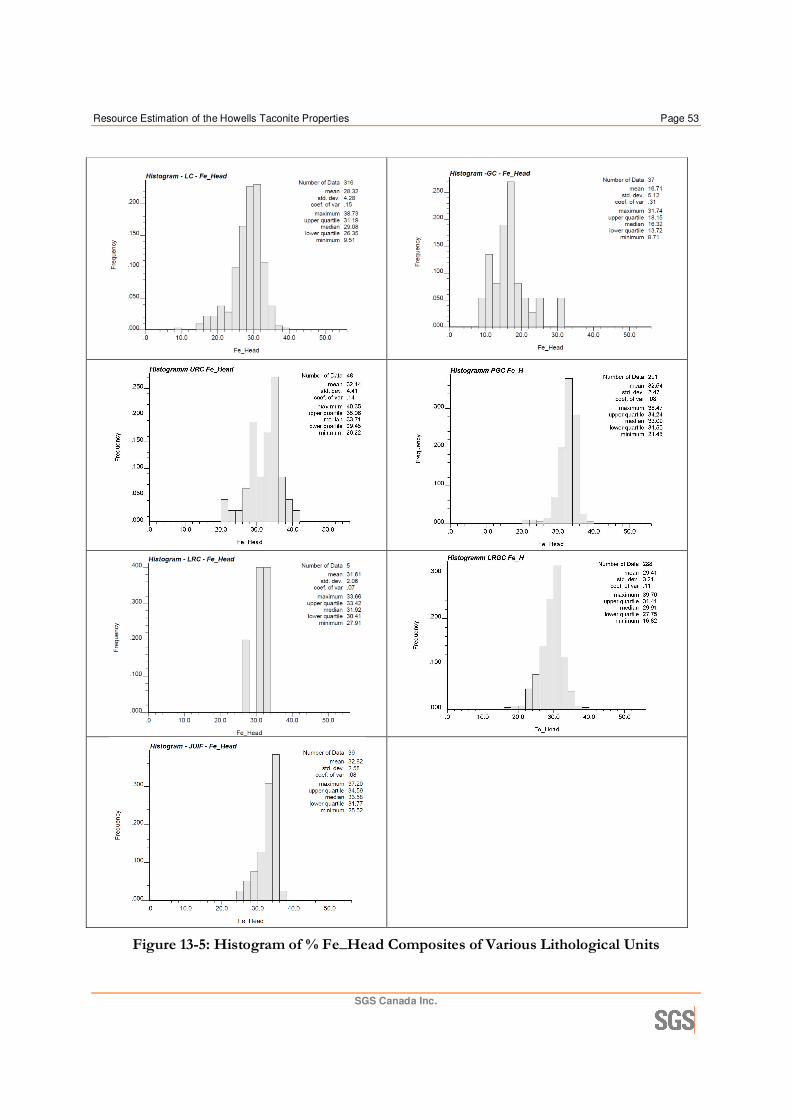
Resource Estimation of the Howells Taconite Properties Page 53
SGS Canada Inc.
Figure 13-5: Histogram of % Fe_Head Composites of Various Lithological Units
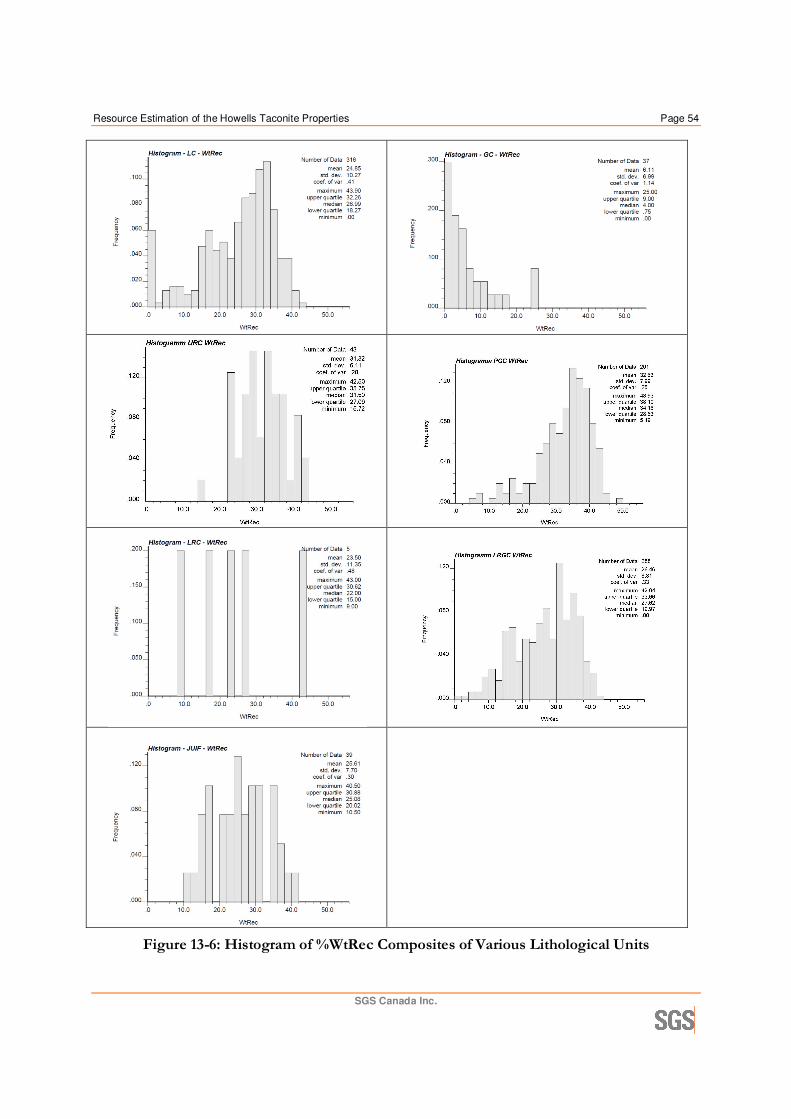
Resource Estimation of the Howells Taconite Properties Page 54
SGS Canada Inc.
Figure 13-6: Histogram of %WtRec Composites of Various Lithological Units

Resource Estimation of the Howells Taconite Properties Page 55
SGS Canada Inc.
Figure 13-7: Histogram of %Fe_C Composites of Various Lithological Units

Resource Estimation of the Howells Taconite Properties Page 56
SGS Canada Inc.
Figure 13-8: Histogram of %SiO2_C Composites of Various Lithological Units
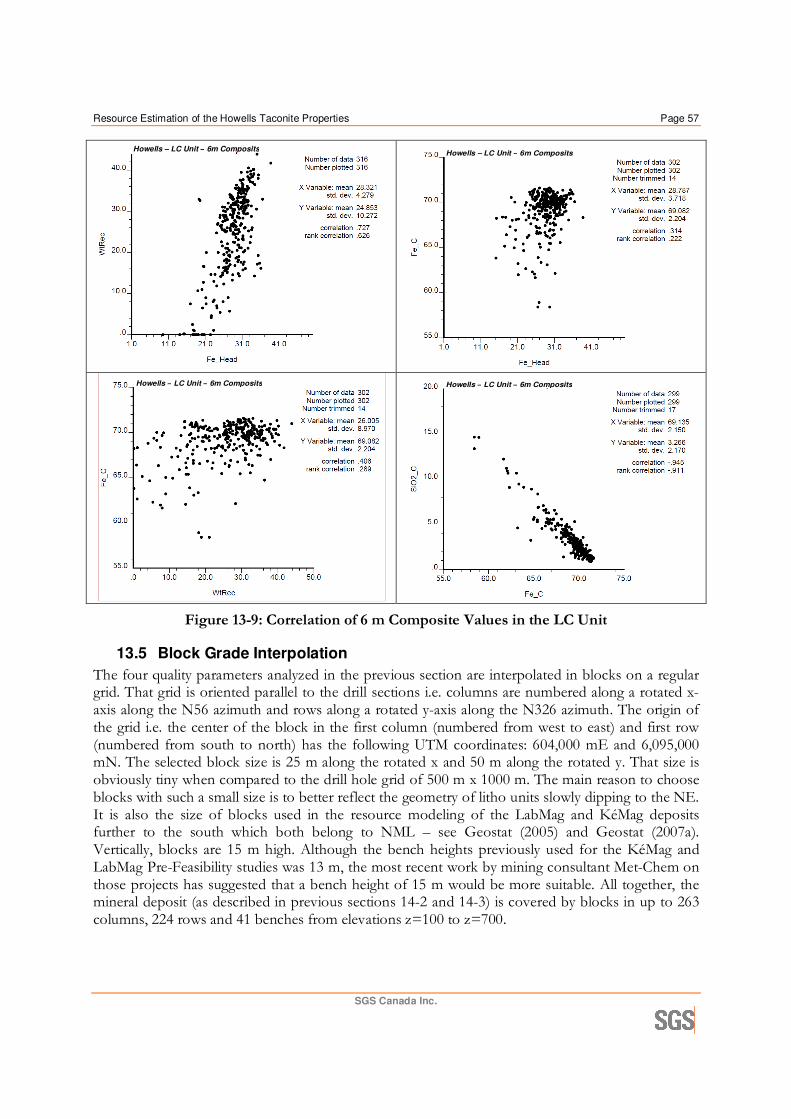
Resource Estimation of the Howells Taconite Properties Page 57
SGS Canada Inc.
Figure 13-9: Correlation of 6 m Composite Values in the LC Unit
13.5 Block Grade Interpolation
The four quality parameters analyzed in the previous section are interpolated in blocks on a regular grid. That grid is oriented parallel to the drill sections i.e. columns are numbered along a rotated x-axis along the N56 azimuth and rows along a rotated y-axis along the N326 azimuth. The origin of the grid i.e. the center of the block in the first column (numbered from west to east) and first row (numbered from south to north) has the following UTM coordinates: 604,000 mE and 6,095,000 mN. The selected block size is 25 m along the rotated x and 50 m along the rotated y. That size is obviously tiny when compared to the drill hole grid of 500 m x 1000 m. The main reason to choose blocks with such a small size is to better reflect the geometry of litho units slowly dipping to the NE. It is also the size of blocks used in the resource modeling of the LabMag and KéMag deposits further to the south which both belong to NML – see Geostat (2005) and Geostat (2007a). Vertically, blocks are 15 m high. Although the bench heights previously used for the KéMag and LabMag Pre-Feasibility studies was 13 m, the most recent work by mining consultant Met-Chem on those projects has suggested that a bench height of 15 m would be more suitable. All together, the mineral deposit (as described in previous sections 14-2 and 14-3) is covered by blocks in up to 263 columns, 224 rows and 41 benches from elevations z=100 to z=700.
Howells – LC Unit – 6m Composits Howells – LC Unit – 6m Composits Howells – LC Unit – 6m Composits Howells – LC Unit – 6m Composits
Howells – LC Unit – 6m Composits Howells – LC Unit – 6m Composits
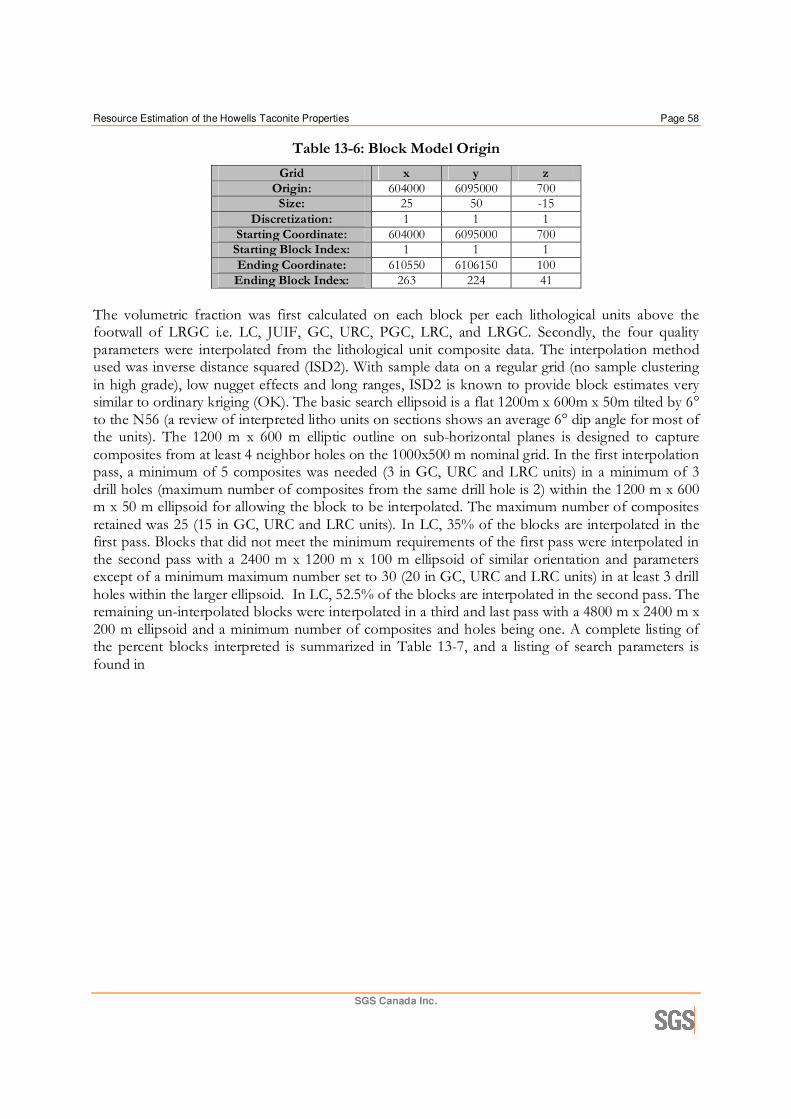
Resource Estimation of the Howells Taconite Properties Page 58
SGS Canada Inc.
Table 13-6: Block Model Origin
Grid x y z
Origin: 604000 6095000 700 Size: 25 50 -15
Discretization: 1 1 1 Starting Coordinate: 604000 6095000 700 Starting Block Index: 1 1 1 Ending Coordinate: 610550 6106150 100 Ending Block Index: 263 224 41
The volumetric fraction was first calculated on each block per each lithological units above the footwall of LRGC i.e. LC, JUIF, GC, URC, PGC, LRC, and LRGC. Secondly, the four quality parameters were interpolated from the lithological unit composite data. The interpolation method used was inverse distance squared (ISD2). With sample data on a regular grid (no sample clustering in high grade), low nugget effects and long ranges, ISD2 is known to provide block estimates very similar to ordinary kriging (OK). The basic search ellipsoid is a flat 1200m x 600m x 50m tilted by 6° to the N56 (a review of interpreted litho units on sections shows an average 6° dip angle for most of the units). The 1200 m x 600 m elliptic outline on sub-horizontal planes is designed to capture composites from at least 4 neighbor holes on the 1000x500 m nominal grid. In the first interpolation pass, a minimum of 5 composites was needed (3 in GC, URC and LRC units) in a minimum of 3 drill holes (maximum number of composites from the same drill hole is 2) within the 1200 m x 600 m x 50 m ellipsoid for allowing the block to be interpolated. The maximum number of composites retained was 25 (15 in GC, URC and LRC units). In LC, 35% of the blocks are interpolated in the first pass. Blocks that did not meet the minimum requirements of the first pass were interpolated in the second pass with a 2400 m x 1200 m x 100 m ellipsoid of similar orientation and parameters except of a minimum maximum number set to 30 (20 in GC, URC and LRC units) in at least 3 drill holes within the larger ellipsoid. In LC, 52.5% of the blocks are interpolated in the second pass. The remaining un-interpolated blocks were interpolated in a third and last pass with a 4800 m x 2400 m x 200 m ellipsoid and a minimum number of composites and holes being one. A complete listing of the percent blocks interpreted is summarized in Table 13-7, and a listing of search parameters is found in

Resource Estimation of the Howells Taconite Properties Page 59
SGS Canada Inc.
Table 13-8 and Table 13-9.
Table 13-7: Summary of Interpolated Blocks by Pass
ZONE Pass 1 Pass 2 Pass 3 Total
Blocks Percent Blocks Percent Blocks Percent Blocks Percent
LC 34419 35% 51378 52.50% 12067 12.33% 97864 100% JUIF 1012 4% 19635 77.31% 4752 18.71% 25399 100% GC 541 4% 8001 53.39% 6444 43.00% 14986 100%
URC 7846 35% 13104 58.81% 1333 5.98% 22283 100% PGC 29384 41% 35233 49.69% 6290 8.87% 70907 100% LRC 1 0.1% 403 23.21% 1332 76.73% 1736 100%
LRGC 42086 42% 49779 49.99% 7703 7.74% 99568 100%

Resource Estimation of the Howells Taconite Properties Page 60
SGS Canada Inc.
Table 13-8: Estimation Settings Search Parameters
Estimation Method Inverse Distance Squared (ID2)
Unit Search Ellipse
Estimation Run
Maximum Nb of Samples
minimum Number of Samples
Max Nb of Samples per Hole
LC Pass 1 #1 25 5 2 Pass 2 #2 30 5 2 Pass 3 #3 30 1 -
JUIF Pass 1 #1 25 5 2 Pass 2 #2 30 5 2 Pass 3 #3 30 1 -
GC Pass 1 #1 15 3 2 Pass 2 #2 20 3 2 Pass 3 #3 30 1 -
URC Pass 1 #1 15 3 2 Pass 2 #2 20 3 2 Pass 3 #3 30 1 -
PGC Pass 1 #1 25 5 2 Pass 2 #2 30 5 2 Pass 3 #3 30 1 -
LRC Pass 1 #1 15 3 2 Pass 2 #2 20 3 2 Pass 3 #3 30 1 -
LRGC Pass 1 #1 25 5 2 Pass 2 #2 30 5 2 Pass 3 #3 30 1 -
Table 13-9: Estimation Settings Ellipse Parameters.
Search Ellipse Azimuth Dip Spin Major Axis (m) Medium Axis (m) Minor Axis (m)
Pass 1 326 0 6 1200 600 50 Pass 2 326 0 6 2400 1200 100 Pass 3 326 0 6 4800 2400 200
Two of the interpolated parameters, %Fe_Head and %WtRec are additive variables and can be interpolated as weighted average of sample data. The other two variables, %Fe_C and %SiO2_C are non-additive since averages need to be weighted by weight recovery. Theoretically, one should interpolate the product of concentrate grade by recovery and divide the interpolated product by the interpolated recovery in order to get interpolated grade of concentrate. The problem with this theoretically sound approach is with missing concentrate grades, particularly %SiO2: since we do not interpolate the products and recovery with the same composites, the final ratio of interpolated values may yield odd results. Hence the theoretically incorrect direct interpolation of %Fe and %SiO2 of concentrate is preferable since it provides more robust results. Statistics of interpolated block values are on Table 13-10. As expected from the regular grid of composites, average block values are close to average composite values in the same unit (Table 13-5). As expected too, the range of block values is slightly narrower than the range of composite data.

Resource Estimation of the Howells Taconite Properties Page 61
SGS Canada Inc.
Block estimates are illustrated by those of the LRGC unit in the twelfth bench on Figure 13-10. The four quality estimates for unit fractions in the same blocks were merged together for a total fraction of LC+JUIF+GC+URC+PGC+LRC+LGRC in a single set of quality estimates of that fraction in the block. In that operation, quality estimates of each unit fraction are weighted by the volumetric unit fraction and also the calculated density based on iron content. For detailed density information refer to section 13.1 and Table 13-2. Altogether, (no cut-off grade applied) there are 240,937 merged blocks 50x25x15 m present in one or a fraction of the seven mineralized units LC+JUIF+GC+URC+PGC+LRC+LRGC. Statistics of estimated quality values for those total fractions in blocks appear on the last line of Table 13-10. Drill sections through the block model are shown in Figure 13-11.

Resource Estimation of the Howells Taconite Properties Page 62
SGS Canada Inc.
Table 13-10: Statistics of Interpolated Block values according to litho units
Zone # of Blocks
Volume Fraction of Block
(%) % Fe_Head %WtRec % Fe_C % SiO2_C
(Mm3) Min Max Avg Min Max Avg Min Max Avg Min Max Avg Min Max Avg
LC 97621 1389 0.01 1.00 0.76 11.62 36.55 27.43 0.00 42.28 22.59 59.91 71.47 68.90 0.93 13.16 3.37
JUIF 25246 159 0.01 1.00 0.34 25.89 36.97 32.67 10.67 39.66 26.16 67.57 71.04 69.98 1.24 5.22 2.15
GC 14872 48 0.01 0.43 0.17 8.82 31.36 16.90 0.00 24.79 5.92 66.90 71.34 69.71 0.77 5.44 2.33
URC 22136 114 0.01 1.00 0.27 20.37 40.23 32.58 16.18 42.49 32.20 67.53 71.35 70.25 0.95 5.05 2.15 PGC 70673 810 0.01 1.00 0.61 21.91 36.80 32.60 6.84 47.73 31.82 64.18 71.45 70.05 1.02 10.59 2.32
LRC 1713 6 0.01 0.87 0.19 28.50 33.66 32.97 9.00 42.86 18.06 68.27 71.31 70.58 0.94 3.28 1.51 LRGC 99236 1228 0.01 1.00 0.66 17.59 36.22 29.49 1.52 40.16 27.09 58.45 71.28 69.68 1.13 12.97 2.57
All 240937 3750 0.01 1.03 0.83 10.25 36.56 29.33 0.00 47.05 26.00 58.45 71.43 69.45 0.94 13.16 2.83 The term “All” is a summary of the complete block model. Since blocks are shared between units, the summations, minimum, maximum and average values are taken from a complete list of interpolated blocks.
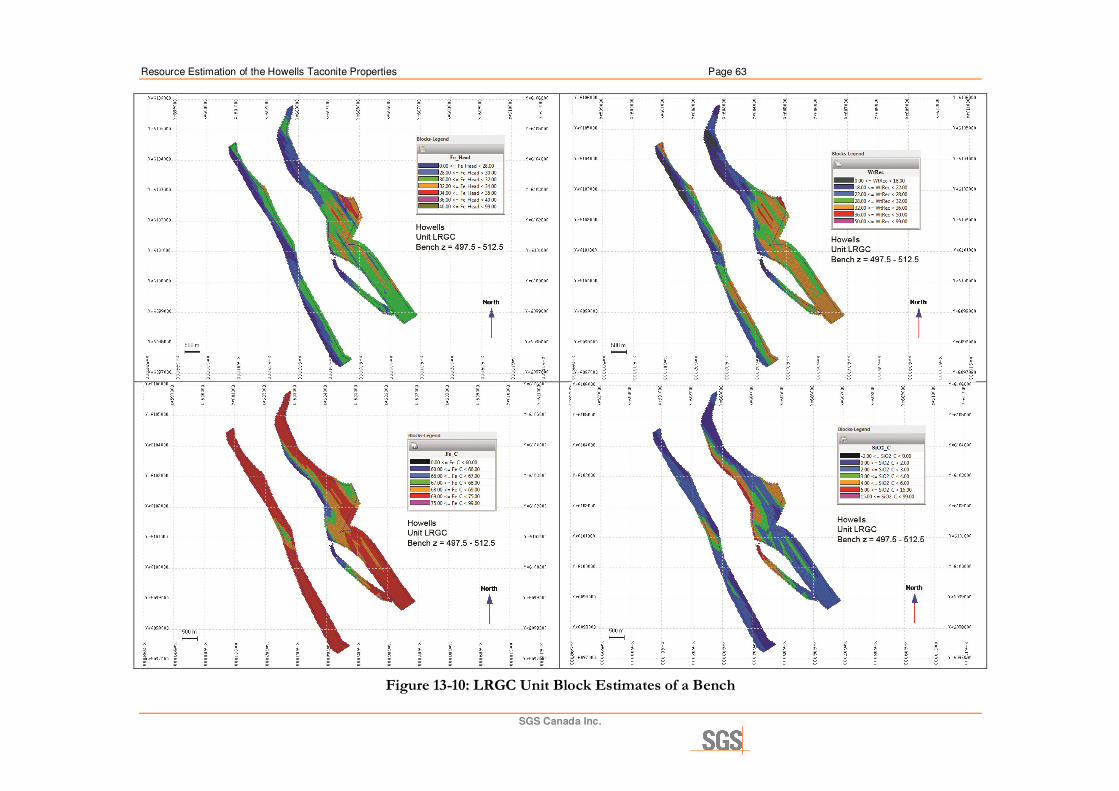
Resource Estimation of the Howells Taconite Properties Page 63
SGS Canada Inc.
Figure 13-10: LRGC Unit Block Estimates of a Bench

Resource Estimation of the Howells Taconite Properties Page 64
SGS Canada Inc.
Figure 13-11: Drill Sections through Block Model
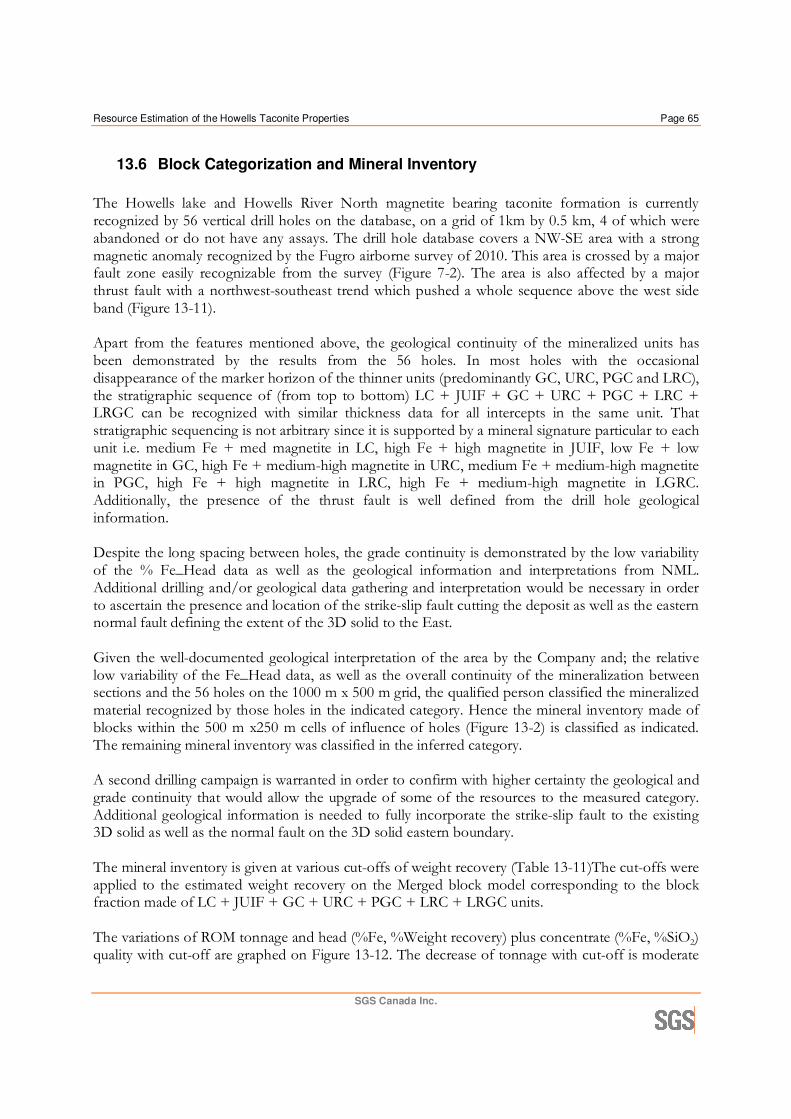
Resource Estimation of the Howells Taconite Properties Page 65
SGS Canada Inc.
13.6 Block Categorization and Mineral Inventory
The Howells lake and Howells River North magnetite bearing taconite formation is currently recognized by 56 vertical drill holes on the database, on a grid of 1km by 0.5 km, 4 of which were abandoned or do not have any assays. The drill hole database covers a NW-SE area with a strong magnetic anomaly recognized by the Fugro airborne survey of 2010. This area is crossed by a major fault zone easily recognizable from the survey (Figure 7-2). The area is also affected by a major thrust fault with a northwest-southeast trend which pushed a whole sequence above the west side band (Figure 13-11). Apart from the features mentioned above, the geological continuity of the mineralized units has been demonstrated by the results from the 56 holes. In most holes with the occasional disappearance of the marker horizon of the thinner units (predominantly GC, URC, PGC and LRC), the stratigraphic sequence of (from top to bottom) LC + JUIF + GC + URC + PGC + LRC + LRGC can be recognized with similar thickness data for all intercepts in the same unit. That stratigraphic sequencing is not arbitrary since it is supported by a mineral signature particular to each unit i.e. medium Fe + med magnetite in LC, high Fe + high magnetite in JUIF, low Fe + low magnetite in GC, high Fe + medium-high magnetite in URC, medium Fe + medium-high magnetite in PGC, high Fe + high magnetite in LRC, high Fe + medium-high magnetite in LGRC. Additionally, the presence of the thrust fault is well defined from the drill hole geological information. Despite the long spacing between holes, the grade continuity is demonstrated by the low variability of the % Fe_Head data as well as the geological information and interpretations from NML. Additional drilling and/or geological data gathering and interpretation would be necessary in order to ascertain the presence and location of the strike-slip fault cutting the deposit as well as the eastern normal fault defining the extent of the 3D solid to the East. Given the well-documented geological interpretation of the area by the Company and; the relative low variability of the Fe_Head data, as well as the overall continuity of the mineralization between sections and the 56 holes on the 1000 m x 500 m grid, the qualified person classified the mineralized material recognized by those holes in the indicated category. Hence the mineral inventory made of blocks within the 500 m x250 m cells of influence of holes (Figure 13-2) is classified as indicated. The remaining mineral inventory was classified in the inferred category. A second drilling campaign is warranted in order to confirm with higher certainty the geological and grade continuity that would allow the upgrade of some of the resources to the measured category. Additional geological information is needed to fully incorporate the strike-slip fault to the existing 3D solid as well as the normal fault on the 3D solid eastern boundary. The mineral inventory is given at various cut-offs of weight recovery (Table 13-11)The cut-offs were applied to the estimated weight recovery on the Merged block model corresponding to the block fraction made of LC + JUIF + GC + URC + PGC + LRC + LRGC units. The variations of ROM tonnage and head (%Fe, %Weight recovery) plus concentrate (%Fe, %SiO2) quality with cut-off are graphed on Figure 13-12. The decrease of tonnage with cut-off is moderate
Resource Estimation of the Howells Taconite Properties Page 66
SGS Canada Inc.
at low cut-off (0-25% weight recovery) as most of the material in all of the units is eliminated. The rate of decrease is accelerated for high cut-offs (25-28% weight recovery) as the remainder of the material is eliminated. The increase of average weight recovery with cut-off follows the same trends for indicated and inferred material. As expected from the moderate to high positive correlation of %Fe Head and %WtRec in samples (Figure 13-9), there is a slight increase of average %Fe_Head with the cut-off, with a slight advantage for the inferred material. The mild negative correlation of %Fe of concentrate and weight recovery in samples (Figure 13-9) explains the slight but steady increase of %Fe_C and decrease of %SiO2_C with cut-off.
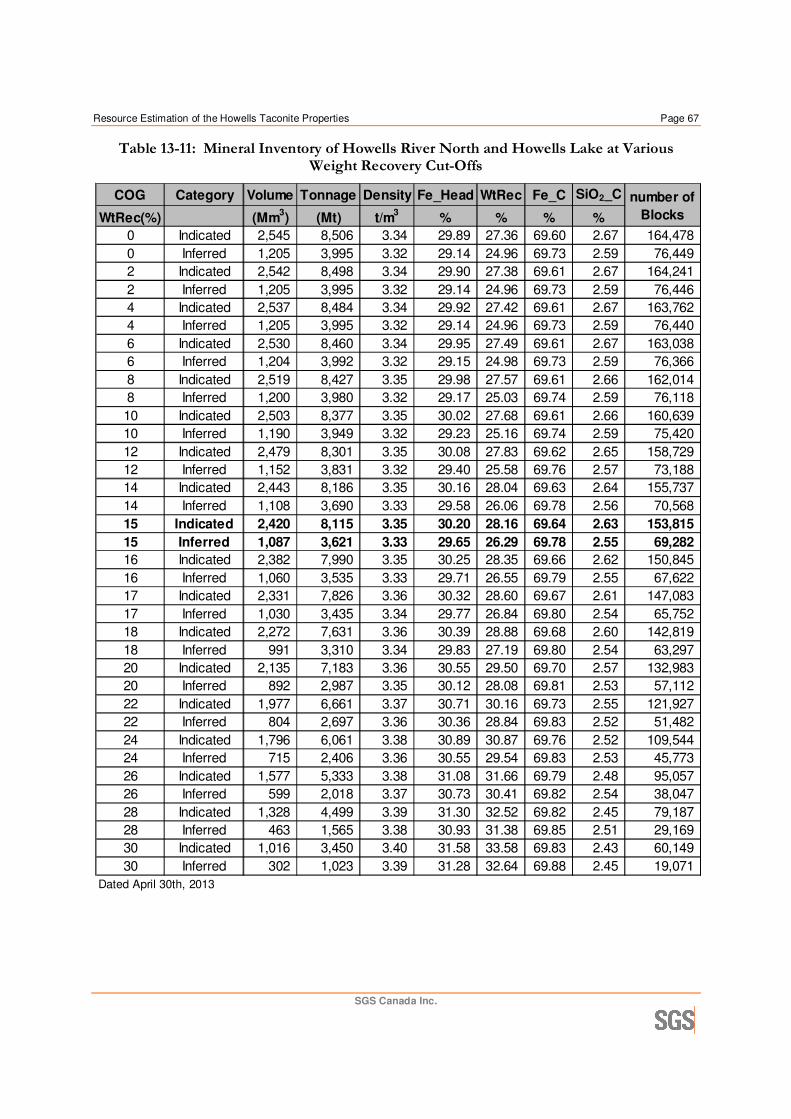
Resource Estimation of the Howells Taconite Properties Page 67
SGS Canada Inc.
Table 13-11: Mineral Inventory of Howells River North and Howells Lake at Various Weight Recovery Cut-Offs
COG Category Volume Tonnage Density Fe_Head WtRec Fe_C SiO2_C
WtRec(%) (Mm3) (Mt) t/m
3% % % %
0 Indicated 2,545 8,506 3.34 29.89 27.36 69.60 2.67 164,478
0 Inferred 1,205 3,995 3.32 29.14 24.96 69.73 2.59 76,449
2 Indicated 2,542 8,498 3.34 29.90 27.38 69.61 2.67 164,241
2 Inferred 1,205 3,995 3.32 29.14 24.96 69.73 2.59 76,446
4 Indicated 2,537 8,484 3.34 29.92 27.42 69.61 2.67 163,762
4 Inferred 1,205 3,995 3.32 29.14 24.96 69.73 2.59 76,440
6 Indicated 2,530 8,460 3.34 29.95 27.49 69.61 2.67 163,038
6 Inferred 1,204 3,992 3.32 29.15 24.98 69.73 2.59 76,366
8 Indicated 2,519 8,427 3.35 29.98 27.57 69.61 2.66 162,014
8 Inferred 1,200 3,980 3.32 29.17 25.03 69.74 2.59 76,118
10 Indicated 2,503 8,377 3.35 30.02 27.68 69.61 2.66 160,639
10 Inferred 1,190 3,949 3.32 29.23 25.16 69.74 2.59 75,420
12 Indicated 2,479 8,301 3.35 30.08 27.83 69.62 2.65 158,729
12 Inferred 1,152 3,831 3.32 29.40 25.58 69.76 2.57 73,188
14 Indicated 2,443 8,186 3.35 30.16 28.04 69.63 2.64 155,737
14 Inferred 1,108 3,690 3.33 29.58 26.06 69.78 2.56 70,568
15 Indicated 2,420 8,115 3.35 30.20 28.16 69.64 2.63 153,815
15 Inferred 1,087 3,621 3.33 29.65 26.29 69.78 2.55 69,282
16 Indicated 2,382 7,990 3.35 30.25 28.35 69.66 2.62 150,845
16 Inferred 1,060 3,535 3.33 29.71 26.55 69.79 2.55 67,622
17 Indicated 2,331 7,826 3.36 30.32 28.60 69.67 2.61 147,083
17 Inferred 1,030 3,435 3.34 29.77 26.84 69.80 2.54 65,752
18 Indicated 2,272 7,631 3.36 30.39 28.88 69.68 2.60 142,819
18 Inferred 991 3,310 3.34 29.83 27.19 69.80 2.54 63,297
20 Indicated 2,135 7,183 3.36 30.55 29.50 69.70 2.57 132,983
20 Inferred 892 2,987 3.35 30.12 28.08 69.81 2.53 57,112
22 Indicated 1,977 6,661 3.37 30.71 30.16 69.73 2.55 121,927
22 Inferred 804 2,697 3.36 30.36 28.84 69.83 2.52 51,482
24 Indicated 1,796 6,061 3.38 30.89 30.87 69.76 2.52 109,544
24 Inferred 715 2,406 3.36 30.55 29.54 69.83 2.53 45,773
26 Indicated 1,577 5,333 3.38 31.08 31.66 69.79 2.48 95,057
26 Inferred 599 2,018 3.37 30.73 30.41 69.82 2.54 38,047
28 Indicated 1,328 4,499 3.39 31.30 32.52 69.82 2.45 79,187
28 Inferred 463 1,565 3.38 30.93 31.38 69.85 2.51 29,169
30 Indicated 1,016 3,450 3.40 31.58 33.58 69.83 2.43 60,149
30 Inferred 302 1,023 3.39 31.28 32.64 69.88 2.45 19,071
Dated April 30th, 2013
number of
Blocks

Resource Estimation of the Howells Taconite Properties Page 68
SGS Canada Inc.
Figure 13-12: Mineral Inventory with Weight Recovery Cut-Off
0.0
5.0
10.0
15.0
20.0
25.0
30.0
35.0
40.0
0.0
1000.0
2000.0
3000.0
4000.0
5000.0
6000.0
7000.0
8000.0
9000.0
0 10 20 30
%F
eH
an
d %
Weig
ht
reco
very
ab
ove c
ut-
off
To
nn
ag
e R
OM
ab
ove c
ut-
off
%Weight Recovery Cut-off
Howells Mineral Inventory
Indicated Tonnage Inferred tonnage Indicated WRec
Inferred WRec Indicated FeH Inferred FeH
2.4
2.5
2.5
2.6
2.6
2.7
2.7
69.6
69.6
69.7
69.7
69.8
69.8
69.9
69.9
0 10 20 30 %S
iO2 c
on
cen
trate
ab
ove c
ut-
off
%F
e
co
ncen
trate
ab
ove c
ut-
off
%Weight Recovery Cut-off
Howells Mineral Inventory
Indicated FeC Inferred FeC Indicated SiO2C Inferred SiO2C

Resource Estimation of the Howells Taconite Properties Page 69
SGS Canada Inc.
13.7 Estimated Resources
SGS Geostat considers that mineral resources (MRE) defined at Howells are meeting the requirement of a reasonable prospect for economic extraction. Traditionally, the cut-off used by NML to report MRE in the taconite deposits of the Labrador Trough is a minimum 18% weight recovery of the magnetic concentrate from Davis Tube test on material ground to 325 mesh (see WGM (2006), Geostat (2007a+b) and BBA (2009)). According to BBA (2009) the unit cost and concentrate values used in the PFS of KéMag suggest a lower marginal cut-off (such that the concentrate value pays for the processing cost to produce that concentrate). In that study, a pit optimization is run with a C$4.03/t ROM total processing + G&A cost and a concentrate value of C$49.92/t CC (unit mining cost is C$1.75/t ROM) hence a marginal weight recovery cut-off of : 4.03/49.92 = 8%. For Howells, NML is currently proposing the following tentative parameters: concentrate value = $68.41/t CC, crushing and concentration = $11.45/t CC, concentrate handling (pipeline + filtration + port/loading) + G&A = $3.21/t CC, mining cost (ore and waste) = $2.50/t ROM and mining cost (overburden) = $1.70/t OVBD. Given that the crushing and concentration cost is given for an average weight recovery of 28% (above the traditional COG of 18%), it translates into a crushing + concentration cost of: 11.45*0.28 = $3.21/t ROM hence a marginal cut-off of: 3.21/ 68.41 = 4.69%. SGS Geostat has run a Whittle optimized pit shell based on the mineral inventory described in previous sections (both indicated and inferred blocks), using the above NML cost and value parameters and a maximum pit slope angle of 50°. The optimized pit shell (Figure 13-13) includes most of the mineral inventory and 89% of all blocks with an estimated weight recovery above 15% recovery cut-off. As a result, the proposed MRE for Howells are made of all the blocks of the mineral inventory above 15% minimum weight recovery cut-off (not restrained by any pit shell). They are listed by unit, total and total after merging unit fractions in blocks in Table 13-12. As expected from the statistics of sample data in each unit, there are no resources above 15% recovery in the GC. The 0 tonnage in the following tables for the indicated GC unit in the following tables corresponds to a tonnage less than 500,000 tonnes and is therefore described as 0. The 0 tonnage in the indicated and inferred LRC Units in correspond absence of material above COG. Also present are the MRE based on a COG of 18% WtRec (Table 13-15, Table 13-16 & Table 13-17). These tables are there to show continuity with NML resources statement from past work on similar deposits. Please note that the MRE at a COG WtRec of 15% represent the base case resources statement on Howells Properties.
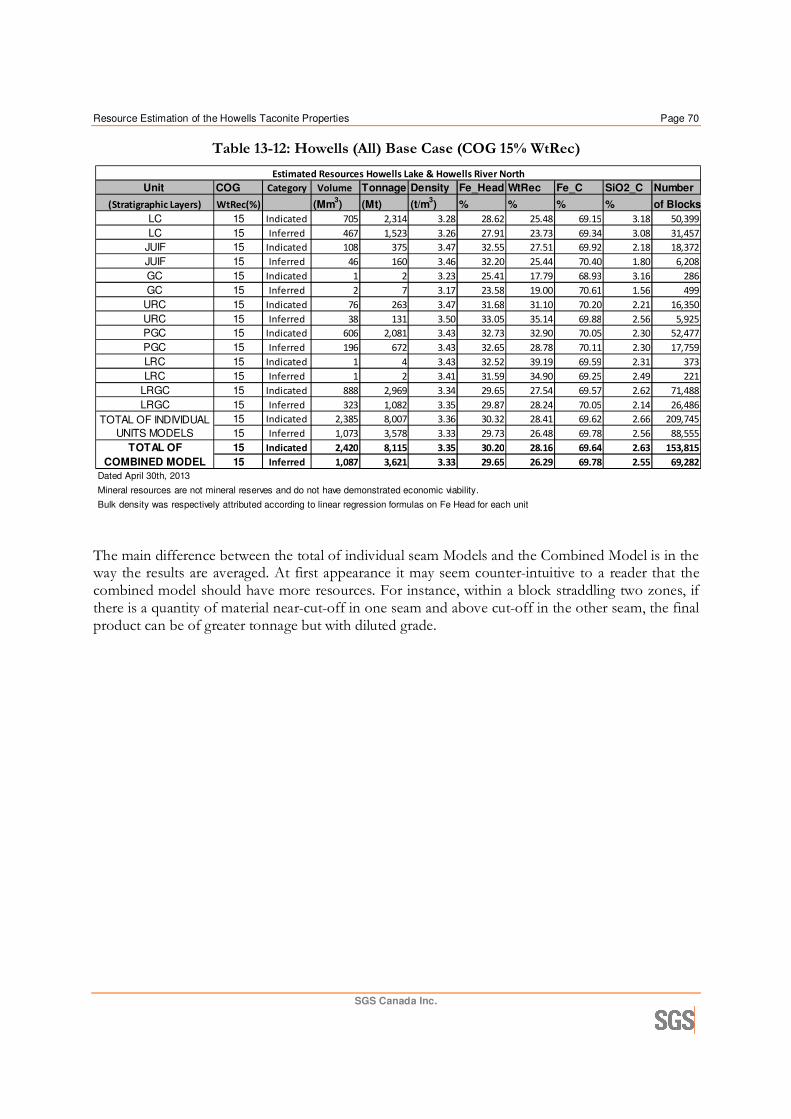
Resource Estimation of the Howells Taconite Properties Page 70
SGS Canada Inc.
Table 13-12: Howells (All) Base Case (COG 15% WtRec)
The main difference between the total of individual seam Models and the Combined Model is in the way the results are averaged. At first appearance it may seem counter-intuitive to a reader that the combined model should have more resources. For instance, within a block straddling two zones, if there is a quantity of material near-cut-off in one seam and above cut-off in the other seam, the final product can be of greater tonnage but with diluted grade.
Unit COG Category Volume Tonnage Density Fe_Head WtRec Fe_C SiO2_C Number
(Stratigraphic Layers) WtRec(%) (Mm3) (Mt) (t/m
3) % % % % of Blocks
LC 15 Indicated 705 2,314 3.28 28.62 25.48 69.15 3.18 50,399
LC 15 Inferred 467 1,523 3.26 27.91 23.73 69.34 3.08 31,457
JUIF 15 Indicated 108 375 3.47 32.55 27.51 69.92 2.18 18,372
JUIF 15 Inferred 46 160 3.46 32.20 25.44 70.40 1.80 6,208
GC 15 Indicated 1 2 3.23 25.41 17.79 68.93 3.16 286
GC 15 Inferred 2 7 3.17 23.58 19.00 70.61 1.56 499
URC 15 Indicated 76 263 3.47 31.68 31.10 70.20 2.21 16,350
URC 15 Inferred 38 131 3.50 33.05 35.14 69.88 2.56 5,925
PGC 15 Indicated 606 2,081 3.43 32.73 32.90 70.05 2.30 52,477
PGC 15 Inferred 196 672 3.43 32.65 28.78 70.11 2.30 17,759
LRC 15 Indicated 1 4 3.43 32.52 39.19 69.59 2.31 373
LRC 15 Inferred 1 2 3.41 31.59 34.90 69.25 2.49 221
LRGC 15 Indicated 888 2,969 3.34 29.65 27.54 69.57 2.62 71,488
LRGC 15 Inferred 323 1,082 3.35 29.87 28.24 70.05 2.14 26,486
15 Indicated 2,385 8,007 3.36 30.32 28.41 69.62 2.66 209,745
15 Inferred 1,073 3,578 3.33 29.73 26.48 69.78 2.56 88,555
15 Indicated 2,420 8,115 3.35 30.20 28.16 69.64 2.63 153,815
15 Inferred 1,087 3,621 3.33 29.65 26.29 69.78 2.55 69,282
Dated April 30th, 2013
Mineral resources are not mineral reserves and do not have demonstrated economic viability.
Bulk density was respectively attributed according to linear regression formulas on Fe Head for each unit
Estimated Resources Howells Lake & Howells River North
TOTAL OF INDIVIDUAL
UNITS MODELS
TOTAL OF
COMBINED MODEL

Resource Estimation of the Howells Taconite Properties Page 71
SGS Canada Inc.
Table 13-13: Howells Lake Base Case MRE (COG 15% WtRec)
Table 13-14: Howells River North Base Case MRE (COG 15% WtRec)
Unit COG Category Volume Tonnage Density Fe_Head WtRec Fe_C SiO2_C Number
(Stratigraphic Layers) WtRec(%) (Mm3) (Mt) (t/m
3) % % % % of Blocks
LC 15 Indicated 634 2,080 3.28 28.63 25.28 69.11 3.23 45,012
LC 15 Inferred 92 307 3.32 30.29 24.95 68.66 3.83 6,635
JUIF 15 Indicated 93 323 3.47 32.45 28.03 69.90 2.22 15,855
JUIF 15 Inferred 10 34 3.46 32.02 26.73 70.38 1.84 1,361
GC 15 Indicated 0 1 3.22 25.33 18.09 68.63 3.93 172
GC 15 Inferred 0 0 3.13 22.03 15.66 70.44 1.51 4
URC 15 Indicated 70 243 3.47 31.50 30.71 70.20 2.21 14,900
URC 15 Inferred 11 36 3.43 29.78 29.38 69.91 2.38 1,898
PGC 15 Indicated 507 1,741 3.43 32.52 33.07 70.12 2.23 44,123
PGC 15 Inferred 41 142 3.42 32.10 27.41 70.36 2.07 4,115
LRC 15 Indicated 0 0 0.00 0.00 0.00 0.00 0.00 -
LRC 15 Inferred 0 0 0.00 0.00 0.00 0.00 0.00 -
LRGC 15 Indicated 743 2,484 3.34 29.65 27.10 69.47 2.73 59,483
LRGC 15 Inferred 91 302 3.32 29.00 23.79 70.27 1.94 7,397
15 Indicated 2,049 6,872 3.35 30.23 28.18 69.58 2.70 179,545
15 Inferred 245 821 3.35 30.17 25.20 69.66 2.69 21,410
15 Indicated 2,081 6,972 3.35 30.10 27.91 69.61 2.67 131,166
15 Inferred 251 838 3.34 29.97 24.75 69.67 2.68 16,264
Dated April 30th, 2013
Mineral resources are not mineral reserves and do not have demonstrated economic viability.
Bulk density was respectively attributed according to linear regression formulas on Fe Head for each unit
Estimated Resources Howells Lake
TOTAL OF INDIVIDUAL
UNITS MODELS
TOTAL OF
COMBINED MODEL
Unit COG Category Volume Tonnage Density Fe_Head WtRec Fe_C SiO2_C Number
(Stratigraphic Layers) WtRec(%) (Mm3) (Mt) (t/m
3) % % % % of Blocks
LC 15 Indicated 71 233 3.27 28.54 27.34 69.50 2.77 5,387
LC 15 Inferred 375 1,216 3.25 27.31 23.42 69.51 2.90 24,822
JUIF 15 Indicated 15 52 3.49 33.14 24.30 70.03 1.94 2,517
JUIF 15 Inferred 36 126 3.46 32.25 25.09 70.40 1.79 4,847
GC 15 Indicated 0 1 3.26 25.56 17.20 69.51 1.69 114
GC 15 Inferred 2 7 3.17 23.59 19.03 70.61 1.56 495
URC 15 Indicated 6 20 3.53 33.81 35.93 70.26 2.22 1,450
URC 15 Inferred 27 95 3.53 34.28 37.30 69.87 2.62 4,027
PGC 15 Indicated 98 341 3.46 33.80 32.07 69.71 2.65 8,354
PGC 15 Inferred 154 531 3.43 32.79 29.15 70.05 2.36 13,644
LRC 15 Indicated 1 4 3.43 32.52 39.19 69.59 2.31 373
LRC 15 Inferred 1 2 3.41 31.59 34.90 69.25 2.49 221
LRGC 15 Indicated 145 484 3.34 29.66 29.78 70.11 2.09 12,005
LRGC 15 Inferred 232 780 3.36 30.21 29.96 69.97 2.23 19,089
15 Indicated 336 1,134 3.37 30.86 29.81 69.86 2.40 30,200
15 Inferred 828 2,757 3.33 29.59 26.85 69.81 2.53 67,145
15 Indicated 339 1,143 3.37 30.82 29.67 69.85 2.40 22,649
15 Inferred 836 2,783 3.33 29.55 26.75 69.82 2.51 53,018
Dated April 30th, 2013
Mineral resources are not mineral reserves and do not have demonstrated economic viability.
Bulk density was respectively attributed according to linear regression formulas on Fe Head for each unit
Estimated Resources Howells River North
TOTAL OF INDIVIDUAL
UNITS MODELS
TOTAL OF
COMBINED MODEL
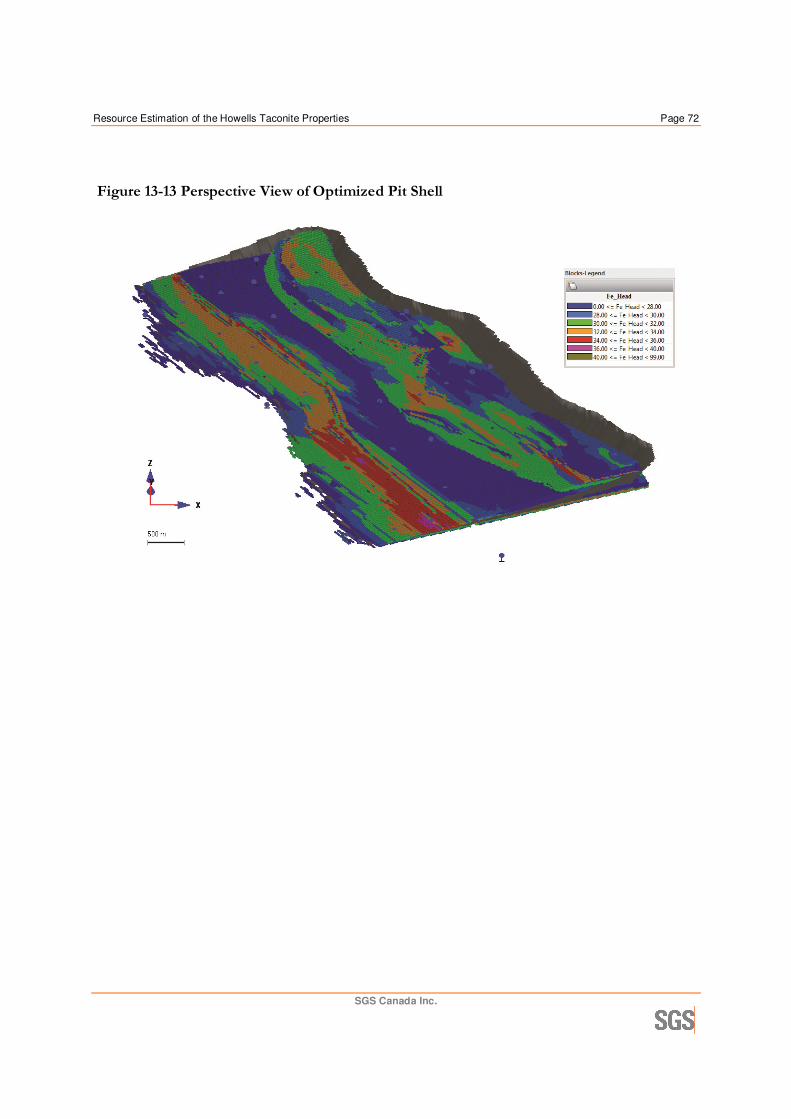
Resource Estimation of the Howells Taconite Properties Page 72
SGS Canada Inc.
Figure 13-13 Perspective View of Optimized Pit Shell

Resource Estimation of the Howells Taconite Properties Page 73
SGS Canada Inc.
Table 13-15: Howells (all) MRE (Previous COG 18% WtRec)
Unit COG Category Volume Tonnage Density Fe_Head WtRec Fe_C SiO2_C Number
(Stratigraphic Layers) WtRec(%) (Mm3) (Mt) (t/m
3) % % % % of Blocks
LC 18 Indicated 614 2,017 3.28 28.87 26.79 69.26 3.09 44,052
LC 18 Inferred 397 1,296 3.27 28.09 24.97 69.36 3.09 27,087
JUIF 18 Indicated 103 357 3.47 32.52 28.04 69.91 2.19 17,452
JUIF 18 Inferred 44 150 3.46 32.16 26.04 70.39 1.80 5,651
GC 18 Indicated 0 1 3.27 27.62 20.37 68.89 3.45 128
GC 18 Inferred 1 4 3.19 24.11 21.24 70.70 1.55 269
URC 18 Indicated 76 262 3.47 31.68 31.13 70.20 2.22 16,309
URC 18 Inferred 38 131 3.50 33.05 35.14 69.88 2.56 5,925
PGC 18 Indicated 601 2,065 3.43 32.73 33.03 70.05 2.31 52,136
PGC 18 Inferred 185 636 3.43 32.62 29.48 70.10 2.31 16,931
LRC 18 Indicated 1 4 3.43 32.52 39.19 69.59 2.31 373
LRC 18 Inferred 1 2 3.41 31.59 34.90 69.25 2.49 221
LRGC 18 Indicated 845 2,831 3.35 29.82 28.06 69.59 2.60 67,436
LRGC 18 Inferred 313 1,051 3.35 29.98 28.58 70.05 2.14 25,454
18 Indicated 2,240 7,536 3.36 30.53 29.15 69.67 2.61 197,886
18 Inferred 978 3,269 3.34 29.92 27.42 69.81 2.54 81,538
18 Indicated 2,272 7,631 3.36 30.39 28.88 69.68 2.60 142,819
18 Inferred 991 3,310 3.34 29.83 27.19 69.80 2.54 63,297
Dated April 30th, 2013
Mineral resources are not mineral reserves and do not have demonstrated economic viability.
Bulk density was respectively attributed according to linear regression formulas on Fe Head for each unit
Estimated Resources Howells Lake & Howells River North
TOTAL OF INDIVIDUAL
UNITS MODELS
TOTAL OF
COMBINED MODEL

Resource Estimation of the Howells Taconite Properties Page 74
SGS Canada Inc.
Table 13-16: Howells Lake MRE (Previous COG 18% WtRec)
Unit COG Category Volume Tonnage Density Fe_Head WtRec Fe_C SiO2_C Number
(Stratigraphic Layers) WtRec(%) (Mm3) (Mt) (t/m
3) % % % % of Blocks
LC 18 Indicated 546 1,795 3.28 28.89 26.66 69.22 3.13 38,893
LC 18 Inferred 73 244 3.32 30.34 27.06 68.53 4.00 5,261
JUIF 18 Indicated 90 312 3.47 32.45 28.40 69.89 2.23 15,288
JUIF 18 Inferred 9 30 3.45 31.80 28.33 70.37 1.84 1,064
GC 18 Indicated 0 0 3.26 27.26 20.62 68.57 4.08 66
GC 18 Inferred 0 0 0.00 0.00 0.00 0.00 0.00 -
URC 18 Indicated 70 243 3.47 31.51 30.74 70.20 2.21 14,859
URC 18 Inferred 11 36 3.43 29.78 29.38 69.91 2.38 1,898
PGC 18 Indicated 503 1,727 3.43 32.52 33.20 70.12 2.24 43,837
PGC 18 Inferred 40 137 3.42 32.09 27.78 70.36 2.08 4,012
LRC 18 Indicated 0 0 0.00 0.00 0.00 0.00 0.00 -
LRC 18 Inferred 0 0 0.00 0.00 0.00 0.00 0.00 -
LRGC 18 Indicated 701 2,347 3.35 29.85 27.70 69.48 2.70 55,431
LRGC 18 Inferred 83 278 3.33 29.33 24.38 70.30 1.87 6,620
18 Indicated 1,911 6,423 3.36 30.46 29.00 69.64 2.65 168,374
18 Inferred 216 725 3.35 30.31 26.33 69.70 2.66 18,855
18 Indicated 1,937 6,502 3.36 30.31 28.72 69.65 2.63 120,467
18 Inferred 219 734 3.35 30.07 25.89 69.67 2.69 14,040
Dated April 30th, 2013
Mineral resources are not mineral reserves and do not have demonstrated economic viability.
Bulk density was respectively attributed according to linear regression formulas on Fe Head for each unit
Estimated Resources Howells Lake
TOTAL OF INDIVIDUAL
UNITS MODELS
TOTAL OF
COMBINED MODEL
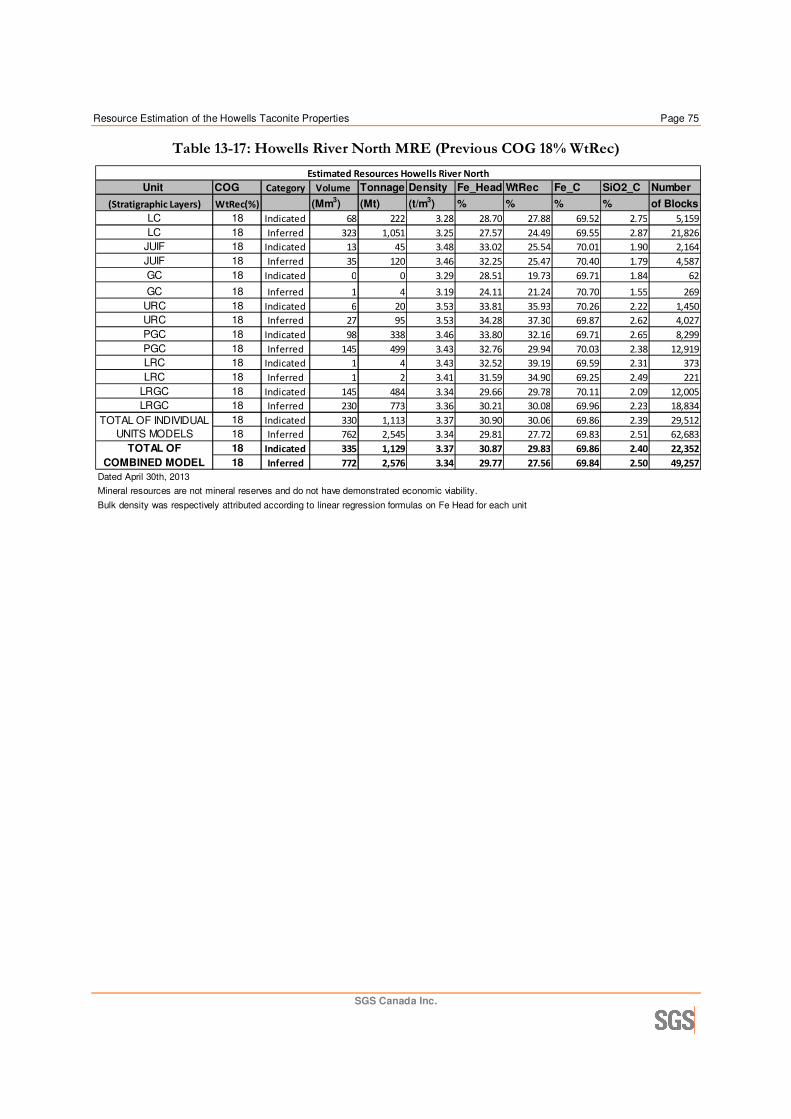
Resource Estimation of the Howells Taconite Properties Page 75
SGS Canada Inc.
Table 13-17: Howells River North MRE (Previous COG 18% WtRec)
Unit COG Category Volume Tonnage Density Fe_Head WtRec Fe_C SiO2_C Number
(Stratigraphic Layers) WtRec(%) (Mm3) (Mt) (t/m3) % % % % of Blocks
LC 18 Indicated 68 222 3.28 28.70 27.88 69.52 2.75 5,159
LC 18 Inferred 323 1,051 3.25 27.57 24.49 69.55 2.87 21,826
JUIF 18 Indicated 13 45 3.48 33.02 25.54 70.01 1.90 2,164
JUIF 18 Inferred 35 120 3.46 32.25 25.47 70.40 1.79 4,587
GC 18 Indicated 0 0 3.29 28.51 19.73 69.71 1.84 62
GC 18 Inferred 1 4 3.19 24.11 21.24 70.70 1.55 269
URC 18 Indicated 6 20 3.53 33.81 35.93 70.26 2.22 1,450
URC 18 Inferred 27 95 3.53 34.28 37.30 69.87 2.62 4,027
PGC 18 Indicated 98 338 3.46 33.80 32.16 69.71 2.65 8,299
PGC 18 Inferred 145 499 3.43 32.76 29.94 70.03 2.38 12,919
LRC 18 Indicated 1 4 3.43 32.52 39.19 69.59 2.31 373
LRC 18 Inferred 1 2 3.41 31.59 34.90 69.25 2.49 221
LRGC 18 Indicated 145 484 3.34 29.66 29.78 70.11 2.09 12,005
LRGC 18 Inferred 230 773 3.36 30.21 30.08 69.96 2.23 18,834
18 Indicated 330 1,113 3.37 30.90 30.06 69.86 2.39 29,512
18 Inferred 762 2,545 3.34 29.81 27.72 69.83 2.51 62,683
18 Indicated 335 1,129 3.37 30.87 29.83 69.86 2.40 22,352
18 Inferred 772 2,576 3.34 29.77 27.56 69.84 2.50 49,257
Dated April 30th, 2013
Mineral resources are not mineral reserves and do not have demonstrated economic viability.
Bulk density was respectively attributed according to linear regression formulas on Fe Head for each unit
Estimated Resources Howells River North
TOTAL OF INDIVIDUAL
UNITS MODELS
TOTAL OF
COMBINED MODEL

Resource Estimation of the Howells Taconite Properties Page 76
SGS Canada Inc.
14 Adjacent Properties
To the South of Howells properties NML holds the Perault Lake and Sheps Lake Properties. Along the Millennium Iron Range, NML holds the Lac Helluva Property which is contiguous to the KéMag and LabMag Properties further to the northwest. On the KéMag Property, based on 88 holes drilled in 2006-2008 and totaling 10,774 m, NML has identified a resource of 2,448 Mt measured +indicated at 31.3% Fe of head, 26.3% Weight recovery, 69.4% Fe and 2.7% SiO2 of concentrate and 1,014 Mt inferred of similar quality, both above the traditional cut-off of 18% Weight recovery – see Geostat (2008). On the LabMag Property, the current resource estimate from Geostat (2007b) is 43,665Mt measured + indicated at 29.6 Fe of head, 26.4% Weight recovery and 70.0% Fe and 2.2% SiO2 of concentrate plus 1,475 Mt inferred of similar quality, both above the traditional cut-off of 18% Weight recovery. That estimate was derived from 216 holes drilled from 2004 to 2006 and totaling about 17,576.4 m. Both resources have been the subject of PFS studies (see WGM, 2006 and BBA, 2009). Metallurgical testing and pilot scale studies for producing concentrate and pellets were conducted in Germany. LabMag and KéMag deposits contain a combined total of 5.6 billion tonnes of proven and probable reserves at 30.24% Fe, 1.3 billion tonnes of measured and indicated resources at 29.92% Fe and 2.2 billion tonnes of inferred resources at 30.16% Fe. NML and Tata Steel Minerals Canada Ltd. (“TSMC”) engaged SNC-Lavalin, the Engineering Consulting Co. to carry out a feasibility study for the Taconite project. Lac Otelnuk Property of Adriana Resources Inc is situated approximately 155 km in a straight line northwest of the village of Schefferville near the border with Labrador, and 225 km south of the village of Kuujjuaq. The resource estimate by Watts, Griffis and McOuat Limited (WGM) in August 2012 amounting to 5.84 billion tonnes of Indicated Resource grading 28.7.% T Fe and 12.39 billion tonnes of Inferred, Resources at 30.4% T Fe and 29.5 billion tonnes of Measured Resource grading 5.51% (available on SEDAR). The Hayot Lake project, part of the Attikamagen iron property is located in northeastern Québec, approximately 22 kilometres north of the town of Schefferville; 220 kilometres north of Labrador City, Newfoundland and Labrador; and 500 kilometres north of Sept-Îles, Québec. Labec Century Iron Ore Inc. (Labec Century), a subsidiary of Century Iron Mines Corp. (Century), executed an agreement with Champion Minerals Inc. (Champion); Labec Century holds 56% interest on the property and Champion Minerals Inc. (Champion) 44%. In November 2012, Labec Century published a mineral Resource Evaluation about Hayot Lake taconite Iron project, the inferred resource is 31.25% Fe (report available on the website). There are companies like Labrador Iron Mines Limited which exploits DSO around properties. A map of the adjacent properties surrounding and/or near the Sheps and Perault properties is available in Figure 14-1.

Resource Estimation of the Howells Taconite Properties Page 77
SGS Canada Inc.
Figure 14-1: Map of adjacent Properties
Resource Estimation of the Howells Taconite Properties Page 78
SGS Canada Inc.
15 Other Relevant Data and Information
No additional information is necessary to make this technical report more transparent or understandable.

Resource Estimation of the Howells Taconite Properties Page 79
SGS Canada Inc.
16 Interpretation and Conclusions
New Millennium Iron Corp. (NML) holds the 11,300 ha Howells Lake and Howells River North properties about 47 km to the northwest of Schefferville in Labrador and along the so-called Millennium Iron Range (MIR) that comprises their LabMag and KéMag deposits to the southeast and extends to the Lac Otelnuk deposit of Adriana Resources to the northwest. On these properties, NML has drilled a 9 km stretch of the MIR corresponding to a strong magnetic anomaly recognized by a 2010 airborne survey by Fugro. 56 vertical holes totaling 8,060.8 m have been drilled on 9 SW-NE sections 2 km apart, mostly having at least 5 holes per section; and on 2 SW-NE intermediate sections 1km apart and with a spacing of about 0.5 km between one or two holes on the same section (average of 2 drill holes per section). The logging and magnetic scanning of BQ and NQ drill cores has allowed establishing the stratigraphic sequence of the Sokoman and Ruth iron formations. The main unit is the top Lean Chert (LC) followed from top to bottom by the Jasper Upper Iron Formation (JUIF), the Green Chert (GC) marker horizon, the Upper Red Chert (URC) unit, the Pinky Green Cert (PGC) unit, the Lower Red Green Chert (LRGC) unit and finally the Lower Red Green Chert (LRGC) unit for a total average thickness of about 70 m. The thickness of individual units does not vary much from hole to hole but is lost during several sections. However, the geological continuity over kilometric distances is well demonstrated. The unit package dips gently by 6° to the northeast on all sections. The full length of core is divided into 1,083 assay intervals with a length of generally 6 m (occasionally less to fit litho unit limits). Split half core was sent to the Midland Research Center (MRC) lab in Minnesota for Davis Tube magnetic separation testing. Up to four quality parameters are reported by MRC for each sample: the %Fe of head, the %Weight recovery and finally the %Fe and %SiO2 of magnetic concentrate (if enough concentrate can be produced). A statistical analysis of sample by lithological units shows that each unit has a specific geochemical + mineralogical signature i.e. medium Fe + med magnetite in LC, high Fe + high magnetite in JUIF, low Fe + low magnetite in GC, high Fe + medium-high magnetite in URC, medium Fe + medium-high magnetite in PGC, high Fe + high magnetite in LRC, high Fe + medium-high magnetite in LGRC. Despite the long spacing between holes, the grade continuity is demonstrated by the low variability of the % Fe Head data as well as the geological information and interpretations from NML. These observations take into account the presence of a NW thrust fault adding thickness of the lithological units to the resource model. From the 20 SGS 2012 independent check samples collected and sent to SGS Lakefield, the data for %Fe_C appears to be significantly more (by about 96%Fe) and %SiO2_C significantly less (by about 80% SiO2) than the MRC data. That discrepancy might be linked to the way those elements are analyzed (titration or wet chemistry at MRC and XRF at Lakefield) and it needs to be further investigated. The average value of the above four quality parameters was interpolated for the unit fraction in each block (25m x 50m x 15m) of the resource model. Interpolation was done separately on the selected lithological units (layers) by inverse squared distance from calculated length 6 m composites.

Resource Estimation of the Howells Taconite Properties Page 80
SGS Canada Inc.
The geological interpretation and grade continuity (Fe_Head) allowed classifying all the blocks within the 1 x 0.5 km classification contour over all of any given hole into the inferred category. Blocks within a 500 m to 250 m contour were classified as indicated for a total of two areas. The block Unit volumes were converted into tonnages using a calculated density for every block according to % Fe_Head. The calculated densities were derived from a linear regression formula based on % Fe_Head but restricted to each unit. The measurements made on the similar deposit ( LabMag & KéMag) which is under feasibility on the specific unit vary from an average of 3.29 t/m3 in LC, 3.43 t/m3 in the JUIF, 3.15 t/m3 in the GC, 3.53 t/m3 in URC, 3.43 t/m3 in the PGC, 3.40 t/m3 in the LRC and finally 3.33 t/m3 in LRGC. The calculated densities show a strong to moderate correlation with the %Fe of head but are not derived directly from the Howells Properties deposits. Previously, on other similar deposits owned by NML (LabMag and KéMag) as well as Adriana’s Lac Otelnuk, the MRE were a result of all blocks having a combined interpolated weight recovery (all units combined) above the traditional cut-off of 18% weight recovery. Given the most recent figures for concentrate values and unit processing costs, the 18% minimum weight recovery was reduced to 15%. A Whittle optimized pit shell based on those figures as well as a 50° maximum slope includes most of the indicated and inferred blocks of the mineral inventory above the 15% weight recovery cut-off, thus demonstrating their reasonable prospect of economic extraction. Hence the estimated resources which appear in the next table are made of all the blocks above the 15% weight recovery cut-off and not restricted to any optimised shell.
Table 16-1: Howells Lake & Howells River North Mineral Resources Estimates
Totals above are inclusive of the values below
Dated April 30th, 2013 Mineral resources are not mineral reserves and do not have demonstrated economic viability.
COG Category Volume Tonnage Density Fe_Head WtRec Fe_C SiO2_C
WtRec(%) (Mm3) (Mt) (t/m
3) % % % %
15 Indicated 2,420 8,115 3.35 30.20 28.16 69.64 2.63
15 Inferred 1,087 3,621 3.33 29.65 26.29 69.78 2.55
Estimated Resources Howells Lake & Howells River North
COG Category Volume Tonnage Density Fe_Head WtRec Fe_C SiO2_C
WtRec(%) (Mm3) (Mt) (t/m
3) % % % %
15 Indicated 2,081 6,972 3.35 30.10 27.91 69.61 2.67
15 Inferred 251 838 3.34 29.97 24.75 69.67 2.68
Estimated Resources Howells Lake
COG Category Volume Tonnage Density Fe_Head WtRec Fe_C SiO2_C
WtRec(%) (Mm3) (Mt) (t/m
3) % % % %
15 Indicated 339 1,143 3.37 30.82 29.67 69.85 2.40
15 Inferred 836 2,783 3.33 29.55 26.75 69.82 2.51
Estimated Resources Howells River North
Resource Estimation of the Howells Taconite Properties Page 81
SGS Canada Inc.
17 Recommendations
SGS Geostat offers the following recommendations for further evaluation of Howells Lake and Howells River North:
• Measured densities are currently restricted to the LabMag and KéMag properties based on the feasibility in 2012. SGS Geostat recommends carrying density measurements on the Howells Lake and Howells River North properties with standard water immersion of core fragments and pycnometer on pulps. If a higher confidence relationship can be made with more density measurements on individual samples in each unit, it could replace the ones used in the resource model to (1) better combine estimates of different litho unit fractions in the same block (2) have tonnage and, to some extent, weight recovery estimates above cut-off that would reflect a slight expected increase of density with the weight recovery cut-off since we have a mild positive correlation of weight recovery and %Fe_Head. We suggest submitting 250 pulps rejects (45 LC, 45 LRGC and at least 30 for the other units using a large range of %Fe_Head in each unit) to pycnometer measurement. These results would be used to build density regression formulas according to %Fe_Head in each unit. Affecting and updating each of the the current resource blocks. The estimated and conceptual cost of this operation is about CAD$15,000.
• An economic analysis (PEA or PFS) should be conducted with the current MRE. This study
would help determine with higher confidence the economic factors such as product value and unit mining/processing costs and lead to more robust affirmation that a realistic cut-off of 15% minimum weight recovery is adequate to report resources. The estimated and conceptual cost of the economic study is ranging from CAD$150,000 to CAD$275,000.
• Although the current data demonstrates sufficient geological and grade continuity for classification of all the material recognized by holes on the 1km x 0.5km grid in the indicated category, we recommend additional drilling before starting a preliminary feasibility study (PFS) with the current MRE. That program would have a magnitude similar to the 2012 drilling program of 25 additional NQ holes totaling about 2,500 m. The Half of them (10) would be drilled on the first 3 (2 km spaced) sections to the SE where only a few DDH are present. The drilling campaign should focus also on the drilling (10) of the present intermediate 500 m sections following the same spacing between holes. The aim is the better understanding of the geological model as well as the classification upgrade. The remaining meterage (5 DDH, 500 m) would be on the lateral limits of the fault present in the middle of the model for a better understanding its displacement. With 50% more data, geological discontinuities (barren dikes, faults, etc) may show up and the spatial distribution may change significantly. Also, with a 500m x 500m drilling grid, the indicated resources would have a drilling density similar to indicated resources of Lac Otelnuk, LabMag and KéMag deposits to the north, all in a similar geological environment. Moreover, the additional and validated data could allow reclassification to the SW from inferred to indicated resources. The estimated and conceptual cost for this additional drilling is about CAD$850,000.
• SGS Geostat recommends a detailed investigation of the differences between SGS and MRC check sampling results. At his stage the author is unable to estimate any costs for this study.
Resource Estimation of the Howells Taconite Properties Page 82
SGS Canada Inc.
18 References
Assessment Report of Exploration Drilling For Magnetic Taconite in Labrador, NL Prepared By T. (BK) Balakrishnan, P. Geo, Chief Geologist Henry Simpson, Senior Geologist For New Millennium Iron Corp 2012. Assessment Report of Exploration Mapping, Sampling and Analytical testing For Magnetic Taconite in Labrador, NL Prepared By Chief Geologist Henry Simpson, Senior Geologist For LabMag LP and LabMag GP Inc.2009. Block No.143, Geological, Geophysical and Other Work, G. Cuddy, IOCC, 40p. 1978. SGS Geostat 2013, “NI 43-101 Technical Report: Resource Estimation Sheps Lake and Perault Lake Properties Labrador, Canada”, 98p. BBA Inc., 2009, “NI43-101 Technical Report on the Pre-Feasibility Study of the Kémag Iron Ore Project, Quebec, 205p. (available from Sedar). Dimroth, E., 1978,“Labrador Trough area between latitudes 58o 30’ and 56o 30’ ”, Dir. Gen. Rech. Geol. Miner. , Ministère Richesses Naturelles, Quebec, Canada, Rap. Geol. 193p. Geostat, 2005,“Resource estimation of the LabMag iron ore deposit, Newfoundland & Labrador”, 80p. Geostat, 2007a, “Estimation of the Mineral Resources of the KéMag Iron Ore deposit, New Millennium Capital Corp., Technical Report”, 93p. Geostat, 2007b, “Update of the resource model of the LabMag iron ore deposit Blocks A, B and C, Newfoundland and Labrador”, 42p. Geostat, 2008, “Update of the resource model of the Kémag iron ore deposit”, Quebec, 22p. Geostat, 2012, “Resource estimation Lac Ritchie taconite property Nunavik, Quebec, Canada, Technical Report”, 85p. Met-Chem, 2011, “Adriana Resources Inc. - NI43-101 Technical Report on the Preliminary Economic Assessment for 50MTPY Otelnuk Lake Iron Project, Quebec, Canada”, 225p. T. (BK) Balakrishnan, 2012, “Assessment Report of Exploration for Magnetic Taconite in Labrador, NL, fifth Year Assessment Report for Magnetic Blocs: License number 013782M and seventh Year Assessment Report for Magnetic Taconite Blocs: License number 011277M. T. (BK) Balakrishnan, 2012, “Assessment Report of Exploration Drilling for Magnetic Taconite in Labrador, NL, 2012 Year Assessment Report For Magnetic Blocs: License number 011278M; 015974M; 011666M; 013748M and 018648M.

Resource Estimation of the Howells Taconite Properties Page 83
SGS Canada Inc.
WGM, 2006, “A Technical Review of the Pre-Feasibility Study of the LabMag Iron Ore Project, Labrador”, 192p. (available from Sedar). WGM, 2009, “Technical Report and Mineral Resource Estimate for the Lac Otelnuk Iron Property Labrador Trough – North-eastern Quebec for Adriana Resources Inc.”, 153 p. http://gis.geosurv.gov.nf.ca/ http://www.nmliron.com/

Resource Estimation of the Howells Taconite Properties Page 84
SGS Canada Inc.
19 Certificate of Qualified Person
I, Maxime Dupéré, P. Geo, Québec, do hereby certify that:
1. I am a geologist with SGS Canada Inc, - Geostat with an office at 10 Boul. de la Seigneurie Est, Suite 203, Blainville Quebec Canada, J7C 3V5;
2. This certificate regards the technical report entitled ″NI 43-101 Amended Technical Report, Resource Estimation Howells Lake and Howells River North Taconite Properties, Labrador, Canada for New Millennium Iron Corp.″ dated June 10th, 2013, with an effective date of April 30th, 2013 (″Technical Report″);
3. I am a graduate from the Université de Montréal, Quebec in 1999 with a B.Sc. in geology and I have practiced my profession continuously since 2001. I am a member in good standing of the Ordre des Géologues du Québec (#501), I have 11 years of experience in mining exploration in diamonds, gold, silver, base metals, and Iron Ore. I have prepared and made several mineral resource estimations for different exploration projects at different stages of exploration. I am aware of the different methods of estimation and the geostatistics applied to metallic, non-metallic and industrial mineral projects. I am a qualified person for the purposes of the National Instrument 43-101 (the ″Instrument″);
4. I am responsible for the preparation of the Technical Report; 5. I visited the site from August 20 to 22th, 2012; 6. I am independent of the New Millennium Iron Corp. as defined by Section 1.5 of the
Instrument; 7. I have no prior involvements with the Howells Lake and Howells River properties. that is
the subject or the Technical Report; 8. I have read the Instrument and the sections of the Technical Report that I am responsible
for which have been prepared in compliance with the Instrument; 9. As of the effective date of the Technical Report, to the best of my knowledge, information
and belief, the parts of the Technical Report that I am responsible for, contain all scientific and technical information that is required to be disclosed to make this section of the technical not misleading.
Signed and dated this 10th day of June 2013 at Blainville, Quebec, Canada. (Signed) Maxime Dupéré Maxime Dupéré P.Geo. Geologist SGS Canada Inc. – Geostat