supplementary appendix 1 - the lancet · supplementary appendix 1. ... (with glandular atypia, p53...
TRANSCRIPT

Supplementary appendix 1This appendix formed part of the original submission and has been peer reviewed. We post it as supplied by the authors.
Supplement to: Ross-Innes CS, Chettouh H, Achilleos A, et al, on behalf of the BEST2 study group. Risk stratification of Barrett’s oesophagus using a non-endoscopic sampling method coupled with a biomarker panel: a cohort study. Lancet Gastroenterol Hepatol 2016; published online Nov 10. http://dx.doi.org/10.1016/S2468-1253(16)30118-2.

1
Appendix: Risk stratification of Barrett's oesophagus using a non-endoscopic
sampling method coupled with a biomarker panel
Materials and methods
FFPE DNA extraction and TP53 sequencing on Cytosponge samples
The primer sequences specific to ALU115 repetitive elements used for quantification of FFPE
extracted DNA by PCR were: (forward) 5’-CCTGAGGTCAGGAGTTCGAG-3’ and (reverse) 5’-
CCCGAGTAGCTGGGATTACA-3’.
Methylation analysis on the Cytosponge
The sequences of the primers and probes used were: MYOD1 forward primer: 5’-
GAGCGCGCGTAGTTAGCG-3’, MYOD1 reverse primer: 5’-TCCGACACGCCCTTTCC-3’,
MYOD1 probe: 5’-6FAM-CTCCAACACCCGACTACTATATCCGCGAAA-TAMRA-3’, ACTB
forward primer: 5’-TGGTGATGGAGGAGGTTTAGTAAGT-3’, ACTB reverse primer: 5’-
AACCAATAAAACCTACTCCTCCCTTAA-3’, ACTB probe: 5’-6FAM-
ACCACCACCCAACACACAATAACAAACACA-TAMRA-3’ (from Eads, Danenberg et al. 2000),
RUNX3 forward primer: 5’-GGCTTTTGGCGAGTAGTGGTC-3’, RUNX3 reverse primer: 5’-
ACGACCGACGCGAACG-3’, RUNX3 protein: 5’-6FAM-
CGTTTTGAGGTTCGGGTTTCGTCGTT-TAMRA-3’ from the Meltzer laboratory.
Statistical analysis
Let Y be the response variable (Best2diagnosis; 1: HGD/IMC, 0: Negative) and X={X1,…,Xp}
represent p covariates. Recall that we classified samples based on estimating the conditional
probabilities p(Y|X) using a logistic regression model and then predicted the risk-profile of a patient as
described in main text, where c1 and c2 are estimated from the data as described below. First, a
biomarkers logistic regression model (with glandular atypia, p53 abnormality and Aurora kinase A IHC
as covariates) was selected using a backward model selection approach32
. More precisely, we started
with a model consisting of all biomarkers then the least significant variable was dropped, so long as it
was not significant at the 0.05 critical level. We proceeded by removing non-significant variables in a
sequential manner (applying the same rule) until all remaining variables were statistically significant.
The fitted conditional probabilities of being HGD/IMC were computed using the selected logistic
regression model and then they were classified in three risk-groups, i.e. low, moderate, and high risk,
as described above. The lower threshold c1 was selected to maximise (minimise) the number of
negative (HGD/IMC) samples classified in the low-risk group. The other threshold c2 was selected to
maximise (minimise) the number of HGD/IMC (negative) samples classified in the high-risk group. In
an attempt to increase classification accuracy (as defined below), we fitted logistic regression models
consisting of the selected biomarkers plus an additional covariate representing any of all available
clinical variables. We have also fitted models including the main effects of clinical features and/or
second and/or third order interactions between the clinical variables. The classification procedure
described above was subsequently applied on each fitted model. The predictive performance of each
model was assessed using the following simple approach. All models were ranked (i) in an ascending
order according to the total number of misclassified patients (HGD/IMC in low-risk group and negative
patients in high-risk group) and, subsequently, (ii) in a descending order based on the total number of
correctly classified patients (negative patients falling into the low-risk group and HGD/IMC patients
falling into the high-risk group). In this fashion, the higher the ranking of a model is, the better
predictive performance is supposed to have. A model consisted of glandular atypia, p53 abnormality,
Aurora kinase A IHC and the interaction of BMI (or waist:hip ratio), Barrett’s oesophagus maximum
length and age was selected. We are aware of the increased chance of overfitting, thus we emphasized
on enrolling a validation cohort to assess the “out-of-sample” performance and get more trustworthy
results. The predictive performance of the selected model on the validation cohort seems promising.

2
Estimated model coefficients, standard errors, z-statistics and p-values are provided below:
Coefficient Estimate Std. Error Z-value P-value
Intercept -4.019 0.384 -10.471 <0.00000000000000002
Atypia 2.435 0.362 6.732 0.000000000017
p53_Status 1.802 0.325 5.544 0.00000003
AURKA 0.876 0.340 2.574 0.01005
AgexMxBMI 0.0000634 0.000022 2.885 0.00392
3
Tables
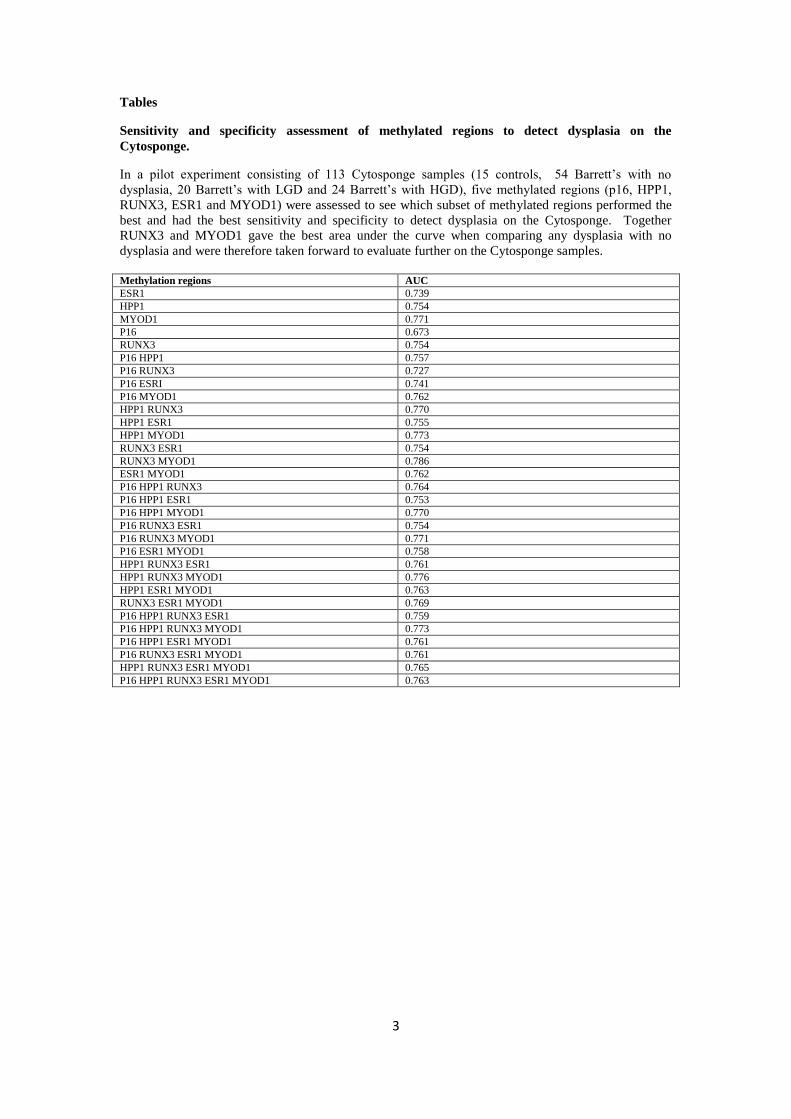
Sensitivity and specificity assessment of methylated regions to detect dysplasia on the
Cytosponge.
In a pilot experiment consisting of 113 Cytosponge samples (15 controls, 54 Barrett’s with no
dysplasia, 20 Barrett’s with LGD and 24 Barrett’s with HGD), five methylated regions (p16, HPP1,
RUNX3, ESR1 and MYOD1) were assessed to see which subset of methylated regions performed the
best and had the best sensitivity and specificity to detect dysplasia on the Cytosponge. Together
RUNX3 and MYOD1 gave the best area under the curve when comparing any dysplasia with no
dysplasia and were therefore taken forward to evaluate further on the Cytosponge samples.
Methylation regions AUC
ESR1 0.739
HPP1 0.754
MYOD1 0.771
P16 0.673
RUNX3 0.754
P16 HPP1 0.757
P16 RUNX3 0.727
P16 ESRI 0.741
P16 MYOD1 0.762
HPP1 RUNX3 0.770
HPP1 ESR1 0.755
HPP1 MYOD1 0.773
RUNX3 ESR1 0.754
RUNX3 MYOD1 0.786
ESR1 MYOD1 0.762
P16 HPP1 RUNX3 0.764
P16 HPP1 ESR1 0.753
P16 HPP1 MYOD1 0.770
P16 RUNX3 ESR1 0.754
P16 RUNX3 MYOD1 0.771
P16 ESR1 MYOD1 0.758
HPP1 RUNX3 ESR1 0.761
HPP1 RUNX3 MYOD1 0.776
HPP1 ESR1 MYOD1 0.763
RUNX3 ESR1 MYOD1 0.769
P16 HPP1 RUNX3 ESR1 0.759
P16 HPP1 RUNX3 MYOD1 0.773
P16 HPP1 ESR1 MYOD1 0.761
P16 RUNX3 ESR1 MYOD1 0.761
HPP1 RUNX3 ESR1 MYOD1 0.765
P16 HPP1 RUNX3 ESR1 MYOD1 0.763
4
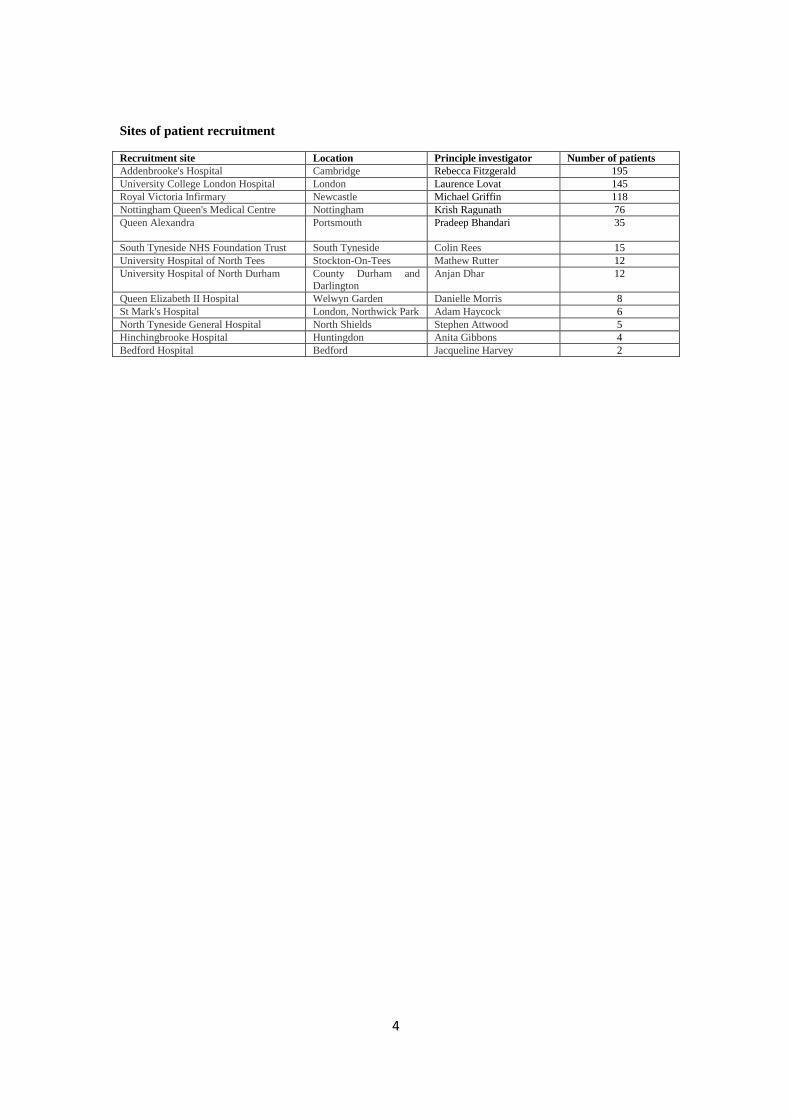
Sites of patient recruitment
Recruitment site Location Principle investigator Number of patients
Addenbrooke's Hospital Cambridge Rebecca Fitzgerald 195
University College London Hospital London Laurence Lovat 145
Royal Victoria Infirmary Newcastle Michael Griffin 118
Nottingham Queen's Medical Centre Nottingham Krish Ragunath 76
Queen Alexandra Portsmouth
Pradeep Bhandari 35
South Tyneside NHS Foundation Trust South Tyneside Colin Rees 15
University Hospital of North Tees Stockton-On-Tees Mathew Rutter 12
University Hospital of North Durham County Durham and Darlington
Anjan Dhar 12
Queen Elizabeth II Hospital Welwyn Garden Danielle Morris 8
St Mark's Hospital London, Northwick Park Adam Haycock 6
North Tyneside General Hospital North Shields Stephen Attwood 5
Hinchingbrooke Hospital Huntingdon Anita Gibbons 4
Bedford Hospital Bedford Jacqueline Harvey 2

5
IHC staining conditions and antibodies used.
Antigen Protocol Antigen
retrieval
Antibody Antibody
dilution
p53 Protocol F H1(30) NovocastraTM Mouse Monoclonal Antibody p53 Protein (DO-7)
Product Code: NCL-p53-DO7
1:50
c-Myc MRC+E* H2(20) Epitomics c-MYC antibody, clone Y69, Rabbit monoclonal
Cat #: 1472-1
1:50
Aurora
kinase A
MRC+E H2(30) Millipore Anti-Aurora-A (C-term), clone EP1008Y, Rabbit
Monoclonal
Cat #: 04-1037
Lot specific dilution
as the concentration
is not normalised between lots
* For c-Myc staining, the primary antibody was incubated with 60 minutes

6
Demographics, clinical history and molecular biomarkers included in the model selection.
Selected predictor and interaction variables are highlighted in bold.
Model input
Options
Demographics
Age
Gender M/F
BMI
Waist:hip ratio
Family history of EAC Y/N
Smoking history
Current smoker Y/N
Total years smoked
Time since stopped smoking (years)
Number of pack-years
Alcohol history
Number of alcohol units per week
Medication history
Ever taken NSAIDs Y/N
Current NSAID status Currently taking, not taking, NA
NSAID dose frequency Never, on demand, at least daily, NA
NSAID duration (years)
Currently on H pylori medication Y/N, don’t know
Symptoms
Chest pain Never, sometimes, often/daily
Burning chest Never, sometimes, often/daily
Acid taste in mouth Never, sometimes, often/daily
Number of years since heartburn started Never, <10 yrs, 10-20 yrs, >20 yrs
Endoscopic findings
Hiatus hernia Y/N
Barrett’s oesophagus maximum length
(cm)
Oesophagitis Y/N
Presence of oesophageal nodules or ulcers Y/N
Barrett’s oesophagus surveillance length
(years)
Biomarker panel on
Cytosponge specimens
Glandular atypia 0/1
p53 IHC 0/1
TP53 mutation 0/1
p53 abnormality 0/1
cMYC IHC 0/1
Aurora Kinase A IHC 0/1 MYOD1 methylation (%)
RUNX3 methylation (%)
MYOD1+RUNX3 methylation (%)

7
Diagnosis follow-up of patients in the high, moderate, and low risk groups diagnosed with low-
grade dysplasia at baseline.
Risk group Number of patients diagnosed
with high grade dysplasia
Total number of patients
Percentage diagnosed with
high grade dysplasia
High risk 7 16 43.75%
Moderate risk 7 29 24.10%
Low risk 1 5 20%

8
Marginal effects of individual predictors.
A marginal effect is a measure of the direct effect that a change in a particular biomarker, e.g. from
negative to positive score, has on the predicted probability of having a high grade dysplasia, when the
other predictors are kept fixed. All marginal effects were computed as in Greene27
using the R function
"logitmfx" from R-cran library "mfx".
Predictor Marginal effect Range
Atypia 40% 19-61%
p53 status 24% 10-38%
Aurora kinase A 9% 1-17%
log of interaction between age, maximal Barrett’s length, and obesity 8% 2-14%

9
Risk stratification prediction tool
Predictor Type Vale Probability (P) Classification
p53 abnormality
(combination of IHC and mutation)
Binary a =1/(EXP(4.019+a*(-
1.802187)+b*(-2.434713)+c*(-
0.8756866)+d*e*f*(-
0.00006342102))+1)
Low risk P<0.0345
Moderate risk 0.0345<P<0.48 High risk P>0.48
In MS Excel:
=IF(P<0.0345,"Low
Risk",IF(P>0.48,"High-Risk","Moderate-Risk"))
Glandular atypia Binary b
AurKA staining Binary c
Age Continuous d
BMI Continuous e
Maximal Barrett’s oesophagus length
Continuous f

10
Biomarker profiles associated with Barrett’s segment length. Y–axis (M) refers to the maximum length of the Barrett’s segment. X-axis 0 or 1 refers to p53
normality or abnormality respectively.
11
The BEST2 Study group full authorship list:
BEST2 is a multicenter UK collaboration. In addition to the listed authors, BEST2 members involved in this study were: Karen Coker, Wanfeng
Zhao, Kathryn Brown, Beverley Haynes (Cambridge Tissue Bank); Tara Nuckcheddy Grant, Massimiliano di Pietro, Eleanor Dewhurst, Bincy
Alias, Leanne Mills, Caroline Wilson, Elizabeth Bird-Lieberman, Jan Bornschein, Yean Lim, Kareem Shariff (Cambridge MRC Cancer Unit);
Roberto Cayado Lopez, Myrna Udarbe (NIHR Clinical Investigation Ward: Research Endoscopy Unit, Cambridge); Claire Shaw, Glynis Rose
(County Durham and Darlington NHS Foundation Trust); Ian Sargeant, M Al-Izzi, Roisin Schimmel, Elizabeth Green (East and North Herts QEII
and Lister Hospitals); Morgan Moorghen, Reshma Kanani, Mariann Baulf, Jayne Butcher (St Mark’s Hospital, London); Adil Butt, Steve Bown,
Vinay Sehgal, John Louis-Auguste, Darina Kohoutova, Sarah Kerr, Victor Eneh, Nigel Butter, Haroon Miah, David Graham, Rommel Butawan,
Manuel Rodriguez-Justo, Alison Winstanley, Grace Adesina, Sabrina Holohan (University College London Hospital); Joan Idris (Cancer
Prevention Trials Unit, London, UK); Nick Hayes, Shajahan Wahed, Nelson Kath Houghton, Marc Hopton (Royal Victoria Hospital, Newcastle
Upon Tyne); Anne Eastick, Debasis Majumdar, Kassem Manuf (North Tees and Hartlepool NHS Foundation Trust); Lyndsey Fieldson, Helen
Bailey (North Tyneside); Jacobo Fernandez-Sordo Ortiz, Mina Patel, Suzanne Henry, Samantha Warburton, Jonathan White (Nottingham
Queen’s Medical Centre, Nottingham); Lisa Gadeke, Beverley Longhurst, Richmond Abeseabe, Peter Basford, Rupam Bhattacharyya, Scott
Elliot, (Queen Alexandra Hospital, Portsmouth); Roisin Bevan, Carly Brown, Philippa Laverick, Gayle Clifford (South Tyneside NHS Foundation

12
Trust, Tyne and Wear); Anita Gibbons, Julie Ingmire (Hinchingbrooke); Abdullah Mawas (West Suffolk); Jacquelyn Harvey, Sharon Cave
(Bedford Hospital).