suplementary information to strategy to improve the ... · sustainable biomedical applications: ......
TRANSCRIPT
Suplementary information to ”Strategy to improve the characterization of chitosan forsustainable biomedical applications: SAR guided multi-dimensional analysis”
M.X. Weinhold, J.C.M. Sauvageau, N. Keddig, M. Matzke, B. Tartsch, I. Grunwald, C. Kubel, B. Jastorff, J. Thoming
I. RESULTS AND DISCUSSION
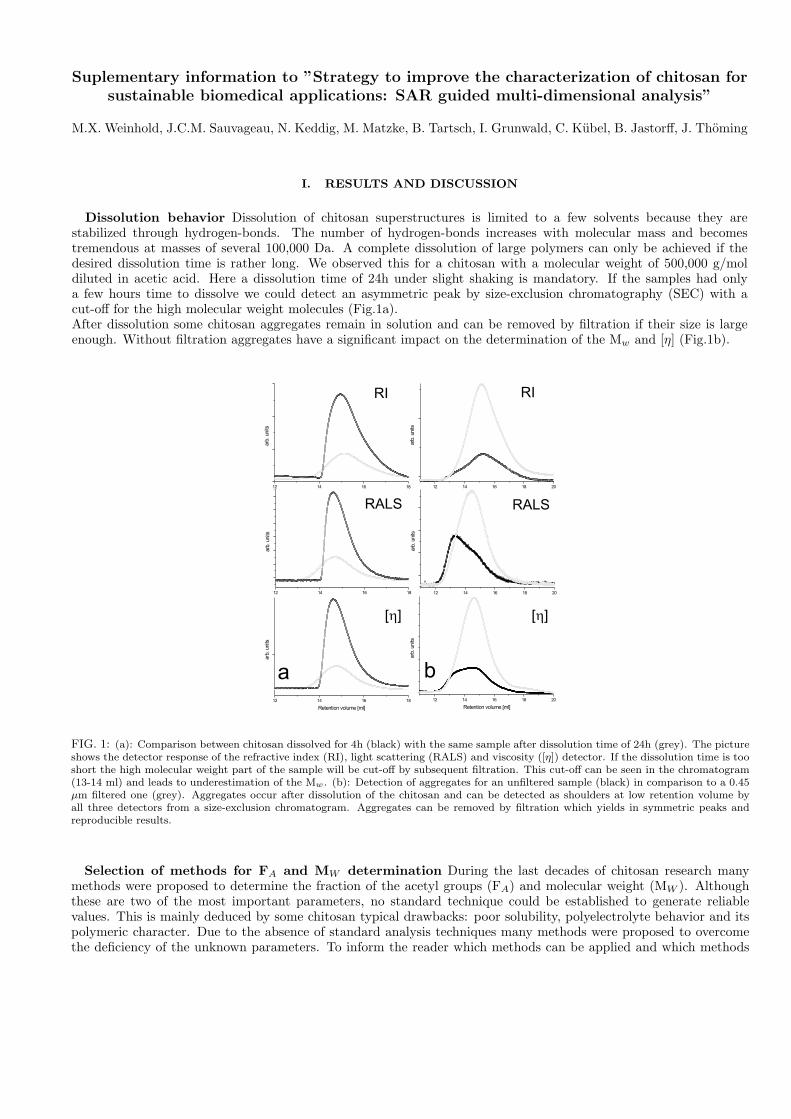
Dissolution behavior Dissolution of chitosan superstructures is limited to a few solvents because they arestabilized through hydrogen-bonds. The number of hydrogen-bonds increases with molecular mass and becomestremendous at masses of several 100,000 Da. A complete dissolution of large polymers can only be achieved if thedesired dissolution time is rather long. We observed this for a chitosan with a molecular weight of 500,000 g/moldiluted in acetic acid. Here a dissolution time of 24h under slight shaking is mandatory. If the samples had onlya few hours time to dissolve we could detect an asymmetric peak by size-exclusion chromatography (SEC) with acut-off for the high molecular weight molecules (Fig.1a).After dissolution some chitosan aggregates remain in solution and can be removed by filtration if their size is largeenough. Without filtration aggregates have a significant impact on the determination of the Mw and [η] (Fig.1b).
RI RI
RALSRALS
[ ]h [ ]h
a b
12 14 16 18
arb
.units
12 14 16 18
arb
.units
12 14 16 18
arb
.units
Retention volume [ml]
12 14 16 18 20
arb
.units
12 14 16 18 20
arb
.units
12 14 16 18 20
arb
.units
Retention volume [ml]
FIG. 1: (a): Comparison between chitosan dissolved for 4h (black) with the same sample after dissolution time of 24h (grey). The pictureshows the detector response of the refractive index (RI), light scattering (RALS) and viscosity ([η]) detector. If the dissolution time is tooshort the high molecular weight part of the sample will be cut-off by subsequent filtration. This cut-off can be seen in the chromatogram(13-14 ml) and leads to underestimation of the Mw. (b): Detection of aggregates for an unfiltered sample (black) in comparison to a 0.45µm filtered one (grey). Aggregates occur after dissolution of the chitosan and can be detected as shoulders at low retention volume byall three detectors from a size-exclusion chromatogram. Aggregates can be removed by filtration which yields in symmetric peaks andreproducible results.
Selection of methods for FA and MW determination During the last decades of chitosan research manymethods were proposed to determine the fraction of the acetyl groups (FA) and molecular weight (MW ). Althoughthese are two of the most important parameters, no standard technique could be established to generate reliablevalues. This is mainly deduced by some chitosan typical drawbacks: poor solubility, polyelectrolyte behavior and itspolymeric character. Due to the absence of standard analysis techniques many methods were proposed to overcomethe deficiency of the unknown parameters. To inform the reader which methods can be applied and which methods

2
were used throughout this work, we will briefly discuss and summarize the used techniques described in the literature.For the determination of FA up to 14 different methods have been applied namely IR spectroscopy [1, 2], colloidtitration [3], pyrolysis GLC [4], UV-VIS [5], 1H-NMR [6–8], 13C-NMR [9], thermal analysis [10], circular dischroism[11], enzymatic hydrolysis [12], picric acid assay [13], acid hydrolysis GC [14], acid hydrolysis HPLC [15], ninhydrintest [16] and X-ray diffraction [17]. Many methods are limited in their application for different (insoluble/soluble)chitin/chitosan samples. No method is able to study the whole FA range (from 0 to 1) combined with a very goodaccuracy. For example, IR spectroscopy has shown to be a fast and useful method for solid samples, but needsto be calibrated with NMR and its applicability is therefore limited. Furthermore there are uncertainties aboutthe best baseline setting and selection of peaks for analysis (amide, amino, hydroxyl). Fast results combined withthe best accuracy were found for liquid state 1H-NMR. On the contrary, NMR can not be used for chitin becausethis technique is limited to soluble material only. Nevertheless NMR became the most used and the most reliabletechnique for FA determination in science over recent years. Thus, 1H-NMR was chosen in this study for the FA
determination. Additionally 13C-NMR was used to determine also the pattern of acetylation PA. Due to goodsolubility of all our samples this method was applicable without any exceptions.Unfortunately no method has received general acceptance for the molecular weight determination of chitosan likeNMR for the FA determination. There is still a lot of uncertainty about the proper method giving realistic molecularweight values. Usually values from different methods are incomparable to each other and vary dramatically. Heremethods like batch viscosity measurements [18], batch SLS measurements [19–22], RI-SEC (Pullulan calibration)[23–25], SEC-MALS [21, 26–33], batch MALS [34–36], SEC-LALS [37–39] and ultracentrifugation [20, 32, 40] areproposed in the literature. Some of the methods are applicable for synthetic and natural polymers but difficult touse in the context with chitosan due to the fact that chitosan is a naturally occurring polyelectrolyte, with attributeslike self-aggregation and column adsorbing behavior. The solvent conditions have to be adjusted carefully to avoidprecipitation (acidic solvent), aggregation (addition of salt, filtration), and adsorption on the column material(addition of organic solvent, selection of appropriate column material, addition of salt). If the chosen solvent supportsor can not avoid aggregation, all methods can lead to a higher molecular weight when aggregates were not removed.Chromatography is advantageous in comparison to batch methods because here a separation of aggregate signalsfrom sample signals may possible. Additionally, chromatography opens up another very important parameter whichcan only be achieved by chromatographic methods: polydispersity.Throughout this work we apply a triple detector (SEC3) chromatographic setup which combines the MW determina-tion with a quick conformational analysis (Mark-Houwink-plot). As already emphasized, aggregates can influence theviscosity measurement (Fig. 1) and due to this fact we prefer to control the measurement of the intrinsic viscosity [η]together with the size determination. Online viscometers measure the viscosity distribution for each monodisperseseparated fraction of the polydisperse sample while offline batch measurements give only the mean viscosity ofthe whole molecular weight distribution. Thus, the Mark-Houwink-plot obtained by SEC3 shows a more reliableconformational analysis than a plot obtained from batch measurements.Selection of the refractive index increment dn/dc For correct molecular weight determination using lightscattering techniques a reliable refractive index increment dn/dc is essential. However, the correct determinationof the dn/dc for a polydisperse mixture of different chitosan entities is a delicate thing. Impurities (inorganicmaterial, pigments, water content) and especially an broad molecular weight and FA distribution can influencedn/dc determination. Published results on dn/dc values differ like the chitosan preparations, used for this analysis,differ for nearly all possible parameters. Values from 0.142 up to 0.208 were found and used for the Mw calculation.Small changes in dn/dc can be explained by its dependance on temperature, solvent and laser-wavelength but therather huge difference between 0.142 and 0.208 is still unexpected. The fact that there is some uncertainty whichdn/dc is useful for chitosan we took a more thorough look to related polysaccharides. If a change in the chemicalenvironment of a polysaccharides occurs one can expect also a change in its dn/dc. Values for Alginate (0.158 -0.165), Amylopectin (0.142 - 0.156), Amylose (0.146), Carboxymethylcellulose (0.147 - 0.163), Carragenan (0.140),Dextran (0.136 - 0.150), Ethylcellulose (0.154), Hyaluronic acid (0.155 - 0.176), Starch (0.146 - 0.152) and Pullulan(0.137 - 0.147) were found for laser wavelength between 436 - 633 nm in aqueous solution with varying salt contents(all values were taken from [41]). The comparison revealed that completely different polysaccharides show no bigdisparity in their dn/dc. Expecting the same for chitosan, a value comparable to those polysaccharides values wastaken (0.163 reported from Rinaudo et al. [42]). Substance recovering rates, based on this value, were determinedafter every SEC run and proved to be between 75 % and 110 %. Comparing these recovery rates with the standarddeviation of the weighing procedure and with the impurity content of the samples, the dn/dc selection was confirmed.
Impurities of chitosan preparations

3
TABLE I: Heavy metal content of different chitosan preparations. Zero values indicate a content below the detection limit.
Chitosan Cd Pb U Cr Co Ni Cu Zn As
preparation [mg/kg] [mg/kg] [mg/kg] [mg/kg] [mg/kg] [mg/kg] [mg/kg] [mg/kg] [mg/kg]
Chitosan C 0.02 ±2.6% 1.46 ±1.0% 1.19 ±1.7% 33.11 ±4.1% 0.51 ±4.6% 11.89 ±2.9% 2.99 ±2.6% 9.38 ±2.2% 0.08 ±6.3%
Chitosan H 0.01 ±4.2% 0.09 ±0.9% 0 4.65 ±4.3% 4.58 ±4.6% 4.17 ±3.5% 134.2 ±2.1% 14.41 ±1.2% 0.09 ±6.7%
Chitosan P 0.01 ±5.2% 0.10 ±0.8% 0 15.99 ±0.2% 0.26 ±0.1% 13.09 ±1.2% 0.59 ±5.8% 1.31 ±1.5% 0.03 ±10.7%
Chitosan AF 0.02 ±1.8% 0.25 ±1.5% 0.04 ±2.6% 11.77 ±3.7% 0.48 ±3.9% 8.60 ±2.0% 17.18 ±2.8% 37.99 ±2.3% 0.02 ±15.9%
Chitosan D 0.06 ±1.8% 1.74 ±0.7% 0.14 ±2.4% 12.51 ±1.9% 0.11 ±3.1% 5.53 ±1.8% 1.59 ±1.8% 6.41 ±2.0% 0.49 ±3.1%
Chitosan AQ 0 0.30 ±0.8% 0 1.31 ±3.7% 0.02 ±5.7% 3.60 ±3.8% 8.65 ±3.2% 3.15 ±1.3% 0.02 ±7.8%
[1] G. Moore and G. Roberts, Int. J. Biol. Macromol., 1980, 2, 115–116.
[2] M. Miya, R. Iwamato, and S. Yoshikawa, Int. J. Biol. Macromol., 1980, 2, 323–324.
[3] P. Broussignac, Chim. Ind. Genie Chim., 1968, 99, 1241–1247.
[4] G. Lal and E. Hayes, J. Anal. Appl. Pyrolysis, 1984, 6, 183–193.
[5] R. Muzzarelli, Carbohydrate Polymers, 1985, 5, 85–89.
[6] K. Varum, M. Anthonsen, H. Grasdalen, and D. Smidsrød, Carbohydrate Research, 1991, 211, 17–23.
[7] M. Rinaudo, P. Dung, C. Gey, and M. Milas, Int. J. Biol. Macromol., 1992, 14, 122–128.
[8] A. Hirai, H. Odani, and A. Nakajima, Polym. Bull., 1991, 26, 87.
[9] H. Saito, R. Tabeta, and K. Ogawa, Progr. Biotechnol., 1987, 3, 267–280.
[10] I. Alonso, C. R. Corvas, and J. Nieto, J. Thermal Anal., 1983, 28, 189–195.
[11] A. Domard, Int. J. Biol. Macromol., 1987, 9, 333–336.
[12] F. Nanjo, R. Katsumi, and K. Sakai, Anal. Biochem., 1991, 193, 164–167.
[13] W. Neugebauer, E. Neugebauer, and R. Brezinski, Carbohydrate Research, 1989, 189, 363–367.
[14] Z. Houra, V. Votbura, and V. Vlasakova, J. Chromatogr., 1980, 190, 67–76.
[15] F. Niola, N. Basora, E. Chornet, and P. Vidal, Carbohydrate Research, 1993, 23, 1–9.
[16] E. Curolto and F. Aros, Anal. Biochem., 1993, 211, 240–241.
[17] Y. Zhang, C. Xue, Y. Xue, R. Gao, and X. Zhang, Carbohydrate Research, 2005, 340, 1914–1917.
[18] J.-W. Nah and M.-K. Jang, Journal of Polymer Science A, 2002, 40, 3796–3803.
[19] G. Berth and H. Dautzenberg, Carbohydrate Polymers, 2002, 47, 39–51.
[20] H. Colfen, G. Berth, and H. Dautzenberg, Carbohydrate Polymers, 2001, 45, 373–383.
[21] G. Lamarque, J.-M. Lucas, C. Viton, and A. Domard, Biomacromolecules, 2005, 6, 131–142.
[22] J.-H. Pa and T. Yu, Macromol. Chem. Phys., 2001, 202, 985–991.
[23] M. Hasegawa, A. Isogai, and F. Onabe, Carbohydrate Research, 1994, 262, 161–166.
[24] C. Knill, J. Kennedy, J. Mistry, M. Miraftab, G. Smart, M. Groocock, and H. Williams, Journal of Chemical Technology
and Biotechnology, 2005, 80, 1291–1296.
[25] C.-W. Lin and J.-C. Lin, Biomacromolecules, 2003, 4, 1691–1697.
[26] K. Tømmeraas, M. Koping-Hoggard, K. Varum, B. Christensen, P. Artursson, and O. Smidsrød, Carbohydrate Research,
2002, 337, 2455–2462.
[27] P. Sorlier, A. Denuziere, C. Viton, and A. Domard, Biomacromolecules, 2001, 2, 765–772.
[28] P. Sorlier PhD thesis, Lyon France, 2002.

4
[29] G. Berth, H. Dautzenberg, and M. Peter, Carbohydrate Polymers, 1998, 36, 205–216.
[30] G. Lamarque, C. Viton, and A. Domard, Biomacromolecules, 2004, 5, 1899–1907.
[31] C. Schatz, C. Viton, T. Delair, C. Pichot, and A. Domard, Biomacromolecules, 2003, 4, 641–648.
[32] M. Fee, N. Errington, K. Jumel, L. Illum, A. Smith, and S. Harding, Eur. Biophys. J., 2003, 32, 457–464.
[33] J. Brugnerotto, J. Desbrieres, G. Roberts, and M. Rinaudo, Polymer, 2001, 42, 9921–9927.
[34] M. Anthonsen, K. Varum, A. Hermansson, O. Smidsrød, and D. Brant, Carbohydrate Polymers, 1994, 25, 13–23.
[35] R. Chen and M. Tsaih, International Journal of Biological Macromolecules, 1998, 23, 135–141.
[36] M. Tsaih and R. Chen, International Journal of Biological Macromolecules, 1997, 20, 233–240.
[37] N. Kubota, N. Tatsumoto, T. Sano, and K. Toya, Carbohydrate Research, 2000, 324, 268–274.
[38] M. Ottøy, K. Varum, B. Christensen, M. Anthonsen, and O. Smidsrød, Carbohydrate Polymers, 1996, 31, 253–261.
[39] M. Ottøy, K. Varum, and O. Smidsrød, Carbohydrate Polymers, 1995, 29, 17–24.
[40] N. Errington, S. Harding, K. Varum, and L. Illum, International Journal of Biological Macromolecules, 1993, 15, 113–117.
[41] A. Theisen, C. Johann, M. Deacon, and S. Harding, Refractive Increment Data-Book for Polymer and Biomolecular
Scientists, Nottingham University Press, 2000.
[42] M. Rinaudo, M. Milas, and P. Dung, Int. J. Biol. Macromol., 1993, 15, 281–285.