sunshine health wellbeing and education precinct · health wellbeing and education precinct (shwep)...
TRANSCRIPT

20170120 SHWEP Scenario Final Report - CD proofread
Sunshine Health Wellbeing and Education Precinct Final Report Victorian Planning Authority and Brimbank City Council July 2017

20170120 SHWEP Scenario Final Report - CD proofread
© SGS Economics and Planning Pty Ltd 2017
This proposal has been prepared for the Victorian Planning Authority.
It is provided on a commercial in confidence basis. The ideas, methods
and sources cited in this proposal are copyright and remain the
property of SGS Economics & Planning Pty Ltd. They may not be copied
or distributed beyond the requirements of the current commercial
transaction without the prior written agreement of SGS. SGS Economics and Planning Pty Ltd ACN 007 437 729 www.sgsep.com.au Offices in Canberra, Hobart, Melbourne, Sydney

Sunshine Health Wellbeing and Education Precinct
TABLE OF CONTENTS
EXECUTIVE SUMMARY 3
INTRODUCTION 6
Study purpose 6
Report outline 7
BACKGROUND 8
Historical development 8
Future development 9
Role and structure of the health sector 10
Employment growth and change at the SHWEP 12
PROJECTION ASSUMPTIONS 16
Conservative business as usual scenario 16
Moderate scenario 17
Higher scenario 18
EMPLOYMENT AND FLOORSPACE 22
CONCLUSIONS 32
APPENDIX A: DETAILED EMPLOYMENT PROJECTIONS 33
APPENDIX B: BUILT FORM EXAMPLES 37
APPENDIX C: METHODOLOGY 41
Floorspace 41
Car parking 43
APPENDIX D: EMPLOYMENT METHODOLOGY 44
Overview 44
Detailed Approach Description 45
APPENDIX E: LAND USE REQUIREMENTS 48

Sunshine Health Wellbeing and Education Precinct
LIST OF FIGURES
FIGURE 1. WESTERN SUBREGION - EMPLOYMENT & POPULATION 9 FIGURE 2. HEALTH SECTOR STRUCTURE 11 FIGURE 3. DRAFT FUTURE URBAN STRUCTURE 13 FIGURE 4. AUSTIN HOSPITAL SITE 14 FIGURE 5. SHWEP HOSPITAL SITE 14 FIGURE 6. AUSTIN HOSPITAL SITE AND ADJOINING RETAIL STRIP 15 FIGURE 7. DRAFT FUTURE URBAN STRUCTURE 27 FIGURE 8. MAP OF LABOUR MARKET CATCHMENTS 30 FIGURE 9. EMPLOYMENT SCENARIOS FOR SUNSHINE NEIC 33 FIGURE 10. 4 STOREY RESIDENTIAL EXAMPLE 37 FIGURE 11. 5 STOREY RESIDENTIAL EXAMPLE 37 FIGURE 12. 2 STOREY OFFICE / IN DUSTRIAL EXAMPLE 38 FIGURE 13. EMPLOYMENT BY INDUST RY OVERVIEW 44
LIST OF TABLES
TABLE 1. SCENARIOS SUMMARY 4 TABLE 2. HEALTH SECTOR EMPLOYMENT, CITY OF YARRA, 2011 11 TABLE 3. SCENARIO ASSUMPTIONS 20 TABLE 4. 2036 EMPLOYMENT PROJECTION SCENARIOS SUM MARY 23 TABLE 5. 2036 FLOORSPACE SCENARIOS – METRES SQUARE 24 TABLE 6. 2051 EMPLOYMENT PROJECTION SCENARIOS SUM MARY 25 TABLE 7. 2051 FLOORSPACE SCENARIOS – METRES SQUARE 26 TABLE 8. 2036 FLOORSPACE SCENARIOS – METRES SQUARE 26 TABLE 9. 2036 FLOORSPACE SCENARIOS – METRES SQUARE 27 TABLE 10. DETAILED HEALTH CARE JOBS BREAKDOWN 28 TABLE 11. LABOUR MARKET CATCHM ENTS 29 TABLE 12. 30 MINUTE CAR CATCHMENT SKILL PROFILE 29 TABLE 13. BAU EMPLOYMENT PROJECTION SCENARIO 34 TABLE 14. MIDDLE EMPLOYMENT PROJECTION SCENARIO 35 TABLE 15. HIGH EMPLOYMENT PROJECTION SCENARIO 36 TABLE 16. DETAILED FLOORSPACE ASSUMPTIONS 42

3 | P a g e
EXECUTIVE SUMMARY
Plan Melbourne identifies that residential growth should not drive the outwards expansion of Melbourne indefinitely. It proposes an alternative settlement pattern, including the development of higher density housing in select locations near services, jobs and public transport. The National Employment and Innovation Clusters (NEIC) are designed to maximise access to goods and services at centres with good public transport access. With a growing population in Western Melbourne, the Sunshine NEIC is key for the future development of Western Melbourne and the Sunshine Health Wellbeing and Education Precinct (SHWEP) is an important part of the Sunshine NEIC. With around 3,227 jobs currently located at the SHWEP, it is an important employer and provider of health services to the west. The future population growth of the western suburbs will underpin a large increase in the number of health care jobs. A large portion of future health care jobs will want to cluster within close proximity to the exiting health facilities at the SHWEP. Higher education providers also view the SHWEP as a strategic location where future investments can be made which would result in an increase to the level of employment. Clusters of hospitals and major education institutions are usually a prime location for medical research centres. This is an opportunity for the SHWEP. The SHWEP has ample vacant land (e.g. the ‘back paddock’ and at grade car parking) which can be developed in the future. This is a clear advantage for the SHWEP compared to other similar sites. Table 1 presents a summary of a conservative business as usual (BAU), middle and higher growth scenarios for 2036 and 2051. These scenarios help to understand the future growth potential for the SHWEP and the actions required to achieve higher employment growth.

4 | P a g e
TABLE 1. SCENARIOS SUMMARY
2036 2051
2016 BAU Middle Higher BAU Middle Higher
Total Employment 3,227 4,619 5,110 5,494 6,283 7,239 8,929
Hospital / Health / Research m2 80,993 146,793 156,530 183,106 178,457 197,207 228,840
Industrial m2 23,412 18,870 14,214 10,998 19,499 11,322 10,128
Food Services / Accommodation / Retail m2
4,622 11,604 23,431 32,135 12,504 25,487 37,996
Office m2 4,603 7,144 13,264 29,468 8,079 13,108 32,099
Car parks m2 92,352 113,664 123,136 132,608 159,130 172,390 185,651
Dwellings m2 44,800 48,000 98,000 115,500 96,000 196,000 231,000
Total Floorspace 250,782 346,076 428,575 503,815 473,668 615,515 725,713
Number of Dwellings 160 240 560 660 480 1,120 1,320
Number of Carparks 1,950 2,400 2,600 2,800 3,360 3,640 3,920
Source: SGS Economics and Planning
Out to 2051, the SHWEP could add an additional 5,702 jobs under the higher growth scenario. Under a conservative business as usual the number of additional jobs is 3,056. The higher scenario would require an additional 474,931 m2 of floorspace (compared to 222,886 under the business as usual) to be constructed at the SHWEP. To provide some context to the floorspace numbers the following metrics provide some indication of the built form associated with the scenarios:
The buildings on the Sunshine Hospital Site currently have an average height of 2.2 storeys. In 2051, the average height would be 6.1 storeys under the business as usual scenario and up to 8 storeys under the higher scenario.
Car parking would go from at grade to 3.0 storeys on top of the current car parks.
Under the higher scenario, development in the mixed use zone along Furlong Road to Ginifer Station would see all sites converted to a mixed used building with lower floors food/retail/commercial and residential above, at an average height of 7 storeys.
Of course there are many options for development. That is, some at grade car parks could be developed into health buildings and a larger multi-level car park constructed. Or development could take place in the ‘back paddock’ and leave existing building heights unchanged. It has been assumed that all the dwellings shown in the above table will be located in the mixed use zoned section of the SHWEP. There are also possible scenarios in terms of planning controls. The currently zoned industrial land is cut off from the rest of the SHWEP by the high voltage power line easement. This could present some challenges in fully integrating this part of the SHWEP with the existing hospital functions. If the currently zoned industrial land was converted to purely residential, about 730 jobs (about 7 per cent of all jobs) would be lost from the SHWEP under the high scenario in 2051.

5 | P a g e
The potential future of the currently zoned industrial land would have to be considered in this context. Achieving the higher scenario employment growth requires a number of outcomes, including:
Improve local amenity in terms of the environment and access to local services (retail, food, child care, etc). This is a prerequisite for attracting higher order health, education and research jobs.
Road access improvements are required into the precinct via improvements along Furlong Road (e.g. new right hand turn lanes and new intersection), and cut through of cul-de-sacs would help to ease traffic congestion. High traffic congestion at a site can deter workers and potential employers from locating there.
Secure an additional medical research centre and higher education training facility in the next 5-10 years.
Encourage and attract mixed use development which would be ideal for the local service jobs to locate in and help boost the local residential population.
This type of development would also improve the amenity of the journey from Ginifer Station to Sunshine Hospital. This would help to increase the number of trips made to the SHWEP by public transport.
Increasing public and active transport trips will reduce the need for large volumes of multi-level car parking required at the SHWEP.

6 | P a g e
INTRODUCTION
Plan Melbourne identifies that the city’s urban footprint cannot continue to expand outwards indefinitely. A divide between the location of jobs growth and population growth is creating increased areas of socioeconomic disadvantage, low social capital and human capital. Disadvantaged areas have higher rates of social issues like crime, chronic disease, and lower levels of educational attainment, all of which have clear social, health and economic implications. The National Employment and Innovation Clusters (NEIC) are significant employment concentrations producing a range of goods and services. The NEIC are designed to maximise access to goods and services in major centres with good public transport networks. These centres will play a major service delivery role, including government, health, justice and education services, retail and commercial jobs, and activities for a subregional catchment. The Sunshine NEIC is key for the future development of Western Melbourne and the Sunshine Health Wellbeing and Education Precinct (SHWEP) is an important part of the Sunshine NEIC. With over 3,000 jobs at the SHWEP it is an important employer and provider of health services to the western suburbs. It has the potential to achieve a status as a medical, research and education precinct of metropolitan significance. However, there are a number of challenges facing the SHWEP in terms of access, local amenity and current interest from the development industry.
Study purpose
The purpose of the report is to provide the Victorian Planning Authority and Brimbank City Council with an economic assessment of the SHWEP. This includes building an understanding of the potential future land uses in the SHWEP, the investment preconditions for the various target sectors envisaged to locate in the precinct, and an understanding of the implications of this from an employment and economic perspective. There are a number of existing major land uses in the precinct, and there is also investment planned for the precinct. The implications of this in terms of facilitating and attracting further investment in order to support transformation of the precinct needs to be further understood to inform planning. Three future employment growth scenarios have been developed to help inform the planning of the SHWEP.

7 | P a g e
The development of three scenarios is based around the following broad assumptions:
A conservative business as usual projection assuming only current budgeted public investments and planning scheme control changes. This scenario assumes that the Victorian Planning Authority and Brimbank City Council take a very passive role in the development of the SHWEP.
A middle projection, assumes proposed new local road connections, open space areas and active transport infrastructure that could be delivered through standard planning controls, infrastructure contribution schemes or private agreements. This scenario assumes a very proactive role for the Victorian Planning Authority and Brimbank City Council.
A higher projection giving a “best case” scenario based on the above interventions plus other interventions considered necessary in order to maximise the development potential of the SHWEP in line with its vision.
It is also important to note the scope of the project. The project is not intended to be a master plan for the SHWEP, but does provide some high level advice on the possible location of certain activities. The project also provides some broad descriptions of the types of buildings which may be constructed, but should not be seen as advice on the future urban design guidelines for the SHWEP. The project scope is focused on employment not residential dwelling provision. However, mixed-use parts of the precinct are likely to involve ground floor commercial / retail activities. Hence to provide a complete view of the floorspace at the SHWEP, dwelling projections have also been included (despite being out of scope). As a result, the dwelling projections should not be seen as a detailed residential growth framework for the SHWEP. This would require more detailed analysis. In addition, car parking estimates and projections have been produced to add an understanding of the capacity for future development patterns, rather than as a detailed input to future traffic modelling.
Report outline
This report provides:
Background to the past and future development of the SHWEP and the role of health services are provided in Section 2.
The assumptions underpinning the three scenarios are outlined in Section 3.
Section 4 presents the employment and floorspace projections for the three scenarios.
Section 5 provides some conclusions from the analysis.
Appendix A provides the detailed SHWEP employment projections for each 5 yearly interval between 2016 and 2051 and projections for the Sunshine NEIC.
Appendix B provides examples of the built form which could be expected at the SHWEP.
8 | P a g e
BACKGROUND
The Western Subregion of Melbourne is home to a diverse range of land uses, including industrial precincts, greenfield developments, and inner urban renewal. Many of these areas are in the midst of a substantial period of transition. With the completion of Regional Rail Link, both the Melton and Wyndham (in addition to the Sunbury) growth corridors funnel through Sunshine. These structural characteristics mean the Sunshine NEIC is well placed to take on a regional centre role as Western Melbourne rapidly develops. With a growing population, and the health sector being one of the fastest growing sectors in the Australian economy, the SHWEP is well placed take advantage of these factors. To understand this potential it is important appreciate the historical development drivers of the West which will affect how future urban development will occur and the ongoing role of the health sector.
Historical development
Historically, Melbourne’s early urban development exhibited two distinct growth patterns. The east of the City of Melbourne was favoured by early Melburnians for residential expansion, while the flat plains of the west were better suited to industrial uses. In the inner west places such as Spotswood, Yarraville, Tottenham, and Altona housed much of Melbourne’s early industry. This industry often polluted the areas around it, and although critical to the city, was not conducive to providing high amenity residential neighbourhoods. With numerous higher amenity locations available for residential development in Melbourne’s east, residential growth in the west was limited and was predominately provided to house the workforce of the surrounding factories. The development of the working class residential suburb of Sunshine in the early 1900s is perhaps the most notable example of such development, with the suburb built to house the workers of the Sunshine Harvester factory. With a growing population there was a need for improved health services. Sunshine Hospital was established in the 1920s by two nursing sisters in a weatherboard building at 9 King Edward Avenue, Albion. In was known as St Andrews until it was renamed the Sunshine and District Community Hospital in 1946. In 1986, Sunshine and District Hospital merged with Western General Hospital to form Maribyrnong Medical Centre. In 1986 Sunshine and District Hospital amalgamated with Western General Hospital to form Maribyrnong Medical Centre. The original hospital at King Edward Avenue closed in 1989, and in 1990 the Sunshine Hospital on Furlong Road opened, with 288 beds as a paediatric, obstetric, gynaecology and sub-acute service. Maribyrnong Medical Center was renamed as Western Hospital.

9 | P a g e
FIGURE 1. WESTERN SUBREGION - EMPLOYMENT & POPULATION
Source: SGS Economics and Planning
Since 1990, Sunshine Hospital has grown to include acute and sub-acute teaching facilities with 600 beds. Western Health opened an intensive care unit and cardiac care service, with a number of acute specialties relocated to the hospital, including neurology and stroke, oncology, and respiratory services. The growth in services at the Sunshine Hospital has been underpinned by a growing population in Melbourne’s west. Melbourne’s west has seen rapid population growth due to factors such as rising housing prices in the established areas, the decreasing availability of greenfield land in the south-east, the relative proximity of the west to the CBD’s jobs and services, and government planning, support and infrastructure investment.
Future development
The west of Melbourne will continue to see high levels of population growth over the next 30 years. This is due to a number of factors. Relative to other greenfield sites, western sites are proximate to the CBD and its services and jobs. Inner west suburbs such as Spotswood, Footscray, Yarraville, Tottenham, Altona and Sunshine have capacity to accommodate medium and high density residential development. While population growth has placed considerable strain on the west’s existing transport infrastructure, resulting in considerable congestion (most notably on the West Gate Bridge and heavy rail network) a new generation of transport projects will underpin the growth in the west. The West Gate Tunnel Project will deliver an alternative to the West Gate Bridge which willprovide quicker travel times and remove thousands of trucks off residential streets. Opened in June 2015, the Regional Rail Link (RRL) provides a new rail line from Sunshine to Werribee through the greenfield growth areas of the west (with new stations at Wyndham

10 | P a g e
Vale and Tarneit, as well as opportunities for four more stations in the longer term). Level crossing removals in the west present the opportunity to free up centrally located sites for new development while also improving the operations of both the public transport and road networks. The opening of the Melbourne Metro Rail Project in 2024 is likely to provide key linkages and enhance connectivity across Melbourne. By reshaping accessibility across the metropolitan area, particularly for the western and northern sub-regions, the Melbourne Metro would enable businesses to achieve higher productivity through economies of scale and scope. The Melbourne Metro will provide enhanced access from the SHWEP to the Parkville NEIC. The Parkville NEIC has a strong concentration of institutions and businesses in the education, research, health, professional and technical industries. This includes the University of Melbourne, the Royal Melbourne Hospital, Victoria Comprehensive Cancer Centre and associated research institutes. The Melbourne Metro will reduce travel time between the SHWEP and Parkville NEIC from currently around 50 minutes by public transport to around 20 minutes. This improved transport link will make the SHWEP a far more attractive location for health and medical research institutes.
Role and structure of the health sector
The health sector is one of the fastest growing sectors in the Australian economy. Understanding how the sector functions will be important to understanding how to support its growth going forward. The health sector has experienced rapid growth due to both a growing (and ageing) population and continued technological advancements in the industry. Increased wealth has also contributed to increased demand for health services as people have more discretionary income. This has created two broad subsectors which have quite different locational requirements:
Local level services: predominantly general practitioners (GPs) and allied health services (e.g. physiotherapists) who are largely dispersed in-line with population and employment. They do not need to be near other services and in fact tend to spread out, often co-locating with other everyday services, such as retail.
Specialised services: hospitals and medical specialists (i.e. anaesthetics, neurosurgery) who provide regional level operations. This group is driving innovation and specialisation in the health sector, and as a result is becoming increasingly concentrated around existing major health nodes.
Both groups sit on a spectrum with some health services becoming highly innovative and specialised and some hospitals being quite small and providing more of a local service role. A number of associated industries also have close ties with the sector including: support services (i.e. cleaning, catering), health research and health manufacturing (equipment and pharmaceuticals).

11 | P a g e
FIGURE 2. HEALTH SECTOR STRUCTURE
Source: SGS Economics and Planning
Standard industry classifications cannot perfectly align with the above diagram. As an example, Table 2 presents employment across the health sector in Yarra which includes the full spectrum of services. It is anchored by two major hospitals that serve metropolitan catchments: the Epworth and St Vincent’s (which also includes St Vincent’s private hospital). The sector also includes a significant amount of local level health services dispersed across the municipality, along with some health manufacturing and research employment.
TABLE 2. HEALTH SECTOR EMPLOYMENT, CITY OF YARRA, 2011
Category Sub-sector Jobs Includes
Hospitals (5,800 jobs)
5,800 Diagnostic, medical or surgical services as well as continuous in-patient medical care in specialised accommodation such as nurses and doctors.
Health services (2,100 jobs)
Pathology and Diagnostic Imaging Services
800
Medical laboratory, pathology laboratory, X-ray, CT, MRI, ultrasound clinics
Other Allied Health Services
800 Dental, optometry, physiotherapy, chiropractic, acupuncture, aromatherapy, hearing, midwifery, speech, podiatry
Specialist Medical Services
500 Anaesthetics, dermatology, gynaecology, paediatric, rheumatology, hair, orthopaedic, psychiatry
Health Manufacturing (400 jobs)
Pharmaceutical and Medicinal Product Manufacturing
300 Vaccines, chemical medicine, capsules, drugs, herbals, contraceptive, vitamin
Medical and Surgical Equipment Manufacturing
100 Health furniture, electromedical, hearing aids, pacemakers, surgical equipment, instruments, imaging equipment
Research (300 jobs)
Scientific Research Services
300 Note that this can include non-health sector research, but research tends to be drawn towards the location of its topic matter
Total 8,600
Source: ABS Census 2011
The dynamics of change in the health sector will have a number of implications for the sector at the SHWEP. Local level health services such as GPs and allied health services will continue to grow in-line with broader population and employment growth. They are privately operated and typically dispersed. Some of these services may locate in Sunshine, however, they are not the focus.
Hospitals Medical
specialists Allied health
services General
Practitioners
Support services
Health research
Health manufacturing
Catchment size
Local Metropolitan

12 | P a g e
Regional level services (hospitals and specialists) will grow rapidly in the future through increased specialisation and innovation. This growth has largely been accommodated through expansion and refurbishment of existing hospitals given the sector’s intense requirement to co-locate. An example of this is the recent redevelopment of the Royal Melbourne Hospital and new Peter MacCallum Cancer Centre. Rather than expanding into nearby sites these institutions have chosen to invest in the existing Royal Melbourne site. Multiple air bridges have also been created between the two centres to further improve linkages. Hospitals have stated that the majority of medical specialist services which are not yet co-located with the hospital precincts would prefer a location in or near existing precincts if possible. Health and medical research is still the largest research branch across Australia (at 29 per cent of all research institutions). Hospitals with major education institutions within close proximity are usually the prime location for health and medical research centres. Parkville is the best example of this type of clustering.
Employment growth and change at the SHWEP
The Vision
The SHWEP will be an internationally recognised centre of excellence for health, wellbeing, education and research. It will be a focus for medical research, biotechnology, teaching and conference services, providing a focus for the most significant public and private tertiary health care precinct in the region. The SHWEP will serve the communities of Western Melbourne and Regional Victoria, ensuring the health and wellbeing of a population catchment in excess of one million people. The SHWEP will be comprised of an integrated network of health and wellbeing facilities centred on the Sunshine public and private hospitals. Health, education and research facilities will be complemented by a range of public and private services across retail, food, business, accommodation, recreation and community sectors, providing job growth and training in these sectors. The SHWEP will be a vibrant and welcoming place for people to work and to visit. Development of the SHWEP will promote the wellbeing of the community through the range of health and wellbeing services that are delivered within a well-planned modern urban environment, with green spaces, connectivity, ease of access and range of employment opportunities. The future land use planning and urban structure of the SHWEP is shown in Figure 3.

13 | P a g e
FIGURE 3. DRAFT FUTURE URBAN STRUCTURE
Source: Victorian Planning Authority
What might this vision look like?
The Austin Hospital complex in Heidelberg provides an example of how the SHWEP could develop into the future. The Austin Hospital site is roughly a similar size as the Sunshine Hospital so it is a reasonable comparator from a land use point of view. Figure 4 and Figure 5 provide aerial photos for each site.

14 | P a g e
FIGURE 4. AUSTIN HOSPITAL SITE
Source: Google Maps
FIGURE 5. SHWEP HOSPITAL SITE
Source: Google Maps

15 | P a g e
Some current differences between the sites include:
The Austin Hospital has around 9,000 health care jobs located there, compared to 2,700 at Sunshine.
The Austin has four road entrance points at different locations compared to Sunshine’s dependency on Furlong Road, thus making the Austin easy to access by car at peak periods.
The bulk of car parking at the Austin is multi-level, compared to the predominantly at grade car parking at Sunshine.
The Heidelberg train station is closer to the Austin Hospital than the station at Sunshine.
The Austin Hospital, the Mercy Hospital for Women, and the Warringal Private Hospital make up three hospitals in the precinct. This is compared to the Sunshine Hospital and soon to open Joan Kirner Women’s and Children’s Hospital.
Both the Melbourne Brain Centre (a research centre for the Florey Institute of Neuroscience and Mental Health) and Ludwig Institute for Cancer Research are located at the Austin. The Western Centre for Health Research and Education is located at the SHWEP.
Burgundy Street is a high quality boulevard when compared to Furlong Road, thus providing higher quality local amenity.
The adjoining retail strip in Heidelberg (as shown in Figure 6) provides the Austin with a range of services (supermarket, cafes, banks etc), associated health care jobs and local amenity which the SHWEP does not have. There are around 2,500 jobs in this adjoining precinct.
Unlike Sunshine Hospital, the Austin hospital site (as are many hospital sites in Melbourne) is effectively ‘land locked’ by other uses which limit (or increase the costs of) future opportunities for physical expansion.
FIGURE 6. AUSTIN HOSPITAL SITE AND ADJOINING RETAIL STRIP
Source: Google Maps
All of these various differences between the two sites can be resolved via ongoing development of the SHWEP hospital site and other initiatives, such as attracting research centres and providing more local services.

16 | P a g e
PROJECTION ASSUMPTIONS
During the development of the projections, SGS contacted the following organisations to understand their future plans for their operations at the SHWEP: Western Health, the owner of the industrial site at 219-229 St Albans Road, Sunshine Private hospital, Club Italia, Melbourne University, Victoria University and Better Health Plan for the West. Only Western Health, Melbourne University and Victoria University responded. They provided insights into their plans for the sites and some data on plans for future jobs growth at the site. There was also discussion of the current strengths and weaknesses of the SHWEP. The feedback was consistent from the stakeholders. All see the SHWEP as a strategic location at which to locate more health and education services to service a growing Western Melbourne. Attracting skilled labour to the site is not seen as an issue as there is an increasing number of locals who have completed training at Western Health and are happy to live and work in the region. The amount of available land presents many opportunities for development. Western Health have deemed the “back paddock” surplus to their requirements. Western Health are in the process of putting expressions of interest to the market. The poor local amenity of the SHWEP was seen as an issue which should be addressed to help the site further develop. The three scenarios can be described as follows:
A conservative business as usual projection assuming only current budgeted public investments and planning scheme control changes. This scenario assumes that the Victorian Planning Authority and Brimbank City Council take a very passive role in the development of the SHWEP.
A middle projection, assumes proposed new local road connections, open space areas and active transport infrastructure that could be delivered through standard planning controls, infrastructure contribution schemes or private agreements. This scenario assumes a very proactive role for the Victorian Planning Authority and Brimbank City Council.
A higher projection giving a “best case” scenario based on the above interventions and plus other interventions required to maximise the development potential of the SHWEP in line with its vision. The higher scenario would be seen as an optimal land use outcome for the SHWEP.
This section provides an overview of the assumptions used in developing the three projections.
Conservative business as usual scenario
The business as usual scenario has the following assumptions: 1. The hospital site continues to develop in line with historical trends. These trends have
been driven by increased demand for health services in Western Melbourne, which are certain to increase in the future. Given the size of the Sunshine Hospital site and potential

17 | P a g e
for redevelopment of existing buildings and carparks there should not be any land constraints to this growth occurring.
2. The growing population of Western Melbourne will underpin the demand for health services at the SHWEP.
3. The Joan Kirner Women’s and Children’s Hospital opens in 2018. 4. It is assumed that the SHWEP will still have its current road transport constraints which
would only be exacerbated by increased jobs at the SHWEP. This will constrict employment growth, as workers find it increasingly difficult to travel to and from work, and potential new businesses are deterred by this.
5. A private hospital does locate at the SHWEP in the next 15 years at the scale currently proposed1.
6. An additional medical training facility doesn’t locate at the site. 7. An additional medical research facility doesn’t locate at the site. 8. The commercial / industrial / office zoned part of the site remains relatively unchanged,
with limited employment growth taking place. Due to the current industrial activities any expansions in this part of the precinct would not impact on employment growth in the rest of the precinct. This is dependent on planning approvals ensuring compatibility of uses within the precinct.
9. The low levels of amenity (public realm and access to retail and hospitality services) in and surrounding the SHWEP continues. Hence making it a less attract place to locate.
10. The property development industry doesn’t embrace the SHWEP for innovative commercial / medical / retail / residential products in the next 15 years.
11. No significant residential development occurs in the surrounding area until after 2036. 12. The remainder of the Sunshine NEIC remains on a BAU growth path and hence does not
provide more jobs and housing in the wider precinct to help encourage development at the SHWEP. See Figure 9 on page 33 for the employment data for the Sunshine NEIC.
13. The Metro Melbourne Rail project opens in 2024. 14. Small medical centres will continue to be developed in the area surrounding the hospital. 15. The currently planned Cardiac Centre will open in the next 5-10 years. 16. The streetscapes and local amenity remains relatively unchanged from today.
Moderate scenario
A moderate scenario would have the following assumptions, which differ to the BAU in the following ways: 1. There is rezoning of land which facilitates the following developments. 2. A private hospital of the scale currently proposed locates in the precinct in the next 5
years. 3. Road access is improved into the precinct via improvements along Furlong Road (e.g right
hand turn lane improvements, link road and new intersection) and cut through of cul-de-sacs in existing residential areas as per current thinking.
4. Public transport and active transport becomes an increasingly attractive option for travel to the SHWEP. This relieves the constriction on employment growth from transport access. This would also help the amenity of the public realm hence making it a more attractive place to locate.
5. In the next 10-15 years the property development industry provides locations for retail, hospitality and child care within the SHWEP with some of the sites along Furlong Road
1 Issues with the undergrounding of the power lines are overcome or an alternative site at the SHWEP is used.

18 | P a g e
being developed. Residential properties will locate on the upper floors of these developments. This would require early active engagement with the development industry to ensure the first sites are developed.
6. This type of development will help to activate the SHWEP, adding to the local amenity and increase the attractiveness of the SHWEP.
7. Following the introduction of new road links (described in assumption 3), low scale (1-2 storeys with a greater focus on industrial) commercial development takes place in the existing IN1Z land zoned part of the SHWEP (assuming appropriate application of land use zoning parameters). This type of development is already occurring in similar sites across Melbourne (see Appendix B: Built Form Examples).
8. Residential development begins to occur in the surrounding area during the next 10 years and provides high quality and diverse accommodation for workers at the sites.
9. A small scale hotel (e.g. a 5-6 floors Quest-style apartment) is developed. 10. An age care facility is constructed with independent living, respite and fall care facilities.
This would likely take place at the existing Fronditha Age Care Site. 11. The remainder of the Sunshine NEC grows above the BAU growth path and increases jobs
and housing in the wider precinct to help encourage development at the SHWEP. See Figure 9 on page 33 for the employment data for the Sunshine NEIC.
12. Public transport becomes an increasingly common mode of travel for workers to reach the SHWEP due to Melbourne Metro rail project and bus service improvements.
13. A university locates some campus activities in the precinct (e.g. Victoria University partially relocates from St Albans) in 15-20 years’ time.
14. An attractive and green streetscape is developed from Ginifer Station to the hospital which helps to foster pedestrian activity.
Higher scenario
A higher scenario would have the following assumptions, which differ to the moderate in the following ways: 1. A larger scale private hospital than currently proposed locates in the SHWEP in the next 5
years. 2. An additional medical training facility locates at the Hospital Site in the next 10-15 years. 3. An additional medical research facility locates at the Hospital Site in the next 10-15 years. 4. In the next 5-10 years the property development industry begins providing locations for
retail, hospitality and child care within the SHWEP. Residential properties will locate on the upper floors of these developments. This will help to add to the local amenity and increase the attractiveness of the SHWEP. This type of development extends along the whole length of Furlong Road towards the train station in the mixed use zone.
5. Mixed use development will be particularly intense surrounding Ginifer Station. Additional local services (e.g. banks, accountants, lawyers, etc) locate in the mixed use zone adjacent to the hospital to help service the growing worker and resident populations.
6. Development takes place at the north-western edge of the Sunshine hospital site along the new frontage to stony creek to take advantage of the amenity provided by the waterway and greenspace.
7. Following the introduction of new road links, medium scale (2, 3 or 4 storeys with a greater focus on office) commercial development takes place in the existing IN1Z land zoned part of the SHWEP. This scale of development is already taking place in similar locations in Melbourne (see Appendix B: Built Form Examples).
8. Residential development begins to occur in the surrounding area during the next 5-10 years and provides high quality and diverse accommodation for workers at the SHWEP.

19 | P a g e
9. A larger scale hotel (e.g. 8-9 floors Quest-style apartment) is developed within the precinct.
10. The remainder of the Sunshine NEIC grows at a higher pace and increases jobs and housing in the wider precinct to help encourage development at the SHWEP. See Figure 9 on page 33 for the employment data for the Sunshine NEIC.
11. Public transport and active transport becomes an increasingly common mode of travel for workers to reach the SHWEP.
12. An attractive and green streetscape is developed throughout the entire SHWEP. 13. Assumes full development of ‘back paddock’ at the hospital site for accommodation within
the precinct in the next 20 years. It should be noted that at this point in time, the future of the ‘back paddock’ is very uncertain. Western Health have deemed the land surplus to their requirements. Western Health are in the process of putting expressions of interest to the market. There is uncertainty about what the market may suggest for the site. Possible options may include purely residential, student accommodation, research facilities, commercial office or most likely a combination of all of these various uses. The table below provides a presentation of the various assumptions to provide another perspective on how the various assumptions change between the three scenarios.

20 | P a g e
TABLE 3. SCENARIO ASSUMPTIONS
Theme Conservative business as usual scenario Moderate scenario Higher scenario Hospital Site Development
The hospital site continues to develop in line with historical trends. These trends have been driven by increased demand for health services in Western Melbourne, which are certain to increase in the future. Given the size of the Sunshine Hospital site and potential for redevelopment of existing buildings and carparks there should not be any land constraints to this growth occurring.
As per conservative business as usual scenario In the next 5-10 years the property development industry begins providing locations for retail, hospitality and child care within the SHWEP. Residential properties will locate on the upper floors of these developments. This will help to add to the local amenity and increase the attractiveness of the SHWEP. This type of development extends along the whole length of Furlong Road towards the train station in the mixed use zone.
Hospital Site Development
N/A N/A Assumes full development of ‘back paddock’ at the hospital site for a mixes of uses including possible accommodation (e.g. student, health worker, private) within the precinct in the next 20 years.
Transport
It is assumed that the SHWEP will still have its current road transport constraints which would only be exacerbated by increased jobs at the SHWEP. This will constrict employment growth as workers find it increasingly difficult to travel to and from work and potential new business are deterred by this.
Public transport becomes an increasingly common mode of travel for workers to reach the SHWEP due to Melbourne Metro rail project and bus service improvements.
Public transport and active transport becomes an increasingly attractive option for travel to the SHWEP. This relieves the constriction on employment growth from transport access. This would also help the amenity of public realm hence making it a less attractive place to locate.
The Metro Melbourne Rail project opens in 2024. As per conservative business as usual scenario As per conservative business as usual scenario Private Hospital A private hospital does locate at the SHWEP in the next 15 years at the scale currently
proposed. A private hospital of the scale currently proposed locates in the precinct in the next 5 years.
A larger scale private hospital than currently proposed locates in the SHWEP in the next 5 years.
Aged Care N/A An aged care facility is constructed with independent living, respite and fall care facilities. This would likely take place at the existing Fronditha Age Care Site.
As per moderate scenario
Medical training facility
A new medical training facility doesn’t locate at the site. A university locates some campus activities in the precinct (e.g. Victoria University partially relocates from St Albans) in 15-20 years’ time.
An additional medical training facility locates at the Hospital Site in the 10-15 years.
Medical research facility
An additional medical research facility doesn’t locate at the site. As per conservative business as usual scenario An additional medical research facility locates at the Hospital Site in the 10-15 years.
Current industrial
The commercial / industrial / office zoned part of the site remains relatively unchanged, with limited employment growth taking place. It is assumed appropriate application of land use zoning parameters would not impact on uses at the industrial zoned land or surrounding sites.
Following the introduction of new road links (described in transport theme), low scale (1-2 storeys with a greater focus on industrial) commercial development takes place in the existing IN1Z land zoned part of the SHWEP. It is assumed appropriate application of land use zoning parameters would not impact on uses at the industrial zoned land or surrounding sites.
Following the introduction of new road links, medium scale (2-3-4 storeys with a greater focus on office) commercial development takes place in the existing IN1Z land zoned part of the SHWEP.

21 | P a g e
Public Amenity The low levels of amenity (public realm and access to retail and hospitality services) in and surrounding the SHWEP continues, hence making it a less attract place to locate.
As per conservative business as usual scenario As per conservative business as usual scenario
Mixed Used Development
The property development industry doesn’t embrace the SHWEP for innovative commercial / medical / retail / residential products in the next 15 years.
In the next 10-15 years the property development industry provides locations for retail, hospitality and child care within the SHWEP with some of the sites along Furlong Road being developed. Residential properties will locate on the upper floors of these developments. This would require early active engagement with the development industry to ensure the first sites are developed.
Mixed use development will be particularly intense surrounding Ginifer Station. Additional local services (e.g. bank, accountants, lawyers, etc) locate in the mixed use zone adjacent to the hospital to help service the growing worker and resident populations.
Mixed Used Development
N/A This type of development will help to activate the SHWEP and add to the local amenity and increase the attractiveness of the SHWEP.
Development takes place at the north-western edge of the Sunshine Hospital site along the new frontage to stony creek to take advantage of the amenity provided by the waterway and greenspace.
Hotel Development
N/A A small scale hotel (e.g. a 5-6 floors Quest-style apartment) is developed.
A larger scale hotel (e.g. 8-9 floors Quest-style apartment) is developed within precinct.
Residential Development
No significant residential development occurs in the surrounding area until after 2036. Residential development begins to occur in the surrounding area during the next 10 years and provides high quality and diverse accommodation for workers at the site.
Residential development begins to occur in the surrounding area during the next 5-10 years and provides high quality and diverse accommodation for workers at the SHWEP.
Sunshine NEIC Growth
The remainder of the Sunshine NEIC remains on a BAU growth path and hence does not provide more jobs and housing in the wider precinct to help encourage development at the SHWEP.
The remainder of the Sunshine NEC grows on above BAU growth path and increases jobs and housing in the wider precinct to help encourage development at the SHWEP.
The remainder of the Sunshine NEIC grows at a higher pace and increases jobs and housing in the wider precinct to help encourage development at the SHWEP.
Western Suburbs Growth
The growing population of Western Melbourne will underpin the demand for health services at the SHWEP.
As per conservative business as usual scenario As per conservative business as usual scenario
Other Medical Developments
The Joan Kirner Women’s and Children’s Hospital opens in 2018. As per conservative business as usual scenario As per conservative business as usual scenario
Small medical centres will continue to be developed in the area surrounding the hospital.
As per conservative business as usual scenario As per conservative business as usual scenario
The currently planned Cardiac Centre will open in the next 5-10 years. As per conservative business as usual scenario As per conservative business as usual scenario

22 | P a g e
EMPLOYMENT AND FLOORSPACE
Using the assumptions listed in the previous section a set of three employment scenarios have been created. These are presented in Table 42. The 2011 historical figure is based on Census journey to work data and the Labour Force Survey data. Mobile workers (e.g. construction workers, delivery drivers etc) are excluded from this estimate of workers. The 2016 data is based on the 2011 estimate and incorporates information from Western Health Annual Report and the ABS Labour Force Survey. When viewing these projections it is important to note that the projections are not intended to be a master plan for the SHWEP, but do provide some high level advice on the possible location of certain activities. The project also provides some broad descriptions of the types of buildings which may be constructed, but should not be seen as advice on the future urban design guidelines for the SHWEP. While not within the scope of the project, residential projections have been made to provide a complete view of the floorspace at the SHWEP. As a result, the dwelling projections should not be seen as a detailed residential growth framework for the SHWEP. This would require more detailed analysis. In addition, car parking estimates and projections have been produced to add an understanding of the capacity for future development patterns, rather than as a detailed input to future traffic modelling. This section presents the employment projections for each scenario in 2036 and 2051 in separate tables as below.
2 2036 is shown as the only future year, but projections for each scenario have been produced for each five yearly interval
between 2016 and 2051 and are in Appendix A.

23 | P a g e
TABLE 4. 2036 EMPLOYMENT PROJECTIO N SCENARIOS SUMMARY
2036
Industry 2011 2016 BAU Middle Higher
Agriculture, Forestry & Fishing 0 0 0 0 0
Mining 0 0 0 0 0
Manufacturing 30 30 20 20 30
Electricity, Gas, Water & Waste Services 0 0 0 0 0
Construction 0 0 0 0 0
Wholesale Trade 0 0 0 20 10
Retail Trade 5 6 10 138 200
Accommodation & Food Services 27 37 95 159 215
Transport, Postal & Warehousing 21 19 16 10 5
Information Media & Telecommunications 3 4 3 3 10
Financial & Insurance Services 0 0 0 15 30
Rental, Hiring & Real Estate Services 0 0 0 15 30
Professional, Scientific & Technical Services 17 20 39 79 350
Administrative & Support Services 5 5 9 10 10
Public Administration & Safety 7 6 5 5 5
Education & Training 75 80 117 192 300
Health Care & Social Assistance 2,500 3,000 4,850 5,150 6,000
Arts & Recreation Services 12 13 25 30 40
Other Services 6 6 7 20 40
Total 2,709 3,227 5,196 5,866 7,276
Average annual growth rate 2016-2036 2.4% 3.0% 4.1%
Source: SGS Economics and Planning
A summary of the projections shown in Table 4:
Under the BAU, employment at the SHWEP increases from 3,227 to 5,196 in 2036, an average annual growth of 2.4 per cent.
Under the Middle, employment at the SHWEP increases from 3,227 to 5,866 in 2036, an average annual growth of 3.0 per cent.
Under the Higher, employment at the SHWEP increases from 3,227 to 7,276 in 2036, an average annual growth of 4.1 per cent.
Table 5 presents the associated floorspace projections for each scenario. The 2016 estimate has been based on analysis of aerial photos, plans of the Sunshine Hospital Site and a site inspection. The future years have been based on the employment scenarios, previous SGS analysis of floorspace type use by each industry, and future m2 per worker calibrated to the 2016 m2 per worker. The floorspace has been broken into four broad categories.

24 | P a g e
TABLE 5. 2036 FLOORSPACE SCENARIOS – METRES SQUARE
2036
2016 BAU Middle Higher
Hospital / Health / Research 80,993 146,793 156,530 183,106
Industrial 23,412 18,870 14,214 10,998
Food Services / Accommodation / Retail 4,622 11,604 23,431 32,135
Office 4,603 7,144 13,264 29,468
Car parks 92,352 113,664 123,136 132,608
Dwellings 44,800 48,000 98,000 115,500
Total 250,782 346,076 428,575 503,815
Number of Dwellings 160 240 560 660
Number of Carparks 1,950 2,400 2,600 2,800
Source: SGS Economics and Planning
To provide some context to the floorspace demand numbers the following metrics provide some indication of the built form associated with the scenarios:
The buildings on the Sunshine Hospital Site currently have an average height of 2.2 storeys. In 2036, the average height would range from 4.4 storeys (BAU scenario) to 5.5 storeys (Higher scenario).
Car parking would go from at grade to around two storeys under the three scenarios.
Under the middle scenario development in the mixed use zone along Furlong Road to Ginifer Station would see, on average, every second site converted to a mixed use building with ground floor food/retail/commercial and residential above at an average height of 3 storeys (see Appendix B: Built Form Examples).
Under the Higher scenario, two out of three sites are developed to an average height of 4 storeys.
Under the higher scenario the size current industrial footprint would still be in place3 with half of the site being two storeys.
Of course the development could take different built forms. That is, some at grade car parks could be converted to health buildings and a larger multi-level car park. Or development could take place in the ‘back paddock’ and leave existing building heights unchanged.
3 But in new buildings.
25 | P a g e
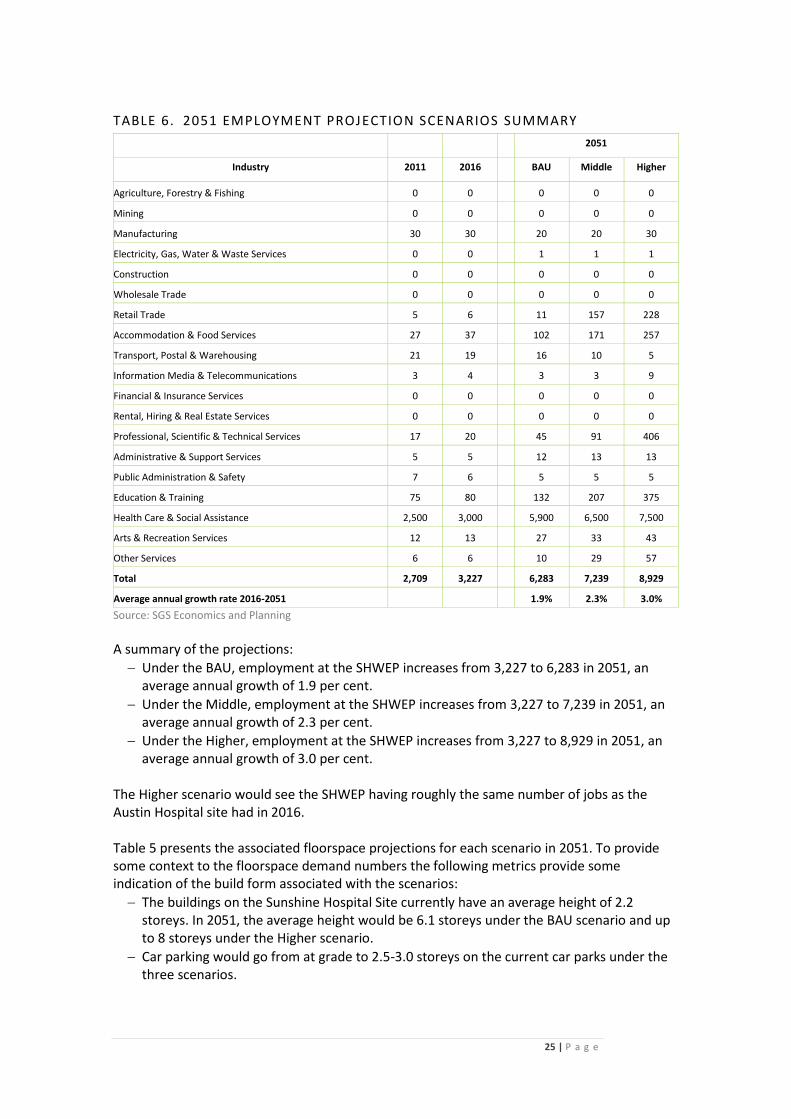
TABLE 6. 2051 EMPLOYMENT PROJECTION SCENARIOS SUMMARY
2051
Industry 2011 2016 BAU Middle Higher
Agriculture, Forestry & Fishing 0 0 0 0 0
Mining 0 0 0 0 0
Manufacturing 30 30 20 20 30
Electricity, Gas, Water & Waste Services 0 0 1 1 1
Construction 0 0 0 0 0
Wholesale Trade 0 0 0 0 0
Retail Trade 5 6 11 157 228
Accommodation & Food Services 27 37 102 171 257
Transport, Postal & Warehousing 21 19 16 10 5
Information Media & Telecommunications 3 4 3 3 9
Financial & Insurance Services 0 0 0 0 0
Rental, Hiring & Real Estate Services 0 0 0 0 0
Professional, Scientific & Technical Services 17 20 45 91 406
Administrative & Support Services 5 5 12 13 13
Public Administration & Safety 7 6 5 5 5
Education & Training 75 80 132 207 375
Health Care & Social Assistance 2,500 3,000 5,900 6,500 7,500
Arts & Recreation Services 12 13 27 33 43
Other Services 6 6 10 29 57
Total 2,709 3,227 6,283 7,239 8,929
Average annual growth rate 2016-2051 1.9% 2.3% 3.0%
Source: SGS Economics and Planning
A summary of the projections:
Under the BAU, employment at the SHWEP increases from 3,227 to 6,283 in 2051, an average annual growth of 1.9 per cent.
Under the Middle, employment at the SHWEP increases from 3,227 to 7,239 in 2051, an average annual growth of 2.3 per cent.
Under the Higher, employment at the SHWEP increases from 3,227 to 8,929 in 2051, an average annual growth of 3.0 per cent.
The Higher scenario would see the SHWEP having roughly the same number of jobs as the Austin Hospital site had in 2016. Table 5 presents the associated floorspace projections for each scenario in 2051. To provide some context to the floorspace demand numbers the following metrics provide some indication of the build form associated with the scenarios:
The buildings on the Sunshine Hospital Site currently have an average height of 2.2 storeys. In 2051, the average height would be 6.1 storeys under the BAU scenario and up to 8 storeys under the Higher scenario.
Car parking would go from at grade to 2.5-3.0 storeys on the current car parks under the three scenarios.

26 | P a g e
Under the middle scenarios development in the mixed use zone along Furlong Road to Ginifer Station would see all sites converted to a mixed use building with ground floor food / retail / commercial and residential above at an average height of 4 storeys.
While under the Higher scenario all sites will be developed to an average height of 7 storeys.
Under the Higher scenario the size current industrial footprint would still be in place4 with over half of the site being two storeys.
TABLE 7. 2051 FLOORSPACE SCENARIOS – METRES SQUARE
2051
2016 BAU Middle Higher
Hospital / Health / Research 80,993 178,457 197,207 228,840
Industrial 23,412 19,499 11,322 10,128
Food Services / Accommodation / Retail 4,622 12,504 25,487 37,996
Office 4,603 8,079 13,108 32,099
Car parks 63,936 159,130 172,390 185,651
Dwellings 44,800 96,000 196,000 231,000
Total 222,366 473,668 615,515 725,713
Number of Dwellings 160 480 1,120 1,320
Number of Carparks 1,350 3,360 3,640 3,920
Source: SGS Economics and Planning
Floorspace Land Use Mapping
While not a master planning process for the SHWEP, the location of the floorspace can be mapped back to the land uses within the draft future urban structure (as shown in Figure 7). Given the uncertainty regarding the likely development on particular lots of land within SHWEP these breakdowns should be treated with some caution.
TABLE 8. 2036 FLOORSPACE SCENARIOS – METRES SQUARE
2036
2016 BAU Middle Higher
Commercial-industrial 25,943 22,644 21,153 26,207
Health 80,993 146,793 156,530 183,106
Mixed Use - Commercial / Retail 6,761 15,074 29,932 46,693
Mixed Use - Dwellings 44,800 48,000 98,000 115,500
Source: SGS Economics and Planning
4 But in new buildings.
27 | P a g e
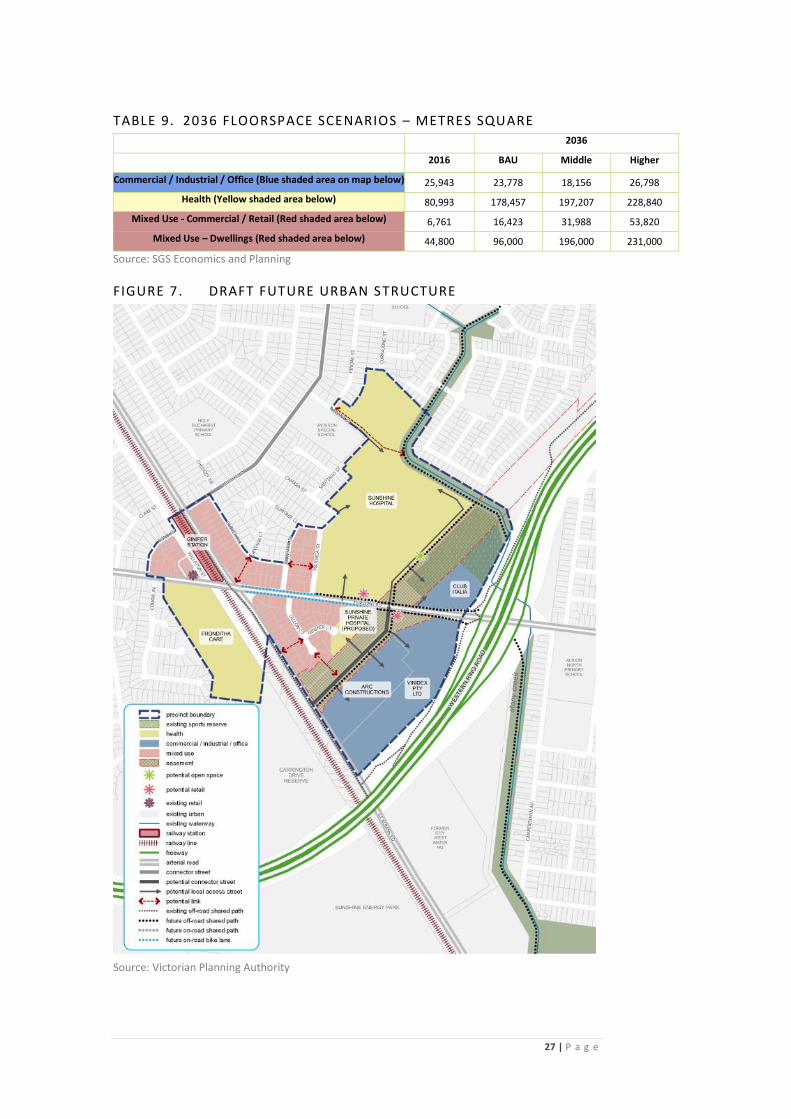
TABLE 9. 2036 FLOORSPACE SCENARIOS – METRES SQUARE
2036
2016 BAU Middle Higher
Commercial / Industrial / Office (Blue shaded area on map below) 25,943 23,778 18,156 26,798
Health (Yellow shaded area below) 80,993 178,457 197,207 228,840
Mixed Use - Commercial / Retail (Red shaded area below) 6,761 16,423 31,988 53,820
Mixed Use – Dwellings (Red shaded area below) 44,800 96,000 196,000 231,000
Source: SGS Economics and Planning
FIGURE 7. DRAFT FUTURE URBAN STRUCTURE
Source: Victorian Planning Authority

28 | P a g e
Detailed Health Job Analysis
Another helpful way to use the employment projections to understand future development at the SHWEP is using the health sector breakdown presented in the Role and structure of the health sector section. That is breaking down the Health care jobs in public and private hospitals and other health services. Once again the more detailed the breakdown, the greater the uncertainty, so these breakdowns should be treated with caution. However, the clear conclusion is that the bulk of employment and associated floorspace for the health sector will be in the public hospital (Sunshine Hospital), with the any private hospital and health services playing a secondary role. It has been assumed that no health related manufacturing will take place at the SHWEP. There is a degree of blurriness between floorspace or jobs in hospitals which may also be used for research and or training which should also be considered when viewing these numbers.
TABLE 10. DETAILED HEALTH CARE JOBS BREAKDOWN
BAU Moderate High
Category Sub-sector 2036 2051 2036 2051 2036 2051
Hospitals Private 200 250 300 400 400 500
Public 4,000 5,250 4,150 5,600 4,800 6,400
Health services 300 400 400 500 400 600
Research / Training
Scientific Research Services
148 177 256 299 575 781
Total 4,648 6,077 5,106 6,799 6,175 8,281
Source: Victorian Planning Authority
Results in this table could be compared to the existing structure in the City of Yarra in table 2.
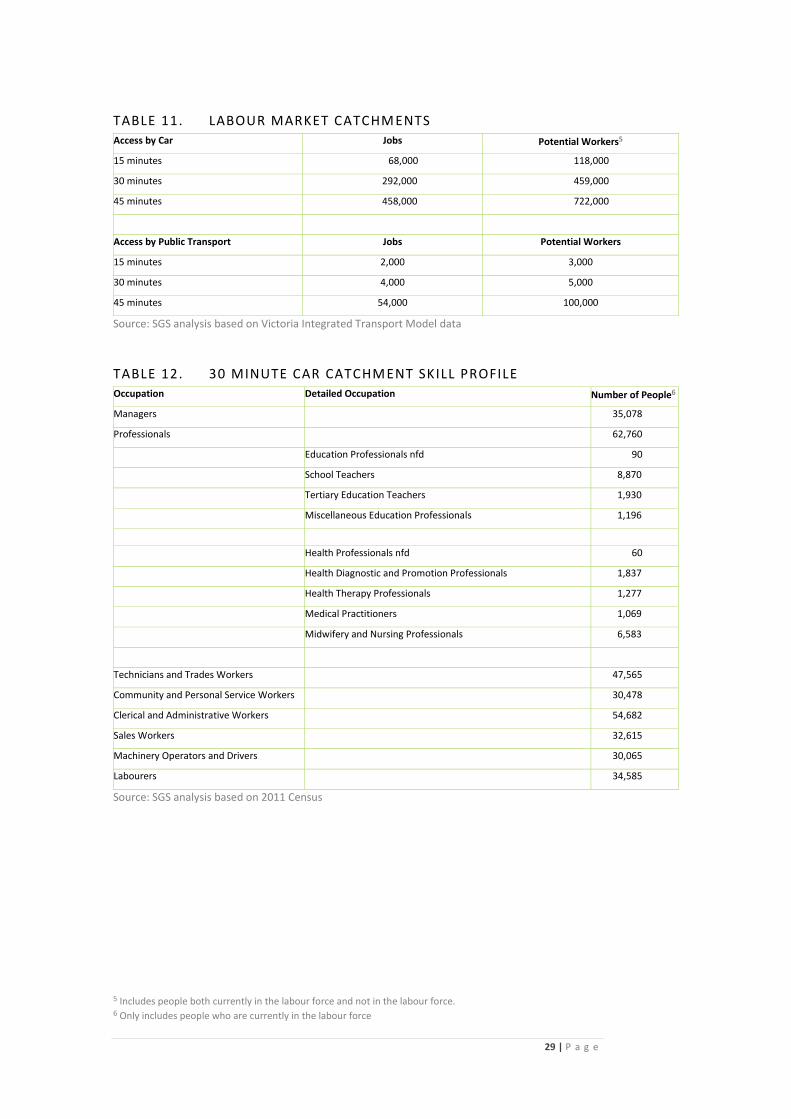
Labour Market Catchment
The labour market catchment is an important cross check to ensure that the employment projections for the various scenarios are plausible. That is, if enough potential workers cannot access the SHWEP, then employment at the site will not be able to grow. The analysis was undertaken by both car and public transport based on the current transport network during the morning peak. As shown in Table 11 and Figure 8 the access provided by the Western Ring Road provides tremendous access to a very large pool of labour. Currently, 459,000 workers can access the SHWEP in 30 minutes during the morning peak by car. The labour market catchment increases to 722,000 if the morning peak travel time is extended to 45 minutes. In terms of public transport, 100,000 workers could reach the SHWEP in 45 minutes during morning peak travel time. Given the size of the employment growth projected at the SHWEP under all the various scenarios, there appears to be no constraint from the size of the labour force catchment. This is further confirmed Table 12 which shows that in 2011 there are almost 11,000 health care professionals and almost 2,000 Tertiary Education Teachers living in the 30 minute catchment.
29 | P a g e
TABLE 11. LABOUR MARKET CATCHM ENTS
Access by Car Jobs Potential Workers5
15 minutes 68,000 118,000
30 minutes 292,000 459,000
45 minutes 458,000 722,000
Access by Public Transport Jobs Potential Workers
15 minutes 2,000 3,000
30 minutes 4,000 5,000
45 minutes 54,000 100,000
Source: SGS analysis based on Victoria Integrated Transport Model data
TABLE 12. 30 MINUTE CAR CATCHMENT SKILL PROFILE
Occupation Detailed Occupation Number of People6
Managers
35,078
Professionals
62,760
Education Professionals nfd 90
School Teachers 8,870
Tertiary Education Teachers 1,930
Miscellaneous Education Professionals 1,196
Health Professionals nfd 60
Health Diagnostic and Promotion Professionals 1,837
Health Therapy Professionals 1,277
Medical Practitioners 1,069
Midwifery and Nursing Professionals 6,583
Technicians and Trades Workers 47,565
Community and Personal Service Workers 30,478
Clerical and Administrative Workers 54,682
Sales Workers
32,615
Machinery Operators and Drivers 30,065
Labourers
34,585
Source: SGS analysis based on 2011 Census
5 Includes people both currently in the labour force and not in the labour force. 6 Only includes people who are currently in the labour force

30 | P a g e
FIGURE 8. MAP OF LABOUR MARKET CATCHMENTS
Source: SGS Economics and Planning
31 | P a g e
What-if Scenarios
To provide an indication of the sensitivity of the projections to different land use outcomes, the following dot points outline the impact of some possible outcomes.
If the currently zoned industrial land is converted to purely residential uses, about 730 jobs would be lost from the SHWEP under the high scenario in 2051.
If the mixed use zone fails to provide employment floorspace, 340 jobs (in retail and other services) would be lost from the SHWEP under the high scenario in 2051.
The loss of amenity associated with the loss of the jobs in the mix used zone could reduce health employment by 150 jobs.
The above three outcomes would see employment in higher scenario reduced from 10,864 to 10,134.
Reduced amenity in the local area could also make attracting an additional medical training and an additional medical research facility more difficult. Without these two employment generators there could be 450 less jobs in 2051.

32 | P a g e
CONCLUSIONS
The growing western suburbs of Melbourne will underpin a large increase in the number of health care jobs. A large portion of future health care jobs will want to cluster within close proximity to the exiting major health facilities at the SHWEP. Higher education providers also view the SHWEP as a strategic location where future investments can be made which would increase the level of employment. Large clusters of hospitals and major education institutions are usually the prime location for health and medical research centres. This is also an opportunity for the SHWEP. Unlike many hospital sites in Melbourne which are effectively ‘land locked’ by other uses which limit (or increase the costs of) future opportunities for physical expansion, the SHWEP has ample vacant land (e.g. the ‘back paddock’ and at grade car parking) which can be developed in the future. This is a clear advantage for the SHWEP. The SHWEP does lack local amenity in terms of the environment and access to local services (retail, food, child care, personal services etc) which is often a prerequisite for attracting higher order health, education and medical research jobs. Mixed use development within the SHWEP would be an ideal place for local service jobs to locate. However, the ideal type of development (lower floors for employment uses and upper levels for residential) is not currently being proposed in the SHWEP. There would be a need to encourage and attract this kind of development in the next 5-10 years to help to activate the SHWEP and offer those local services desired by the health and education workers. The residents of these buildings would help to generate a criteria mass for the local retail and food offer. Improvements to the current streetscape would also have to be made to improve the local amenity. This would also improve the amenity of the journey from Ginifer Station to the Sunshine Hospital. This would help to increase the number of trips made to the SHWEP by public transport. Increasing public and active transport trips will reduce the need for large volumes of multi-level car parking required at the SHWEP. Road access improvements are required into the precinct via improvements along Furlong Road (e.g right hand turn lane improvements, link road and new intersection) and cut through of cul-de-sacs in existing residential areas as per current thinking would also help to ease traffic congestion in accessing the SHWEP. High traffic congestion at a site can deter workers and potential employers from locating at a site. The currently zoned industrial land is somewhat cut off from the rest of the SHWEP by the high voltage power line easement. It would be better suited to commercial/office uses with some industrial activities. If the currently zoned industrial land is converted to purely residential, about 730 jobs (about 7 per cent of all jobs) would be lost from the SHWEP under the high scenario in 2051. The potential future of the currently zoned industrial land would have to be considered in this context.

33 | P a g e
APPENDIX A: DETAILED EMPLOYMENT PROJECTIONS
FIGURE 9. EMPLOYMENT SCENARIOS FOR SUNSHINE NEIC
Source: SGS Economics and Planning
34 | P a g e
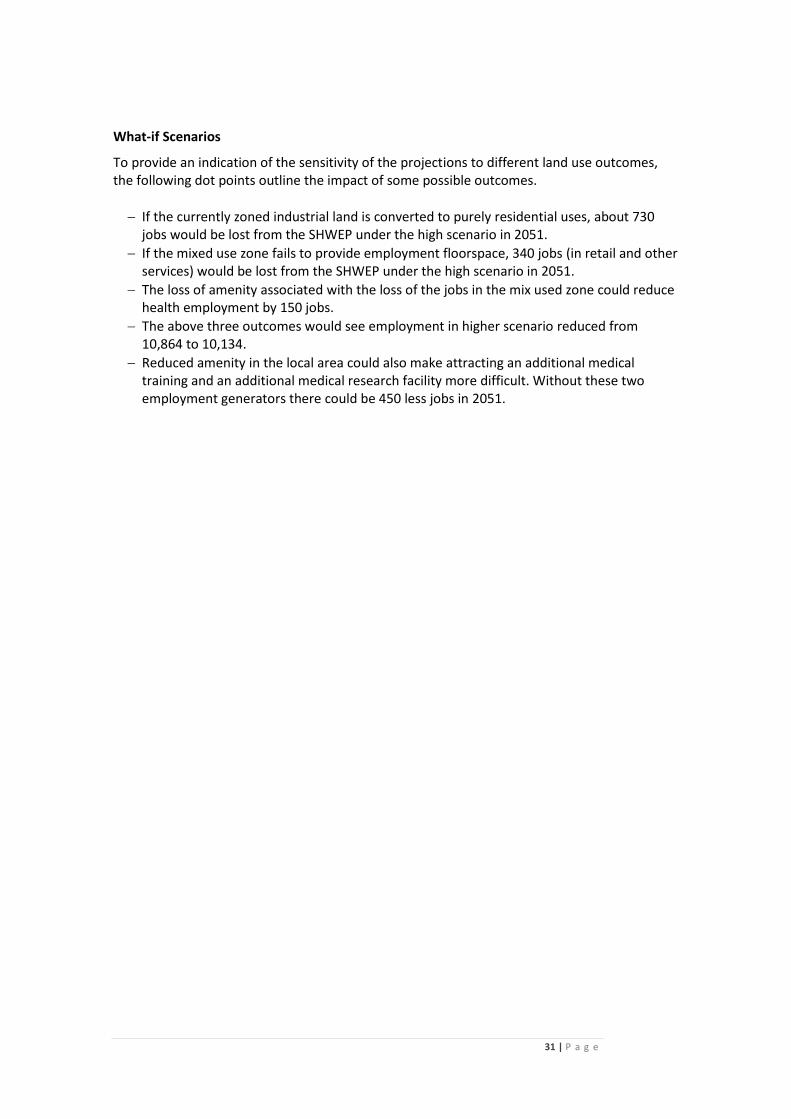
TABLE 13. BAU EMPLOYMENT PROJECTION SCENARIO
2016 2021 2026 2031 2036 2041 2046 2051
Agriculture, Forestry & Fishing 0 0 0 0 0 0 0 0
Mining 0 0 0 0 0 0 0 0
Manufacturing 30 30 25 20 20 20 20 20
Electricity, Gas, Water & Waste Services 0 0 0 0 0 0 0 1
Construction 0 0 0 0 0 0 0 0
Wholesale Trade 0 0 0 0 0 0 0 0
Retail Trade 6 8 9 10 10 10 10 11
Accommodation & Food Services 37 64 92 94 95 95 95 102
Transport, Postal & Warehousing 19 16 16 16 16 15 15 16
Information Media & Telecommunications 4 4 4 3 3 3 3 3
Financial & Insurance Services 0 0 0 0 0 0 0 0
Rental, Hiring & Real Estate Services 0 0 0 0 0 0 0 0
Professional, Scientific & Technical Services 20 27 34 36 39 41 42 45
Administrative & Support Services 5 6 7 8 9 10 11 12
Public Administration & Safety 6 6 6 6 5 5 5 5
Education & Training 80 83 96 112 117 122 128 132
Health Care & Social Assistance 3,000 4,000 4,200 4,500 4,850 5,150 5,500 5,900
Arts & Recreation Services 13 18 24 24 25 25 25 27
Other Services 6 6 7 7 7 8 9 10
Total 3,227 4,267 4,519 4,835 5,196 5,506 5,863 6,283
Annual Growth Rate 5.7% 1.2% 1.4% 1.5% 1.2% 1.3% 1.4%
Source: SGS Economics and Planning

35 | P a g e
TABLE 14. MIDDLE EMPLOYMENT PROJECTION SCENARIO
2016 2021 2026 2031 2036 2041 2046 2051
Agriculture, Forestry & Fishing 0 0 0 0 0 0 0 0
Mining 0 0 0 0 0 0 0 0
Manufacturing 30 28 25 20 20 20 20 20
Electricity, Gas, Water & Waste Services 0 0 0 0 0 0 0 1
Construction 0 0 0 0 0 0 0 0
Wholesale Trade 0 0 0 0 20 0 0 0
Retail Trade 6 68 130 134 138 141 144 157
Accommodation & Food Services 37 96 154 157 159 160 160 171
Transport, Postal & Warehousing 19 15 10 10 10 10 10 10
Information Media & Telecommunications 4 4 4 3 3 3 3 3
Financial & Insurance Services 0 0 0 0 15 0 0 0
Rental, Hiring & Real Estate Services 0 0 0 0 15 0 0 0
Professional, Scientific & Technical Services 20 45 69 73 79 84 85 91
Administrative & Support Services 5 6 8 9 10 11 12 13
Public Administration & Safety 6 6 6 6 5 5 5 5
Education & Training 80 118 157 183 192 197 203 207
Health Care & Social Assistance 3,000 4,200 4,500 4,850 5,150 5,500 5,900 6,500
Arts & Recreation Services 13 21 29 29 30 30 30 33
Other Services 6 13 19 19 20 23 26 29
Total 3,227 4,619 5,110 5,494 5,866 6,185 6,597 7,239
Annual Growth Rate 7.4% 2.0% 1.5% 1.3% 1.1% 1.3% 1.9%
Source: SGS Economics and Planning

36 | P a g e
TABLE 15. HIGH EMPLOYMENT PROJECTIO N SCENARIO
2016 2021 2026 2031 2036 2041 2046 2051
Agriculture, Forestry & Fishing 0 0 0 0 0 0 0 0
Mining 0 0 0 0 0 0 0 0
Manufacturing 30 34 38 30 30 30 30 30
Electricity, Gas, Water & Waste Services 0 0 0 0 0 0 0 1
Construction 0 0 0 0 0 0 0 0
Wholesale Trade 0 0 0 0 10 0 0 0
Retail Trade 6 88 170 175 200 205 209 228
Accommodation & Food Services 37 117 196 200 215 225 240 257
Transport, Postal & Warehousing 19 12 5 5 5 5 5 5
Information Media & Telecommunications 4 7 11 11 10 9 9 9
Financial & Insurance Services 0 0 0 0 30 0 0 0
Rental, Hiring & Real Estate Services 0 0 0 0 30 0 0 0
Professional, Scientific & Technical Services 20 160 300 325 350 374 377 406
Administrative & Support Services 5 6 8 9 10 11 12 13
Public Administration & Safety 6 6 6 6 5 5 5 5
Education & Training 80 152 225 250 300 325 350 375
Health Care & Social Assistance 3,000 4,400 4,700 5,600 6,000 6,500 7,000 7,500
Arts & Recreation Services 13 26 38 39 40 41 41 43
Other Services 6 22 38 37 40 46 51 57
Total 3,227 5,031 5,735 6,687 7,276 7,776 8,328 8,929
Annual Growth Rate 9.3% 2.7% 3.1% 1.7% 1.3% 1.4% 1.4%
Source: SGS Economics and Planning

37 | P a g e
APPENDIX B: BUILT FORM EXAMPLES
FIGURE 10. 4 STOREY RESIDENTIAL EXAMPLE
Source: SGS Economics and Planning
FIGURE 11. 5 STOREY RESIDENTIAL EXAMPLE
Source: SGS Economics and Planning
38 | P a g e
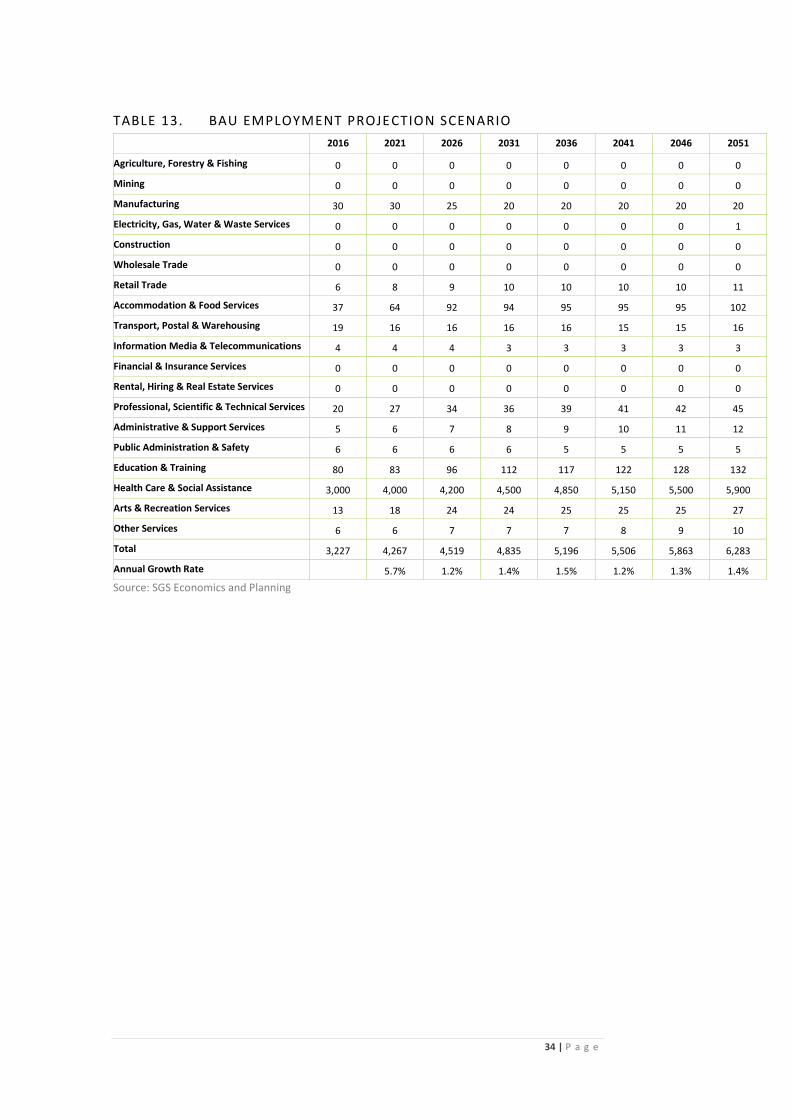
FIGURE 12. 2 STOREY OFFICE / IN DUSTRIAL EXAMPLE
Source: SGS Economics and Planning
FIGURE 4 . 2 STOREY COMMERCIAL EXAMPLE
Source: SGS Economics and Planning
39 | P a g e
FIGURE 4 . 3 STOREY COMMERCIAL EXAMPLES
Source: SGS Economics and Planning
FIGURE 4 . 4 STOREY COMMERCIAL EXAMPLES
Source: SGS Economics and Planning

40 | P a g e
FIGURE 4 . 5 STOREY COMMERCIAL EXAMPLES
Source: SGS Economics and Planning

41 | P a g e
APPENDIX C: METHODOLOGY
Floorspace
The 2016 floor space estimates were produced using aerial photos to map the footprint of all the buildings in the SHWEP. The Sunshine Hospital floorplan was then used to account for the differing levels within the Hospital. For other buildings in the SHWEP their height was informed by the site visit and Google Maps. This produced an estimate of the 2016 floorspace. This was used to calibrate, the floorspace ratio for different industries / floorspace uses.
FIGURE 4 . SUNSHINE HOSPITAL FL OORPLAN
Source: Western Health
The industry employment projections were then applied to the broad land use categories shown in the table below. The square metre per worker shown in the table was then applied to each land use category. The floorspace was then assigned into the higher level categories shown in the body of this report. These broad land use category breakdowns and square metre per worker have been developed by undertaking a large number of land use audits across Sydney and Melbourne.

42 | P a g e
TABLE 16. DETAILED FLOORSPACE ASSUMPTIONS
Business / Office Parks
Office Retail - Big Box
Bulky Goods Retail
Retail - Main Street
Dispersed Activities
Special Activities
Service industry
and urban support
Manufacturing - Light
Manufacturing - Heavy
Freight and
Logistics
Urban Services
Agriculture, Forestry and Fishing 10% 40% 0% 0% 0% 0% 0% 0% 0% 0% 0% 50%
Mining 10% 40% 0% 0% 0% 0% 0% 0% 0% 0% 0% 50%
Manufacturing 7% 3% 0% 0% 0% 0% 0% 0% 57% 33% 0% 0%
Construction 0% 5% 0% 0% 0% 0% 0% 40% 35% 0% 0% 20%
Wholesale Trade 25% 10% 0% 0% 0% 0% 0% 5% 0% 0% 60% 0%
Retail Trade 0% 0% 15%
85% 0% 0% 0% 0% 0% 0% 0%
Accommodation and Food Services 0% 15% 0% 85% 0% 0% 0% 0% 0% 0% 0% 0%
Transport Postal and Warehousing 0% 0% 0% 0% 0% 0% 0% 10% 0% 0% 90% 0%
Information Media and Telecommunications 40% 60% 0% 0% 0% 0% 0% 0% 0% 0% 0% 0%
Financial and Insurance Services 35% 65% 0% 0% 0% 0% 0% 0% 0% 0% 0% 0%
Rental, Hiring and Real Estate Services 40% 55% 0% 0% 0% 0% 0% 5% 0% 0% 0% 0%
Professional, Scientific and Technical Services 40% 55% 0% 0% 0% 0% 0% 5% 0% 0% 0% 0%
Administrative and Support Services 50% 40% 0% 0% 0% 0% 10% 0% 0% 0% 0% 0%
Public Administration and Safety 50% 40% 0% 0% 0% 0% 10% 0% 0% 0% 0% 0%
Education and Training 35% 35% 0% 0% 0% 15% 15% 0% 0% 0% 0% 0%
Health Care and Social Assistance 0% 0% 0% 0% 0% 25% 75% 0% 0% 0% 0% 0%
Arts and Recreation Services 30% 40% 0% 0% 5% 10% 15% 0% 0% 0% 0% 0%
Other Services 20% 30% 0% 0% 15% 5% 0% 30% 0% 0% 0% 0%
Square metre per worker
BUA 50 35 20 140 35 35 30 30 500 500 500 500
Middle 50 35 20 140 35 35 30 30 275 275 275 275
Higher 50 35 20 140 35 35 30 30 80 225 225 225
Source: SGS Economics and Planning

43 | P a g e
Car parking
The number of car parks within SHWEP was estimated via a manual count using Google Maps. The count yielded approximately 1336 at Sunshine Hospital, 300 south of Furlong Road and 314 at Club Italia Sporting Club. A standard 48 metres square was then assumed for each car park. This 48 metres square includes the parking bay and lanes. The future projections were made based around professional judgement of the car parking likely to be required to deal with each the level of employment in each scenario.
44 | P a g e
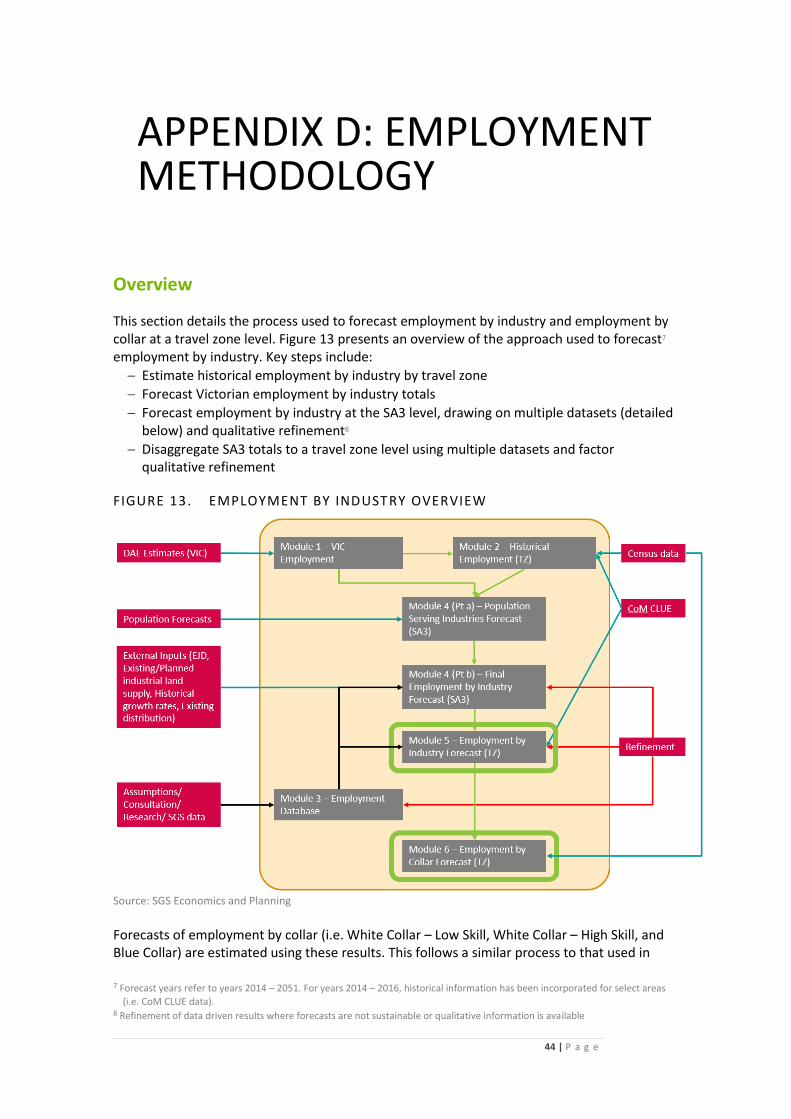
APPENDIX D: EMPLOYMENT METHODOLOGY
Overview
This section details the process used to forecast employment by industry and employment by collar at a travel zone level. Figure 13 presents an overview of the approach used to forecast7 employment by industry. Key steps include:
Estimate historical employment by industry by travel zone
Forecast Victorian employment by industry totals
Forecast employment by industry at the SA3 level, drawing on multiple datasets (detailed below) and qualitative refinement8
Disaggregate SA3 totals to a travel zone level using multiple datasets and factor qualitative refinement
FIGURE 13. EMPLOYMENT BY INDUSTRY OVERVIEW
Source: SGS Economics and Planning
Forecasts of employment by collar (i.e. White Collar – Low Skill, White Collar – High Skill, and Blue Collar) are estimated using these results. This follows a similar process to that used in
7 Forecast years refer to years 2014 – 2051. For years 2014 – 2016, historical information has been incorporated for select areas
(i.e. CoM CLUE data). 8 Refinement of data driven results where forecasts are not sustainable or qualitative information is available

45 | P a g e
previous modules. That is, Victorian totals for employment by collar are disaggregated to travel zones by use of the RAS algorithm.
Detailed Approach Description
Module 2 - Historical employment by industry by travel zone
Conceptual approach Estimation of historical employment by industry follows the following key steps:
Sourcing census data for years 1996 – 2011 from the ABS at the smallest available geography (destination zones)
Adjust for spatial misallocation in the census
Align CLUE Block data to census data in the City of Melbourne
Align intermediate estimate with Victorian employment by industry totals
Allocate destination zone employment data to 2011 Mesh Block (MB) geographies based on land use category and spatial overlap (e.g. if a destination zone is comprised of two MB, one with a commercial land use and one with an industrial land use, then professional services jobs will largely be allocated to the first MB, which manufacturing jobs will be primarily be allocated to the second)
Aggregate of MB employment data to travel zone Key data sources
Deloitte Access Economics: Employment by industry (VIC)
ABS Census (1996, 2001, 2006, 2011): Employment by industry (Destination zones)
City of Melbourne: Clue Block data
Module 4 - SA3 employment by industry forecast
Conceptual approach Forecasts of employment by industry at an SA3 level are computed using a four-step approach. This segments the forecasting process into components which can synthesise the different types of information available. The component of employment which can be most accurately forecast by a data driven approach is considered first. Population serving employment is allocated to SA3s based on forecast residential growth. The extent of this allocation is determined using historical (2001 – 2011) patterns of growth (i.e. additional jobs per new resident). Next, a component of employment growth (or decline) is forecast using the SGS Employment Database, which is a collation of policy assumptions, consultation inputs, research, and additional available data. These inputs represent changes to employment that cannot be forecast by a data-driven methodology9, but consider spatial drivers such as the capacity for growth within an SA3, expected changes to infrastructure, and the spatial policy considerations of government.
9 e.g. historical data/trends cannot be used to forecast a greenfield industrial development, whereas they may capture an urban
renewal project if similar developments have occurred

46 | P a g e
In the absence of direct assumptions or employment drivers, it’s known that the spatial distribution of employment is influenced by a range of factors, with impacts differing by industry. Knowledge intensive services will be partial to highly accessible locations, while industrial firms will prefer to locate in areas with larger available land and lower land values. Therefore, the next component of the forecast is based on the following indicator series:
Effective Job Density, which captures the tendency of knowledge intensive sectors to locate in agglomerated locations.
Industrial land supply (existing and planned), which heavily influences the distribution of industrial sectors (e.g. manufacturing, wholesale trade). Agricultural land is also considered.
Existing employment levels, distribution and historical trends (2001 – 2011). Finally, the resulting forecasts are reviewed against several measures, and refined if required. Factors considered as part of this review included:
Level growth by industry (as well as total employment) assessed against SA3 size (i.e. density measure).
Industry growth rates assessed against historical trends and comparator regions.
SA3 share of industry employment assessed against historical trend and comparator regions.
Employment self-containment (i.e. ratio of employment to workforce) to ensure reasonable inter-regional flows.
Key assumptions
Jobs per new resident is defined by historical rates observed between 2001 and 2011 (across all SA3s). For each industry, the ratio is chosen to be between the 50th and 70th of these historical estimates.
Capacity constraints.
Policy driven assumptions for National Employment and Innovation Clusters informed by MPA estimates.
Key data sources
Deloitte Access Economics: Employment by industry (VIC)
VIF2016: Population forecasts
ABS Census: Employment by industry (Destination zones)
VPA: Precinct structure plans
DELWP: Industrial UDP
SGS Economics and Planning: Employment Database
Module 5 - Travel Zone employment by industry forecast
Conceptual approach Once SA3 forecasts of employment by industry have been established, their disaggregation to a Travel Zone (TZ) level is informed by several inputs. Once again, assumptions and data collated within the Employment Database are used to inform the timing and spatial distribution of employment by industry. Examples of this include:
Data extracted from precinct structure plans for greenfield regions.

47 | P a g e
Data on urban renewal sites (e.g. Docklands, Fisherman’s Bend, Arden, etc).
Consultation data (e.g. proposed hospital locations). In locations absent of detailed inputs, or robust assumptions, the 2011 distribution of employment by industry is used to allocate any remaining SA3 employment to TZ. This represents a proportional intensification of existing employment centres. Finally, a detailed review of employment by industry is undertaken at both a district and TZ level. This considers several measures, which include:
Employment density.
Share of SA3 (or for TZ – share of district).
Growth rates assessed against comparator districts and zones.
Assessment against known background conditions (e.g. known infrastructure developments).
Adjustments based on this review process are then incorporated into the forecasts as necessary. Key assumptions
Major Employment Database and refinement inputs include:
Precinct structure plan employment estimates for greenfield regions.
Industry and spatial distribution within National Employment and Innovation Clusters.
Fisherman’s Bend – Moderate Intervention Scenario. Key data sources
ABS Census: Employment by industry (Destination zones)
CoM: CLUE data
SGS Economics and Planning: Employment Database
48 | P a g e
APPENDIX E: LAND USE REQUIREMENTS
Regional Health and Education Business
These business encompass larger scale health and education services which are provided at a regional level, such as general or specialty hospitals, universities and TAFEs. Sunshine Hospital is an example of such as business. Physical characteristics of Regional Health and Education business vary based upon the specific activity. However, they tend to prefer large lot sizes with multistory buildings. These businesses typically require strategic locations, be accessible by car and well served by public transport. Regional Health and Education facilities tend to be insensitive to surrounding amenity levels and may create some conflicts with surrounding residential land uses due to their 24 hour operation.
Local Health Business
Local health business include GP offices, specialist practices, aged care facilities, pathologists or day surgeries. In some cases these business require purpose built facilities (e.g age care facilities) while in other cases then can locate in generic office or retail premises. Typically require strategic location with good accessible by car and well served by public transport. Some uses may prefer to be located near a regional health facility. Regional Health and Education facilities tend to be insensitivity to surrounding amenity levels and will not create conflicts with surrounding residential land uses.
Main Street Retail
Main Street Retail (as opposed to bulking goods or big box retail) involves small scale and local retailing activities, traditionally found on the main street of an area. They are typically small clusters or strips of stores located on a main road or street. They are one or two story, small scale activities, normally with active frontages and frequently with shop‐top housing or offices. Examples include restaurants and cafés, newsagents, bakeries, supermarkets, butchers and real estate agents. They tend to be on small lots, with the exception of supermarkets which may require larger footprints. Main Street retail requires a local residential and worker catchment to remain viable. Providing a high amenity environment is important for the success of Main Street Retail.

49 | P a g e
Office
Office business are likely to accommodate a significant number of administrative staff, or in some cases health or commercial activities. They are typically located within commercial centres and require good access for workers. Examples of office based business include banks, accounting services, architects, information technology, general service businesses, real estate agents and even health services could locate in office buildings. The lot sizes for offices can vary significantly and the built form can vary significantly as well. Office requires good accessibility to office workers. Providing a high amenity environment is important for the success of office businesses.
Local Service Industrial
Activities which are typified by a wide range of small scale businesses which provide services to other businesses or individuals, such as car service and repair; joinery, construction and building supplies and domestic storage. These uses typically do not interfere with the amenity of residential uses via pollution, but there could be exceptions to this. Local service industrial includes a wide range of businesses that service other business (components, maintenance and support) and sub-regional populations, therefore they need to be accessible for population centres. Low levels of amenity is not an issue for these types of businesses and they tend to prefer large lot sizes. The built form tends to be single level buildings.

50 | P a g e
Contact us CANBERRA
Level 2, 28-36 Ainslie Place Canberra ACT 2601
+61 2 6257 4525 [email protected]
HOBART
PO Box 123 Franklin TAS 7113
+61 421 372 940 [email protected]
MELBOURNE
Level 14, 222 Exhibition Street Melbourne VIC 3000
+61 3 8616 0331 [email protected]
SYDNEY
209/50 Holt Street Surry Hills NSW 2010
+61 2 8307 0121 [email protected]
WESTERN SYDNEY
Level 7, 91 Phillip Street Parramatta NSW 2150
+61 2 8307 0121 [email protected]