summit county septic analysis report 2016
TRANSCRIPT

Septic Development in Summit County: An Evaluation of the Past in the Face of Future Development
Prepared for
Summit County Health Department
Prepared by
SWCA Environmental Consultants
November 2016


SEPTIC DEVELOPMENT IN SUMMIT COUNTY: AN EVALUATION OF THE PAST IN THE FACE OF FUTURE
DEVELOPMENT
Prepared for
Summit County Health Department 650 Round Valley Drive Park City, Utah 84060
Prepared by
SWCA Environmental Consultants 257 East 200 South, Suite 200
Salt Lake City, Utah 84111
November 30, 2016


Septic Development in Summit County: An Evaluation of the Past in the Face of Future Development
i
ACKNOWLEDGMENTS
Summit County Health Department would like to acknowledge both the Summit County Board of Health and the Summit County Council for support for the implementation and findings of the studies described in this report.
EXECUTIVE SUMMARY
As part of an effort to avoid further impacts to the environment (e.g., to surface water and groundwater) from septic contamination and to responsibly guide the future development of eastern Summit County, Utah, the Summit County Health Department initiated a series of spatial modeling and water quality studies. Beginning in 2014, SWCA Environmental Consultants collaborated with Summit County Health Department to prioritize future septic upgrades or conversion to sewer systems based on landscape-level parameters for subdivisions within the Snyderville Basin. A water quality sampling plan, based in part on the findings of the prioritization analysis, aimed to analyze current surface water quality conditions and known water quality impairments due to septic contamination. In 2016, additional water sampling was conducted to document conditions in Snyderville Basin and was expanded to characterize the existing conditions in eastern Summit County. This activity will inform future septic and sewer planning. The septic suitability model developed in 2014 and 2015 for Snyderville Basin was refined and applied to eastern Summit County to categorize the area based on its theoretical suitability for conventional septic development. Based on criteria adapted from the State of Utah Administrative Code, a portion of the county does not appear to be well suited for conventional septic development; however, more-suitable areas were identified. The model will serve as a tool for government administrators and local stakeholders alike, and will allow for informed evaluation of potential development sites.

Septic Development in Summit County: An Evaluation of the Past in the Face of Future Development
ii
This page intentionally blank
Septic Development in Summit County: An Evaluation of the Past in the Face of Future Development
iii
CONTENTS Acknowledgments ........................................................................................................................................ i Executive Summary ..................................................................................................................................... i 1. Introduction ......................................................................................................................................... 1
1.1. Issue ................................................................................................................................................ 1 1.2. Background .................................................................................................................................... 2
1.2.1. Building Sewer ....................................................................................................................... 2 1.2.2. Septic Tank ............................................................................................................................ 2 1.2.3. Absorption Field .................................................................................................................... 2 1.2.4. State and County Regulations ................................................................................................ 3
1.3. Study Area ...................................................................................................................................... 4
2. Prioritization Analysis ........................................................................................................................ 6 2.1. Purpose ........................................................................................................................................... 6 2.2. Methodology .................................................................................................................................. 6 2.3. Results ............................................................................................................................................ 7 2.4. Discussion ...................................................................................................................................... 7
3. Water Quality Sampling .................................................................................................................. 10 3.1. Purpose ......................................................................................................................................... 10 3.2. Methodology ................................................................................................................................ 10 3.3. Results .......................................................................................................................................... 17
3.3.1. 2014 Sampling ..................................................................................................................... 17 3.3.2. 2016 Sampling ..................................................................................................................... 18
3.4. Discussion .................................................................................................................................... 22
4. Eastern Summit County: Spatial Analysis ..................................................................................... 24 4.1. Purpose ......................................................................................................................................... 24 4.2. Methodology ................................................................................................................................ 24 4.3. Results .......................................................................................................................................... 31
4.3.1. Model Verification ............................................................................................................... 31 4.4. Discussion .................................................................................................................................... 35
5. Summary and Future Direction ...................................................................................................... 35
6. Literature Cited ................................................................................................................................ 36
APPENDICES Appendix A. July 2014 letter report: Results and Findings from the Microbial Source Tracking
Sampling Conducted in Summit County, Utah2014 Snyderville Water Sampling Report
Appendix B. June 2016 letter report: Results from the 2016 Water Quality Sampling Conducted in Summit County, Utah
Appendix C. September 2016 letter report: Results from the Summer 2016 Water Quality Sampling Conducted in Summit County, Utah

Septic Development in Summit County: An Evaluation of the Past in the Face of Future Development
iv
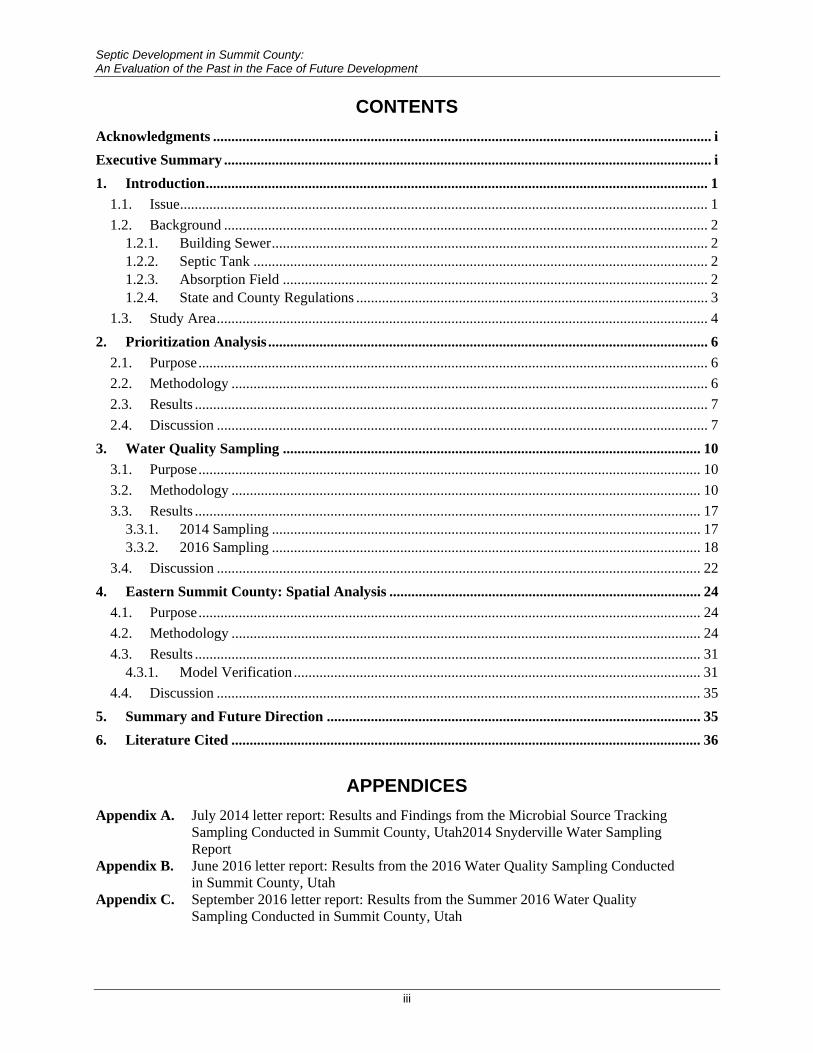
FIGURES Figure 1. Generalized depiction of a septic system including the building sewer, septic tank, and
absorption field (drainfield) at the interface with the surrounding soil. Used by permission, Summit County Health Department, 2016. ............................................................ 3
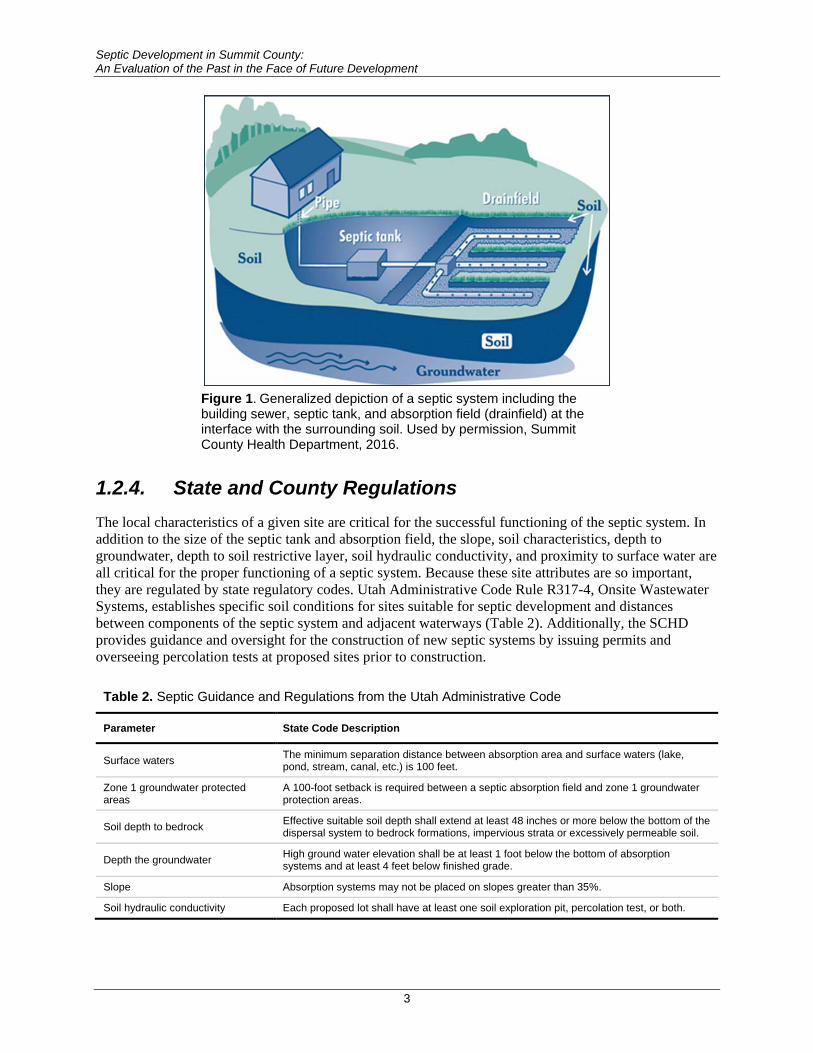
Figure 2. The study area within Summit County including the Snyderville Basin and the areas east of Snyderville Basin (not including national forest) that are considered to be eastern Summit County. ............................................................................................................ 5
Figure 3. Septic narrative ranking for subdivisions in Snyderville Basin on septic systems. ................... 8 Figure 4. Results of the priority analysis with the density of septic systems shown on top of the
priority ranking. ......................................................................................................................... 9 Figure 5. 2016 water sampling sites throughout Summit County........................................................... 15 Figure 6. Concentrations of nitrate in samples from spring and summer sampling events in
Summit County. The red horizontal line at 1 mg/L represents the estimated upper limit of background concentrations for streams draining forested landscapes. Data are shown for only those sites that were sampled during both spring and summer sampling events. ...... 20
Figure 7. E. coli concentrations at Snyderville Basin and eastern Summit County sites. The horizontal red line represents the UDWQ recreational standard of 126 org/100 mL. The bar for Summer 2 refers to the samples taken on August 22 as a backup for August 9 samples that were not delivered to the analytical laboratory on time. Data are shown for only those sites that were sampled during both spring and summer sampling events. ........... 21
Figure 8. GenBAC concentrations at sampling sites in eastern Summit County and Snyderville Basin for spring and summer sampling events. Data are shown for only those sites that were sampled during both spring and summer sampling events. ............................................ 22
Figure 9. Water sampling sites SN-08 (left) and ES-11 (right), where elevated concentrations of contaminants were documented through chemical analyses. .................................................. 23
Figure 10. Portions of the study area deemed unsuitable for septic development due to proximity to protected waters, floodplains, or slopes steeper than 35%. The protected water classification includes areas within 100 feet of surface water or Zone 1 groundwater protection areas, flood-irrigated lands, in addition to FEMA floodplain areas. ...................... 27
Figure 11. Septic suitability model based on criteria in the Utah Administrative Code Rule R317-4 for Onsite Wastewater Systems and the U.S. Department of Agriculture Web Soil Survey. ..................................................................................................................................... 29
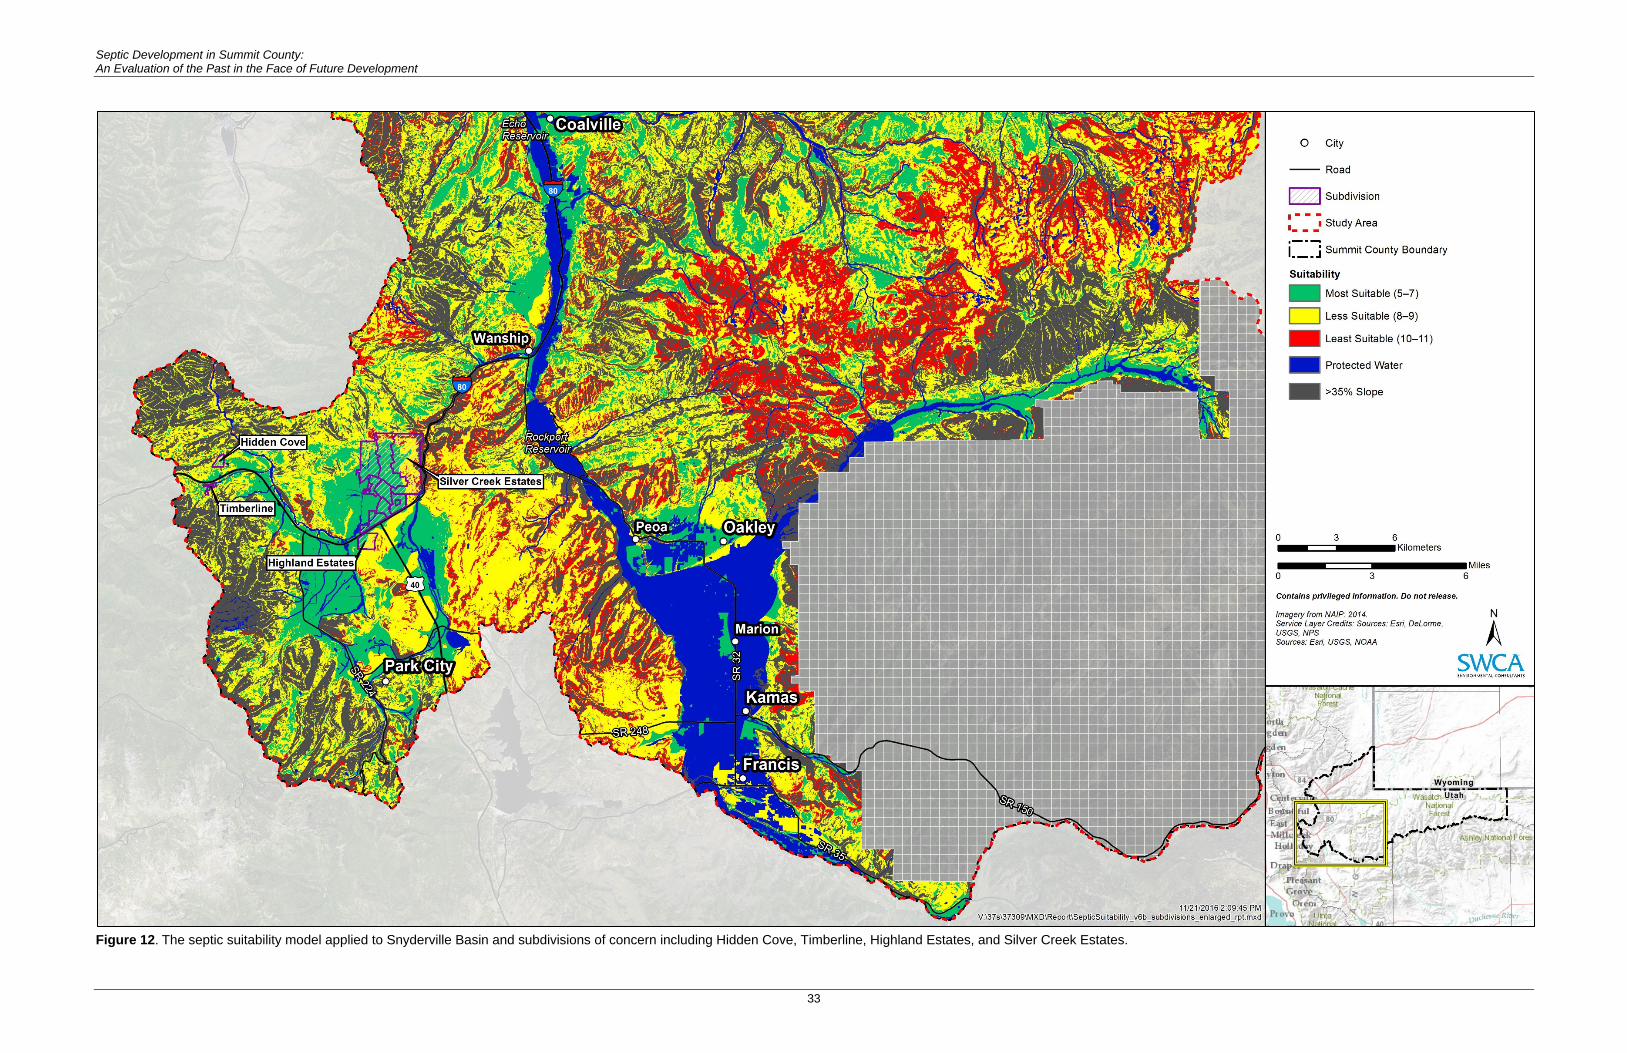
Figure 12. The septic suitability model applied to Snyderville Basin and subdivisions of concern including Hidden Cove, Timberline, Highland Estates, and Silver Creek Estates. ................. 33
TABLES Table 1. Study Design Components ........................................................................................................ 1 Table 2. Septic Guidance and Regulations from the Utah Administrative Code .................................... 3 Table 3. Components of the Snyderville Septic Priority Analysis .......................................................... 6 Table 4. Water Sampling Sites, June 3, 2014 ........................................................................................ 10 Table 5. 2016 Sampling Site Descriptions and Locations in Summit County, Utah ............................. 11 Table 6. Results from 2014 Nitrate, E. coli, and Microbial Source Tracking Sampling ....................... 17 Table 7. Results from 2016 Nitrate, E. coli, and Microbial Source Tracking Sampling ....................... 19 Table 8. Parameters Selected for Use in the Septic Suitability Analysis in Eastern Summit
County ..................................................................................................................................... 25

Septic Development in Summit County: An Evaluation of the Past in the Face of Future Development
1
1. INTRODUCTION
1.1. Issue Contamination of surface waters is a growing issue throughout the United States and around the world. In the United States, the Clean Water Act (CWA) (33 United States Code 1251 et seq.) mandates that each state must manage its surface waters to meet the established criteria for their defined beneficial uses. If the criteria for the beneficial use is not being met due to elevated concentrations of a contaminant, a total maximum daily load (TMDL) analysis must be undertaken to identify necessary reductions in contaminant loading to ensure compliance with existing standards. A modeling effort as part of the Rockport and Echo Reservoir TMDLs (SWCA Environmental Consultants [SWCA] 2013) analysis identified septic systems within the watershed as one of the sources of contamination. A subsequent assessment by Summit County Health Department (SCHD) identified specific subdivisions in Summit County that were likely contributing to surface water degradation, due to the density, age, and location of septic systems.
The SCHD is concerned with protecting the health of the human population in Summit County and the surrounding environment. A septic system is considered to have failed when any part of the system is not operating properly. This can result in contamination of subsurface or surface waters or surfacing of untreated effluent. Evidence of septic failure in areas of western Summit County has increased the awareness of the potential issues associated with septic development. With aging systems in densely populated western Summit County and anticipated future population growth in eastern Summit County, there is an interest in generating a better understanding of the mechanisms behind septic failure. With more information, the SCHD hopes to establish guidance on the installation of new septic systems to ensure that the risk of septic failure is minimized and to avoid contamination and degradation of the water supply and subsequent risks to human health. The research efforts described in this report are aimed at identifying areas that should be the highest priority for septic upgrades, assessing the condition of adjacent and surrounding surface waters, and evaluating the suitability of eastern Summit County for future conventional septic development.
The study design includes the following components (Table 1), and these are described in more detail in section 2.
Table 1. Study Design Components
Study Component Description
Prioritization analysis Spatial analysis using landscape level data and septic system information to rank portions of Snyderville Basin subdivisions based on their level of priority for septic upgrades and to inform future analyses such as water quality sampling and additional spatial analyses.
Water quality sampling Water quality sampling and analysis conducted in 2014 (Appendix A) and 2016 (Appendix B and Appendix C) to evaluate the condition of surface waters in Summit County and potential contamination from failed septic sources.
Summit County spatial analysis 2016 spatial analysis using landscape data to characterize areas of Summit County for conventional septic system suitability

Septic Development in Summit County: An Evaluation of the Past in the Face of Future Development
2
1.2. Background On-site subsurface sewage disposal systems, or septic systems, are an alternative to municipal sewage systems in areas where such a service is unavailable. The purpose of a septic system is to dispose of domestic wastewater in such a manner as to protect public health and the environment. Although Park City and the surrounding development is connected via sewer to a wastewater treatment facility, the low population density in the majority of Summit County and the high initial cost of municipal waste water treatment systems have made the development of a sewer system infeasible. Therefore, potential future development in areas of eastern Summit County would also be done with septic waste disposal systems.
Septic systems are fairly simple in their design. There are three main components to a septic system: a building sewer, a septic tank, and an absorption field (Figure 1).
1.2.1. Building Sewer The building sewer is simply a pipe connection between the building plumbing and the septic tank.
1.2.2. Septic Tank The septic tank is a buried, watertight container that is typically made of concrete, fiberglass, or polyethylene. It is meant to hold wastewater long enough to allow solids to settle out (sludge) and oil and grease to float to the surface.
1.2.3. Absorption Field While the sludge is held within the septic tank, the wastewater exits and is discharged into the absorption field for further treatment by a biomat and the soil. The partially treated wastewater is pushed along into the absorption field for further treatment every time new wastewater enters the tank. From the absorption field the partially treated wastewater moves into the surrounding soil where remaining harmful bacteria, viruses, and nutrients are bound up by the soil particles. Following the filtration and treatment by the soil, wastewater either evaporates, is taken up by plants, or percolates down into the water table.
While septic systems theoretically are designed to a capacity that is proportional to the size of the service area, they are not maintenance free and do not last forever. Periodic pumping of the septic tank is necessary to remove the buildup of sludge. Also, a reserve absorption field should be installed as an alternate to the original absorption field in the case of failure of the original absorption field. When a given septic system is installed, it is given an estimated expected lifespan before it should be taken out of commission.
Septic failure occurs when untreated sewage from a nearby septic system is present above ground or in adjacent waterways. This presence of untreated effluent can be both a nuisance, creating, for example unpleasant odors and appearance, and a human health concern because chemical and bacterial components can be toxic to humans. Of these toxic components, nitrate and Escherichia coli (E. coli) are commonly sampled in surface waters and (when found in high concentrations) can be an indication of septic contamination.
Septic Development in Summit County: An Evaluation of the Past in the Face of Future Development
3
Figure 1. Generalized depiction of a septic system including the building sewer, septic tank, and absorption field (drainfield) at the interface with the surrounding soil. Used by permission, Summit County Health Department, 2016.
1.2.4. State and County Regulations The local characteristics of a given site are critical for the successful functioning of the septic system. In addition to the size of the septic tank and absorption field, the slope, soil characteristics, depth to groundwater, depth to soil restrictive layer, soil hydraulic conductivity, and proximity to surface water are all critical for the proper functioning of a septic system. Because these site attributes are so important, they are regulated by state regulatory codes. Utah Administrative Code Rule R317-4, Onsite Wastewater Systems, establishes specific soil conditions for sites suitable for septic development and distances between components of the septic system and adjacent waterways (Table 2). Additionally, the SCHD provides guidance and oversight for the construction of new septic systems by issuing permits and overseeing percolation tests at proposed sites prior to construction.
Table 2. Septic Guidance and Regulations from the Utah Administrative Code
Parameter State Code Description
Surface waters The minimum separation distance between absorption area and surface waters (lake, pond, stream, canal, etc.) is 100 feet.
Zone 1 groundwater protected areas
A 100-foot setback is required between a septic absorption field and zone 1 groundwater protection areas.
Soil depth to bedrock Effective suitable soil depth shall extend at least 48 inches or more below the bottom of the dispersal system to bedrock formations, impervious strata or excessively permeable soil.
Depth the groundwater High ground water elevation shall be at least 1 foot below the bottom of absorption systems and at least 4 feet below finished grade.
Slope Absorption systems may not be placed on slopes greater than 35%.
Soil hydraulic conductivity Each proposed lot shall have at least one soil exploration pit, percolation test, or both.

Septic Development in Summit County: An Evaluation of the Past in the Face of Future Development
4
1.3. Study Area This study focuses on non-federal lands within Summit County, Utah, specifically the areas surrounding Park City, Coalville, Oakley, and Kamas (Figure 2). The greater study area was divided into two basins based on the existing level of development and current land use. The Snyderville Basin (western Summit County) includes Park City and is the largest population center of Summit County, including a large tourist population and numerous year-round resorts. Eastern Summit County is largely rural, agricultural, and undeveloped national forest land; it contains numerous small towns but no large population centers.
Septic Development in Summit County: An Evaluation of the Past in the Face of Future Development
5
Figure 2. The study area within Summit County including the Snyderville Basin and the areas east of Snyderville Basin (not including national forest) that are considered to be eastern Summit County.
Septic Development in Summit County: An Evaluation of the Past in the Face of Future Development
6
2. PRIORITIZATION ANALYSIS
2.1. Purpose The purpose of the prioritization analysis was to identify specific subdivisions within western Summit County (Snyderville Basin) that should be prioritized for either sewering or septic system upgrades based on a series of parameters. In response to the findings of the Rockport and Echo Reservoir TMDLs (SWCA 2013) and reports of septic failure within some of these subdivisions, the priority analysis aimed to provide a transparent tool capable of characterizing the condition (with respect to potential septic failure) of each of the Snyderville Basin subdivisions.
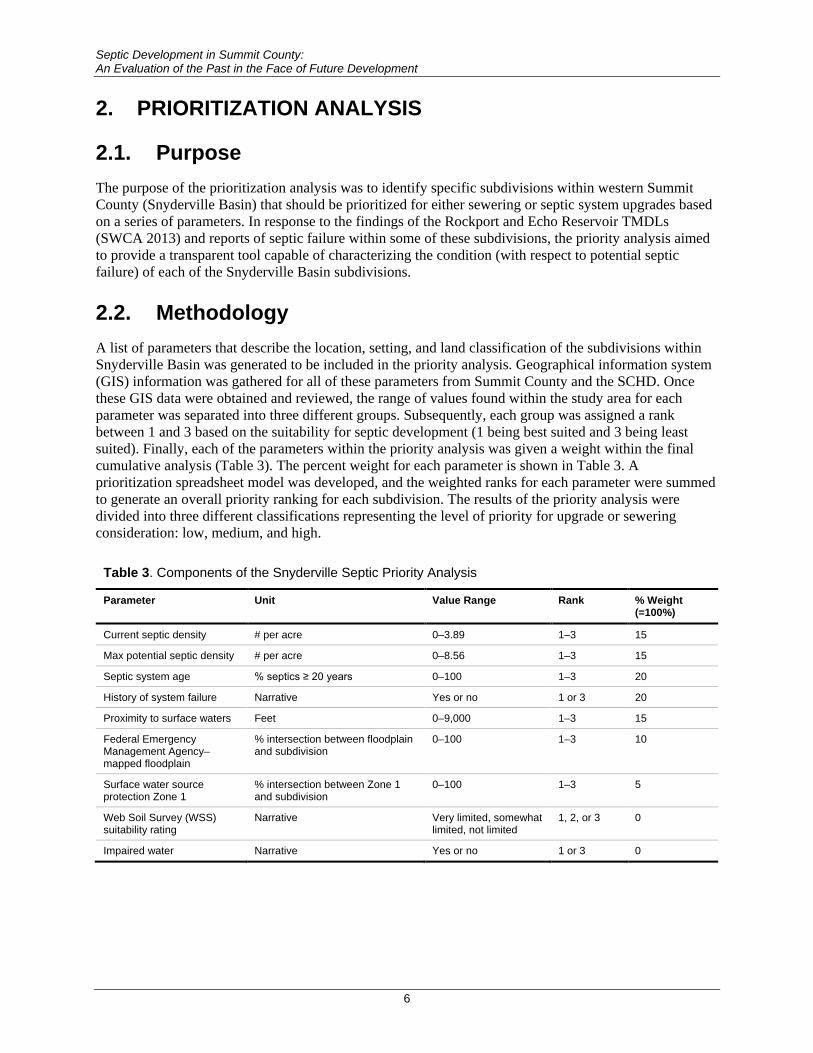
2.2. Methodology A list of parameters that describe the location, setting, and land classification of the subdivisions within Snyderville Basin was generated to be included in the priority analysis. Geographical information system (GIS) information was gathered for all of these parameters from Summit County and the SCHD. Once these GIS data were obtained and reviewed, the range of values found within the study area for each parameter was separated into three different groups. Subsequently, each group was assigned a rank between 1 and 3 based on the suitability for septic development (1 being best suited and 3 being least suited). Finally, each of the parameters within the priority analysis was given a weight within the final cumulative analysis (Table 3). The percent weight for each parameter is shown in Table 3. A prioritization spreadsheet model was developed, and the weighted ranks for each parameter were summed to generate an overall priority ranking for each subdivision. The results of the priority analysis were divided into three different classifications representing the level of priority for upgrade or sewering consideration: low, medium, and high.
Table 3. Components of the Snyderville Septic Priority Analysis
Parameter Unit Value Range Rank % Weight (=100%)
Current septic density # per acre 0–3.89 1–3 15
Max potential septic density # per acre 0–8.56 1–3 15
Septic system age % septics ≥ 20 years 0–100 1–3 20
History of system failure Narrative Yes or no 1 or 3 20
Proximity to surface waters Feet 0–9,000 1–3 15
Federal Emergency Management Agency–mapped floodplain
% intersection between floodplain and subdivision
0–100 1–3 10
Surface water source protection Zone 1
% intersection between Zone 1 and subdivision
0–100 1–3 5
Web Soil Survey (WSS) suitability rating
Narrative Very limited, somewhat limited, not limited
1, 2, or 3 0
Impaired water Narrative Yes or no 1 or 3 0
Septic Development in Summit County: An Evaluation of the Past in the Face of Future Development
7
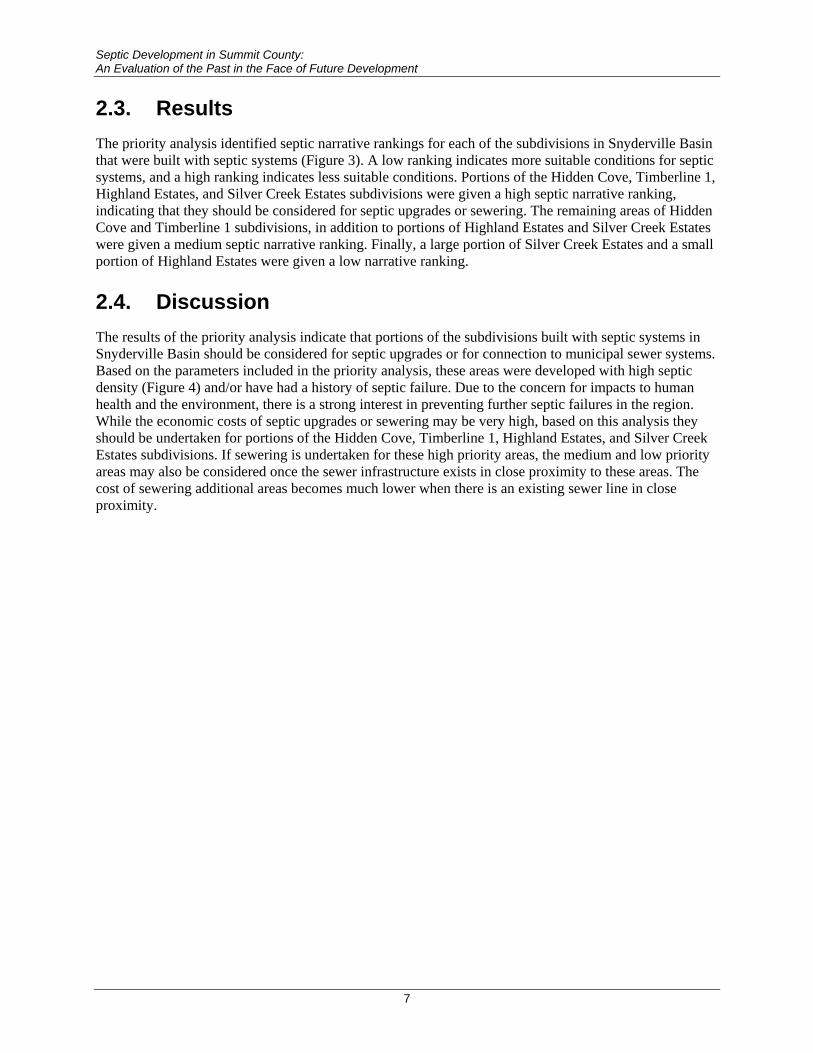
2.3. Results The priority analysis identified septic narrative rankings for each of the subdivisions in Snyderville Basin that were built with septic systems (Figure 3). A low ranking indicates more suitable conditions for septic systems, and a high ranking indicates less suitable conditions. Portions of the Hidden Cove, Timberline 1, Highland Estates, and Silver Creek Estates subdivisions were given a high septic narrative ranking, indicating that they should be considered for septic upgrades or sewering. The remaining areas of Hidden Cove and Timberline 1 subdivisions, in addition to portions of Highland Estates and Silver Creek Estates were given a medium septic narrative ranking. Finally, a large portion of Silver Creek Estates and a small portion of Highland Estates were given a low narrative ranking.
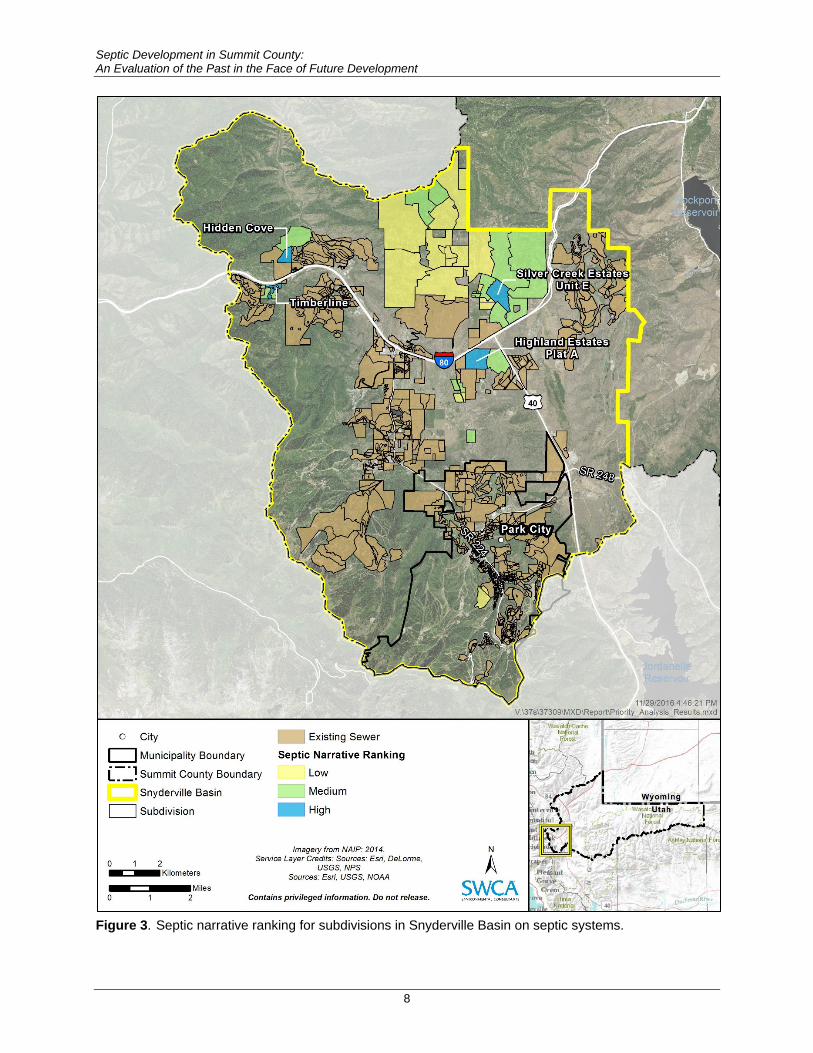
2.4. Discussion The results of the priority analysis indicate that portions of the subdivisions built with septic systems in Snyderville Basin should be considered for septic upgrades or for connection to municipal sewer systems. Based on the parameters included in the priority analysis, these areas were developed with high septic density (Figure 4) and/or have had a history of septic failure. Due to the concern for impacts to human health and the environment, there is a strong interest in preventing further septic failures in the region. While the economic costs of septic upgrades or sewering may be very high, based on this analysis they should be undertaken for portions of the Hidden Cove, Timberline 1, Highland Estates, and Silver Creek Estates subdivisions. If sewering is undertaken for these high priority areas, the medium and low priority areas may also be considered once the sewer infrastructure exists in close proximity to these areas. The cost of sewering additional areas becomes much lower when there is an existing sewer line in close proximity.
Septic Development in Summit County: An Evaluation of the Past in the Face of Future Development
8
Figure 3. Septic narrative ranking for subdivisions in Snyderville Basin on septic systems.
Septic Development in Summit County: An Evaluation of the Past in the Face of Future Development
9
Figure 4. Results of the priority analysis with the density of septic systems shown on top of the priority ranking.

Septic Development in Summit County: An Evaluation of the Past in the Face of Future Development
10
3. WATER QUALITY SAMPLING
3.1. Purpose The purpose of water quality sampling at sites in western Summit County (Snyderville Basin) was to confirm and document cases of septic system failure and demonstrate the impact of known (and suspected) septic failures on water quality. Given that septic failure results in the release of sewage into adjacent surface water and/or groundwater, one would expect to find elevated concentrations of contaminants near known and suspected failed septic systems. The purpose of water quality sampling in eastern Summit County was to search for evidence of septic failure and illicit discharge of sewage material into waterways. Additionally, samples from sites spanning a large area throughout eastern Summit County would provide background water quality data to serve as a baseline for potential future septic development.
3.2. Methodology Water quality sampling took place between June and August in 2014 and 2016. The first water quality sampling effort on June 3, 2014, was connected to the priority analysis (described above) and was focused on the high priority subdivisions in Snyderville Basin. Sites within each subdivision were selected based on local knowledge of potential septic-influenced surface waters and included roadside drainages, wet meadows, and streams, etc. (Table 4).
Site selection for the 2016 water sampling in Snyderville Basin was largely based on the 18 sampling sites identified for use in the 2014 study, although the list of sites was refined based on the results of the 2014 septic study. Seven sites from the original sampling plan were removed, and emphasis was placed on those sampling sites in subdivisions with a high priority rating (i.e., Hidden Cove, Highland Estates, Timberline, and Silver Creek Estates), leaving a total count of 11 sampling sites in Snyderville Basin (labeled “SN-”) (see Table 4). Eleven sites were also selected in eastern Summit County (labeled “ES-”) (Table 5). Selection of the eastern Summit County sites was based on the preliminary septic assessment conducted as part of the Rockport and Echo TMDLs analysis and local knowledge of the SCHD staff (conveyed through the watershed tour that took place on March 16, 2016). In most cases, sites were selected both upstream and downstream of subdivisions or developments to specifically target potential contribution of septic systems to surface waters.
Table 4. Water Sampling Sites, June 3, 2014
2014 Sample Site ID
2016 Sample Site ID
Location Site Description
001 SN-01 Silver Creek Estates Roadside drainage
002 SN-02 Silver Creek Estates Wet meadow
003 SN-03 Silver Creek Estates Steam
004 N/A East Canyon Creek East Canyon Creek before the confluence with Kimball Creek
005 SN-05 East Canyon Creek East Canyon Creek after the confluence with Kimball Creek
006 N/A Headwaters Reference stream
007 N/A Kimball Creek Tributary to Kimball Creek
008 SN-08 Highland Estates Roadside drainage
009 SN-09 Highland Estates Roadside drainage

Septic Development in Summit County: An Evaluation of the Past in the Face of Future Development
11
Table 4. Water Sampling Sites, June 3, 2014
2014 Sample Site ID
2016 Sample Site ID
Location Site Description
010 N/A East Canyon Creek East Canyon Creek just downstream of the golf course
011 SN-11 Hidden Cove Hillside seepage
012 SN-12 Hidden Cove Hillside seepage
013 SN-13 Hidden Cove Pond
014 N/A Moose Hollow Hillside seepage
015 N/A Moose Hollow Septic effluent
016 N/A Moose Hollow Roadside drainage
017 SN-17 Timberline Stream
018 SN-18 Timberline Stream
Table 5. 2016 Sampling Site Descriptions and Locations in Summit County, Utah
Sampling Site ID Location Site Description
SN-01** Silver Creek Estates Roadside drainage
SN-02* Silver Creek Estates Wet meadow
SN-03* Silver Creek Estates Unnamed stream
SN-05 East Canyon Creek East Canyon Creek after the confluence with Kimball Creek
SN-08* Highland Estates Roadside drainage
SN-09 Highland Estates Unnamed stream
SN-11 Hidden Cove Hillside seepage
SN-12* Hidden Cove Hillside seepage
SN-13 Hidden Cove Pond
SN-17 Timberline Unnamed stream
SN-18 Timberline Unnamed stream
ES-01 Upstream of the Samak development Beaver Creek
ES-02 Downstream of the Samak development
Beaver Creek
ES-03 Utah State Route 35 crossing Provo River
ES-04 Downstream of Stewart Ranch Park development
Provo River
ES-05 Downstream of the Killkare development
Provo River
ES-06 Upstream of the Aspen Acres subdivision
Weber River
ES-07 Downstream of the Hidden Lake subdivision
Weber River
ES-08 At the outlet of Rockport Reservoir Weber River
ES-09 Between Rockport and Echo Reservoirs Weber River

Septic Development in Summit County: An Evaluation of the Past in the Face of Future Development
12
Table 5. 2016 Sampling Site Descriptions and Locations in Summit County, Utah
Sampling Site ID Location Site Description
ES-10 Between Rockport and Echo Reservoirs Weber River
ES-11 Spring Hills subdivision Unnamed tributary to Beaver Creek
*Summer sampling did not take place because the site was dry. ** Spring sampling did not take place because the site was dry.
Water samples were analyzed for a small suite of constituents: nitrate, E. coli, the genus Bacteroides (total Bacteroides or GenBAC), and a human-specific bacteria within the genus Bacteroides called HF183 (HBAC). Although nitrate and E. coli are standard parameters in water quality analyses, GenBAC and HBAC are lesser known and are part of the emerging field of microbial source tracking (MST).
The concentration of nitrate is important to consider when understanding the potential impact of septic systems on surface waters. In areas of high septic system density, high nitrate concentrations can indicate septic system influence on surface waters because conventional septic systems do not treat for nitrate. Although nitrogen from septic systems may be initially released in organic or ammonia form, the design of septic systems generally results in their conversion to nitrate. Nitrate is highly mobile and, once formed, can leach into the subsurface landscape and possibly into surrounding streams, depending on the proximity of the stream to the septic system. For reference, the EPA limit for nitrate in drinking water is 10 milligrams per liter (mg/L), and, on average, a typical background concentration of nitrate in a forested watershed is between 0.5 and 1.0 mg/L.
E. coli is a bacterium commonly found in the lower intestine of warm-blooded organisms. High E. coli concentrations in surface waters proximate to areas of high septic density may indicate conventional leach field failure. A fully functioning leach field filters bacteria and viruses from effluent before it reaches groundwater or surface waters. The Utah state water quality criteria for E. coli in waters designated for recreational use is a geometric mean of 126 organisms (org)/100 milliliters (mL) over a 30-day period.
While fecal coliforms such as E. coli have long served as indicators of fecal contamination of waters, there are some limitations to their value as indicators. Recent research shows that there is not always a correlation between E. coli and fecal pathogens (Griffin et al. 2001). Additionally, E. coli is present in all warm-blooded mammals and therefore does not provide an indication of the specific source of fecal contamination (Harwood et al. 2014). MST analyses attempt to overcome both of these limitations. MST analyses consisted of two different analyses (GenBAC and HBAC), both of which employed polymerase chain reaction methodology (PCR). PCR is a molecular method that assays specific marker genes through genetic extraction and amplification. It uses those markers to identify the presence or absence of fecal sources (Tetra Tech 2011). The more recently developed quantitative PCR (qPCR) provides additional information by measuring the quantity of DNA present in a water sample. Human fecal contamination of surface waters was explored using qPCR of the genus Bacteroides, which is an anaerobic fecal bacterium abundant in the gut of mammals, is an indication of fecal pollution (EPA 2010) when present in water, and is an alternative indicator to E. coli. Concentrations of Bacteroides do not necessarily correlate with concentrations of E. coli because they are distinct groups of bacteria. Certain qPCR analytical techniques are able to identify sub-groups of Bacteroides associated with specific mammalian hosts such as humans, livestock, or wildlife. Specifically, the HF183 genetic marker was used to quantify human pollution, and GenBac was also quantified using a similar qPCR method.
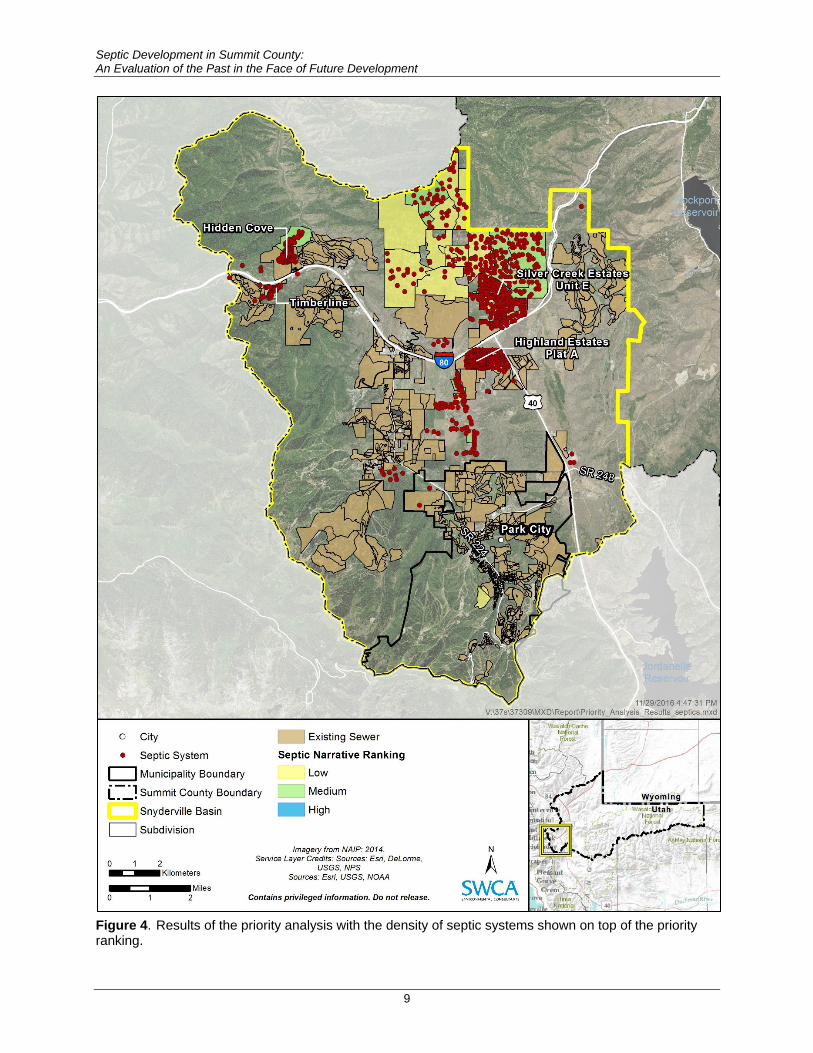
On June 3, 2014, representatives from SWCA and the SCHD sampled 18 surface water sites in Snyderville Basin. On June 1 and 2, 2016, SWCA and SCHD sampled 22 surface water sites throughout Summit County (see Table 5 and Figure 5) and 17 surface water sites throughout Summit County on August 9, 10, and 22, 2016. Spring and summer sampling events were included in an attempt to capture

Septic Development in Summit County: An Evaluation of the Past in the Face of Future Development
13
both runoff and baseflow conditions and to identify leach field failure versus illicit discharge. Sampling did not take place at sites where there was insufficient water for sampling (e.g., SN-01 during the June sampling event and SN-01, SN-02, SN-03, SN-08 and SN-12 during the summer sampling event). An additional sampling day (on August 22, 2016) was added after the microbial source tracking (MST) bottles from August 9 failed to reach their destination within the designated holding time and were measured at 1 degree Celsius (ºC) above the recommended temperature for samples arriving from international sources (16ºC as opposed to 15ºC). On this additional day of sampling, five sites in eastern Summit County were selected and resampled for nitrate, E. coli, and HBAC. These sites were selected based on the results of the spring sampling event, which identified sites with the potential to yield positive results.
Weather conditions during all sampling days were mostly sunny with clear skies and an average temperature of 67 degrees Fahrenheit (°F) on June 3, 2014, 66°F on June 1 and 2, 2016, 70°F on August 9
and 10, 2016, and 66°F on August 22, 2016 (Weather Underground 2016).
Three samples were collected at each site by dipping pre-cleaned 1-liter collection bottles into the center of flow for the given water source. Sample water was transferred from the 1-liter bottle into individual sample bottles (provided by the analytical laboratories), which were stored on ice and promptly shipped to the respective analytical laboratories where they were analyzed for E. coli, nitrate, and genetic markers for different fecal sources (i.e., MST). The E. coli analysis was conducted by the Utah Public Health Laboratory in Salt Lake City, Utah, and the nitrate analysis was conducted by American West Analytical Laboratories, also located in Salt Lake City. Laboratory methods used to analyze for nitrate (via U.S. Environmental Protection Agency [EPA] Method 300.0) and E. coli (via EPA Method SM 9223 B-QT) were performed in accordance with the National Environmental Laboratory Accreditation Program.

Septic Development in Summit County: An Evaluation of the Past in the Face of Future Development
14
This page intentionally blank
Septic Development in Summit County: An Evaluation of the Past in the Face of Future Development
15
Figure 5. 2016 water sampling sites throughout Summit County.

Septic Development in Summit County: An Evaluation of the Past in the Face of Future Development
16
This page intentionally left blank

Septic Development in Summit County: An Evaluation of the Past in the Face of Future Development
17
The 2014 MST analysis was conducted by EMSL Analytical in Cinnaminson, New Jersey, and the 2016 samples were analyzed by Microbial Insights, Inc. in Knoxville, Tennessee. While 2014 and 2016 samples were all analyzed for the genus Bacteroides, results of MST analysis from the two laboratories (EMSL in 2014 and Microbial Insights in 2016) may not be comparable due to differences in the genetic markers used during analysis and the units used to quantify the results. All samples were collected in accordance with the standard collection procedures for each laboratory. Bottles and sample storage were provided by the respective laboratory, and the recommended holding times of 6 hours for E. coli, 24 hours for MST, and 48 hours for nitrate were not exceeded.
3.3. Results Water quality sampling results for nitrate, E. coli, and MST are presented in Table 6 (2014 sampling) and Table 7 (2016 sampling). A discussion of the results is provided below.
Table 6. Results from 2014 Nitrate, E. coli, and Microbial Source Tracking Sampling
Sampling Site ID
Nitrate (mg/L)
E. coli (org/100 mL)
Total Bacteroides (CE/100 mL)
HBAC (CE/100 mL)
001 0 0 1,745 ND
002 0 520 1,427 ND
003 0 16 2,829 ND
004 0.5 160 11,701 ND
005 0 130 N/A N/A
006 0 15 N/A N/A
007 0.6 9 13,377 ND
008 1.8 210 23,869 ND
009 0 0 3,615 ND
010 0.3 36 5,944 ND
011 2.1 1 12,752 ND
012 0 2,400 4,309 ND
013 0 4 1,644 ND
014 0.6 21 16,616 ND
015 – – N/A N/A
016 – – 22,021 ND
017 1.2 520 6,553 ND
018 0 27 6,500 ND
Notes: mg/L = milligrams per liter; org/100 mL = organisms per 100 milliliters; CE/100 mL = cell equivalents per 100 milliliters; ND = not detectable; N/A = not available
3.3.1. 2014 Sampling
Nitrate Concentrations of nitrate were extremely low at the majority of sites sampled (see Table 6). Nitrate concentrations were elevated above background at sampling site 008 (1.8 mg/L), sampling site 011 (2.1

Septic Development in Summit County: An Evaluation of the Past in the Face of Future Development
18
mg/L), and sampling site 017 (1.2 mg/L). These findings could indicate septic contamination, given that conventional septic systems do not treat for nitrate.
E. coli Concentrations of E. coli were generally low, although they were found to be in exceedance of the Utah Division of Water Quality (UDWQ) standard of 126 org/100mL at six of the 16 sites sampled (see Table 6).
Microbial Source Tracking Results of the MST analyses indicate significant fecal bacterial contamination at all of the sites sampled. Total GenBAC ranged from 423 cell equivalents (CE)/100 mL at sampling site 006 to 23,869 CE/100 mL at sampling site 008. Although there is no water quality standard to compare these concentrations to, cell counts in the thousands to tens of thousands appear to be significant. While initial results indicated HBAC at sampling sites 005 and 006 and the presence of the bovine marker at sampling site 005, these results were later found to be confounded by PCT inhibition (see Appendix A). In the end, no successful detections of HBAC or the bovine-specific market were found.
Discussion These preliminary results indicate that fecal contamination from mammals exists in many of the surface water samples from the Snyderville Basin. However, fecal contamination of human origin was not present at the time of sampling. The presence of fecal bacteria combined with elevated nitrate concentrations at sampling sites in Highland Estates (008), Hidden Cove (011), and Timberline (017) subdivisions indicated possible septic contamination. Given that these samples represent a single location at a single point in time, additional sampling was recommended to further investigate the situation.
3.3.2. 2016 Sampling
Nitrate During both spring and summer sampling events, nitrate concentrations at the various sites ranged from near the detection limit at multiple sites in both basins to elevated concentrations around 3 mg/L at certain Snyderville Basin sites. Nitrate samples did not provide evidence of contamination at eastern Summit County sites, as concentrations at all sites were below 0.5 mg/L (Table 7; Figure 6). Conversely, results from Snyderville Basin samples indicated contamination at numerous sites with average concentrations of 1.7 mg/L (spring) and 0.9 mg/L (summer). During the spring sampling event, sampling sites SN-08 (2.72 mg/L), SN-09 (3.51 mg/L), SN-11 (2.74 mg/L), SN-12 (2.95 mg/L), and SN-17 (1.42 mg/L) were all above the background concentration of 1 mg/L. During the summer sampling event, nitrate concentrations at sampling sites SN-09 (2.65 mg/L), SN-13 (1.56 mg/L), and SN-17 (1.06 mg/L) were all elevated. Sampling sites SN-08 and SN-12, which had elevated nitrate concentrations during the spring sampling event, did not have enough water for sampling.
Septic Development in Summit County: An Evaluation of the Past in the Face of Future Development
19
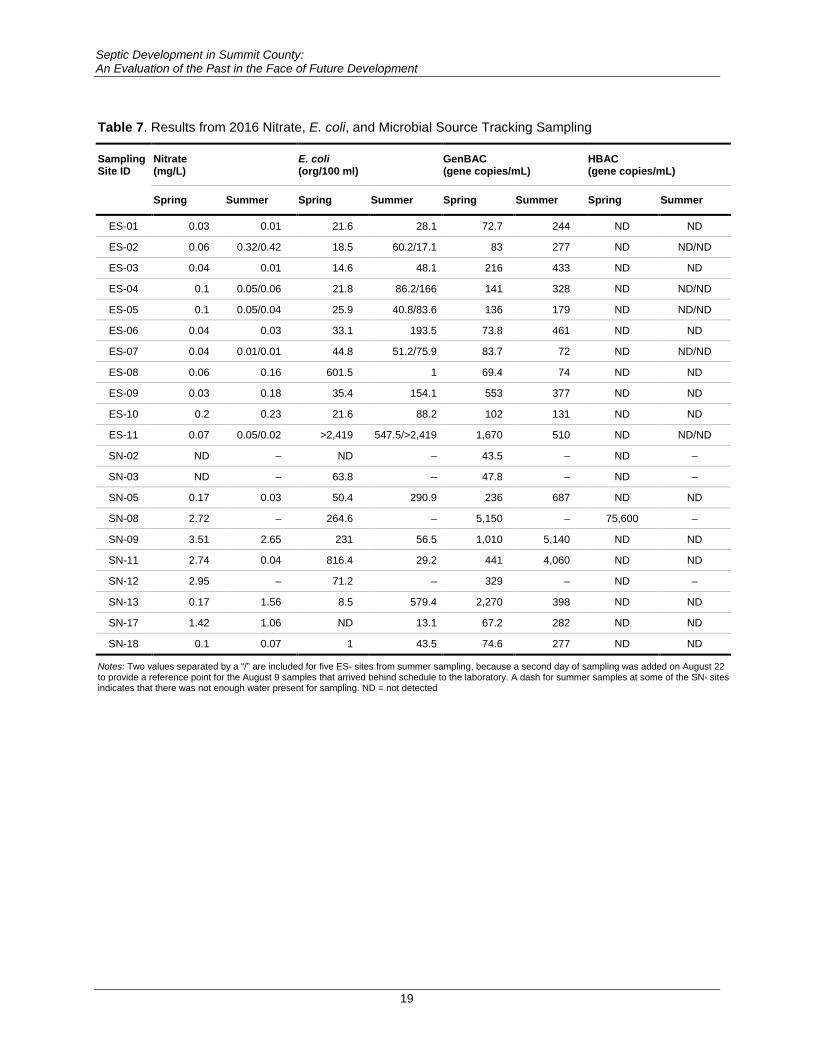
Table 7. Results from 2016 Nitrate, E. coli, and Microbial Source Tracking Sampling
Sampling Site ID
Nitrate (mg/L)
E. coli (org/100 ml)
GenBAC (gene copies/mL)
HBAC (gene copies/mL)
Spring Summer Spring Summer Spring Summer Spring Summer
ES-01 0.03 0.01 21.6 28.1 72.7 244 ND ND
ES-02 0.06 0.32/0.42 18.5 60.2/17.1 83 277 ND ND/ND
ES-03 0.04 0.01 14.6 48.1 216 433 ND ND
ES-04 0.1 0.05/0.06 21.8 86.2/166 141 328 ND ND/ND
ES-05 0.1 0.05/0.04 25.9 40.8/83.6 136 179 ND ND/ND
ES-06 0.04 0.03 33.1 193.5 73.8 461 ND ND
ES-07 0.04 0.01/0.01 44.8 51.2/75.9 83.7 72 ND ND/ND
ES-08 0.06 0.16 601.5 1 69.4 74 ND ND
ES-09 0.03 0.18 35.4 154.1 553 377 ND ND
ES-10 0.2 0.23 21.6 88.2 102 131 ND ND
ES-11 0.07 0.05/0.02 >2,419 547.5/>2,419 1,670 510 ND ND/ND
SN-02 ND – ND – 43.5 – ND –
SN-03 ND – 63.8 – 47.8 – ND –
SN-05 0.17 0.03 50.4 290.9 236 687 ND ND
SN-08 2.72 – 264.6 – 5,150 – 75,600 –
SN-09 3.51 2.65 231 56.5 1,010 5,140 ND ND
SN-11 2.74 0.04 816.4 29.2 441 4,060 ND ND
SN-12 2.95 – 71.2 – 329 – ND –
SN-13 0.17 1.56 8.5 579.4 2,270 398 ND ND
SN-17 1.42 1.06 ND 13.1 67.2 282 ND ND
SN-18 0.1 0.07 1 43.5 74.6 277 ND ND
Notes: Two values separated by a “/” are included for five ES- sites from summer sampling, because a second day of sampling was added on August 22 to provide a reference point for the August 9 samples that arrived behind schedule to the laboratory. A dash for summer samples at some of the SN- sites indicates that there was not enough water present for sampling. ND = not detected

Septic Development in Summit County: An Evaluation of the Past in the Face of Future Development
20
Figure 6. Concentrations of nitrate in samples from spring and summer sampling events in Summit County. The red horizontal line at 1 mg/L represents the estimated upper limit of background concentrations for streams draining forested landscapes. Data are shown for only those sites that were sampled during both spring and summer sampling events.
E. coli Elevated E. coli concentrations were documented in both the Snyderville Basin and eastern Summit County during the spring and summer sampling events (see Table 7; Figure 7). Several sampling sites were found to have highly elevated E. coli concentrations well beyond the UDWQ standard: ES-08 (601 org/100 mL in spring), ES-11 (>2,419 org/100 mL in both spring and summer), SN-11 (816 org/100 mL in spring), and SN-13 (579 org/100 mL in summer). Elevated concentrations at a given site were not consistently measured during both spring and summer sampling events.
Septic Development in Summit County: An Evaluation of the Past in the Face of Future Development
21
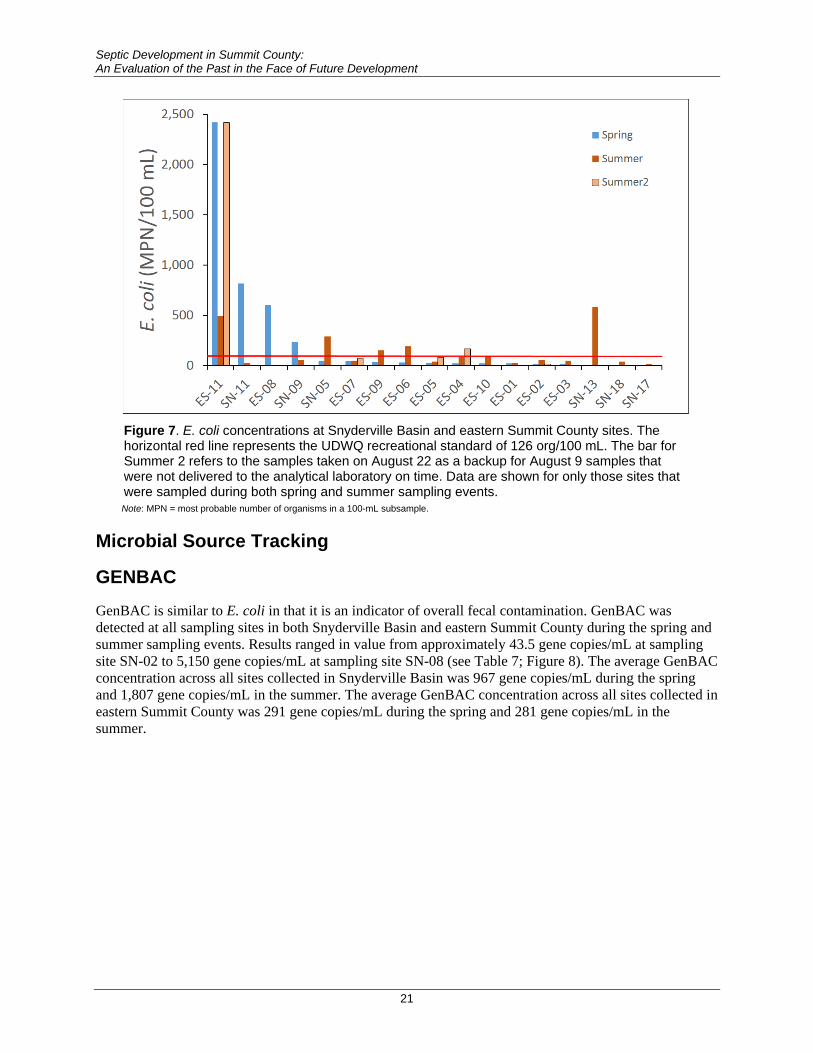
Figure 7. E. coli concentrations at Snyderville Basin and eastern Summit County sites. The horizontal red line represents the UDWQ recreational standard of 126 org/100 mL. The bar for Summer 2 refers to the samples taken on August 22 as a backup for August 9 samples that were not delivered to the analytical laboratory on time. Data are shown for only those sites that were sampled during both spring and summer sampling events. Note: MPN = most probable number of organisms in a 100-mL subsample.
Microbial Source Tracking
GENBAC GenBAC is similar to E. coli in that it is an indicator of overall fecal contamination. GenBAC was detected at all sampling sites in both Snyderville Basin and eastern Summit County during the spring and summer sampling events. Results ranged in value from approximately 43.5 gene copies/mL at sampling site SN-02 to 5,150 gene copies/mL at sampling site SN-08 (see Table 7; Figure 8). The average GenBAC concentration across all sites collected in Snyderville Basin was 967 gene copies/mL during the spring and 1,807 gene copies/mL in the summer. The average GenBAC concentration across all sites collected in eastern Summit County was 291 gene copies/mL during the spring and 281 gene copies/mL in the summer.

Septic Development in Summit County: An Evaluation of the Past in the Face of Future Development
22
Figure 8. GenBAC concentrations at sampling sites in eastern Summit County and Snyderville Basin for spring and summer sampling events. Data are shown for only those sites that were sampled during both spring and summer sampling events.
HBAC The analysis of water samples for HBAC did not result in any positive findings for any sampling sites except for SN-08 during the spring sampling. The ability to detect HBAC in these water samples was limited by the detection and reporting limits of the laboratory method.
3.4. Discussion Higher nitrate concentrations in Snyderville Basin as compared to those in eastern Summit County are not entirely surprising when considering the different land uses of the respective areas. High nitrate concentrations in surface waters indicate a more developed landscape in which a variety of sources may to contribute nitrate to surface waters (e.g., septic systems and lawn fertilizer). Furthermore, many of the waters sampled in Snyderville Basin had very low flow compared to the larger ditches, creeks, and streams in eastern Summit County, which likely dilute the concentration of nitrate inputs. While nitrate concentrations alone may not be sufficient to confirm septic contamination, when nitrate concentrations are coupled with other parameters such as E. coli concentrations and spatial data, the evidence becomes stronger. For this reason, our approach to the analysis included a series of parameters (nitrate, E. coli, and MST) to provide as much information as possible. For example, we may suspect that sampling sites that are high in both nitrate and E. coli (SN-08 during spring sampling) are receiving input from failed septic systems. However, sampling sites like SN-09 were found to have elevated nitrate concentrations but fairly low E. coli concentrations. MST data can help to strengthen the case by providing additional evidence.
At least four of the Snyderville Basin sites sampled in this analysis (SN-08, SN-09, SN-11, and SN-13) appear to have a high likelihood of contamination from septic failure. Sampling sites SN-8 and SN-11 were suspected of showing signs of septic contamination following the 2014 water sampling. SN-08 is a marshy wetland on the downstream end of a group of houses in the Highland Estates subdivision (Figure 9). This is the only site to have a positive detection of human-specific fecal bacteria, which were found in
Septic Development in Summit County: An Evaluation of the Past in the Face of Future Development
23
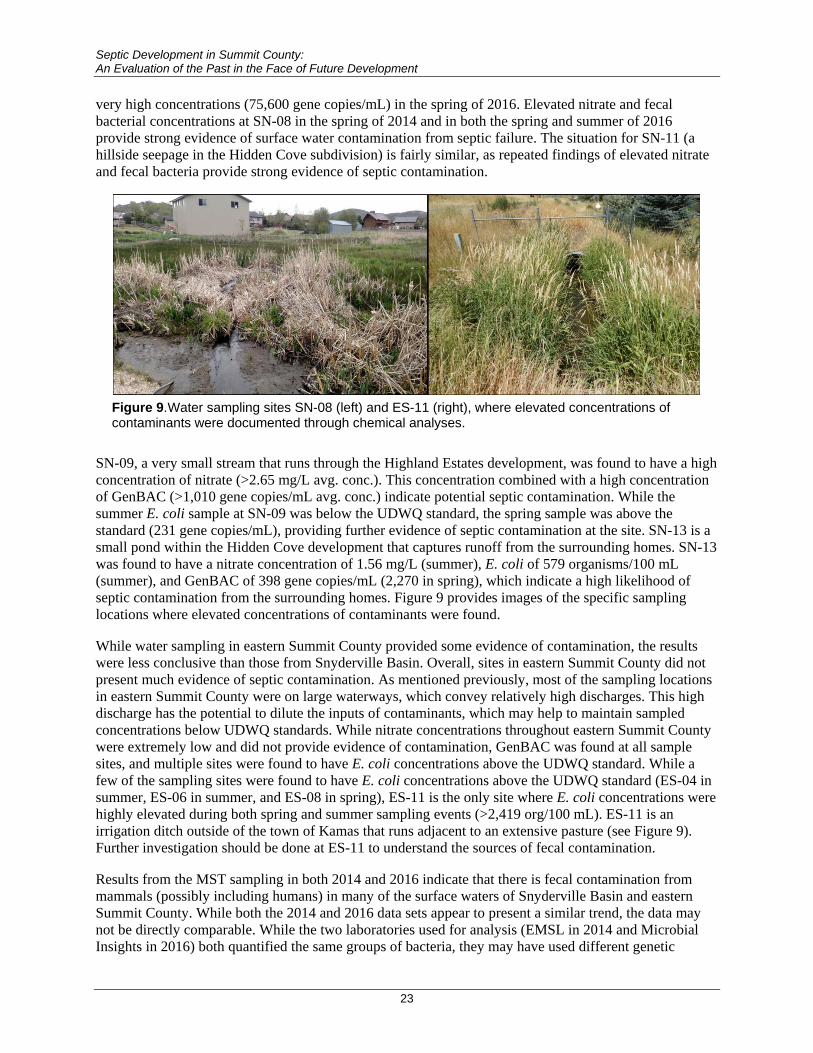
very high concentrations (75,600 gene copies/mL) in the spring of 2016. Elevated nitrate and fecal bacterial concentrations at SN-08 in the spring of 2014 and in both the spring and summer of 2016 provide strong evidence of surface water contamination from septic failure. The situation for SN-11 (a hillside seepage in the Hidden Cove subdivision) is fairly similar, as repeated findings of elevated nitrate and fecal bacteria provide strong evidence of septic contamination.
Figure 9. Water sampling sites SN-08 (left) and ES-11 (right), where elevated concentrations of contaminants were documented through chemical analyses.
SN-09, a very small stream that runs through the Highland Estates development, was found to have a high concentration of nitrate (>2.65 mg/L avg. conc.). This concentration combined with a high concentration of GenBAC (>1,010 gene copies/mL avg. conc.) indicate potential septic contamination. While the summer E. coli sample at SN-09 was below the UDWQ standard, the spring sample was above the standard (231 gene copies/mL), providing further evidence of septic contamination at the site. SN-13 is a small pond within the Hidden Cove development that captures runoff from the surrounding homes. SN-13 was found to have a nitrate concentration of 1.56 mg/L (summer), E. coli of 579 organisms/100 mL (summer), and GenBAC of 398 gene copies/mL (2,270 in spring), which indicate a high likelihood of septic contamination from the surrounding homes. Figure 9 provides images of the specific sampling locations where elevated concentrations of contaminants were found.
While water sampling in eastern Summit County provided some evidence of contamination, the results were less conclusive than those from Snyderville Basin. Overall, sites in eastern Summit County did not present much evidence of septic contamination. As mentioned previously, most of the sampling locations in eastern Summit County were on large waterways, which convey relatively high discharges. This high discharge has the potential to dilute the inputs of contaminants, which may help to maintain sampled concentrations below UDWQ standards. While nitrate concentrations throughout eastern Summit County were extremely low and did not provide evidence of contamination, GenBAC was found at all sample sites, and multiple sites were found to have E. coli concentrations above the UDWQ standard. While a few of the sampling sites were found to have E. coli concentrations above the UDWQ standard (ES-04 in summer, ES-06 in summer, and ES-08 in spring), ES-11 is the only site where E. coli concentrations were highly elevated during both spring and summer sampling events (>2,419 org/100 mL). ES-11 is an irrigation ditch outside of the town of Kamas that runs adjacent to an extensive pasture (see Figure 9). Further investigation should be done at ES-11 to understand the sources of fecal contamination.
Results from the MST sampling in both 2014 and 2016 indicate that there is fecal contamination from mammals (possibly including humans) in many of the surface waters of Snyderville Basin and eastern Summit County. While both the 2014 and 2016 data sets appear to present a similar trend, the data may not be directly comparable. While the two laboratories used for analysis (EMSL in 2014 and Microbial Insights in 2016) both quantified the same groups of bacteria, they may have used different genetic

Septic Development in Summit County: An Evaluation of the Past in the Face of Future Development
24
markers in the qPCR analysis. Further, they also used different reporting units to quantify the results. Strong consideration should be given to the fact that these samples represent a single site at a single point in time, and spatiotemporal variability has proven to be great for the Bacteroides indicator (Bower et al. 2005; Nnane et al. 2011). Our sampling efforts identified fecal contamination at all sites, but we were unable to detect human-sourced fecal contamination, except at sampling site SN-08 during the spring. Given that human source markers can be transient, in their absence it is important to consider other lines of evidence such as nitrate, E. coli, and GenBAC, in addition to the results of spatial analyses.
In general, the water sampling conducted for this study supported the findings of the priority analysis. Specific sites within the high priority subdivisions of Snyderville Basin were found to have water quality issues indicative of contamination from septic failure. Sampling all sites in both spring and summer (2016) did not result in any broad conclusions regarding the mechanisms of contamination. While concentrations of nitrate were higher at many sites during the spring and concentrations of E. coli were higher during the summer, there were numerous exceptions to this rule. Contaminants appear to be delivered via surface (and subsurface) flushing during spring runoff and possibly via point-source illicit discharge during the baseflow period. This multi-parameter analysis of water quality was successful in demonstrating septic failure in Snyderville Basin and in establishing baseline conditions in eastern Summit County.
4. EASTERN SUMMIT COUNTY: SPATIAL ANALYSIS
4.1. Purpose Utilizing spatial analysis techniques and geographic information system (GIS) data, we aimed to evaluate the suitability of areas in eastern Summit County for conventional septic development based on state of Utah regulations and from the priority analysis and observations in Snyderville Basin.
4.2. Methodology Criteria for conventional septic development in Summit County were developed based on the Onsite Wastewater Systems rule at Utah Administrative Code R317-4, as well as other resources such as the U.S. Department of Agriculture Web Soil Survey. Utah Administrative Code R317-4e establishes specific soil conditions of sites suitable for septic development and establishes distances between components of the septic system and surrounding surface and groundwater.
By understanding of the key regulators of septic suitability from the Utah Administrative Code and the SCHD Septic Program, SWCA gathered available GIS data for the relevant parameters for Summit County (see Table 8). SWCA imported GIS data sets into ArcGIS and generated maps of Summit County depicting each parameter. To divide eastern Summit County into areas that are most suitable, less suitable, least suitable, and unsuitable for conventional septic development, a septic suitability model was developed encompassing the criteria found in Table 8. As shown in the table, each of the four parameters with multiple value classes (slope, depth to restrictive layer, depth to water table, and hydraulic conductivity) was given a series of rankings (1, 2, or 3) for each of its value classes. Using the Weighted Sum Analyst Tool in ArcGIS and giving each parameter equal weight, the ranks of all four parameters were summed for each point on the map, and the septic suitability classifications were based on the sum of the ranks. For example, if a given location had a slope of 10% (score of 1), 150 centimeters to restrictive layer (score of 2), 300 centimeters to the water table (score of 3), and hydraulic conductivity >20 (score of 1), the total suitability score would be 1 + 2 + 3 + 1 = 7. The weighted sum output was combined with the unsuitable areas map (Figure 10), which comprised the four parameters that did not

Septic Development in Summit County: An Evaluation of the Past in the Face of Future Development
25
have multiple value classes (slope > 35%, Zone 1 protected groundwater, surface water buffer, flood-irrigated lands, and Federal Emergency Management Agency [FEMA] floodplain areas), to generate the septic suitability model. The final output of the septic suitability model was a map with shading depicting the various levels of septic suitability (Figure 11).
Table 8. Parameters Selected for Use in the Septic Suitability Analysis in Eastern Summit County
Parameter Unit Value Classes Rank Source
Binary Parameters Used in the Analysis
Slope % >35 Restricted area
Utah State regulations
Zone 1 protected groundwater areas (100-foot radius)
Feet N/A Restricted area
Utah State regulations
Surface waters (100-foot buffer)
Feet N/A Restricted area
Utah State regulations
FEMA floodplain (Zones A, AE, AO)
Narrative N/A Restricted area
FEMA
Multiple Value Parameters Not Used in the Analysis
Slope % 0–15, 16–25, 26–35 1, 2, 3 Utah State regulations and NRCS for class values
Depth to restrictive layer cm 0–100, 101–200, >200
3, 2, 1 Web Soil Survey (U.S. Department of Agriculture)
Depth to water table cm 0–100, 101–200, >200
3, 2, 1 Web Soil Survey (U.S. Department of Agriculture)
Hydraulic conductivity Micrometers/second 0–20, >20 3 or 1 Web Soil Survey (U.S. Department of Agriculture)

Septic Development in Summit County: An Evaluation of the Past in the Face of Future Development
26
This page intentionally blank

Septic Development in Summit County: An Evaluation of the Past in the Face of Future Development
27
Figure 10. Portions of the study area deemed unsuitable for septic development due to proximity to protected waters, floodplains, or slopes steeper than 35%. The protected water classification includes areas within 100 feet of surface water or Zone 1 groundwater protection areas, flood-irrigated lands, in addition to FEMA floodplain areas.

Septic Development in Summit County: An Evaluation of the Past in the Face of Future Development
28
This page intentionally blank

Septic Development in Summit County: An Evaluation of the Past in the Face of Future Development
29
Figure 11. Septic suitability model based on criteria in the Utah Administrative Code Rule R317-4 for Onsite Wastewater Systems and the U.S. Department of Agriculture Web Soil Survey.

Septic Development in Summit County: An Evaluation of the Past in the Face of Future Development
30
This page intentionally blank
Septic Development in Summit County: An Evaluation of the Past in the Face of Future Development
31
4.3. Results The septic suitability model depicts the varying suitability of areas in eastern Summit County for conventional septic development. However, it is important to refer back to the criteria of the model when interpreting the results. The results of the septic suitability model indicate that under the guidelines of the Utah Administrative Code for Onsite Wastewater Systems, there are no areas that are ideally suitable for septic development in eastern Summit County. As shown in Figure 10 above, a large portion of the county is either too steep for septic development or sits too close to waterways, floodplains, or flood irrigation zones. As shown in Figure 11, areas deemed “most suitable” for septic development in the model scored between 5 and 7, the “less suitable” areas were portions of the county that scored 8 or 9, and the “least suitable” areas (not including the protected water areas and areas with slopes >35%) received a score of 10 or 11 based on the criteria defined in Table 5.
4.3.1. Model Verification The septic suitability model aims to predict the theoretical suitability of sites in Summit County for conventional septic development. With actual data from failed septic systems in western Summit County, we had the opportunity to verify the model and check to see how the locations of the septic failures would have been ranked by the septic suitability model. We added the subdivisions that were previously identified as high priority for septic upgrades or sewering during the 2014 prioritization analysis (Figure 12). However, the exact locations of individual failed septic systems were not geospatially marked on the map.
In applying the septic suitability model to existing housing subdivisions, we were able to make some important conclusions about the model. While there are known and suspected septic failures in the Hidden Cove, Timberline, and Highland Estates subdivisions, the majority of the area within the subdivision was classified as either “most suitable” or “less suitable” within the septic suitability model. This exercise provides further evidence that areas classified as “most suitable” in the model may not actually represent ideal conditions for conventional septic development. Upon closer examination, slopes in the Hidden Cove subdivision are between 16% and 35%, and slopes in the Timberline subdivision are between 26% and 35%. While the model classifies these slopes as “most suitable” to “less suitable,” septic failures indicate that these slopes may be too great for conventional septic systems. Additionally, the depth to the restrictive layer in these areas may not be sufficient to support conventional septic systems, and the hydraulic conductivity of the soils may not be great enough. Finally, septic age and the density of septic development may be the most important variables of all. Septic systems are built with a finite expected lifetime, and housing plots are often required to have enough space for a second septic system that would replace the original system after it is no longer reliable.

Septic Development in Summit County: An Evaluation of the Past in the Face of Future Development
32
This page intentionally blank
Septic Development in Summit County: An Evaluation of the Past in the Face of Future Development
33
Figure 12. The septic suitability model applied to Snyderville Basin and subdivisions of concern including Hidden Cove, Timberline, Highland Estates, and Silver Creek Estates.

Septic Development in Summit County: An Evaluation of the Past in the Face of Future Development
34
This page intentionally left blank
Septic Development in Summit County: An Evaluation of the Past in the Face of Future Development
35
4.4. Discussion As plans for future growth in eastern Summit County evolve, the septic suitability model will serve as an effective tool for identifying suitable and unsuitable areas for septic development. The simplicity of the model may allow managers and stakeholders to evaluate the suitability of specific areas on a case-by-case basis and based on the different classes of parameters (protected water areas, slopes >35%, and soil characteristics) in the model.
The model identifies extensive areas as suitable for conventional septic development. However, as discussed in the Model Verification section, sites should be evaluated independently because the “most suitable” classification does not necessarily represent the ideal conditions for conventional septic development. The range of weighted sum values for the “most suitable” value class was 5–7, and therefore the individual score for more than one of the soil characteristic parameters was >1. Upon closer examination, the available data for soil hydraulic conductivity are very coarse, and most of eastern Summit County scored a 3 for hydraulic conductivity 0–20 µm/sec. Furthermore, the regulations and recommendations informing the model resulted in only two potential values for hydraulic conductivity: 1 (>20 µm/sec) or 3 (0–20 µm/sec). Therefore, individual sites may be more or less suitable than the model prediction based on actual percolation tests and the suitability indicated by the other parameters. The SCHD requires percolation tests at each potential septic installation, and therefore this information would be available to help determine whether the site is suitable for a conventional septic system or whether an upgraded system may be required. The septic suitability model provides ample information regarding the suitability of different areas for conventional septic development, and the individual parameter components of the model may be evaluated independently on a case-by-case basis. While it may not be a flawless solution to the challenge of planning for future growth, it will likely serve as a valuable tool to managers and stakeholders alike.
5. SUMMARY AND FUTURE DIRECTION As Summit County plans for future development, an understanding of past septic failures and the suitability of potential building sites for conventional septic development will help managers avoid future septic contamination issues. The 2014 prioritization analysis identified the subdivisions in Snyderville Basin that should be the highest priority for septic upgrades or sewering, given the threat they pose to the environment. Furthermore, the prioritization analysis identified areas to be included in water sampling efforts aimed at characterizing the influence of septic contamination on surface waters. The water sampling demonstrated the specific influence of septic contamination on surface waters in Snyderville Basin and the existing conditions in eastern Summit County. While eastern Summit County does not have the known septic contamination issues that Snyderville Basin has, the results from water sampling indicate existing water quality concerns (fecal contamination) that heighten the risk of water quality degradation due to potential future septic failure. The septic suitability model depicts the theoretical suitability of areas within Summit County for septic development. The simple and visual nature of the model will make it a valuable tool for managers and stakeholders moving forward, as they plan the future growth of Summit County.
This report serves as a valuable resource in managing the existing development and in evaluating and managing future development in Summit County. While the report describes observations and conclusions regarding existing septic failures and the suitability of areas for future septic development, it also sets a foundation for evaluating future change. The water quality data will serve as a reference when Summit County’s next round of sampling and analysis takes place, therefore allowing for the detection of changing conditions.

Septic Development in Summit County: An Evaluation of the Past in the Face of Future Development
36
6. LITERATURE CITED Bower, P.A., C.O. Scopel, E.T. Jensen, M.M. Depas, and S.L. McLellan. 2005. Detection of genetic
markers of fecal indicator bacteria in Lake Michigan and determination of their relationship to Escherichia coli densities using standard microbial methods. Applied and Environmental Microbiology 71:8305–8313.
Griffin, D.W., E.K., Lipp, M.R., McLaughlin and J.B. Rose. 2001. Marine recreation and public health microbiology: quest for the ideal indicator. BioScience 51(10):817–825. Available at: http://bioscience.oxfordjournals.org/content/51/10/817.full. Accessed on November 30, 2016.
Harwood, V.J., C. Staley, B.D. Badgley, K. Borges, and A. Korajkic. 2013. Microbial source tracking markers for detection of fecal contamination in environmental waters: relationship between pathogens and human health outcomes. FEMS Microbiology Reviews 38(10):1–40. Available at: http://femsre.oxfordjournals.org/content/38/1/1.long. Accessed on November 30, 2016.
Nnane, D.E., J.E. Ebdon, and H.D. Taylor. 2011. Integrated analysis of water quality parameters for cost-effective fecal pollution management in river catchments. Water Resources 45:2235–2246.
Summit County Health Department (SCHD). 2016. How a Septic System Works, Septic Program. Available at: http://www.summitcountyhealth.org/property-owners/septic-program/ Accessed November 8, 2016.
SWCA Environmental Consultants (SWCA). 2013. Rockport Reservoir and Echo Reservoir Total Maximum Daily Loads, Public Draft Report. Prepared for the Utah Division of Water Quality 2013. Available at: http://www.deq.utah.gov/locations/R/rockportechores/docs/2013/11Nov/RockportEchoReservoirReport_Public%20Draft_FINAL_noappendix.pdf. Accessed November 2, 2016.
Tetra Tech Inc. 2011. Using Microbial Source Tracking to Support TMDL Development and Implementation. Available at: www.epa.gov/region10/pdf/tmdl/mst_for_tmdls_guide_04_22_11.pdf. Accessed June 8, 2016.
U.S. Environmental Protection Agency (EPA). 2010. Method B: Bacteroides in Water by TaqMan Quantitative Polymerase Chain Reaction Assay. Available at: http://water.epa.gov/scitech/methods/cwa/bioindicators/upload/methodb2010.pdf. Accessed June 8, 2016.
Weather Underground. 2016. Weather History for Heber City, Utah. The Weather Company, LLC. Available at: https://www.wunderground.com/. Accessed November 21, 2016.

Appendix A
July 2014 letter report: Results and Findings from the Microbial Source Tracking Sampling Conducted in Summit County, Utah
2014 Snyderville Water Sampling Report

1
July 16, 2014
Richard Bullough Summit County Health Department 650 Round Valley Drive Park City, Utah 84060
RE: Results and findings from the microbial source tracking sampling conducted in Summit County, Utah
Dear Rich,
Presented below are the results of the microbial source tracking (MST) sampling event conducted in Summit County, Utah, on June 3, 2014, and a resampling event that occurred on July 9, 2014. All relevant methodology and sampling details are included in this report as well as data description and interpretation. Additional data such as site photos, lab reports, and references can be provided upon request.
PURPOSE AND GENERAL APPROACH The Rockport Reservoir and Echo Reservoir Total Maximum Daily Loads Implementation Plan (SWCA 2014) identified septic systems as contributing approximately 2%–15% of nutrients to surface waters. As a result, a septic assessment was conducted that prioritized subdivisions for implementation of best management practices (BMPs) through sewering or septic upgrades. The analysis relied on three prioritization criteria (septic age, proximity to stream, and landscape position with respect to irrigation), and identified over 100 septic systems as “very high priority” and several subdivisions as “critical.” The Summit County Health Department (SCHD) was a key partner in this total maximum daily load (TMDL) process, and has taken on the task of furthering the prioritization analysis to support implementation of alternative wastewater systems (upgraded septics, sewering, cluster systems, etc.) throughout Summit County. This more in-depth assessment will use additional criteria gathered from various stakeholder groups to further delineate those regions in need of alternative wastewater systems. Additionally, the contribution of septics to surface waters will be explored through sampling and analysis using microbial source tracking. The following questions provide the basis for this study:
• What is the relative contribution of septic systems to Escherichia coli (E. coli) loading in various streams in Summit County?
• Which subdivisions in Summit County are optimal for sewering or septic upgrades?
• What regions of Summit County should be excluded for conventional septic system permitting?
Microbial Source Tracking in Summit County, Utah: Results and Findings
2
The first step in the septic priority assessment was to conduct microbial source tracking for several surface water sites in subdivisions identified by the SCHD as potentially contributing to surface water pollution through septic leakage. Microbial source tracking has proven effective for better understanding the relative contribution of fecal sources to surface waters, and it provides an additional level of detail that standard E. coli enumerations do not. What follows is a report on the methodology, results, and findings from the MST analysis.
METHODOLOGY On Tuesday, June 3, 2014, Lucy Parham of SWCA Environmental Consultants (SWCA) and Nathan Brooks of the SCHD sampled 18 surface water sites in Summit County (Figure 1). Several of the sites were located in subdivisions identified as areas of potential septic leakage to surface waters that included Silver Creek, Highland Estates, Timberline, Moose Hollow, and Hidden Cove. Additionally, headwater streams and samples from the mainstem of East Canyon Creek were included to provide reference data and indication of septic contamination in East Canyon Creek. Sites within each subdivision were selected based on local knowledge of potential septic-influenced surface waters, and included roadside drainages, wet meadows, streams, East Canyon Creek and its associated tributaries, hillside seeps, and effluent from a failing septic tank (Table 1). Weather conditions at the time of sampling were mostly sunny with clear skies and an average temperature of 66.9°F (Weather Underground 2014).

Microbial Source Tracking in Summit County, Utah: Results and Findings
3
Figure 1. Location of sampling sites within the greater East Canyon Creek watershed.
Microbial Source Tracking in Summit County, Utah: Results and Findings
4
Table 1. Sampling Site Descriptions and Locations in Summit County, Utah
Sample ID Location Site Description
001 Silver Creek Estates Roadside drainage
002 Silver Creek Estates Wet meadow
003 Silver Creek Estates Stream
004 East Canyon Creek East Canyon Creek before the confluence with Kimball Creek
005 East Canyon Creek East Canyon Creek after the confluence with Kimball Creek
006 Headwaters Reference stream
007 Kimball Creek Tributary to Kimball Creek
008 Highland Estates Roadside drainage
009 Highland Estates Roadside drainage
010 East Canyon Creek Main stem of East Canyon Creek just downstream of the golf course
011 Hidden Cove Hillside seepage
012 Hidden Cove Hillside seepage
013 Hidden Cove Pond
014 Moose Hollow Hillside seepage
015 Moose Hollow Septic effluent
016 Moose Hollow Roadside drainage
017 Timberline Stream
018 Timberline Stream
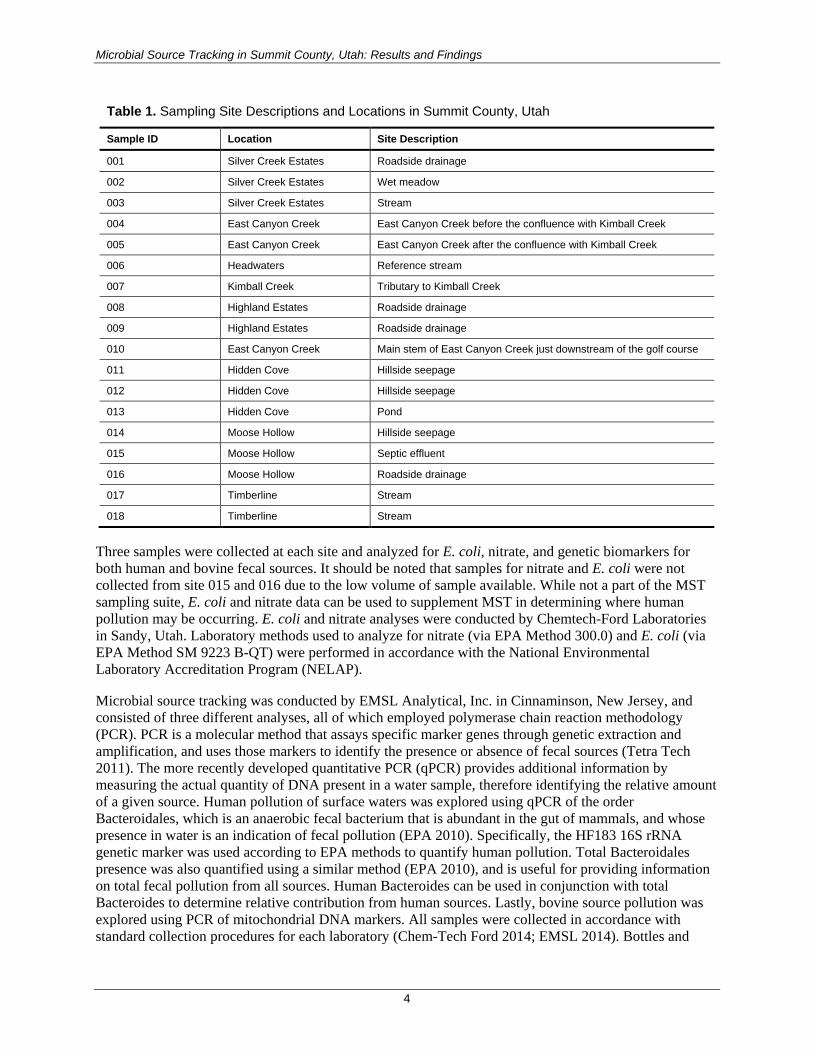
Three samples were collected at each site and analyzed for E. coli, nitrate, and genetic biomarkers for both human and bovine fecal sources. It should be noted that samples for nitrate and E. coli were not collected from site 015 and 016 due to the low volume of sample available. While not a part of the MST sampling suite, E. coli and nitrate data can be used to supplement MST in determining where human pollution may be occurring. E. coli and nitrate analyses were conducted by Chemtech-Ford Laboratories in Sandy, Utah. Laboratory methods used to analyze for nitrate (via EPA Method 300.0) and E. coli (via EPA Method SM 9223 B-QT) were performed in accordance with the National Environmental Laboratory Accreditation Program (NELAP).
Microbial source tracking was conducted by EMSL Analytical, Inc. in Cinnaminson, New Jersey, and consisted of three different analyses, all of which employed polymerase chain reaction methodology (PCR). PCR is a molecular method that assays specific marker genes through genetic extraction and amplification, and uses those markers to identify the presence or absence of fecal sources (Tetra Tech 2011). The more recently developed quantitative PCR (qPCR) provides additional information by measuring the actual quantity of DNA present in a water sample, therefore identifying the relative amount of a given source. Human pollution of surface waters was explored using qPCR of the order Bacteroidales, which is an anaerobic fecal bacterium that is abundant in the gut of mammals, and whose presence in water is an indication of fecal pollution (EPA 2010). Specifically, the HF183 16S rRNA genetic marker was used according to EPA methods to quantify human pollution. Total Bacteroidales presence was also quantified using a similar method (EPA 2010), and is useful for providing information on total fecal pollution from all sources. Human Bacteroides can be used in conjunction with total Bacteroides to determine relative contribution from human sources. Lastly, bovine source pollution was explored using PCR of mitochondrial DNA markers. All samples were collected in accordance with standard collection procedures for each laboratory (Chem-Tech Ford 2014; EMSL 2014). Bottles and
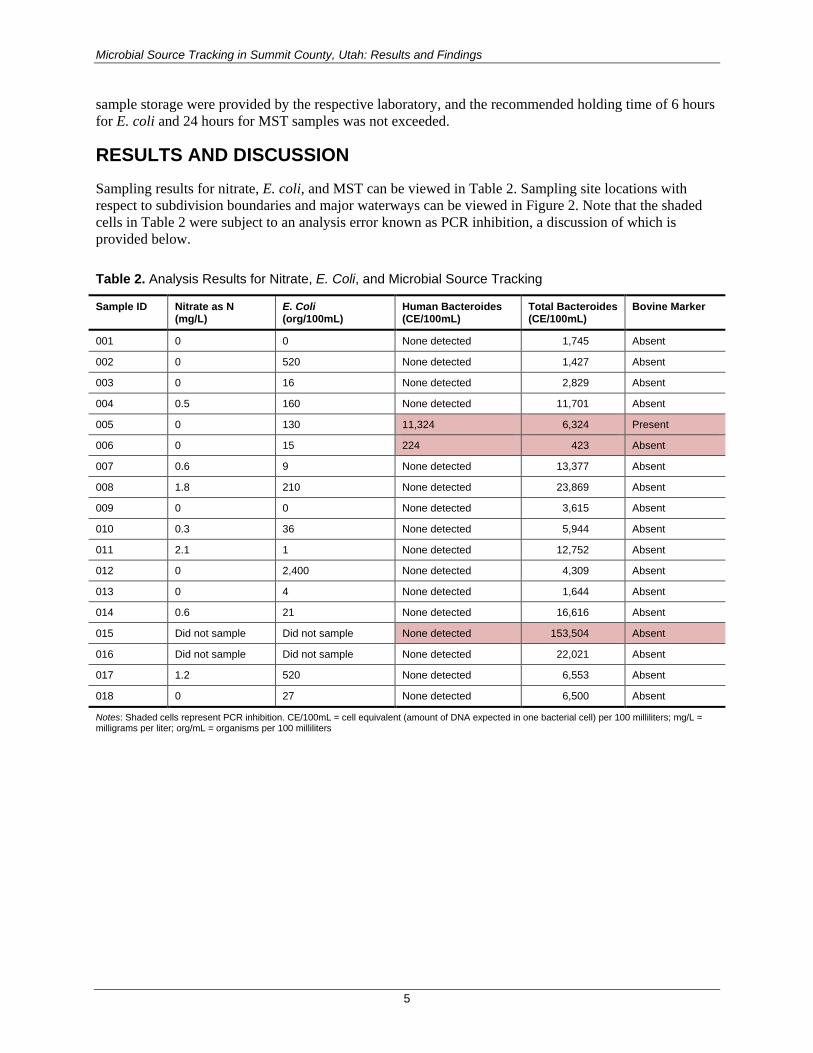
Microbial Source Tracking in Summit County, Utah: Results and Findings
5
sample storage were provided by the respective laboratory, and the recommended holding time of 6 hours for E. coli and 24 hours for MST samples was not exceeded.
RESULTS AND DISCUSSION Sampling results for nitrate, E. coli, and MST can be viewed in Table 2. Sampling site locations with respect to subdivision boundaries and major waterways can be viewed in Figure 2. Note that the shaded cells in Table 2 were subject to an analysis error known as PCR inhibition, a discussion of which is provided below.
Table 2. Analysis Results for Nitrate, E. Coli, and Microbial Source Tracking
Sample ID Nitrate as N (mg/L)
E. Coli (org/100mL)
Human Bacteroides (CE/100mL)
Total Bacteroides (CE/100mL)
Bovine Marker
001 0 0 None detected 1,745 Absent
002 0 520 None detected 1,427 Absent
003 0 16 None detected 2,829 Absent
004 0.5 160 None detected 11,701 Absent
005 0 130 11,324 6,324 Present
006 0 15 224 423 Absent
007 0.6 9 None detected 13,377 Absent
008 1.8 210 None detected 23,869 Absent
009 0 0 None detected 3,615 Absent
010 0.3 36 None detected 5,944 Absent
011 2.1 1 None detected 12,752 Absent
012 0 2,400 None detected 4,309 Absent
013 0 4 None detected 1,644 Absent
014 0.6 21 None detected 16,616 Absent
015 Did not sample Did not sample None detected 153,504 Absent
016 Did not sample Did not sample None detected 22,021 Absent
017 1.2 520 None detected 6,553 Absent
018 0 27 None detected 6,500 Absent
Notes: Shaded cells represent PCR inhibition. CE/100mL = cell equivalent (amount of DNA expected in one bacterial cell) per 100 milliliters; mg/L = milligrams per liter; org/mL = organisms per 100 milliliters
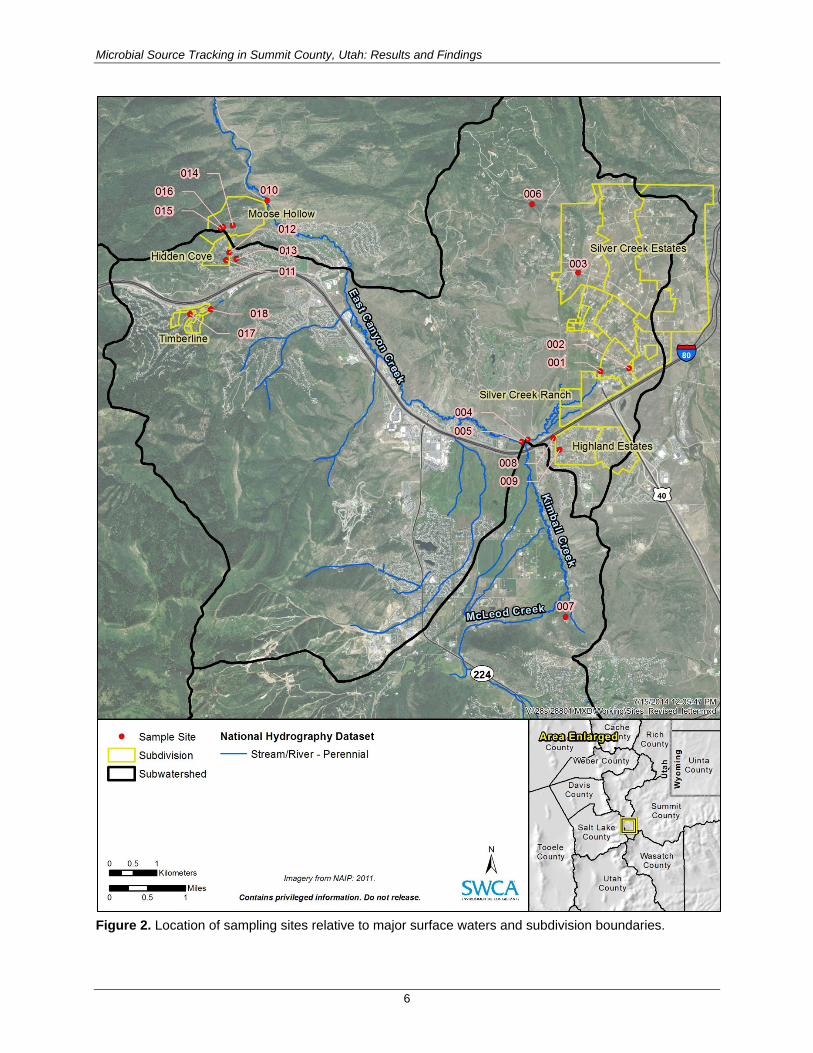
Microbial Source Tracking in Summit County, Utah: Results and Findings
6
Figure 2. Location of sampling sites relative to major surface waters and subdivision boundaries.
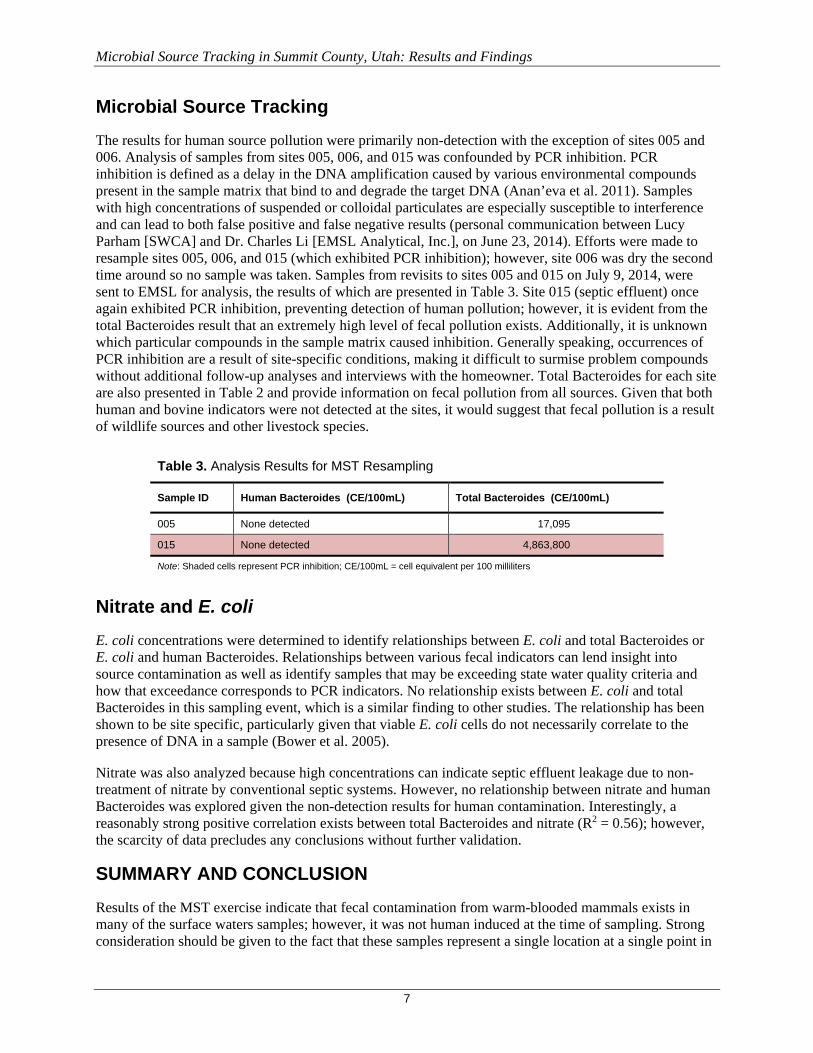
Microbial Source Tracking in Summit County, Utah: Results and Findings
7
Microbial Source Tracking The results for human source pollution were primarily non-detection with the exception of sites 005 and 006. Analysis of samples from sites 005, 006, and 015 was confounded by PCR inhibition. PCR inhibition is defined as a delay in the DNA amplification caused by various environmental compounds present in the sample matrix that bind to and degrade the target DNA (Anan’eva et al. 2011). Samples with high concentrations of suspended or colloidal particulates are especially susceptible to interference and can lead to both false positive and false negative results (personal communication between Lucy Parham [SWCA] and Dr. Charles Li [EMSL Analytical, Inc.], on June 23, 2014). Efforts were made to resample sites 005, 006, and 015 (which exhibited PCR inhibition); however, site 006 was dry the second time around so no sample was taken. Samples from revisits to sites 005 and 015 on July 9, 2014, were sent to EMSL for analysis, the results of which are presented in Table 3. Site 015 (septic effluent) once again exhibited PCR inhibition, preventing detection of human pollution; however, it is evident from the total Bacteroides result that an extremely high level of fecal pollution exists. Additionally, it is unknown which particular compounds in the sample matrix caused inhibition. Generally speaking, occurrences of PCR inhibition are a result of site-specific conditions, making it difficult to surmise problem compounds without additional follow-up analyses and interviews with the homeowner. Total Bacteroides for each site are also presented in Table 2 and provide information on fecal pollution from all sources. Given that both human and bovine indicators were not detected at the sites, it would suggest that fecal pollution is a result of wildlife sources and other livestock species.
Table 3. Analysis Results for MST Resampling
Sample ID Human Bacteroides (CE/100mL) Total Bacteroides (CE/100mL)
005 None detected 17,095
015 None detected 4,863,800
Note: Shaded cells represent PCR inhibition; CE/100mL = cell equivalent per 100 milliliters
Nitrate and E. coli E. coli concentrations were determined to identify relationships between E. coli and total Bacteroides or E. coli and human Bacteroides. Relationships between various fecal indicators can lend insight into source contamination as well as identify samples that may be exceeding state water quality criteria and how that exceedance corresponds to PCR indicators. No relationship exists between E. coli and total Bacteroides in this sampling event, which is a similar finding to other studies. The relationship has been shown to be site specific, particularly given that viable E. coli cells do not necessarily correlate to the presence of DNA in a sample (Bower et al. 2005).
Nitrate was also analyzed because high concentrations can indicate septic effluent leakage due to non-treatment of nitrate by conventional septic systems. However, no relationship between nitrate and human Bacteroides was explored given the non-detection results for human contamination. Interestingly, a reasonably strong positive correlation exists between total Bacteroides and nitrate (R2 = 0.56); however, the scarcity of data precludes any conclusions without further validation.
SUMMARY AND CONCLUSION Results of the MST exercise indicate that fecal contamination from warm-blooded mammals exists in many of the surface waters samples; however, it was not human induced at the time of sampling. Strong consideration should be given to the fact that these samples represent a single location at a single point in

Microbial Source Tracking in Summit County, Utah: Results and Findings
8
time, and spatiotemporal variability has proven to be great for the Bacteroides indicator (Bower et al. 2005; Nnane et al. 2011). Additional samples over various seasons and hydrological events is necessary to fully delineate the cause of fecal pollution of surface waters; however, this sampling event provides an first look at Bacteroides as a fecal indicator in surface waters of this region.
If you have any questions regarding this report in the interim, please do not hesitate to contact me at (801) 322-4307 or [email protected]. Sincerely,
Lucy Parham Water Resource Specialist SWCA Environmental Consultants 257 East 200 South, Suite 200 Salt Lake City, Utah 84111 (801) 322-4307
Microbial Source Tracking in Summit County, Utah: Results and Findings
9
LITERATURE CITED Anan’eva, T., J. Kinzelaman, R. Bushon, S. Dorevitch, R. Noble, and D. Blackwood. 2011. Examination of within and across laboratory qPCR inhibition in wastewater and geographically distributed recreational waters. Available at: water.epa.gov/type/oceb/beaches/upload/AnanevaTamara.pdf. Accessed June 23, 2014.
Bower, P. A., Scopel, C. O., Jensen, E. T., Depas, M. M., and S. L. McLellan. 2005. Detection of genetic markers of fecal indicator bacteria in Lake Michigan and determination of their relationship to Escherichia coli densities using standard microbial methods. Applied and Environmental Microbiology 71:8305–8313.
Chem-Tech Ford. 2014. Sampling Procedures – Coliform Bacteria. Available at: http://www.chemtechford.com/File_Download/Coliform_Bacteria.pdf. Accessed July 13, 2014.
EMSL. 2010. Bacteroides: A Better Alternative to Determine Sewage Contamination in Indoor Environments. Available at: http://www.emsl.com/index.cfm?nav=Pages&ID=434. Accessed June 28, 2014.
Environmental Protection Agency. 2010. Method B: Bacteroidales in Water by TaqMan Quantitative Polymerase Chain Reaction Assay. Available at: http://water.epa.gov/scitech/methods/cwa/bioindicators/upload/methodb2010.pdf. Accessed July 13, 2014.
EMSL. 2014. PCR Sampling Guide. Available at: http://www.emsl.com/PDFDocuments/SamplingGuide/pcr_guide.pdf. Accessed July 13, 2014.
Lavendar, J. S. 2010. Quantitative Real-Time PCR Analysis of Wastewater Treatment Plant Influent/Effluent. Available at: http://www.cityofracine.org/WorkArea/DownloadAsset.aspx?id=1135. Accessed June 21, 2014.
Nnane, D. E., Ebdon, J. E., and H. D. Taylor. 2011. Integrated analysis of water quality parameters for cost-effective faecal pollution management in river catchments. Water Resources 45:2235–2246.
SWCA. 2014. Rockport Reservoir and Echo Reservoir Total Maximum Daily Loads Implementation Plan. Prepared for Utah Department of Environmental Quality, Salt Lake City, Utah.
Tetra Tech Inc. 2011. Using Microbial Source Tracking to Support TMDL Development and Implementation. Available at: www.epa.gov/region10/pdf/tmdl/mst_for_tmdls_guide_04_22_11.pdf. Accessed June 10, 2014.
Weather Underground. 2014. Pinebrook Upper Ecker Hill. Current Conditions. Available at: http://www.wunderground.com/personal-weather-station/dashboard?ID=KUTPARKC31#history/s20140603/e20140603/mdaily. Accessed July 13, 2014.

Microbial Source Tracking in Summit County, Utah: Results and Findings
10
This page intentionally blank

Appendix B
June 2016 letter report: Results from the 2016 Water Quality Sampling Conducted in Summit County, Utah


June 20, 2016
Richard Bullough
Summit County Health Department
650 Round Valley Drive
Park City, Utah 84060
RE: Results from the 2016 water quality sampling conducted in Summit County, Utah
Dear Mr. Bullough,
This letter report presents the purpose, methodology, and results of the water quality sampling event
conducted in Summit County, Utah, on June 1 and 2, 2016. All relevant methodology and sampling
details are included in this report as well as data descriptions and interpretations. Additional data such as
site photographs, laboratory reports, and references can be provided upon request.
PURPOSE
This letter documents the first of two water quality sampling events to be conducted in Summit County,
Utah in 2016 and represents sampling during the spring runoff season. The purpose of this water quality
sampling is to support the 2015 septic system assessment and the upcoming 2016 assessment that are
intended to assist the Summit County Health Department (SCHD) in identifying areas where
contamination of surface waters is likely, due to the presence of conventional septic systems. Further
details of the water quality sampling can be found in the Water Quality Sampling Plan that was submitted
to SCHD on March 25, 2016.
METHODOLOGY
On June 1 and 2, 2016, SWCA Environmental Consultants (SWCA) and SCHD sampled 21 surface water
sites throughout Summit County (Table 1; Figure 1). Sites are located in both the Snyderville Basin and
portions of eastern Summit County. As described below, site selection in Snyderville Basin was largely
based on the eighteen 2014 sampling sites, although these sites were refined as a result of the findings of
the septic study conducted in 2015. Seven sites from the original sampling plan were removed, and
emphasis was placed on those sampling sites in subdivisions with a high priority rating (i.e., Hidden
Cove, Highland Estates, Timberline, and Silver Creek Estates), leaving a total count of 11 sampling sites
in the Snyderville Basin (labeled with “SN”). Eleven sites were also selected in eastern Summit County
(labeled with “ES”). Selection was based on the preliminary septic assessment conducted as part of the
Rockport and Echo total maximum daily load and based on local knowledge of the SCHD staff (conveyed
through the watershed tour that took place on March 16, 2016). In most cases, sites were selected both
upstream and downstream of subdivisions or developments to more readily target potential contribution
of septic systems to surface waters. Weather conditions during both sampling days were mostly sunny
with clear skies and an average temperature of 66 degrees Fahrenheit (Weather Underground 2016).

Results from the 2016 water quality sampling conducted in Summit County, Utah
Table 1. Sampling Site Descriptions and Locations in Summit County, Utah
Sampling Site ID
Location Site Description
SN-01* Silver Creek Estates Roadside drainage
SN-02 Silver Creek Estates Wet meadow
SN-03 Silver Creek Estates Unnamed stream
SN-05 East Canyon Creek East Canyon Creek after the confluence with Kimball Creek
SN-08 Highland Estates Roadside drainage
SN-09 Highland Estates Unnamed stream
SN-11 Hidden Cove Hillside seepage
SN-12 Hidden Cove Hillside seepage
SN-13 Hidden Cove Pond
SN-17 Timberline Unnamed stream
SN-18 Timberline Unnamed stream
ES-01 Upstream of the Samak development Beaver Creek
ES-02 Downstream of the Samak development Beaver Creek
ES-03 Utah State Route 35 crossing Provo River
ES-04 Downstream of Stewart Ranch Park development Provo River
ES-05 Downstream of the Killkare development Provo River
ES-06 Upstream of the Aspen Acres subdivision Weber River
ES-07 Downstream of the Hidden Lake subdivision Weber River
ES-08 At the outlet of Rockport Reservoir Weber River
ES-09 Between Rockport and Echo Reservoir Weber River
ES-10 Between Rockport and Echo Reservoir Weber River
ES-11 Spring Hills subdivision Unnamed stream that is a tributary to Beaver Creek
* Sampling did not take place because the site was dry.
Three samples were collected at each site and analyzed for Escherichia coli (E. coli), nitrate, and genetic
markers for fecal sources (i.e., microbial source tracking [MST]). The E. coli analysis was conducted by
the Utah Public Health Laboratory in Salt Lake City, Utah, and the nitrate analysis was conducted by
American West Analytical Laboratories, also located in Salt Lake City. Laboratory methods used to
analyze for nitrate (via U.S. Environmental Protection Agency [EPA] Method 300.0) and E. coli (via EPA
Method SM 9223 B-QT) were performed in accordance with the National Environmental Laboratory
Accreditation Program.
The MST analysis was conducted by Microbial Insights, Inc. in Knoxville, Tennessee, and consisted of
two different analyses, both of which employed polymerase chain reaction methodology (PCR). PCR is a
molecular method that assays specific marker genes through genetic extraction and amplification. It uses
those markers to identify the presence or absence of fecal sources (Tetra Tech 2011). The more recently
developed quantitative PCR (qPCR) provides additional information by measuring the quantity of DNA
present in a water sample. Human fecal contamination of surface waters was explored using qPCR of the
genus Bacteroides, which is an anaerobic fecal bacterium that is abundant in the gut of mammals, and
whose presence in water is an indication of fecal pollution (EPA 2010). Specifically, the HF183 genetic
marker was used to quantify human pollution, and general Bacteroides (GenBac) was also quantified
using a similar qPCR method.
All samples were collected in accordance with the standard collection procedures for each laboratory.
Bottles and sample storage were provided by the respective laboratory, and the recommended holding
times of 6 hours for E. coli, 24 hours for MST, and 48 hours for nitrate were not exceeded.
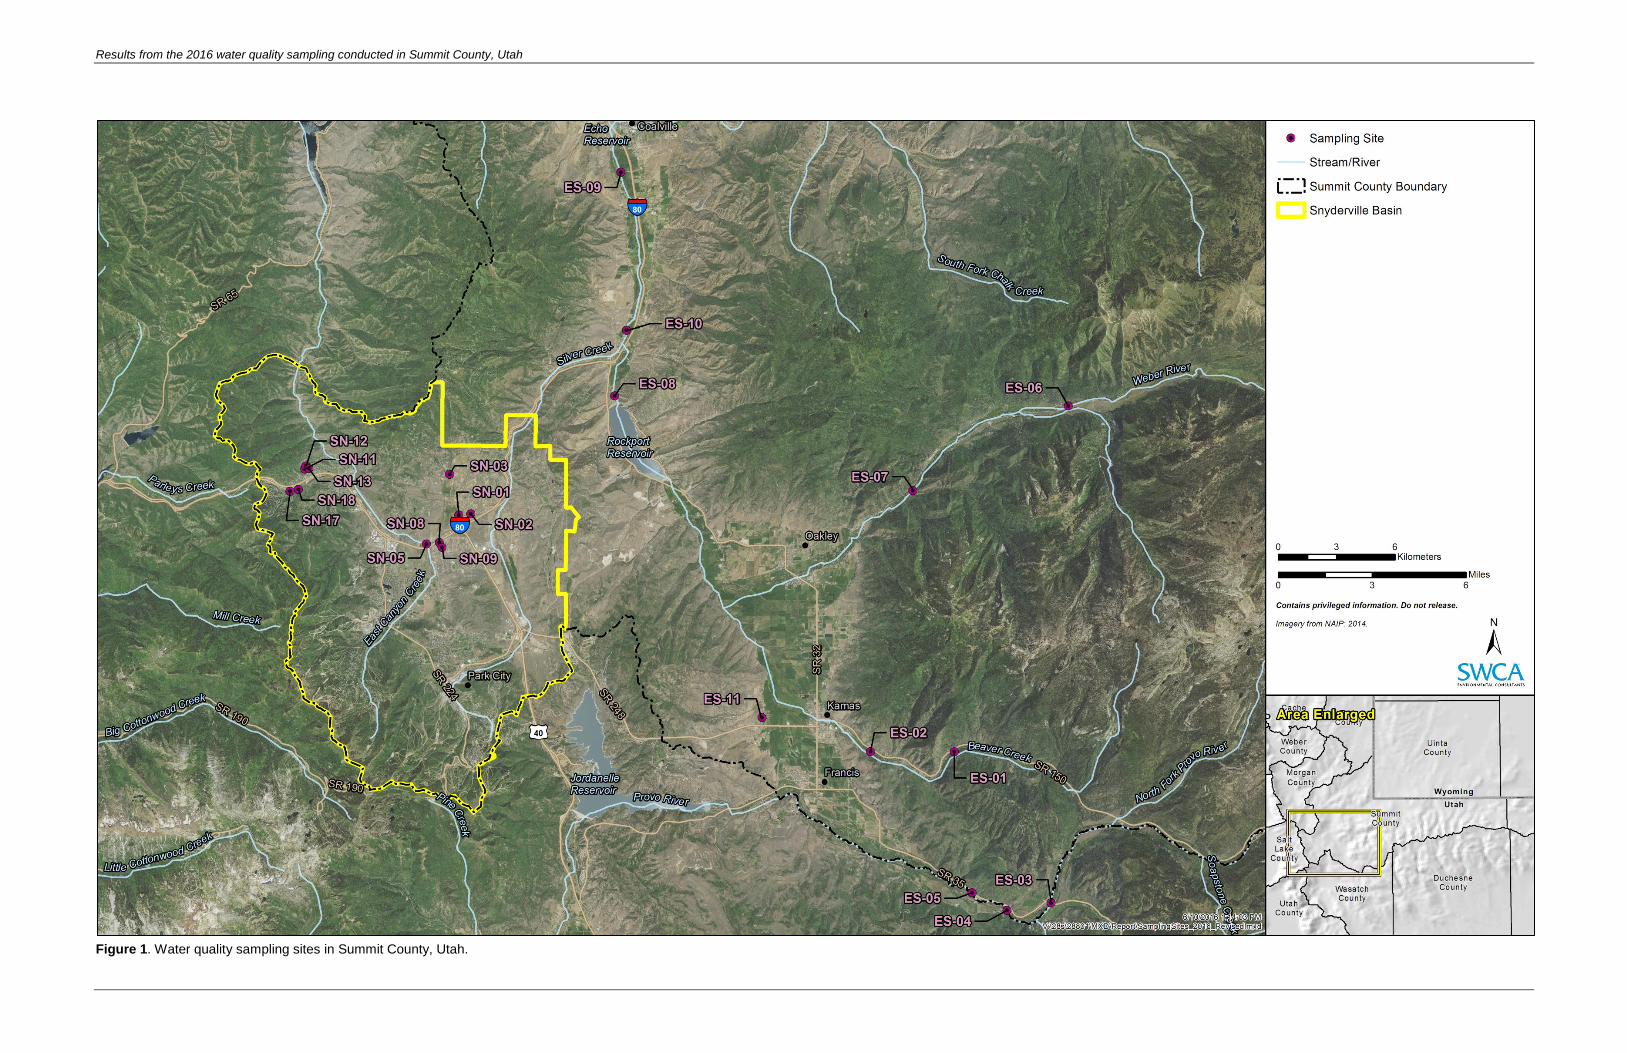
Results from the 2016 water quality sampling conducted in Summit County, Utah
Figure 1. Water quality sampling sites in Summit County, Utah.

Results from the 2016 water quality sampling conducted in Summit County, Utah
This page intentionally blank
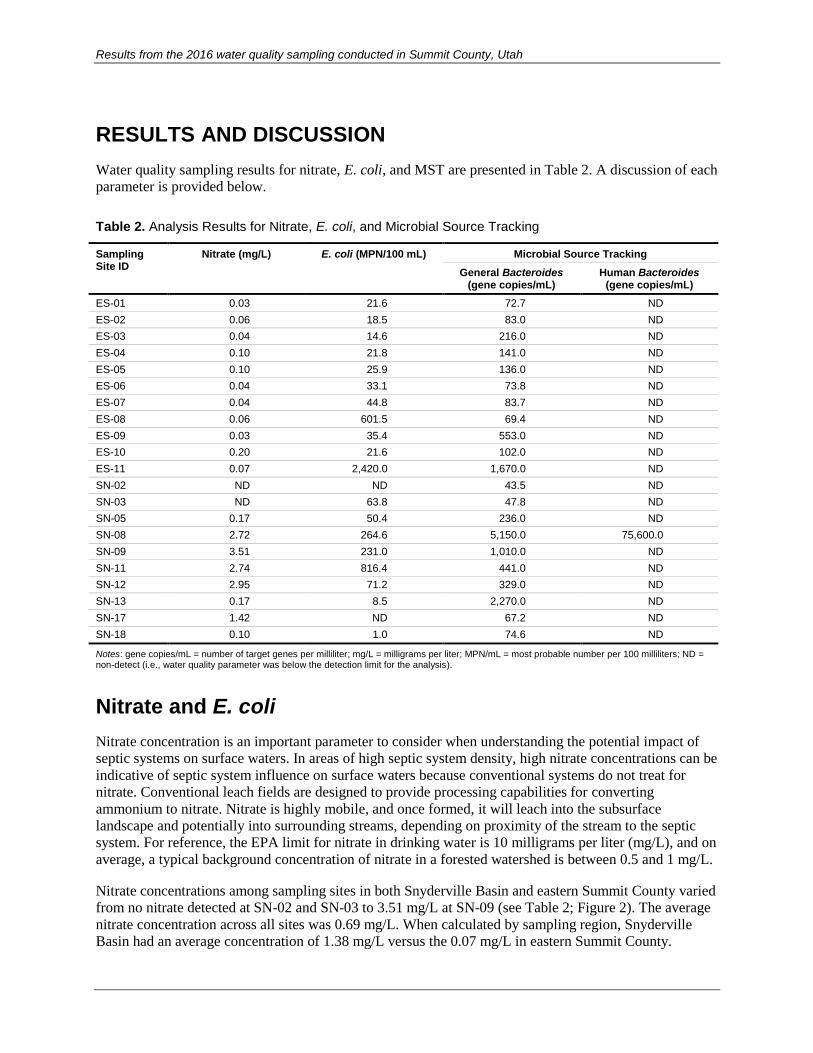
Results from the 2016 water quality sampling conducted in Summit County, Utah
RESULTS AND DISCUSSION
Water quality sampling results for nitrate, E. coli, and MST are presented in Table 2. A discussion of each
parameter is provided below.
Nitrate and E. coli
Nitrate concentration is an important parameter to consider when understanding the potential impact of
septic systems on surface waters. In areas of high septic system density, high nitrate concentrations can be
indicative of septic system influence on surface waters because conventional systems do not treat for
nitrate. Conventional leach fields are designed to provide processing capabilities for converting
ammonium to nitrate. Nitrate is highly mobile, and once formed, it will leach into the subsurface
landscape and potentially into surrounding streams, depending on proximity of the stream to the septic
system. For reference, the EPA limit for nitrate in drinking water is 10 milligrams per liter (mg/L), and on
average, a typical background concentration of nitrate in a forested watershed is between 0.5 and 1 mg/L.
Nitrate concentrations among sampling sites in both Snyderville Basin and eastern Summit County varied
from no nitrate detected at SN-02 and SN-03 to 3.51 mg/L at SN-09 (see Table 2; Figure 2). The average
nitrate concentration across all sites was 0.69 mg/L. When calculated by sampling region, Snyderville
Basin had an average concentration of 1.38 mg/L versus the 0.07 mg/L in eastern Summit County.
Table 2. Analysis Results for Nitrate, E. coli, and Microbial Source Tracking
Sampling Site ID
Nitrate (mg/L)
E. coli (MPN/100 mL) Microbial Source Tracking
General Bacteroides (gene copies/mL)
Human Bacteroides (gene copies/mL)
ES-01 0.03 21.6 72.7 ND
ES-02 0.06 18.5 83.0 ND
ES-03 0.04 14.6 216.0 ND
ES-04 0.10 21.8 141.0 ND
ES-05 0.10 25.9 136.0 ND
ES-06 0.04 33.1 73.8 ND
ES-07 0.04 44.8 83.7 ND
ES-08 0.06 601.5 69.4 ND
ES-09 0.03 35.4 553.0 ND
ES-10 0.20 21.6 102.0 ND
ES-11 0.07 2,420.0 1,670.0 ND
SN-02 ND ND 43.5 ND
SN-03 ND 63.8 47.8 ND
SN-05 0.17 50.4 236.0 ND
SN-08 2.72 264.6 5,150.0 75,600.0
SN-09 3.51 231.0 1,010.0 ND
SN-11 2.74 816.4 441.0 ND
SN-12 2.95 71.2 329.0 ND
SN-13 0.17 8.5 2,270.0 ND
SN-17 1.42 ND 67.2 ND
SN-18 0.10 1.0 74.6 ND
Notes: gene copies/mL = number of target genes per milliliter; mg/L = milligrams per liter; MPN/mL = most probable number per 100 milliliters; ND = non-detect (i.e., water quality parameter was below the detection limit for the analysis).
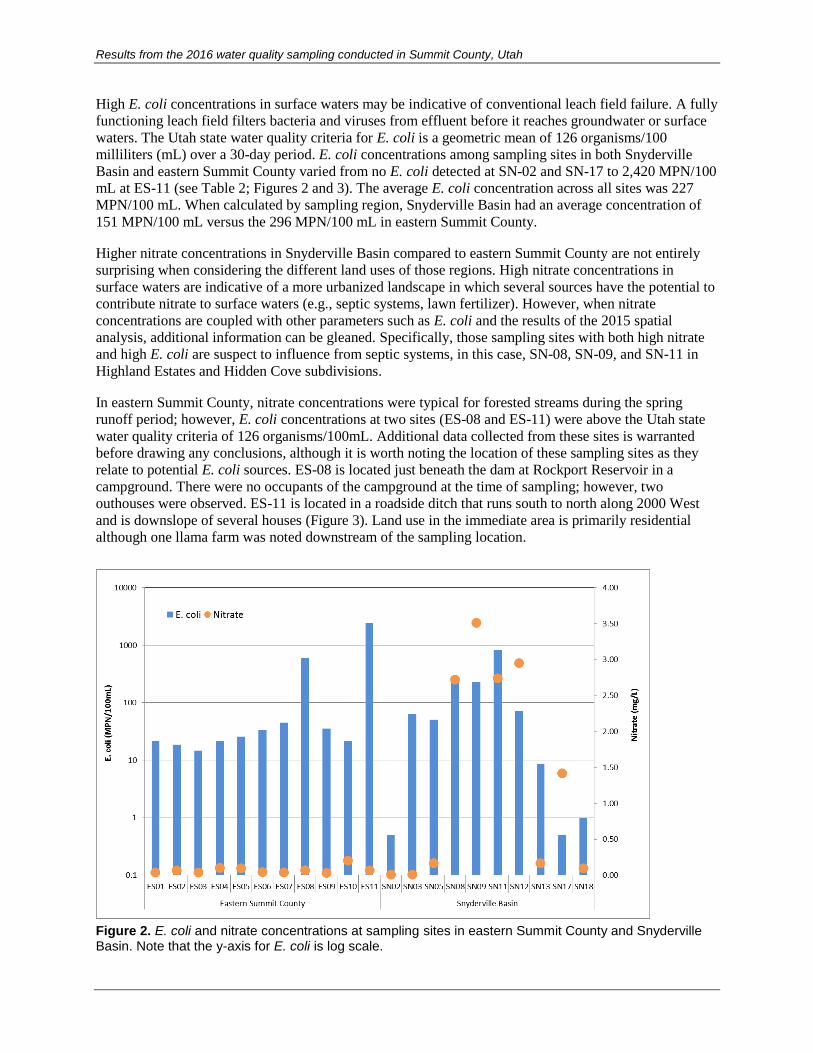
Results from the 2016 water quality sampling conducted in Summit County, Utah
High E. coli concentrations in surface waters may be indicative of conventional leach field failure. A fully
functioning leach field filters bacteria and viruses from effluent before it reaches groundwater or surface
waters. The Utah state water quality criteria for E. coli is a geometric mean of 126 organisms/100
milliliters (mL) over a 30-day period. E. coli concentrations among sampling sites in both Snyderville
Basin and eastern Summit County varied from no E. coli detected at SN-02 and SN-17 to 2,420 MPN/100
mL at ES-11 (see Table 2; Figures 2 and 3). The average E. coli concentration across all sites was 227
MPN/100 mL. When calculated by sampling region, Snyderville Basin had an average concentration of
151 MPN/100 mL versus the 296 MPN/100 mL in eastern Summit County.
Higher nitrate concentrations in Snyderville Basin compared to eastern Summit County are not entirely
surprising when considering the different land uses of those regions. High nitrate concentrations in
surface waters are indicative of a more urbanized landscape in which several sources have the potential to
contribute nitrate to surface waters (e.g., septic systems, lawn fertilizer). However, when nitrate
concentrations are coupled with other parameters such as E. coli and the results of the 2015 spatial
analysis, additional information can be gleaned. Specifically, those sampling sites with both high nitrate
and high E. coli are suspect to influence from septic systems, in this case, SN-08, SN-09, and SN-11 in
Highland Estates and Hidden Cove subdivisions.
In eastern Summit County, nitrate concentrations were typical for forested streams during the spring
runoff period; however, E. coli concentrations at two sites (ES-08 and ES-11) were above the Utah state
water quality criteria of 126 organisms/100mL. Additional data collected from these sites is warranted
before drawing any conclusions, although it is worth noting the location of these sampling sites as they
relate to potential E. coli sources. ES-08 is located just beneath the dam at Rockport Reservoir in a
campground. There were no occupants of the campground at the time of sampling; however, two
outhouses were observed. ES-11 is located in a roadside ditch that runs south to north along 2000 West
and is downslope of several houses (Figure 3). Land use in the immediate area is primarily residential
although one llama farm was noted downstream of the sampling location.
Figure 2. E. coli and nitrate concentrations at sampling sites in eastern Summit County and Snyderville Basin. Note that the y-axis for E. coli is log scale.

Results from the 2016 water quality sampling conducted in Summit County, Utah
Figure 3. Sampling site ES-11, view facing north.
Microbial Source Tracking
GenBac is an indicator of overall fecal contamination, similar to E. coli. GenBac was detected at all
sampling sites and ranged in value from approximately 44 gene copies/mL at SN-02 to 5,150 gene
copies/mL at SN-08 (Figure 4). The average GenBac concentration across all sites was 613 gene
copies/mL. When calculated by sampling region, Snyderville Basin had an average concentration of 967
gene copies/mL versus the average 291 gene copies/mL in eastern Summit County.
Figure 4. General Bacteroides concentrations at sampling sites in eastern Summit County and Snyderville Basin.
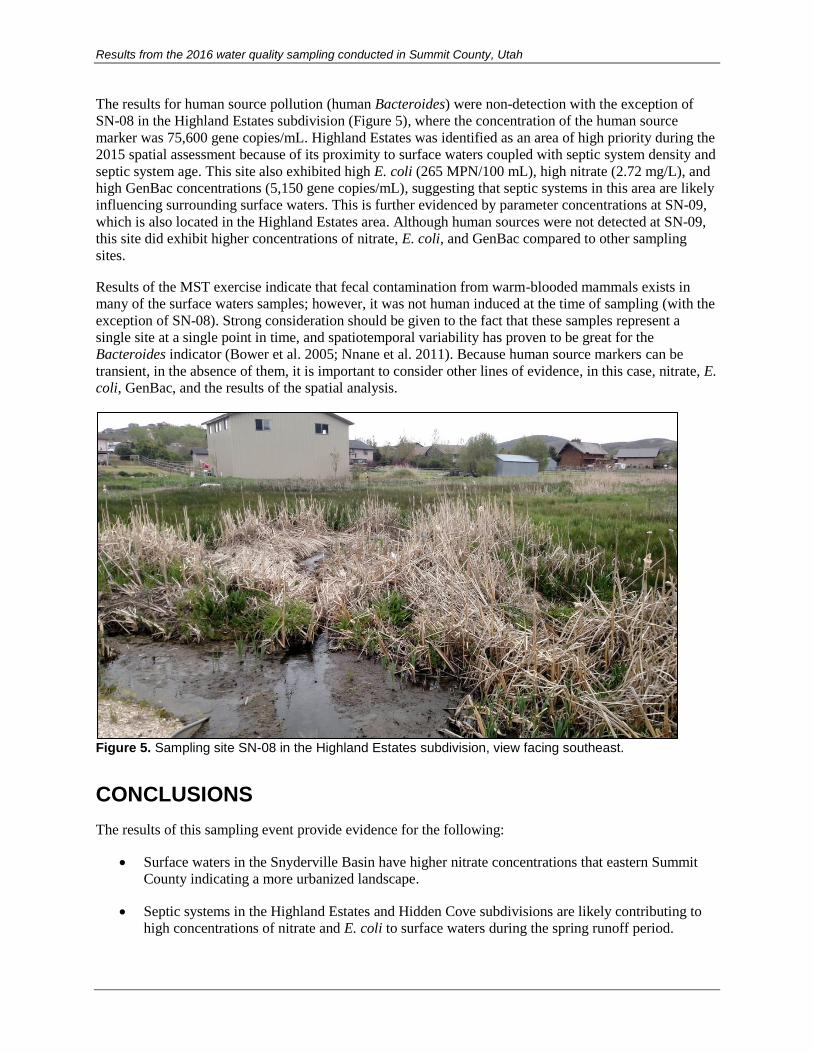
Results from the 2016 water quality sampling conducted in Summit County, Utah
The results for human source pollution (human Bacteroides) were non-detection with the exception of
SN-08 in the Highland Estates subdivision (Figure 5), where the concentration of the human source
marker was 75,600 gene copies/mL. Highland Estates was identified as an area of high priority during the
2015 spatial assessment because of its proximity to surface waters coupled with septic system density and
septic system age. This site also exhibited high E. coli (265 MPN/100 mL), high nitrate (2.72 mg/L), and
high GenBac concentrations (5,150 gene copies/mL), suggesting that septic systems in this area are likely
influencing surrounding surface waters. This is further evidenced by parameter concentrations at SN-09,
which is also located in the Highland Estates area. Although human sources were not detected at SN-09,
this site did exhibit higher concentrations of nitrate, E. coli, and GenBac compared to other sampling
sites.
Results of the MST exercise indicate that fecal contamination from warm-blooded mammals exists in
many of the surface waters samples; however, it was not human induced at the time of sampling (with the
exception of SN-08). Strong consideration should be given to the fact that these samples represent a
single site at a single point in time, and spatiotemporal variability has proven to be great for the
Bacteroides indicator (Bower et al. 2005; Nnane et al. 2011). Because human source markers can be
transient, in the absence of them, it is important to consider other lines of evidence, in this case, nitrate, E.
coli, GenBac, and the results of the spatial analysis.
Figure 5. Sampling site SN-08 in the Highland Estates subdivision, view facing southeast.
CONCLUSIONS
The results of this sampling event provide evidence for the following:
Surface waters in the Snyderville Basin have higher nitrate concentrations that eastern Summit
County indicating a more urbanized landscape.
Septic systems in the Highland Estates and Hidden Cove subdivisions are likely contributing to
high concentrations of nitrate and E. coli to surface waters during the spring runoff period.

Results from the 2016 water quality sampling conducted in Summit County, Utah
Septic systems do not appear to be influencing surface water quality in eastern Summit County
during the spring runoff period.
The next sampling event is planned to occur during summer baseflow conditions in August 2016.
Comparison of water quality during spring runoff and summer baseflow is important for identifying the
nature of surface water contamination. For instance, high E. coli concentrations in the spring may indicate
flooding and subsequent failing of leachfields versus high E. coli concentrations in the summer (under
baseflow conditions) that may indicate an illicit discharge through direct piping of fecal waste to a surface
water.
If you have any questions regarding this report in the interim, please do not hesitate to contact me at (801)
322-4307 or [email protected].
Sincerely,
Lucy Parham
Water Resource Specialist
SWCA Environmental Consultants
257 East 200 South, Suite 200
Salt Lake City, Utah 84111
(801) 322-4307
LITERATURE CITED
Bower, P. A., Scopel, C. O., Jensen, E. T., Depas, M. M., and S. L. McLellan. 2005. Detection of genetic
markers of fecal indicator bacteria in Lake Michigan and determination of their relationship to
Escherichia coli densities using standard microbial methods. Applied and Environmental
Microbiology 71:8305–8313.
Nnane, D. E., Ebdon, J. E., and H. D. Taylor. 2011. Integrated analysis of water quality parameters for
cost-effective faecal pollution management in river catchments. Water Resources 45:2235–2246.
Tetra Tech Inc. 2011. Using Microbial Source Tracking to Support TMDL Development and
Implementation. Available at:
www.epa.gov/region10/pdf/tmdl/mst_for_tmdls_guide_04_22_11.pdf. Accessed June 8, 2016.
U.S. Environmental Protection Agency (EPA). 2010. Method B: Bacteroidales in Water by TaqMan
Quantitative Polymerase Chain Reaction Assay. Available at:
http://water.epa.gov/scitech/methods/cwa/bioindicators/upload/methodb2010.pdf. Accessed June
8, 2016.
Weather Underground. 2016. Park City, Utah. Available at: https://www.wunderground.com/us/ut/heber-
city/zmw:84060.1.99999. Accessed July 8, 2016.

Appendix C
September 2016 letter report: Results from the Summer 2016 Water Quality Sampling Conducted in Summit County, Utah


1
September 22, 2016
Richard Bullough, PhD Summit County Health Department 650 Round Valley Drive Park City, Utah 84060
RE: Results from the Summer 2016 Water Quality Sampling Conducted in Summit County, Utah
Dear Dr. Bullough:
This letter presents the purpose, methodology, and results of the summer 2016 water quality sampling event conducted in Summit County, Utah, on August 9, 10, and 22, 2016. All relevant methodology and sampling details are included in this report as well as data descriptions and interpretations. Additional data such as site photographs, laboratory reports, and references can be provided upon request.
PURPOSE This letter documents the second of two water quality sampling events conducted in Summit County, Utah, in 2016 during the summer baseflow season. The purpose of this water quality sampling effort is to support the 2015 septic system assessment and the upcoming 2016 septic assessment that are intended to assist the Summit County Health Department (SCHD) in identifying areas where failing conventional septic systems have likely contaminated surface waters. Further details of the water quality sampling can be found in the Water Quality Sampling Plan that was submitted to SCHD on March 25, 2016.
METHODOLOGY On August 9, 10, and 22, 2016, SWCA Environmental Consultants (SWCA) and SCHD staff sampled 17 surface water sites throughout Summit County (Table 1; Figure 1). These sites are located in both Snyderville Basin and portions of eastern Summit County. As described below, site selection in Snyderville Basin was largely based on the eighteen 2014 sampling sites, although the list of sites was refined as a result of the 2015 septic study. Seven sites from the original sampling plan were removed, and emphasis was placed on those sampling sites in subdivisions with a high priority rating (i.e., Hidden Cove, Highland Estates, Timberline, and Silver Creek Estates), leaving a total count of 11 sampling sites in Snyderville Basin (labeled with “SN”). In the 2016 summer sampling event, five sites in Snyderville Basin were dropped because of insufficient water for sampling. Eleven sites were also selected in eastern Summit County (labeled with “ES”). Selection was based on the preliminary septic assessment conducted as part of the Rockport and Echo total maximum daily load analysis and based on local knowledge of the SCHD staff (conveyed through the watershed tour that took place on March 16, 2016). In most cases, sites were selected both upstream and downstream of subdivisions or developments to specifically target potential contribution of septic systems to surface waters. A third sampling day (on August 22) was added after the microbial source tracking (MST) bottles from August 9 failed to reach their destination within

Results from the 2016 Water Quality Sampling Conducted in Summit County, Utah
2
the designated holding time and were 1 degree Celsius (ºC) above the recommended temperature for samples arriving from international sources (16ºC as opposed to 15ºC). On this additional day of sampling, five sites in eastern Summit County were selected and resampled for nitrate, Escherichia coli (E. coli), and human Bacteroides (H183; not general Bacteroides [GenBAC]). These sites were selected based on the results of our spring sampling event, which identified sites with potential to yield positive results.
Weather conditions during all sampling days were mostly sunny with clear skies and an average temperature of 70 degrees Fahrenheit (°F) on August 9 and 10, 2016, and 66°F on August 22, 2016 (Weather Underground 2016).
Three samples were collected at each site and analyzed for E. coli, nitrate, and genetic markers for fecal sources (i.e., MST). The E. coli analysis was conducted by the Utah Public Health Laboratory in Salt Lake City, Utah, and the nitrate analysis was conducted by American West Analytical Laboratories, also located in Salt Lake City. Laboratory methods used to analyze for nitrate (via U.S. Environmental Protection Agency [EPA] Method 300.0) and E. coli (via EPA Method SM 9223 B-QT) were performed in accordance with the National Environmental Laboratory Accreditation Program.
Table 1. Sampling Site Descriptions and Locations in Summit County, Utah
Sampling Site ID
Location Site Description
SN-01* Silver Creek Estates Roadside drainage
SN-02* Silver Creek Estates Wet meadow
SN-03* Silver Creek Estates Unnamed stream
SN-05 East Canyon Creek East Canyon Creek after the confluence with Kimball Creek
SN-08* Highland Estates Roadside drainage
SN-09 Highland Estates Unnamed stream
SN-11 Hidden Cove Hillside seepage
SN-12* Hidden Cove Hillside seepage
SN-13 Hidden Cove Pond
SN-17 Timberline Unnamed stream
SN-18 Timberline Unnamed stream
ES-01 Upstream of the Samak development Beaver Creek
ES-02 Downstream of the Samak development Beaver Creek
ES-03 Utah State Route 35 crossing Provo River
ES-04 Downstream of Stewart Ranch Park development Provo River
ES-05 Downstream of the Killkare development Provo River
ES-06 Upstream of the Aspen Acres subdivision Weber River
ES-07 Downstream of the Hidden Lake subdivision Weber River
ES-08 At the outlet of Rockport Reservoir Weber River
ES-09 Between Rockport and Echo Reservoir Weber River
ES-10 Between Rockport and Echo Reservoir Weber River
ES-11 Spring Hills subdivision Unnamed stream that is a tributary to Beaver Creek
* Sampling did not take place because the site was dry.
Results from the 2016 Water Quality Sampling Conducted in Summit County, Utah
3
The MST analysis was conducted by Microbial Insights, Inc. in Knoxville, Tennessee, and consisted of two different analyses (GenBAC and HBAC), both of which employed polymerase chain reaction methodology (PCR). PCR is a molecular method that assays specific marker genes through genetic extraction and amplification. It uses those specific genetic markers to identify the presence or absence of fecal sources (Tetra Tech 2011). The more recently developed quantitative PCR (qPCR) technique provides additional information by measuring the quantity of DNA present in a water sample. Human fecal contamination (HBAC) of surface waters was explored using qPCR of the genus Bacteroides, which is an anaerobic fecal bacterium that is abundant in the gut of mammals and whose presence in water is an indication of fecal pollution (EPA 2010). Specifically, the HF183 genetic marker was used to quantify human pollution, and general Bacteroides (GenBAC) was also quantified using a similar qPCR method.
All samples were collected in accordance with the standard collection procedures for each laboratory. Bottles and sample storage were provided by the respective laboratory, and the recommended holding times of 6 hours for E. coli, 24 hours for MST, and 48 hours for nitrate were not exceeded. MST samples from August 9, 2016, arrived warmer than the required temperature for international samples and therefore the concentrations of bacteria may be slightly underestimated.

Results from the 2016 Water Quality Sampling Conducted in Summit County, Utah
4
This page intentionally blank
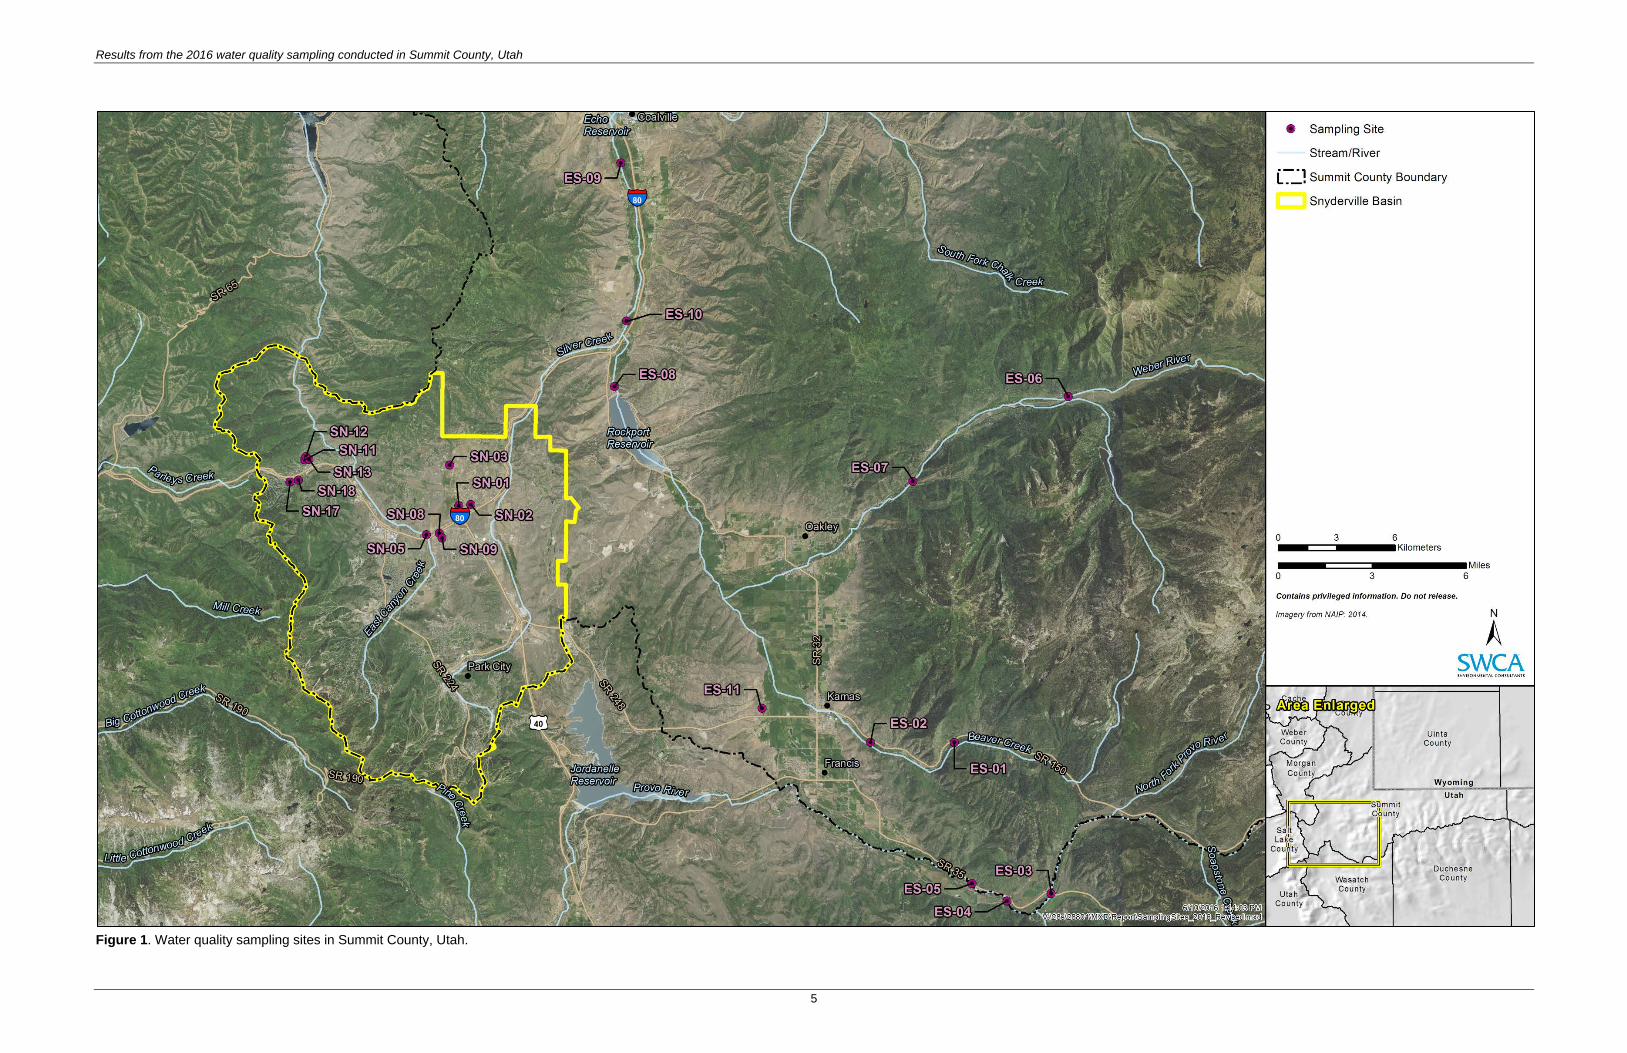
Results from the 2016 water quality sampling conducted in Summit County, Utah
5
Figure 1. Water quality sampling sites in Summit County, Utah.

Results from the 2016 Water Quality Sampling Conducted in Summit County, Utah
6
This page intentionally blank
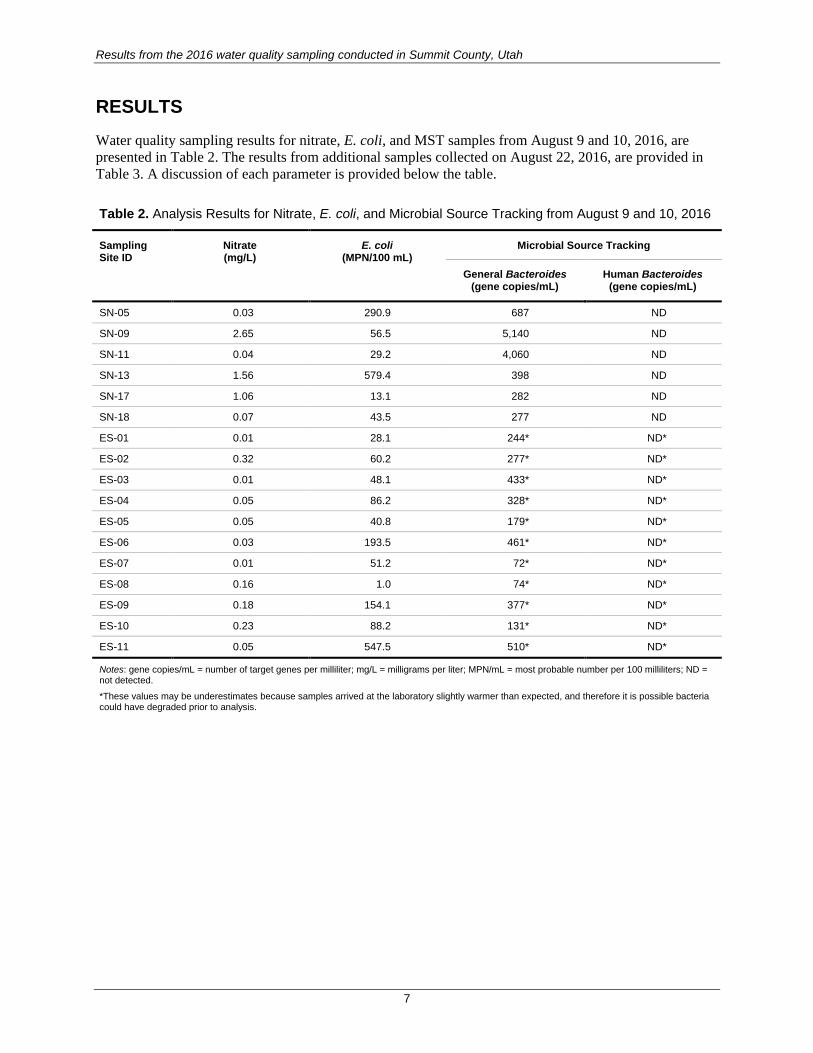
Results from the 2016 water quality sampling conducted in Summit County, Utah
7
RESULTS Water quality sampling results for nitrate, E. coli, and MST samples from August 9 and 10, 2016, are presented in Table 2. The results from additional samples collected on August 22, 2016, are provided in Table 3. A discussion of each parameter is provided below the table.
Table 2. Analysis Results for Nitrate, E. coli, and Microbial Source Tracking from August 9 and 10, 2016
Sampling Site ID
Nitrate (mg/L)
E. coli (MPN/100 mL)
Microbial Source Tracking
General Bacteroides (gene copies/mL)
Human Bacteroides (gene copies/mL)
SN-05 0.03 290.9 687 ND
SN-09 2.65 56.5 5,140 ND
SN-11 0.04 29.2 4,060 ND
SN-13 1.56 579.4 398 ND
SN-17 1.06 13.1 282 ND
SN-18 0.07 43.5 277 ND
ES-01 0.01 28.1 244* ND*
ES-02 0.32 60.2 277* ND*
ES-03 0.01 48.1 433* ND*
ES-04 0.05 86.2 328* ND*
ES-05 0.05 40.8 179* ND*
ES-06 0.03 193.5 461* ND*
ES-07 0.01 51.2 72* ND*
ES-08 0.16 1.0 74* ND*
ES-09 0.18 154.1 377* ND*
ES-10 0.23 88.2 131* ND*
ES-11 0.05 547.5 510* ND*
Notes: gene copies/mL = number of target genes per milliliter; mg/L = milligrams per liter; MPN/mL = most probable number per 100 milliliters; ND = not detected.
*These values may be underestimates because samples arrived at the laboratory slightly warmer than expected, and therefore it is possible bacteria could have degraded prior to analysis.
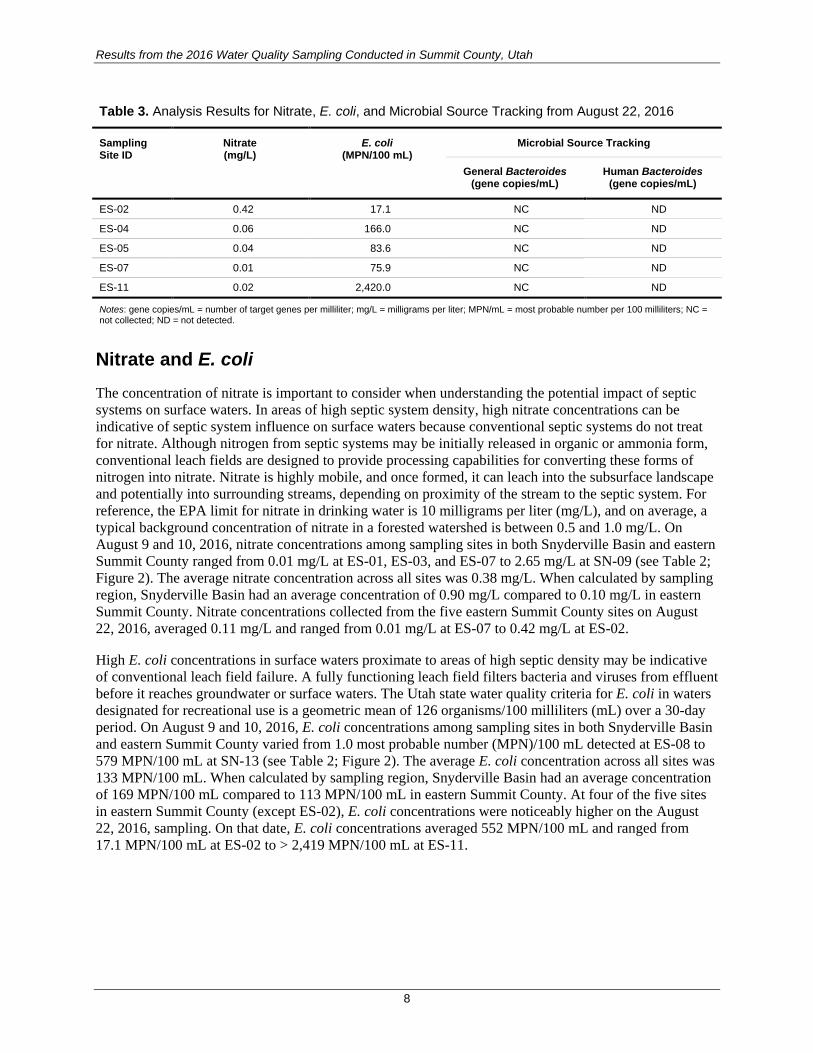
Results from the 2016 Water Quality Sampling Conducted in Summit County, Utah
8
Table 3. Analysis Results for Nitrate, E. coli, and Microbial Source Tracking from August 22, 2016
Sampling Site ID
Nitrate (mg/L)
E. coli (MPN/100 mL)
Microbial Source Tracking
General Bacteroides (gene copies/mL)
Human Bacteroides (gene copies/mL)
ES-02 0.42 17.1 NC ND
ES-04 0.06 166.0 NC ND
ES-05 0.04 83.6 NC ND
ES-07 0.01 75.9 NC ND
ES-11 0.02 2,420.0 NC ND
Notes: gene copies/mL = number of target genes per milliliter; mg/L = milligrams per liter; MPN/mL = most probable number per 100 milliliters; NC = not collected; ND = not detected.
Nitrate and E. coli The concentration of nitrate is important to consider when understanding the potential impact of septic systems on surface waters. In areas of high septic system density, high nitrate concentrations can be indicative of septic system influence on surface waters because conventional septic systems do not treat for nitrate. Although nitrogen from septic systems may be initially released in organic or ammonia form, conventional leach fields are designed to provide processing capabilities for converting these forms of nitrogen into nitrate. Nitrate is highly mobile, and once formed, it can leach into the subsurface landscape and potentially into surrounding streams, depending on proximity of the stream to the septic system. For reference, the EPA limit for nitrate in drinking water is 10 milligrams per liter (mg/L), and on average, a typical background concentration of nitrate in a forested watershed is between 0.5 and 1.0 mg/L. On August 9 and 10, 2016, nitrate concentrations among sampling sites in both Snyderville Basin and eastern Summit County ranged from 0.01 mg/L at ES-01, ES-03, and ES-07 to 2.65 mg/L at SN-09 (see Table 2; Figure 2). The average nitrate concentration across all sites was 0.38 mg/L. When calculated by sampling region, Snyderville Basin had an average concentration of 0.90 mg/L compared to 0.10 mg/L in eastern Summit County. Nitrate concentrations collected from the five eastern Summit County sites on August 22, 2016, averaged 0.11 mg/L and ranged from 0.01 mg/L at ES-07 to 0.42 mg/L at ES-02.
High E. coli concentrations in surface waters proximate to areas of high septic density may be indicative of conventional leach field failure. A fully functioning leach field filters bacteria and viruses from effluent before it reaches groundwater or surface waters. The Utah state water quality criteria for E. coli in waters designated for recreational use is a geometric mean of 126 organisms/100 milliliters (mL) over a 30-day period. On August 9 and 10, 2016, E. coli concentrations among sampling sites in both Snyderville Basin and eastern Summit County varied from 1.0 most probable number (MPN)/100 mL detected at ES-08 to 579 MPN/100 mL at SN-13 (see Table 2; Figure 2). The average E. coli concentration across all sites was 133 MPN/100 mL. When calculated by sampling region, Snyderville Basin had an average concentration of 169 MPN/100 mL compared to 113 MPN/100 mL in eastern Summit County. At four of the five sites in eastern Summit County (except ES-02), E. coli concentrations were noticeably higher on the August 22, 2016, sampling. On that date, E. coli concentrations averaged 552 MPN/100 mL and ranged from 17.1 MPN/100 mL at ES-02 to > 2,419 MPN/100 mL at ES-11.
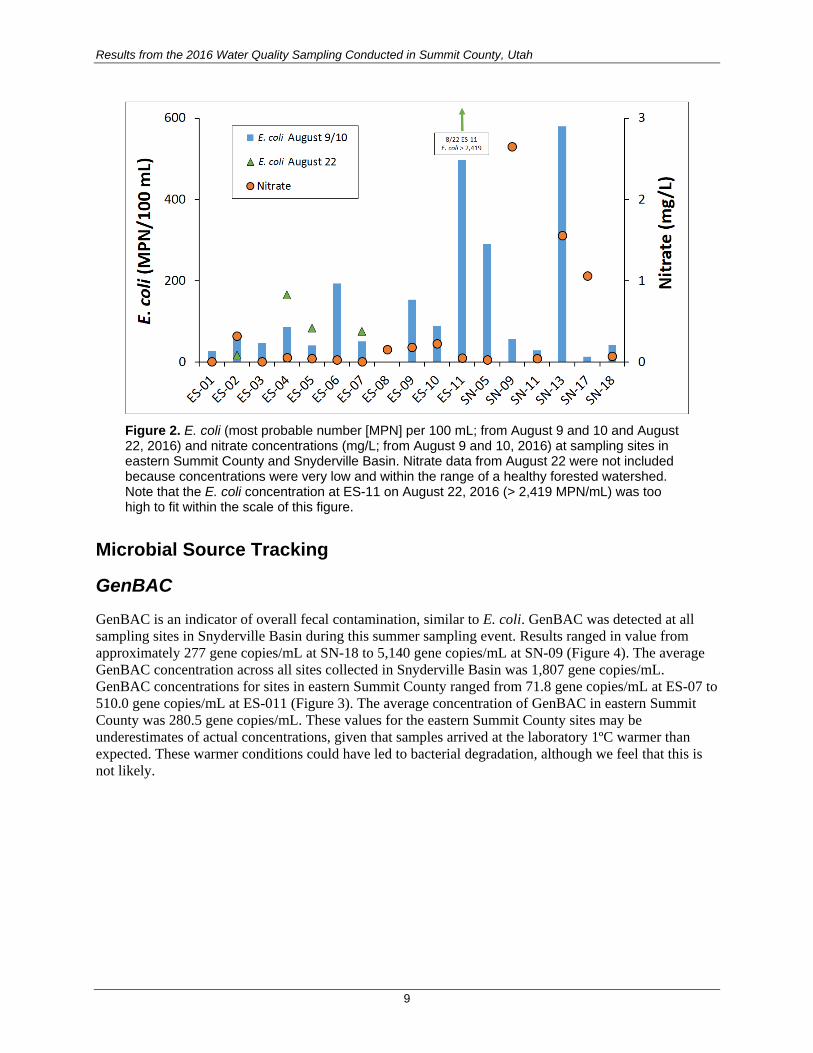
Results from the 2016 Water Quality Sampling Conducted in Summit County, Utah
9
Figure 2. E. coli (most probable number [MPN] per 100 mL; from August 9 and 10 and August 22, 2016) and nitrate concentrations (mg/L; from August 9 and 10, 2016) at sampling sites in eastern Summit County and Snyderville Basin. Nitrate data from August 22 were not included because concentrations were very low and within the range of a healthy forested watershed. Note that the E. coli concentration at ES-11 on August 22, 2016 (> 2,419 MPN/mL) was too high to fit within the scale of this figure.
Microbial Source Tracking
GenBAC GenBAC is an indicator of overall fecal contamination, similar to E. coli. GenBAC was detected at all sampling sites in Snyderville Basin during this summer sampling event. Results ranged in value from approximately 277 gene copies/mL at SN-18 to 5,140 gene copies/mL at SN-09 (Figure 4). The average GenBAC concentration across all sites collected in Snyderville Basin was 1,807 gene copies/mL. GenBAC concentrations for sites in eastern Summit County ranged from 71.8 gene copies/mL at ES-07 to 510.0 gene copies/mL at ES-011 (Figure 3). The average concentration of GenBAC in eastern Summit County was 280.5 gene copies/mL. These values for the eastern Summit County sites may be underestimates of actual concentrations, given that samples arrived at the laboratory 1ºC warmer than expected. These warmer conditions could have led to bacterial degradation, although we feel that this is not likely.
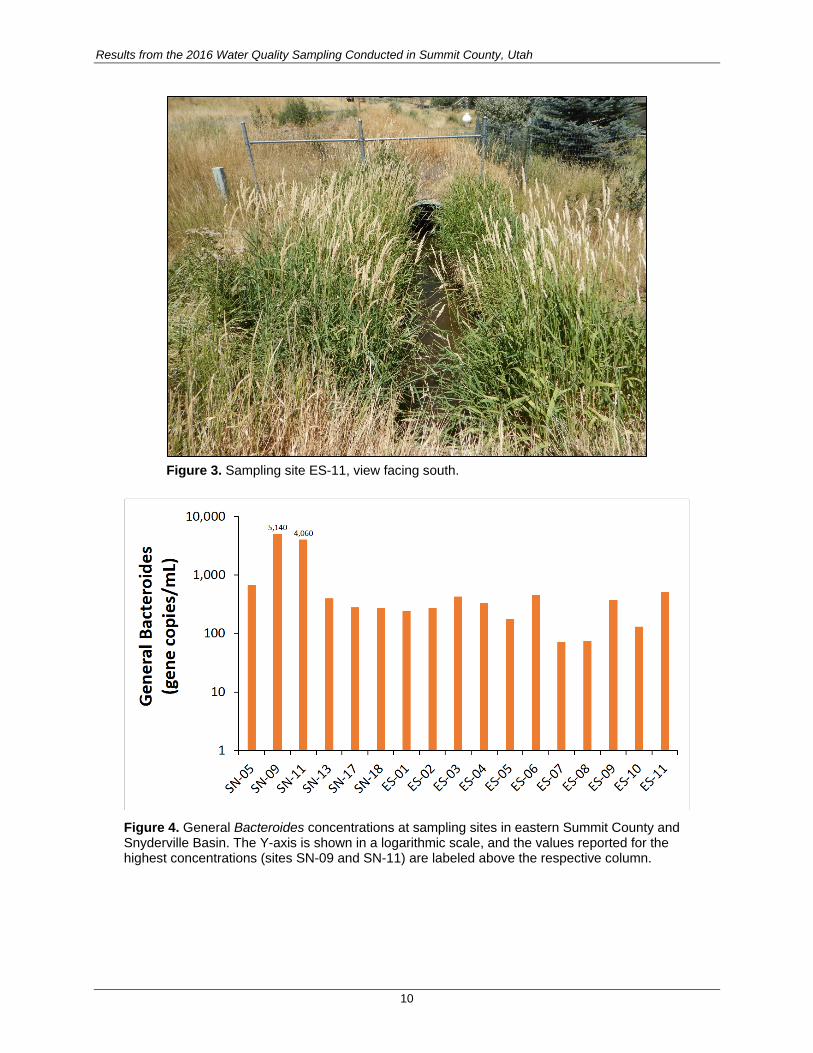
Results from the 2016 Water Quality Sampling Conducted in Summit County, Utah
10
Figure 3. Sampling site ES-11, view facing south.
Figure 4. General Bacteroides concentrations at sampling sites in eastern Summit County and Snyderville Basin. The Y-axis is shown in a logarithmic scale, and the values reported for the highest concentrations (sites SN-09 and SN-11) are labeled above the respective column.

Results from the 2016 Water Quality Sampling Conducted in Summit County, Utah
11
HBAC The analysis of water samples for human source pollution (HBAC) did not result in any positive findings. The ability to detect HBAC in these water samples was limited by the detection and reporting limits of the laboratory method. These results are fairly consistent with the results of the spring 2016 sampling event where HBAC was discovered at only one of the sampling locations (SN-11).
DISCUSSION Higher nitrate concentrations in Snyderville Basin compared to eastern Summit County are not entirely surprising when considering the different land uses of the respective regions. High nitrate concentrations in surface waters are indicative of a more developed landscape in which several sources have the potential to contribute nitrate to surface waters (e.g., septic systems, lawn fertilizer). Further, many of the waters sampled in Snyderville Basin had very low flow compared to the larger ditches, creeks, and streams in eastern Summit County, which would dilute the concentration of nitrate inputs. However, when nitrate concentrations are coupled with other parameters such as E. coli concentrations and spatial data, additional information can be gleaned. Specifically, we may suspect that sampling sites that are high in both nitrate and E. coli (SN-13) are receiving input from failed septic systems. MST data can help to strengthen the evidence.
During this summer sampling period, nitrate concentrations exceeded typical concentrations for forested streams at SN-09, SN-13, and SN-17. E. coli concentrations at ES-04, ES-06, ES-09, ES-11, SN-05, and SN-13 were above the Utah state water quality criteria of 126 organisms/100 mL. In general, nitrate concentrations in eastern Summit County were found to be very low. The extremely high E. coli concentration observed at ES-11 on August 22, 2016 (> 2,419 MPN/100 mL) is alarming and should be noted. Additional sampling at these sites is warranted before drawing any conclusions, although it is worth noting the location of these sampling sites as they relate to potential sources of nitrate and E. coli.
Two of the Snyderville Basin sites sampled in this analysis (SN-09 and SN-13) appear to have a high likelihood of septic contamination. SN-09, a very small stream that runs through the Highland Estates development (Figure 6), was found to have a high concentration of nitrate (2.65 mg/L). This combined with a high concentration of GenBAC (5,140 gene copies/mL) indicate potential septic contamination. SN-13 is a small pond within the Hidden Cove development that captures runoff from the surrounding homes (Figure 7). SN-13 was found to have a nitrate concentration of 1.56 mg/L, E. coli of 579 MPN/100 mL, and GenBAC of 398, which indicate potential septic contamination from the surrounding homes.
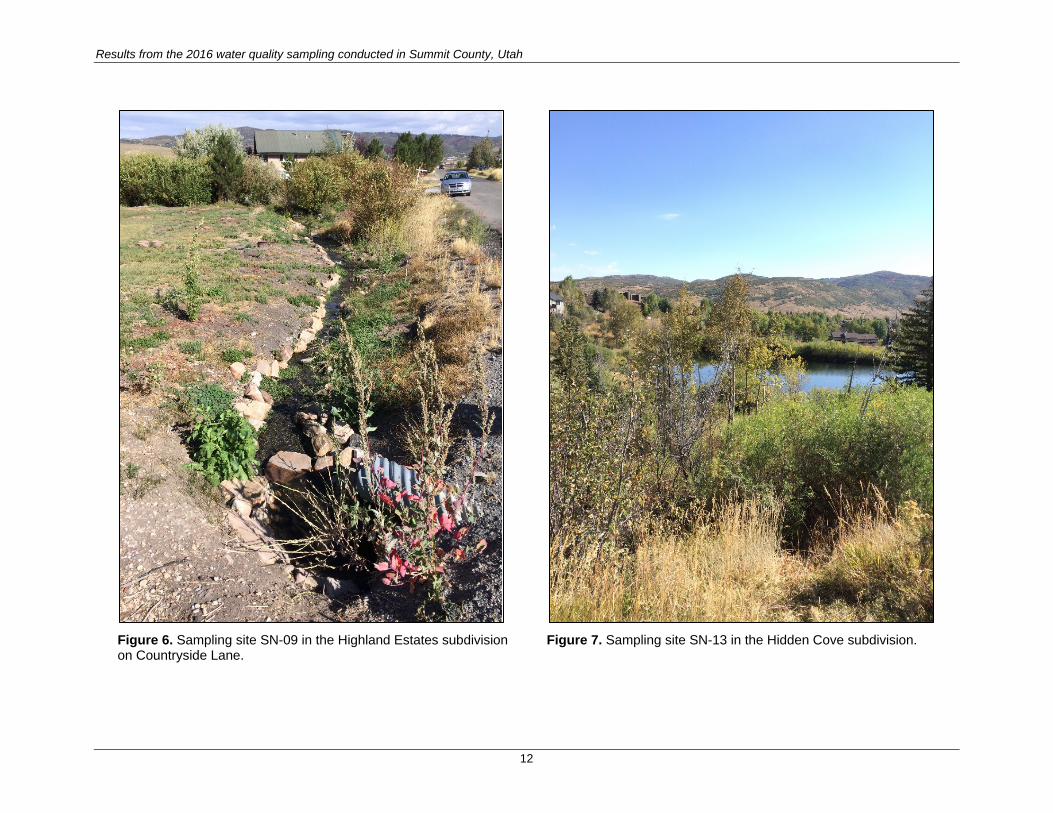
Results from the 2016 water quality sampling conducted in Summit County, Utah
12
Figure 6. Sampling site SN-09 in the Highland Estates subdivision on Countryside Lane.
Figure 7. Sampling site SN-13 in the Hidden Cove subdivision.

Results from the 2016 water quality sampling conducted in Summit County, Utah
13
Results from the MST sampling indicate that there is fecal contamination from warm-blooded mammals (possibly including humans) in many of the surface waters of Snyderville Basin and eastern Summit County. Strong consideration should be given to the fact that these samples represent a single site at a single point in time, and spatiotemporal variability has proven to be great for the Bacteroides indicator (Bower et al. 2005; Nnane et al. 2011). Our sampling efforts resulted in fecal contamination at all sites, but we were unable to detect human-sourced fecal contamination. Given that human source markers can be transient, in their absence, it is important to consider other lines of evidence such as nitrate, E. coli, GenBAC, in addition to the results of spatial analyses.
CONCLUSIONS The results of this sampling event provide evidence for the following:
• Surface waters in Snyderville Basin have higher nitrate concentrations than surface waters in eastern Summit County, indicating a more developed landscape.
o It should be noted that contamination in eastern Summit County surface waters may be diluted by the larger volume of water.
• Septic systems in the Highland Estates and Hidden Cove subdivisions are likely contributing nitrate and E. coli to surface waters. SN-09, SN-11, and SN-13 should be further investigated because of the high probability of septic contamination.
Our next step in this analysis is to combine the results of water sampling with a spatial analysis of landscape-level parameters used in siting conventional septic systems into one final report. We will first look forward to discussing this letter with you in person and incorporating your input into the final report.
If you have any questions regarding this report in the interim, please do not hesitate to contact me at (801) 322-4307 or at [email protected].
Sincerely,
Dave Epstein Water Resource Specialist, SWCA Environmental Consultants
Results from the 2016 Water Quality Sampling Conducted in Summit County, Utah
14
LITERATURE CITED Bower, P.A., C.O. Scopel, E.T. Jensen, M.M. Depas, and S.L. McLellan. 2005. Detection of genetic
markers of fecal indicator bacteria in Lake Michigan and determination of their relationship to Escherichia coli densities using standard microbial methods. Applied and Environmental Microbiology 71:8305–8313.
Nnane, D.E., J.E. Ebdon, and H.D. Taylor. 2011. Integrated analysis of water quality parameters for cost-effective faecal pollution management in river catchments. Water Resources 45:2235–2246.
Tetra Tech Inc. 2011. Using Microbial Source Tracking to Support TMDL Development and Implementation. Available at: www.epa.gov/region10/pdf/tmdl/mst_for_tmdls_guide_04_22_11.pdf. Accessed June 8, 2016.
U.S. Environmental Protection Agency (EPA). 2010. Method B: Bacteroidales in Water by TaqMan Quantitative Polymerase Chain Reaction Assay. Available at: http://water.epa.gov/scitech/methods/cwa/bioindicators/upload/methodb2010.pdf. Accessed June 8, 2016.
Weather Underground. 2016. Park City, Utah. Available at: https://www.wunderground.com/us/ut/heber-city/zmw:84060.1.99999. Accessed July 8, 2016.