summer session 11 august 2011. active vs. passive remote sensing passive: record em energy that was...
TRANSCRIPT

Imaging RADAR Principles and Applications
Lecture 9
Summer Session11 August 2011
Active vs. Passive Remote SensingPassive: record EM energy that was reflected or
emitted from the surface of the earthWhat we’ve talked about thus far…
Active: create their own energy and are not dependent on the sun’s energy or the thermal properties of the earth. This EM energy is:1. transmitted from the sensor toward the terrain
(and is largely unaffected by the atmosphere)2. interacts with the terrain producing a backscatter
of energy3. is recorded by the remote sensor’s receiver

Active Microwave, Passive Microwave, and LIDARActive Microwave: (RADAR) based on the
transmission of long wavelength microwave energy through the atmosphere and then recording the amount of energy backscattered from the terrain.
Passive Microwave (microwave radiometers): records microwave energy that is naturally emitted from the earth’s surface
LIDAR (Light Detection and Ranging): based on the transmission of relatively short wavelength laser light; records the amount of energy backscattered from the terrain
Microwave RadiometersLand and water surfaces not only emit EM
energy that can be detected in thermal IR wavelengths, but also in microwave wavelengths (1 cm to > 1 m)
Microwave radiometers have the ability to measure the brightness temperature (TB) of the earth’s surface


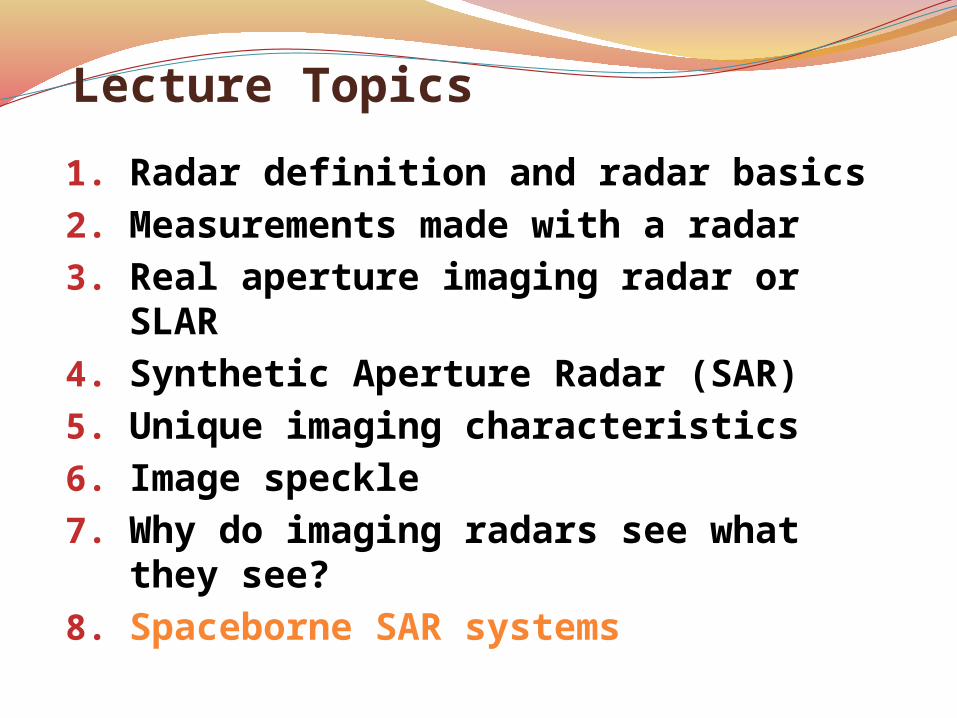
Lecture Topics1. Radar definition and radar basics2. Measurements made with a radar3. Real aperture imaging radar or SLAR4. Synthetic Aperture Radar (SAR)5. Unique imaging characteristics6. Image speckle7. Why do imaging radars see what they
see?8. Spaceborne SAR systems

RADAR – Radio Detection and RangingRADAR systems were invented in the
1930sA high powered, radio
transmitter/receiver system was developed that would transmit a signal that was reflected from a distant object, and then detected by the receiver
Thus, RADAR’s initial function was to detect and determine the range to a targetThe initial focus of radar systems was to detect
ships and airplanes
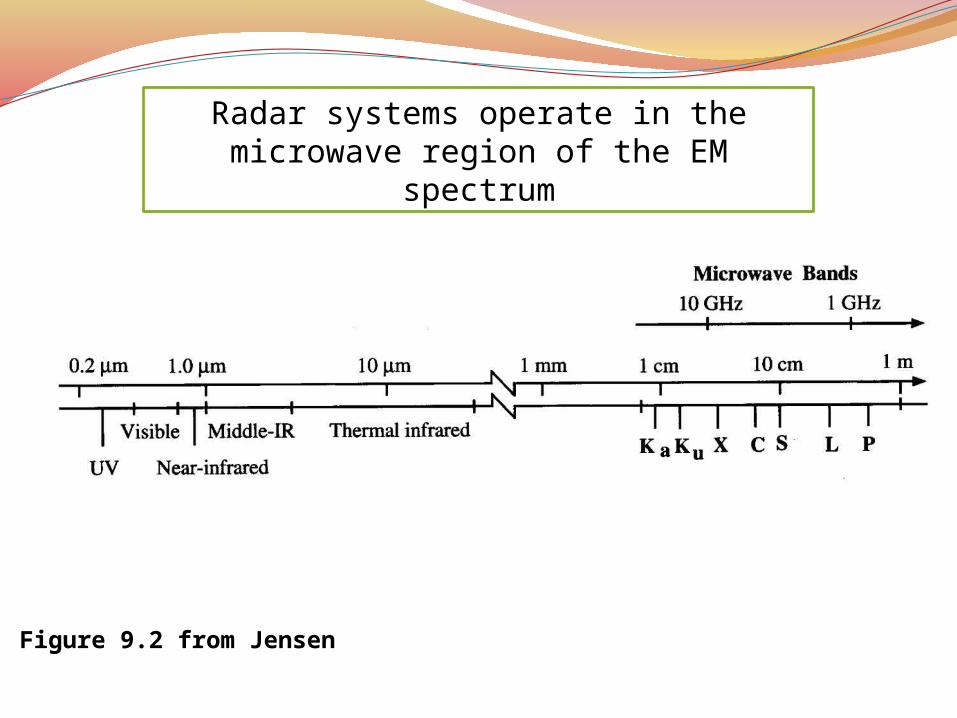
Radar systems operate in the microwave region of the EM spectrum
Figure 9.2 from Jensen

Radars typically have wavelengths between .5 cm and 100 cm
In the early days of radar development, the military wanted to keep the wavelengths that radars were being operated at a secretTherefore, they gave different wavelengths
specific letter designationsThus, X-band is a 3 cm wavelengthC band is a 6 cm wavelengthL band is a 24 cm wavelength

Common Radar BandsBand Frequency Wavelength (most
common)
X 8 to 12 GHz 2.5 to 4.0 cm (3.0 cm)
C 4 to 8 GHz 4 to 8 cm (6.0 cm)
L 1 to 2 GHz 15 to 30 cm (24.0 cm)
P 0.3 to 1 GHz 30 to 100 cm (65 cm)

Wavelength or Frequency?Earth resource scientists generally describe
RADAR systems by their wavelengthEngineers describe radar systems by their
frequencyHOWEVER, since wavelength and frequency
are related it really doesn’t matter how they are described as long as you remember:3x10⁸m/sec = wavelength*frequency ORWavelength (cm) = 30/frequency (GHz) [approx.]

Key Characteristics of RADAR SystemsDesigners select the wavelength and
polarization combinations for the RADAR systems (can have multiple wavelengths / polarizations in same system)
Radars operate independently of solar illumination conditions – day or night, it doesn’t matter
Radars operate independently of cloud cover and most rainfall – only the heaviest downpours will attenuate microwave wavelengths used in imaging radar systems
Primary Advantages of RADARActive microwave energy penetrates clouds and can be an
all-weather remote sensing system.
Coverage can be obtained at user-specified times, even at night.
Permits imaging at shallow look angles, resulting in different perspectives that cannot always be obtained using aerial photography.
Senses in wavelengths outside the visible and infrared regions of the electromagnetic spectrum, providing information on surface roughness, dielectric properties, and moisture content.

Secondary Advantages of RADAR May penetrate vegetation, sand, and surface layers of snow. Has its own illumination, and the angle of illumination can be
controlled. Enables resolution to be independent of distance to the object, with
the size of a resolution cell being as small as 1 x 1 m. Images can be produced from different types of polarized energy
(HH, HV, VV, VH). May operate simultaneously in several wavelengths (frequencies)
and thus has multi-frequency potential. Can measure ocean wave properties, even from orbital altitudes. Can produce overlapping images suitable for stereoscopic viewing
and radargrammetry. Supports interferometric operation using two antennas for 3-D
mapping, and analysis of incident-angle signatures of objects.
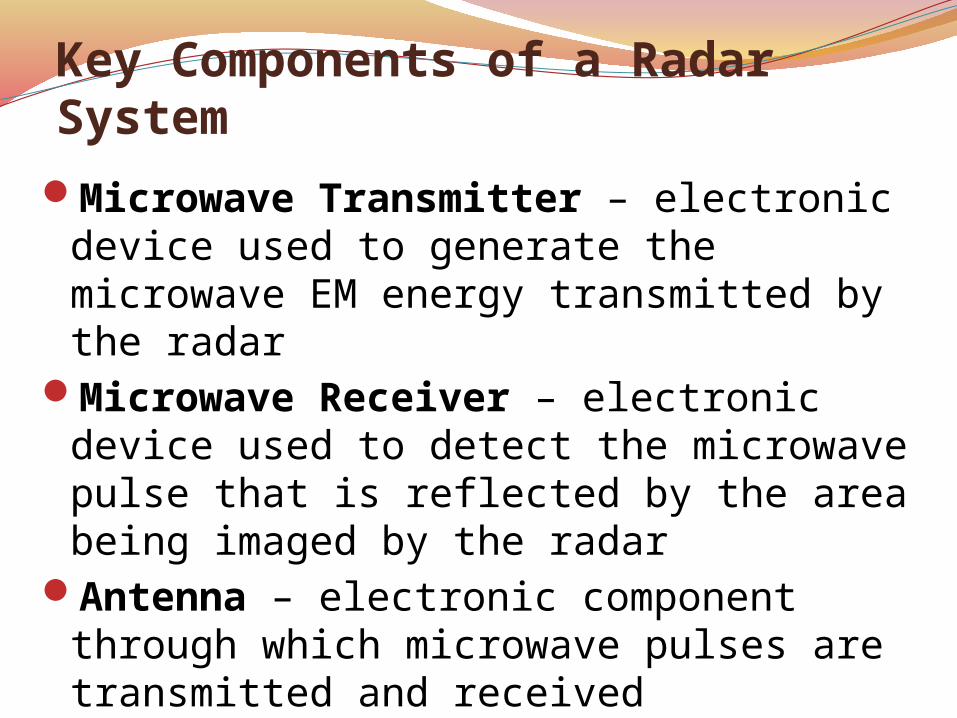
Key Components of a Radar SystemMicrowave Transmitter – electronic
device used to generate the microwave EM energy transmitted by the radar
Microwave Receiver – electronic device used to detect the microwave pulse that is reflected by the area being imaged by the radar
Antenna – electronic component through which microwave pulses are transmitted and received

Microwave Transmitter / Receiver
Antenna
Microwave EM energy pulse transmitted by the radar
Microwave EM energy pulse reflected from a target that will be detected by the radar
Target
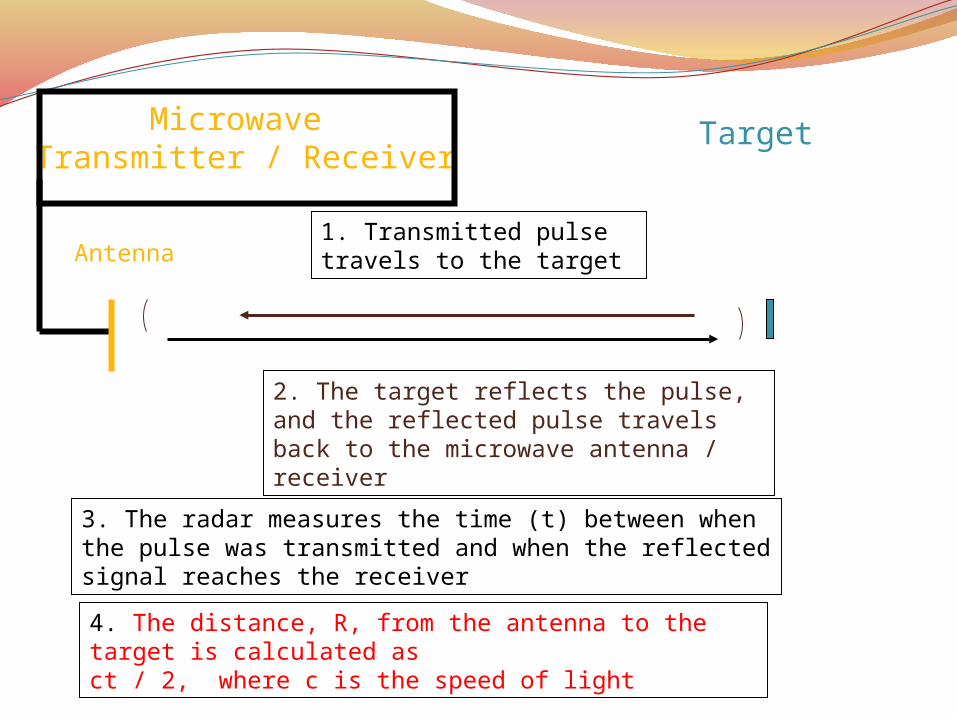
Microwave Transmitter / Receiver
1. Transmitted pulse travels to the target
Target
2. The target reflects the pulse, and the reflected pulse travels back to the microwave antenna / receiver
3. The radar measures the time (t) between when the pulse was transmitted and when the reflected signal reaches the receiver
Antenna
4. The distance, R, from the antenna to the target is calculated as ct / 2, where c is the speed of light
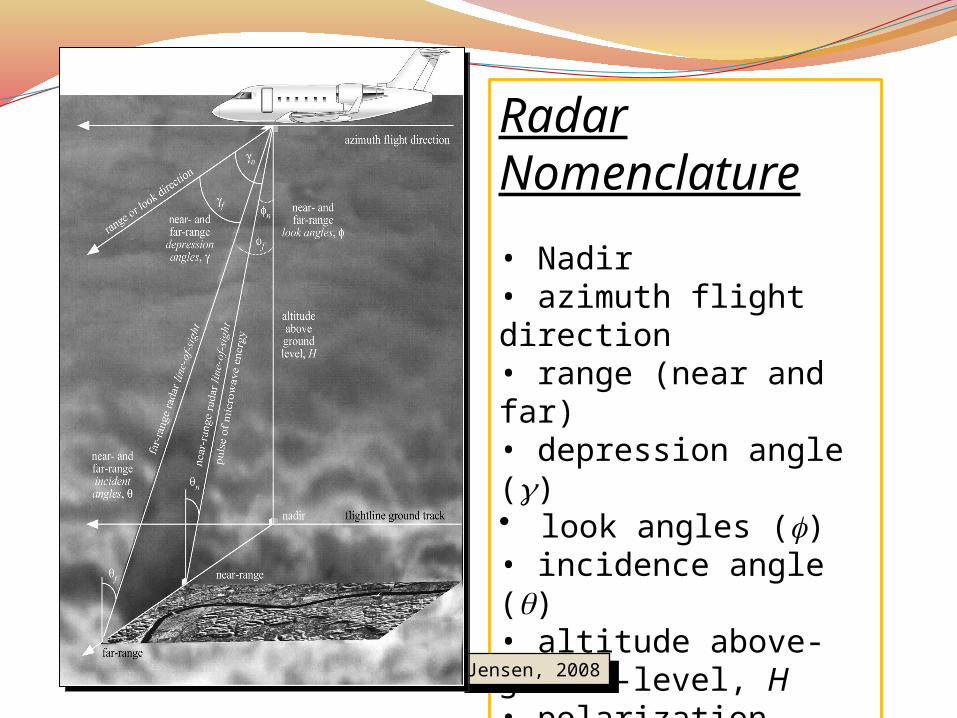
Radar Nomenclature
• Nadir• azimuth flight direction• range (near and far)• depression angle ()• look angles (f)• incidence angle ()• altitude above-ground-level, H• polarization
Jensen, 2008Jensen, 2008
http://www.ccrs.nrcan.gc.ca/glossary/index_e.php?id=2830
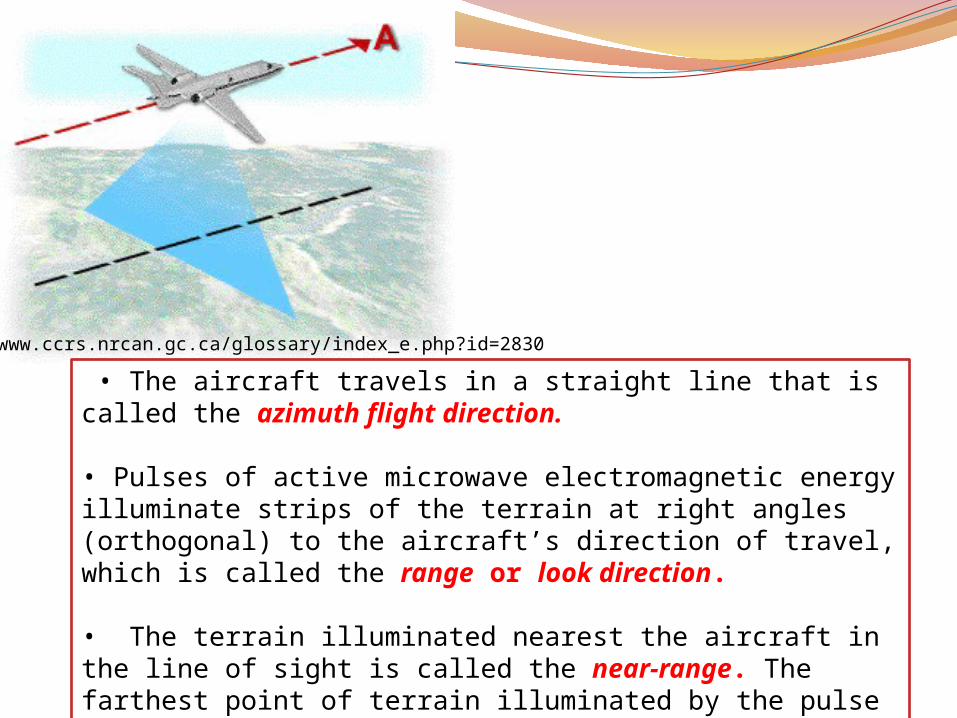
• The aircraft travels in a straight line that is called the azimuth flight direction.
• Pulses of active microwave electromagnetic energy illuminate strips of the terrain at right angles (orthogonal) to the aircraft’s direction of travel, which is called the range or look direction.
• The terrain illuminated nearest the aircraft in the line of sight is called the near-range. The farthest point of terrain illuminated by the pulse of energy is called the far-range.

http://www.ccrs.nrcan.gc.ca/glossary/index_e.php?id=2830
The range or look direction for any radar image is the direction of the radar illumination that is at right angles to the direction the aircraft or spacecraft is traveling.
• Generally, objects that trend (or strike) in a direction that is orthogonal (perpendicular) to the range or look direction are enhanced much more than those objects in the terrain that lie parallel to the look direction. Consequently, linear features that appear dark or are imperceptible in a radar image using one look direction may appear bright in another radar image with a different look direction.
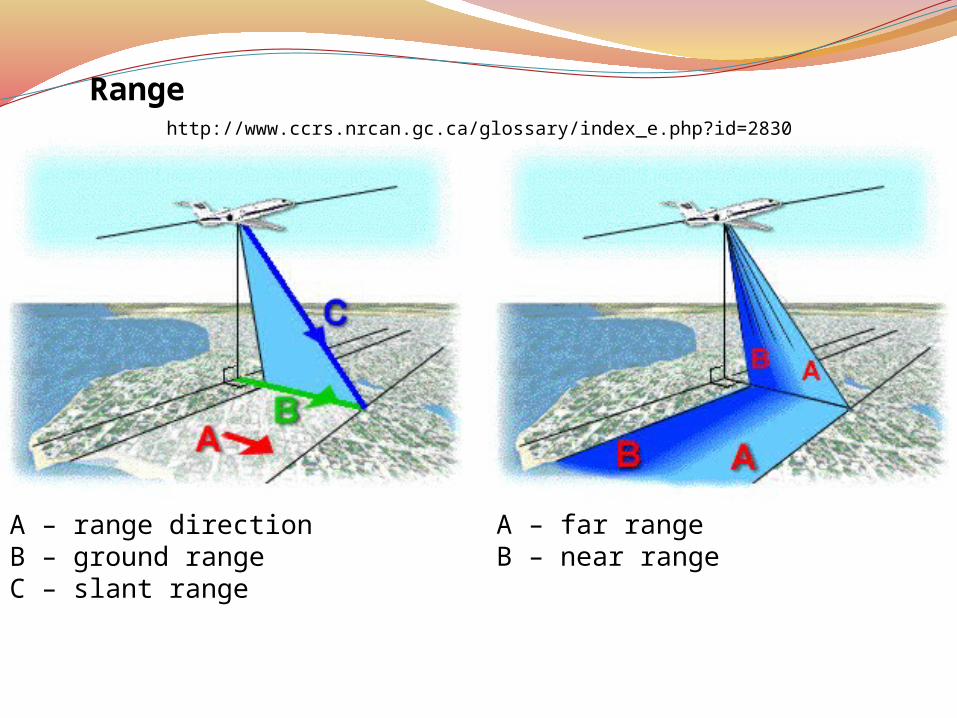
Range Direction:
A – range directionB – ground rangeC – slant range
A – far rangeB – near range
http://www.ccrs.nrcan.gc.ca/glossary/index_e.php?id=2830
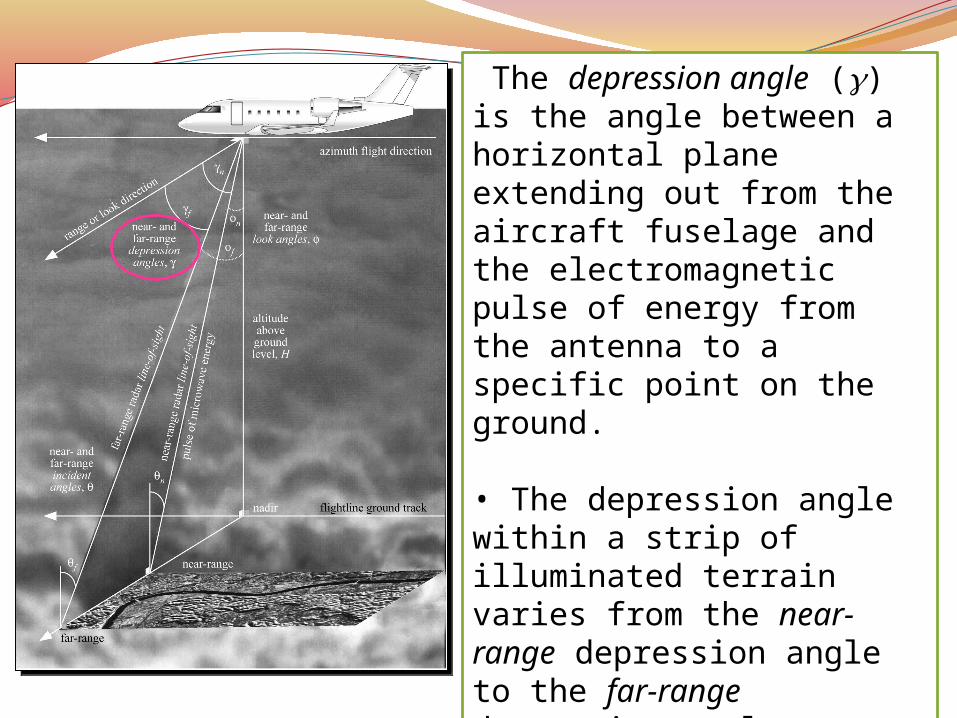
The depression angle (g) is the angle between a horizontal plane extending out from the aircraft fuselage and the electromagnetic pulse of energy from the antenna to a specific point on the ground.
• The depression angle within a strip of illuminated terrain varies from the near-range depression angle to the far-range depression angle.
Summaries of radar systems often only report the average depression angle.

The incident angle (q) is the angle between the radar pulse of EMR and a line perpendicular to the Earth’s surface where it makes contact.
The incident angle best describes the relationship between the radar beam and surface slope.
• The incident angle is assumed to be the complement of the depression angle.
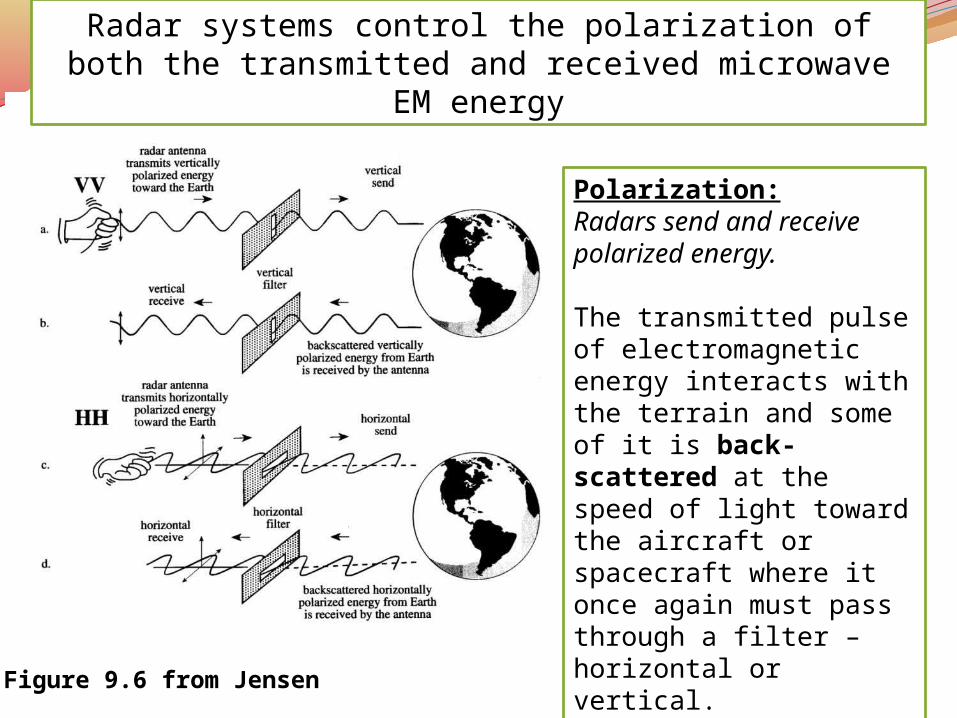
Radar systems control the polarization of both the transmitted and received microwave EM energy
Figure 9.6 from Jensen
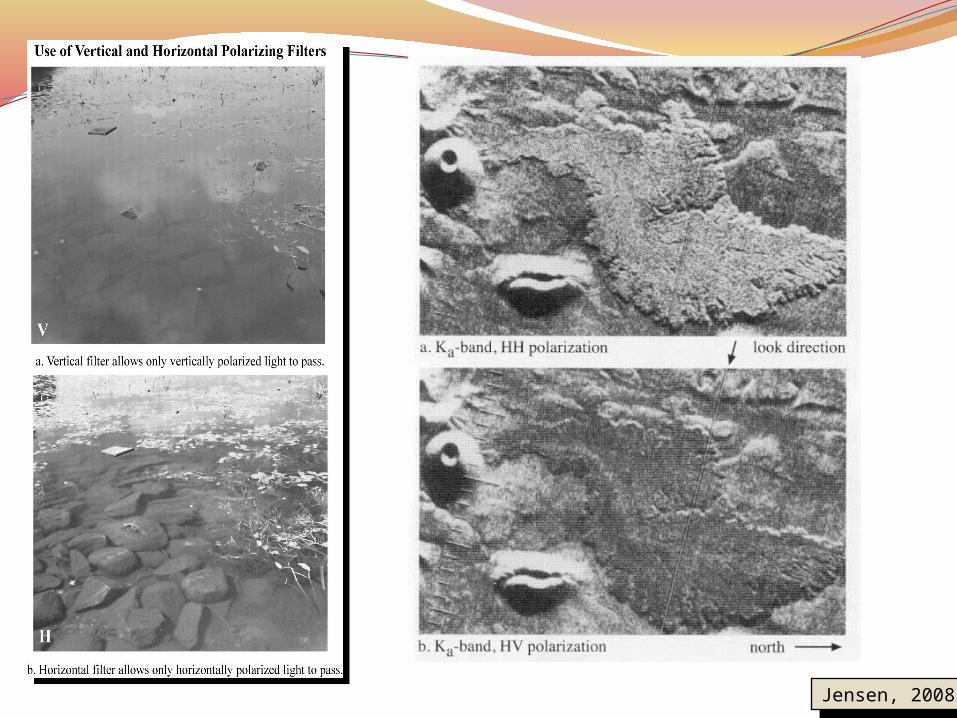
Polarization:Radars send and receive polarized energy.
The transmitted pulse of electromagnetic energy interacts with the terrain and some of it is back-scattered at the speed of light toward the aircraft or spacecraft where it once again must pass through a filter – horizontal or vertical.
Polarization combinations include: HH, VV, HV, and VH.
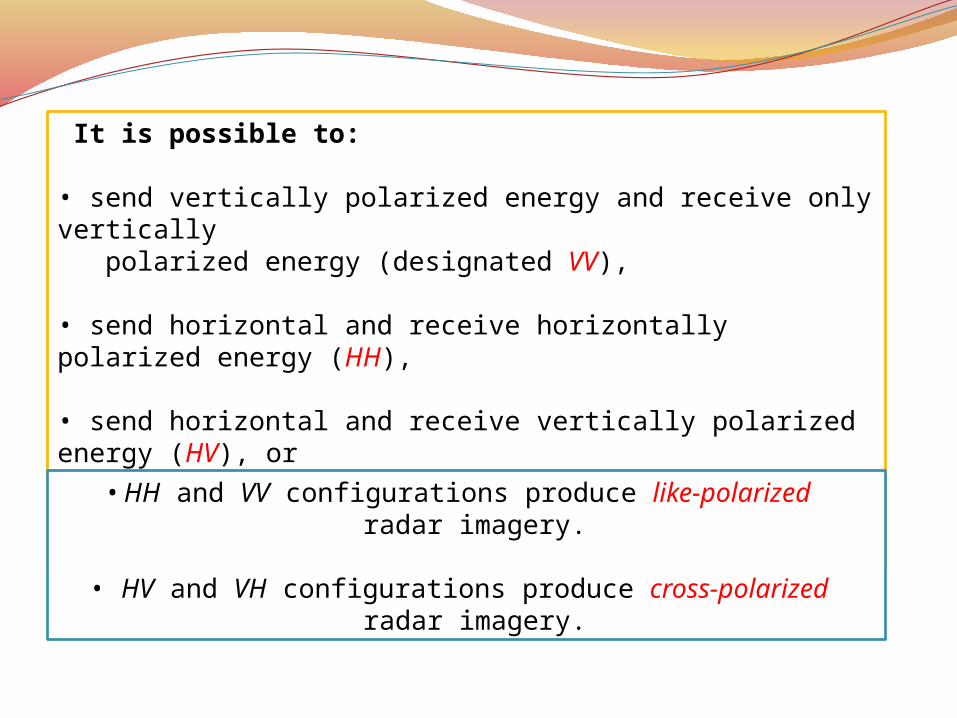
It is possible to:
• send vertically polarized energy and receive only vertically polarized energy (designated VV),
• send horizontal and receive horizontally polarized energy (HH), • send horizontal and receive vertically polarized energy (HV), or
• send vertical and receive horizontally polarized energy (VH).
• HH and VV configurations produce like-polarized radar imagery.
• HV and VH configurations produce cross-polarized radar imagery.
Jensen, 2008Jensen, 2008

Lecture Topics1. Radar definition and radar basics2. Measurements made with a radar3. Real aperture imaging radar or SLAR4. Synthetic Aperture Radar (SAR)5. Unique imaging characteristics6. Image speckle7. Why do imaging radars see what they
see?8. Spaceborne SAR systems
Measurements made with a simple radar
Range to the target (distance)
Intensity of the returned pulse
Spatial resolutionAzimuth resolutionRange resolution
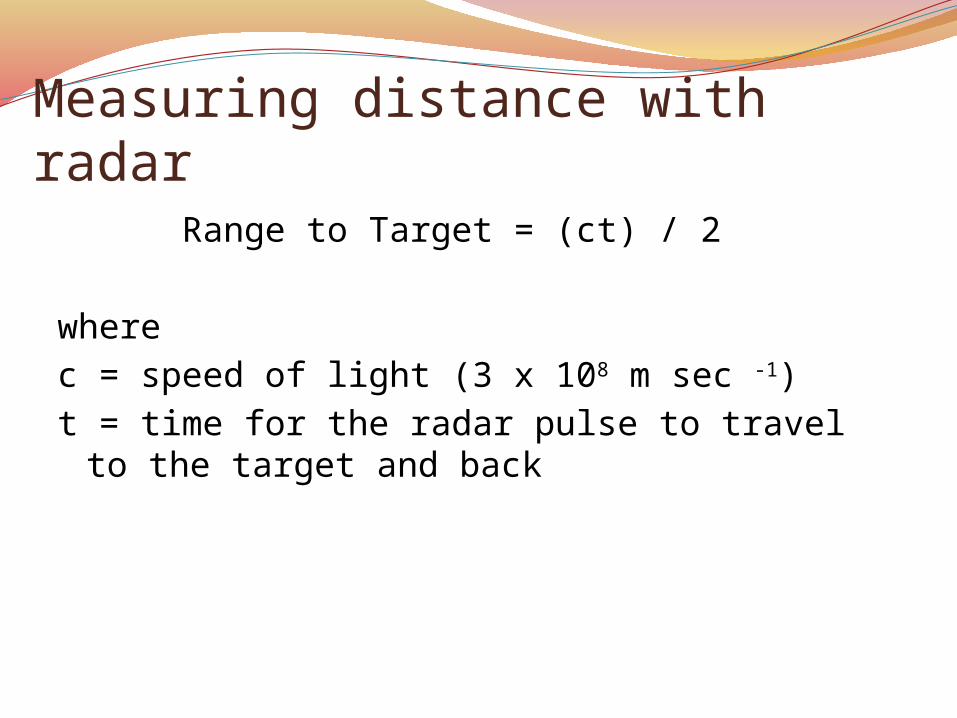
Measuring distance with radar Range to Target = (ct) / 2
wherec = speed of light (3 x 10⁸ m sec -1)t = time for the radar pulse to travel to the
target and back
Spatial Resolution (1)To determine the spatial resolution at any
point in a RADAR image, it is necessary to compute the resolution in two dimensions: the range and azimuth resolutions. Range = across track (length)Azimuth = along track (width)
The shorter the pulse length, the finer the range resolution. Pulse length is a function of the speed of light
(c) multiplied by the duration of the transmission (t).

Spatial Resolution (2)We must also compute the width of the
resolution element in the direction the aircraft or spacecraft is flying — the azimuth direction.
Azimuth resolution (Ra) is determined by computing the width of the terrain strip that is illuminated by the radar beam. A shorter wavelength pulse will result in improved
azimuth resolution (just like range resolution). BUT!! The shorter the wavelength, the poorer the
atmospheric and vegetation penetration capability.
Lecture Topics1. Radar definition and radar basics2. Measurements made with a radar3. Real aperture imaging radar or SLAR4. Synthetic Aperture Radar (SAR)5. Unique imaging characteristics6. Image speckle7. Why do imaging radars see what they
see?8. Spaceborne SAR systems

Side-Looking Airborne Radar (SLAR) Geometry
Size of the antenna is inversely proportional to the size of the angular beam width.
Smaller the angular beam width, the higher the azimuth resolution.
Therefore, the size of the antenna determines azimuth resolution.
Lecture Topics
1. Radar definition and radar basics2. Measurements made with a radar3. Real aperture imaging radar or
SLAR4. Synthetic Aperture Radar (SAR)5. Unique imaging characteristics6. Image speckle7. Why do imaging radars see what
they see?8. Spaceborne SAR systems
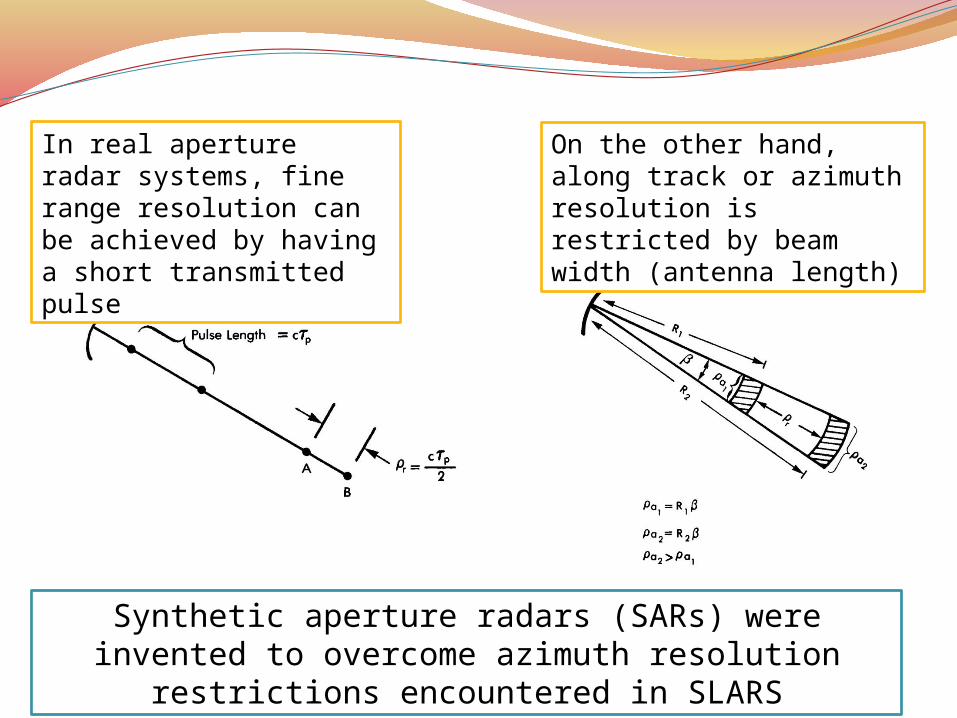
In real aperture radar systems, fine range resolution can be achieved by having a short transmitted pulse
On the other hand, along track or azimuth resolution is restricted by beam width (antenna length)
Synthetic aperture radars (SARs) were invented to overcome azimuth resolution restrictions
encountered in SLARS
Synthetic Aperture Radar (SAR)Engineers have developed procedures to
synthesize a very long antenna electronically
SAR technology basically makes a relatively small antenna work like it is much largerThis is done by taking advantage of the
aircraft’s motionDoing so allows for much finer spatial
resolution in the azimuth direction even at large distances from the earth’s surface
Lecture Topics1. Radar definition and radar basics2. Measurements made with a radar3. Real aperture imaging radar or SLAR4. Synthetic Aperture Radar (SAR)5. Unique imaging characteristics6. Image speckle7. Why do imaging radars see what they
see?8. Spaceborne SAR systems
Unique Characteristics of Radar Imagery
1. Slant vs. Ground Range Geometry
2. Relief displacement• Radar foreshortening • Radar layover
3. Radar shadowing

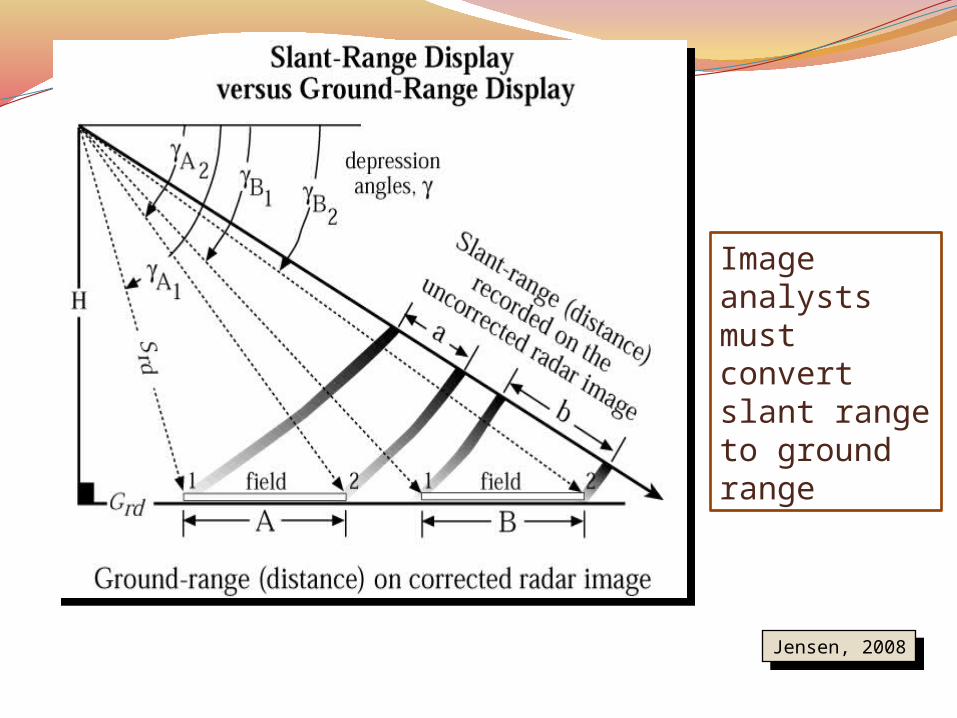
Slant vs. Ground Range GeometryRadar imagery has a different geometry than that
produced by most conventional remote sensor systemsOne must be very careful when attempting to make
radargrammetric measurements• Uncorrected radar imagery is displayed in what is
called slant-range geometry, i.e., it is based on the actual distance from the radar to each of the respective features in the scene.
It is possible to convert the slant-range display into the true ground-range display on the x-axis so that features in the scene are in their proper planimetric (x,y) position relative to one another in the final radar image.
Jensen, 2008Jensen, 2008
Jensen, 2008Jensen, 2008
Image analysts must convert slant range to ground range
Jensen, 2008Jensen, 2008
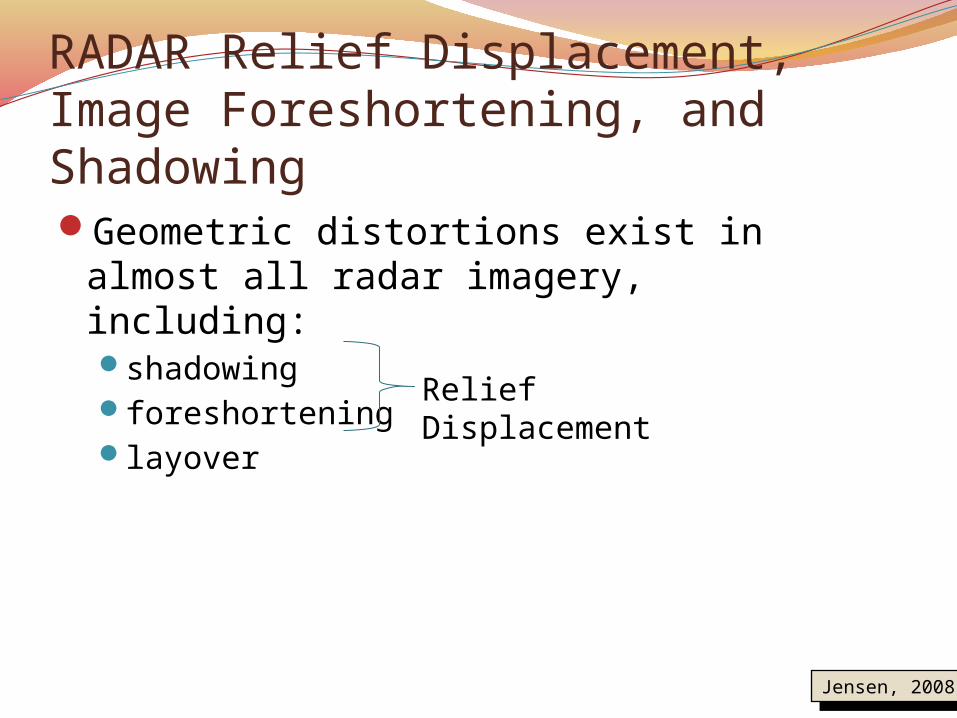
RADAR Relief Displacement, Image Foreshortening, and ShadowingGeometric distortions exist in almost all
radar imagery, including:shadowingforeshortening layover
Relief Displacement

RADAR Shadows- Shadows in RADAR images can enhance the geomorphology and texture of the terrain. - Shadows can also obscure the most
important features in a radar image, such as the information behind tall buildings or land use in deep valleys.
Jensen, 2008Jensen, 2008
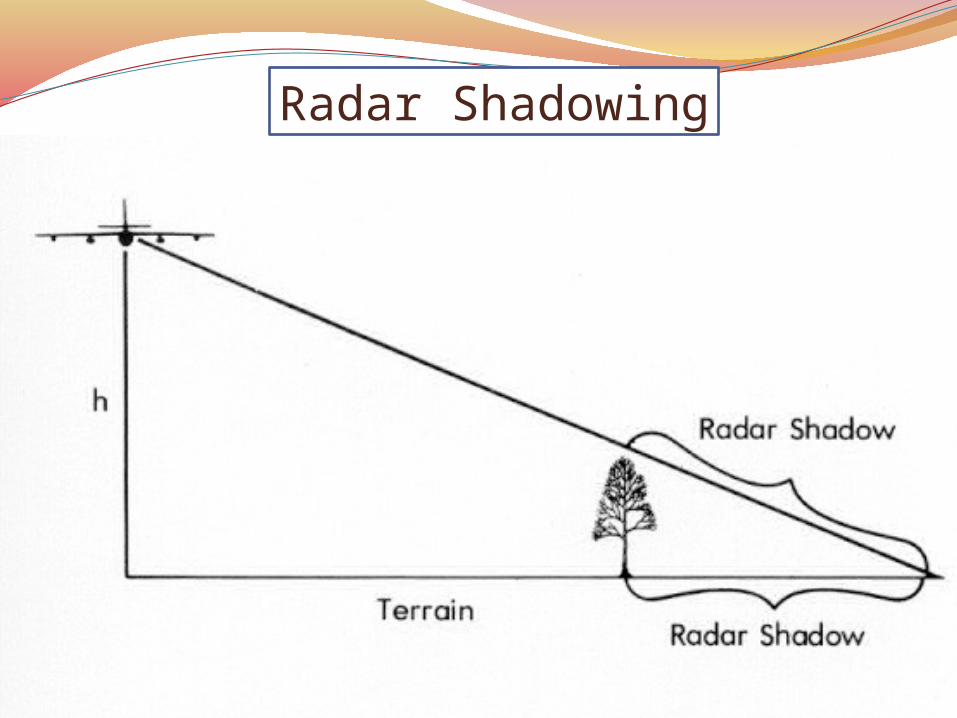
Radar Shadowing
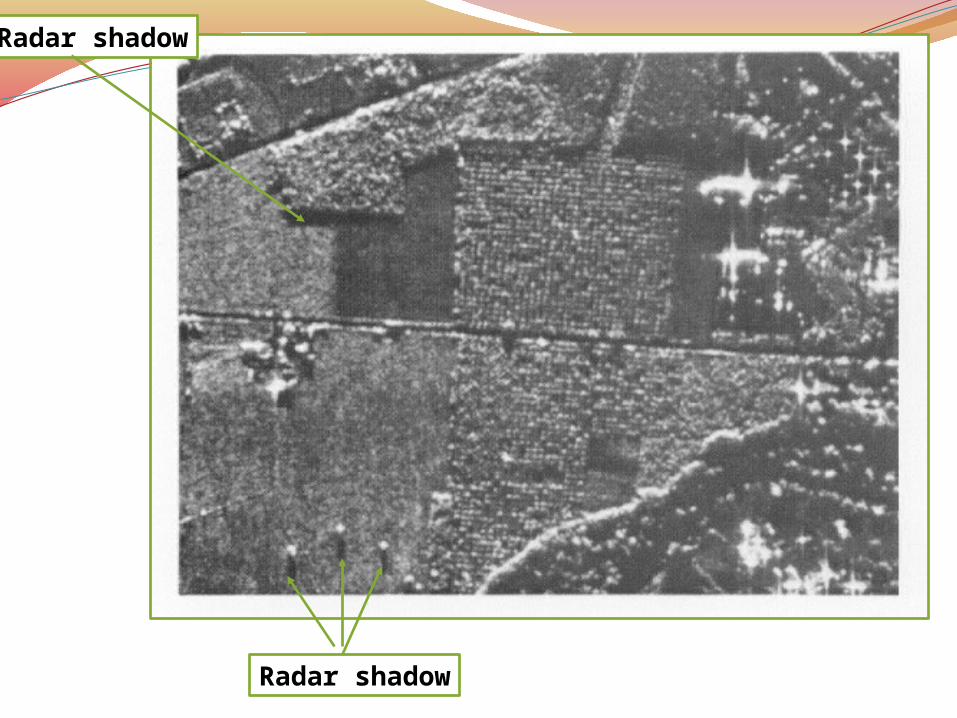
Radar shadow
Radar shadow
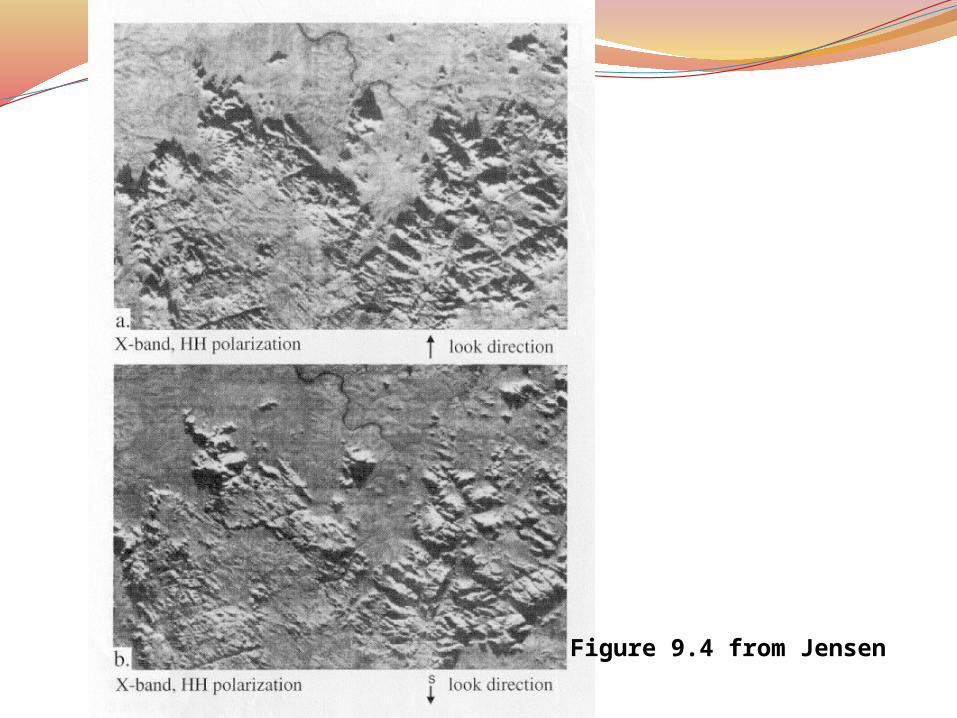
Figure 9.4 from Jensen
Relief DisplacementHorizontal displacement of an object that occurs due to an object’s height or elevation
• The higher the object, the closer it is to the radar antenna and therefore the sooner it is detected by the radar
• Tops of objects are therefore recorded before the bottoms of objects causing displacement.
This displacement is in the direction toward the radar antenna.

Relief Displacement

Foreshortening
Jensen, 2008Jensen, 2008
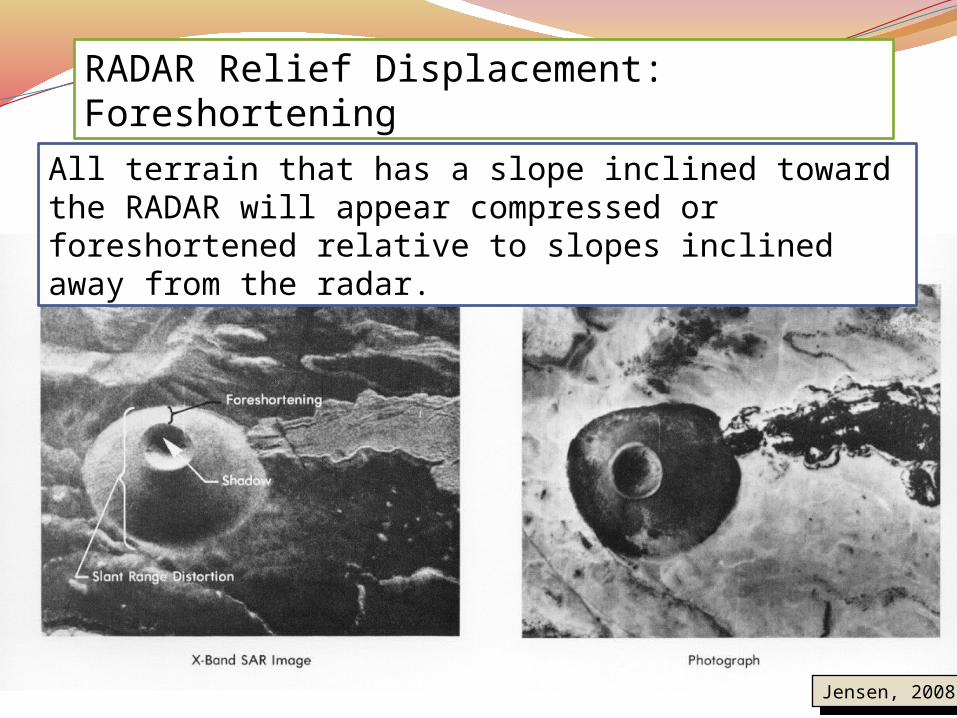
RADAR Relief Displacement: Foreshortening
All terrain that has a slope inclined toward the RADAR will appear compressed or foreshortened relative to slopes inclined away from the radar.
Jensen, 2008Jensen, 2008
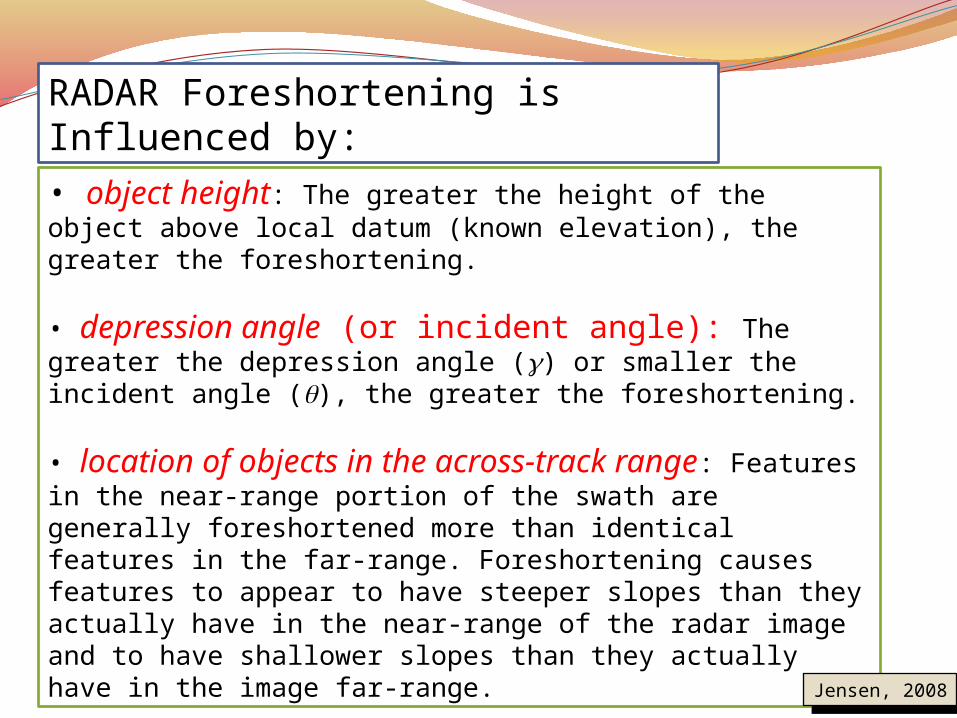
RADAR Foreshortening is Influenced by:• object height: The greater the height of the object above local datum (known elevation), the greater the foreshortening.
• depression angle (or incident angle): The greater the depression angle (g) or smaller the incident angle (q), the greater the foreshortening.
• location of objects in the across-track range: Features in the near-range portion of the swath are generally foreshortened more than identical features in the far-range. Foreshortening causes features to appear to have steeper slopes than they actually have in the near-range of the radar image and to have shallower slopes than they actually have in the image far-range.
Jensen, 2008Jensen, 2008

• Layover is an extreme form of relief displacement
• It occurs in hilly and mountainous regions, where the tops of mountains appear closer to the RADAR than the bottoms
• This distortion cannot be corrected even when the surface topography is known. Great care must be exercised when interpreting radar images of mountainous areas where the thresholds for image layover exist.
RADAR Layover

Jensen, 2008Jensen, 2008
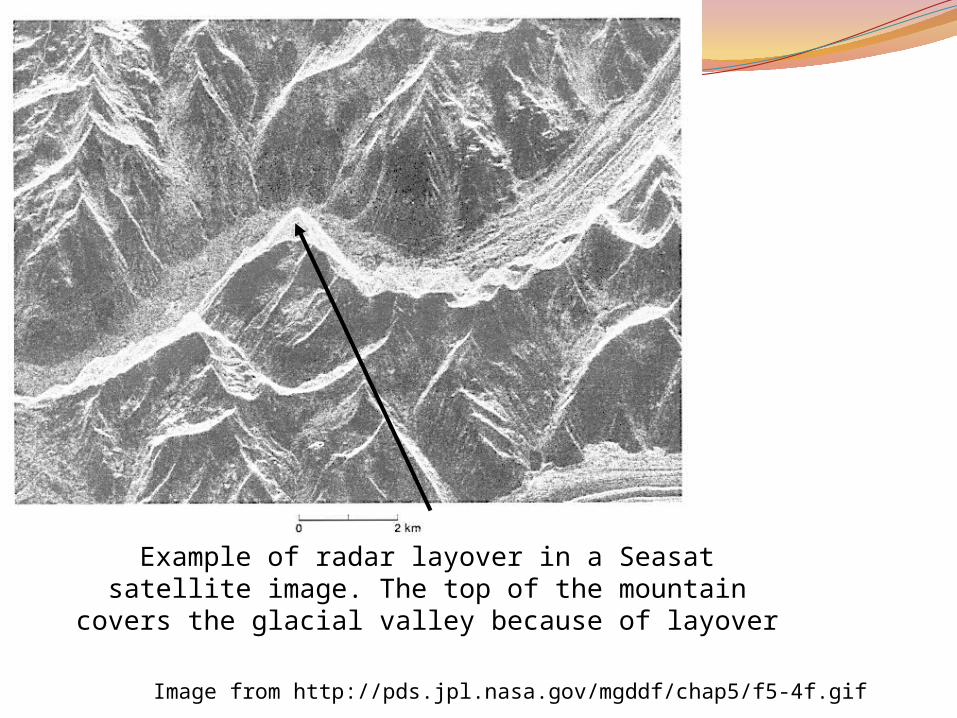
Image from http://pds.jpl.nasa.gov/mgddf/chap5/f5-4f.gif
Example of radar layover in a Seasat satellite image. The top of the mountain covers the glacial
valley because of layover
Lecture Topics1. Radar definition and radar basics2. Measurements made with a radar3. Real aperture imaging radar or
SLAR4. Synthetic Aperture Radar (SAR)5. Unique imaging characteristics6. Image speckle7. Why do imaging radars see what
they see?8. Spaceborne SAR systems
-1.5
-1
-0.5
0
0.5
1
1.5
0 100 200 300 400 500 600 700 800
-1.5
-1
-0.5
0
0.5
1
1.5
0 100 200 300 400 500 600 700 800
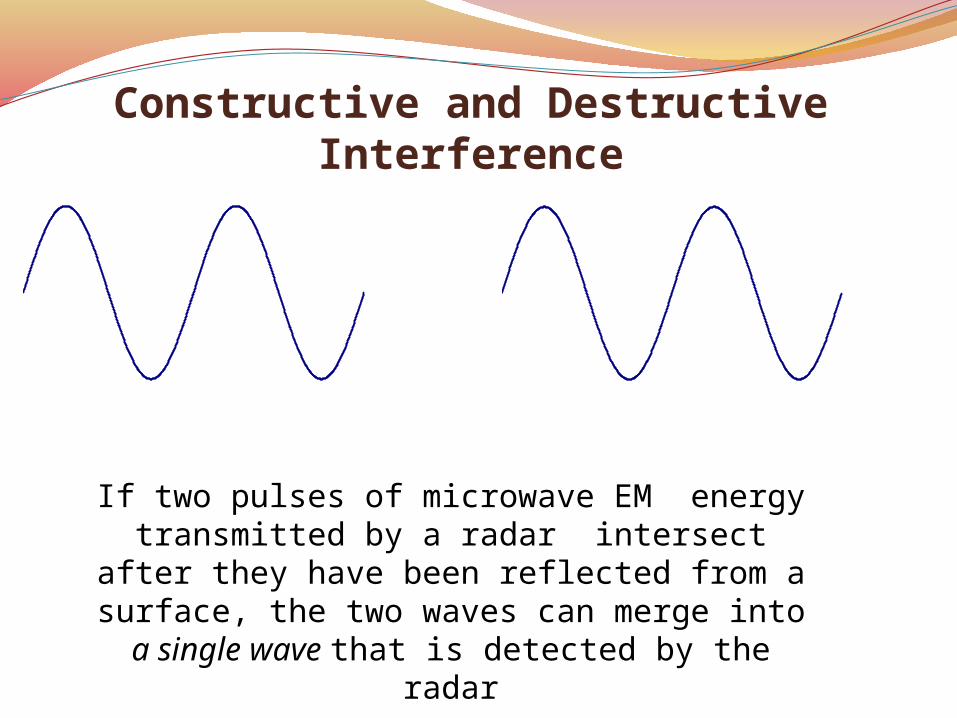
Constructive and Destructive Interference
If two pulses of microwave EM energy transmitted by a radar intersect after they have been reflected from a surface, the two waves can merge into a single wave that is
detected by the radar
-1.5
-1
-0.5
0
0.5
1
1.5
0 100 200 300 400 500 600 700 800
-1.5
-1
-0.5
0
0.5
1
1.5
0 100 200 300 400 500 600 700 800
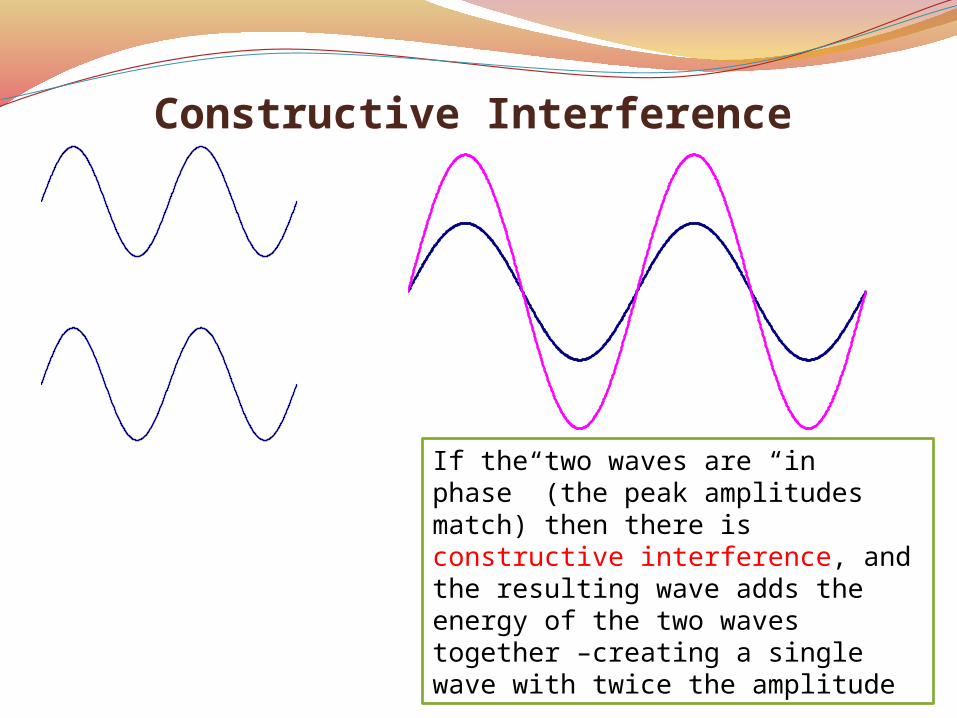
Constructive Interference
If the two waves are “in phase” (the peak amplitudes match) then there is constructive interference, and the resulting wave adds the energy of the two waves together –creating a single wave with twice the amplitude
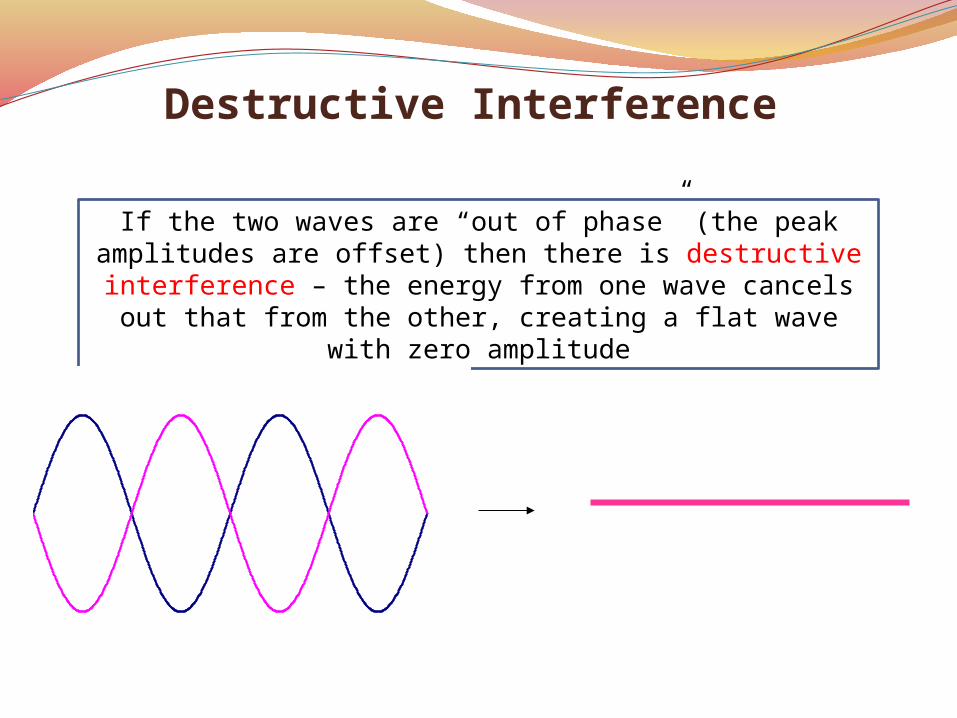
Destructive Interference
If the two waves are “out of phase” (the peak amplitudes are offset) then there is destructive interference – the energy from one wave cancels out that from the other,
creating a flat wave with zero amplitude
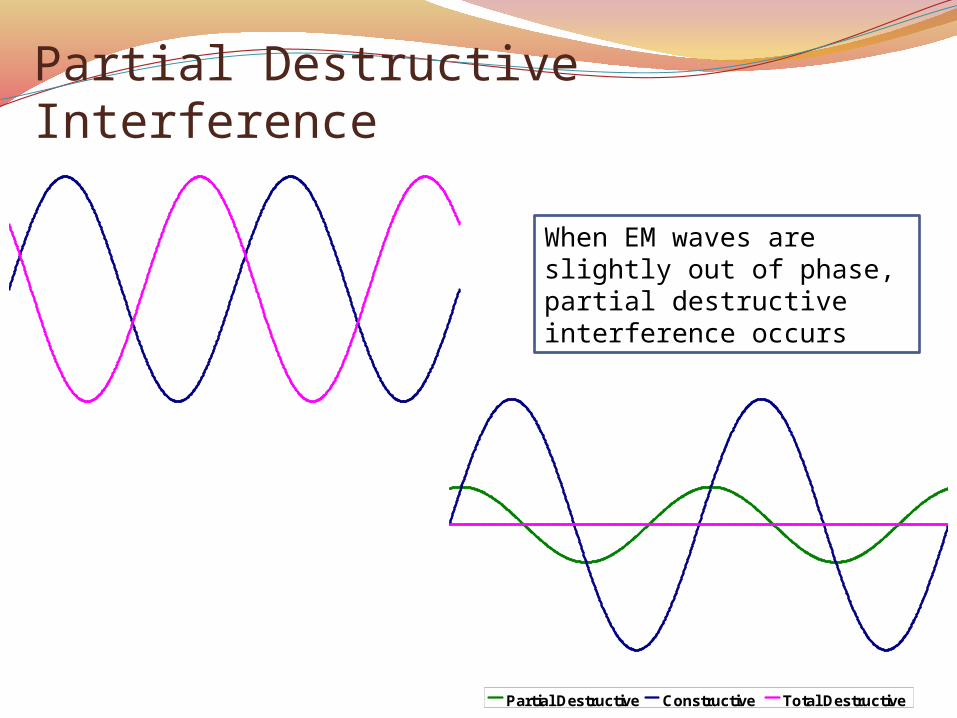
Partial Destructive Interference
Partial Destructive Constructive Total Destructive
When EM waves are slightly out of phase, partial destructive interference occurs

RADAR Image Speckle
Partial Destructive Constructive Total Destructive
Areas with similar land or water cover can have a very “salt and pepper” appearance on radar imagery
because of constructive and destructive interference between reflected microwave EM waves – This
phenomena is called radar image speckle.
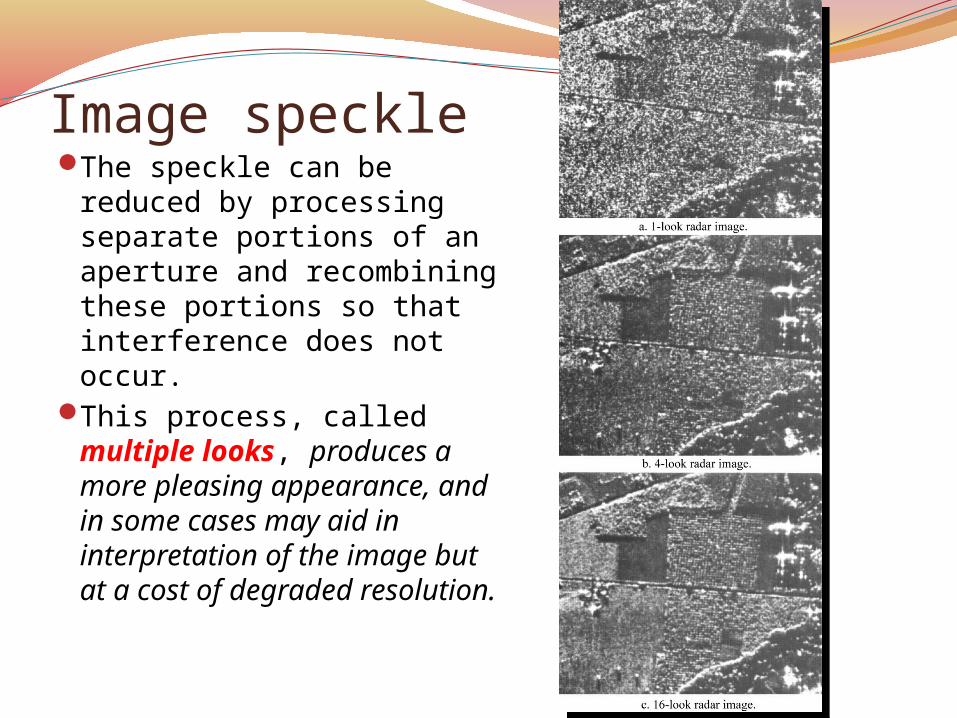
Image speckleThe speckle can be reduced
by processing separate portions of an aperture and recombining these portions so that interference does not occur.
This process, called multiple looks, produces a more pleasing appearance, and in some cases may aid in interpretation of the image but at a cost of degraded resolution.
Lecture Topics1. Radar definition and radar basics2. Measurements made with a radar3. Real aperture imaging radar or
SLAR4. Synthetic Aperture Radar (SAR)5. Unique imaging characteristics6. Image speckle7. Why do imaging radars see what
they see?8. Spaceborne SAR systems
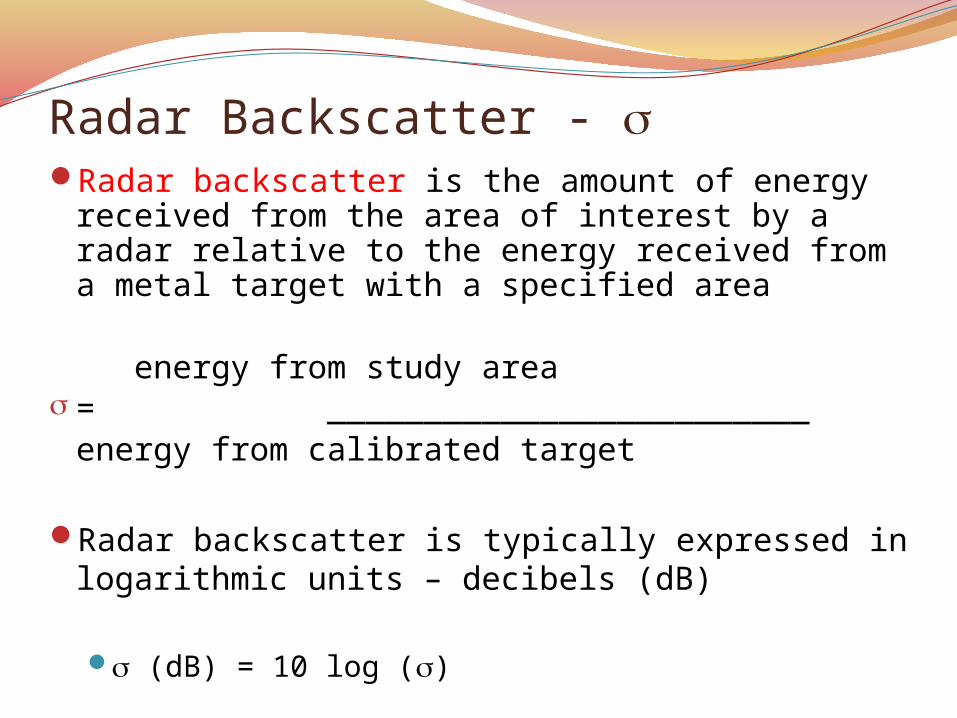
Radar Backscatter - Radar backscatter is the amount of energy
received from the area of interest by a radar relative to the energy received from a metal target with a specified area
energy from study area
s = _________________________energy from calibrated target
Radar backscatter is typically expressed in logarithmic units – decibels (dB)
(dB) = 10 log ()

Factors affecting RADAR backscatterSurface characteristicsSurface roughnessSurface dielectric constantStructural complexity
RADAR CharacteristicsWavelengthPolarizationIncidence angle
Types of Backscattering/Surface Reflectance
Specular reflection or scatteringNo return
Diffuse reflection or scatteringLots of return
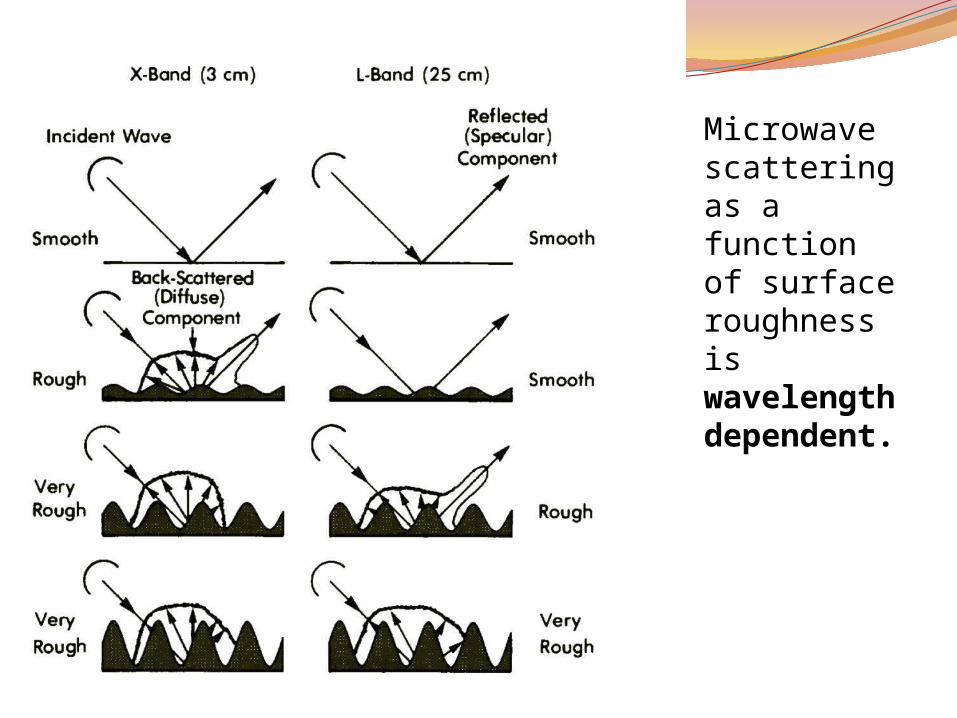
Microwave scattering as a function of surface roughness is wavelength dependent.
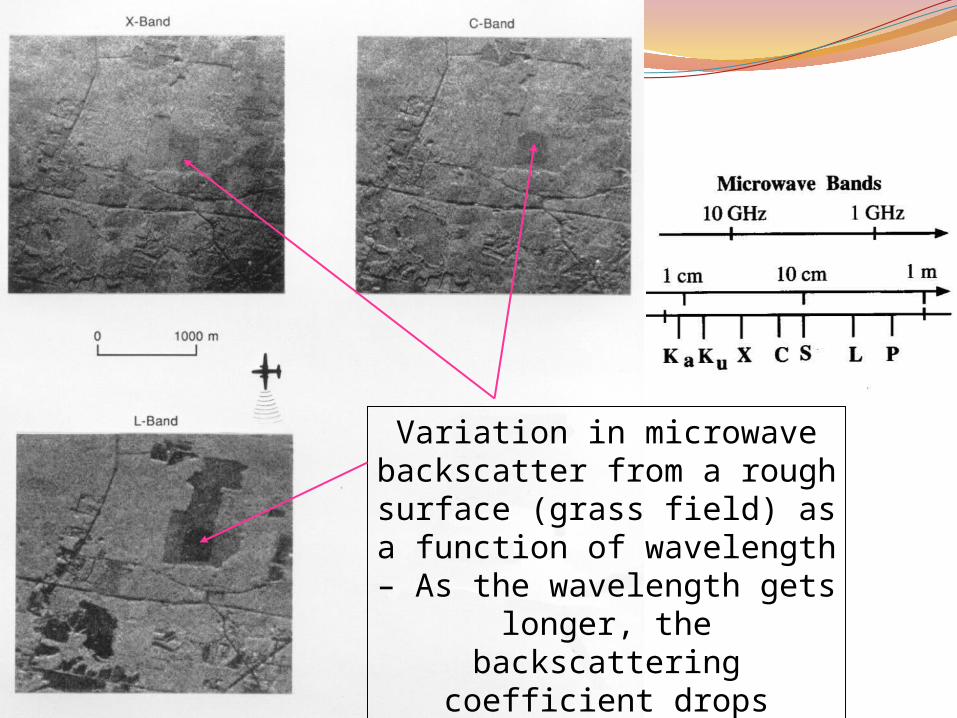
Variation in microwave backscatter from a rough surface (grass field) as a
function of wavelength – As the wavelength gets longer,
the backscattering coefficient drops
Figures from http://pds.jpl.nasa.gov/
mgddf/chap5/f5-4f.gif
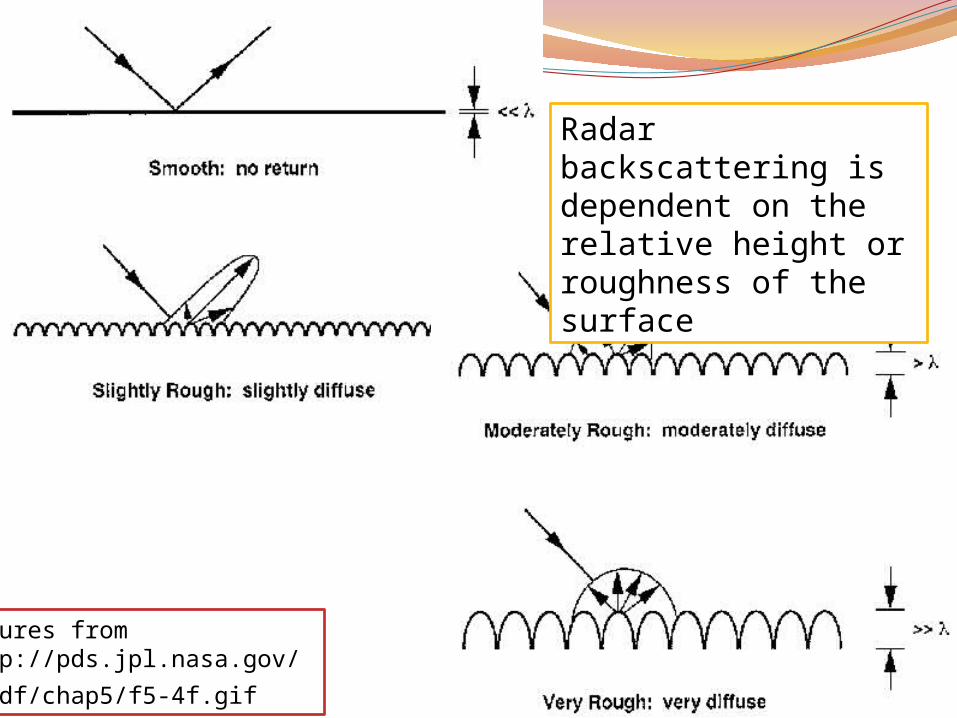
Radar backscattering is dependent on the relative height or roughness of the surface
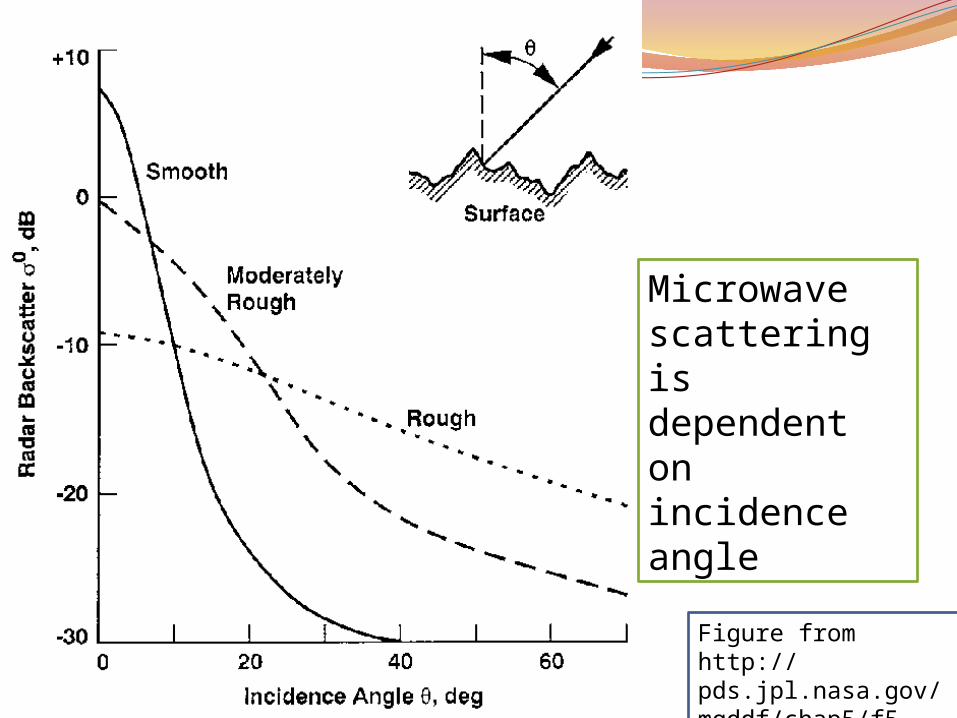
Figure from http://pds.jpl.nasa.gov/ mgddf/chap5/f5-
4f.gif
Microwave scattering is dependent on incidence angle

Dielectric ConstantThe dielectric constant is a measure of
the electrical conductivity of a material
To some degree, dielectric constants are dependent on microwave wavelength and polarization
The most significant parameter influencing a material’s dielectric constant is moisture content
Degree of back-scattering by an object or surface is proportional to the
dielectric constant of the material
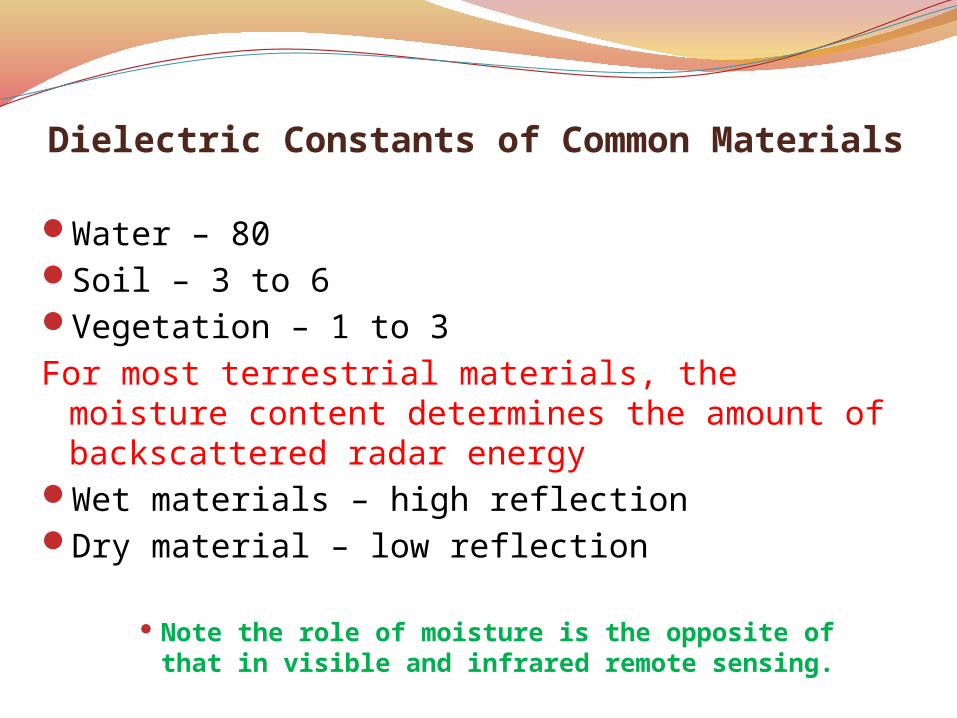
Dielectric Constants of Common Materials
Water – 80Soil – 3 to 6Vegetation – 1 to 3For most terrestrial materials, the moisture
content determines the amount of backscattered radar energy
Wet materials – high reflectionDry material – low reflection
Note the role of moisture is the opposite of that in visible and infrared remote sensing.

Vegetation and Structural ComplexityVegetation is a complex scattering medium.
Not all microwave energy is scattered back to the radar from the vegetation itself,
Some is transmitted through the vegetation and is scattered by the ground.
However, the level of scattering & transmission are dependent on
wavelength polarization
vegetation structure
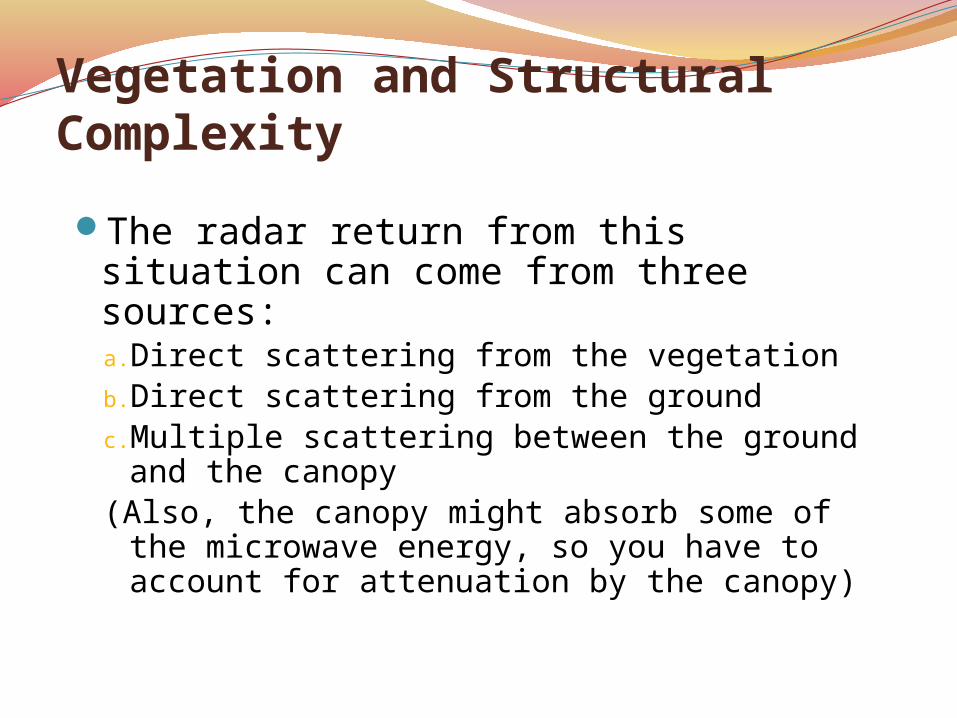
Vegetation and Structural Complexity
The radar return from this situation can come from three sources:a. Direct scattering from the vegetationb. Direct scattering from the groundc. Multiple scattering between the ground and
the canopy(Also, the canopy might absorb some of the
microwave energy, so you have to account for attenuation by the canopy)
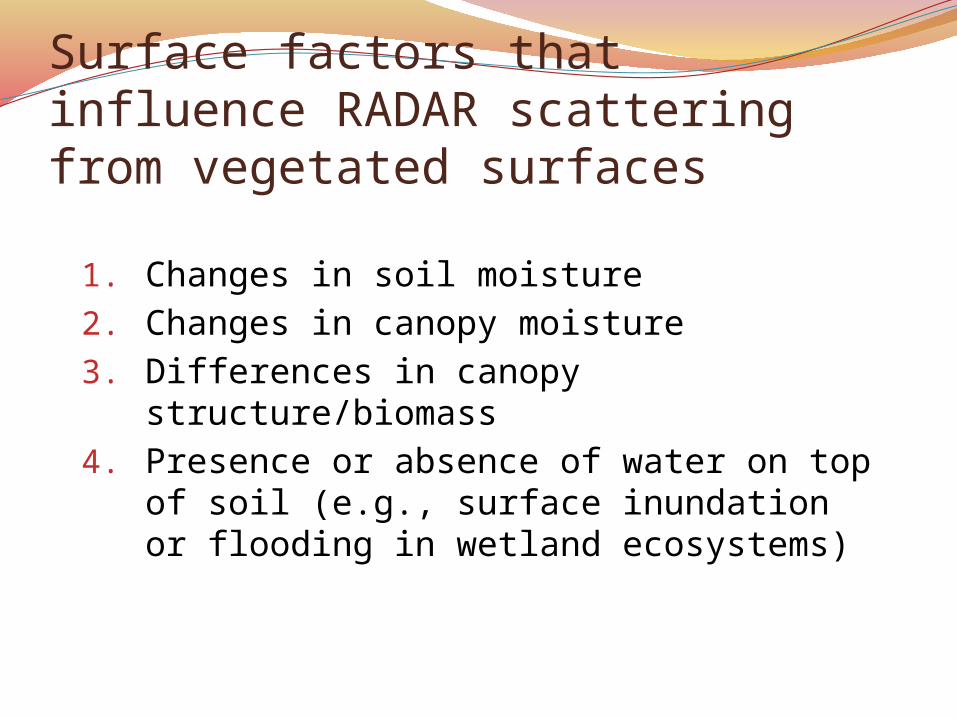
Surface factors that influence RADAR scattering from vegetated surfaces
1. Changes in soil moisture2. Changes in canopy moisture3. Differences in canopy structure/biomass4. Presence or absence of water on top of
soil (e.g., surface inundation or flooding in wetland ecosystems)
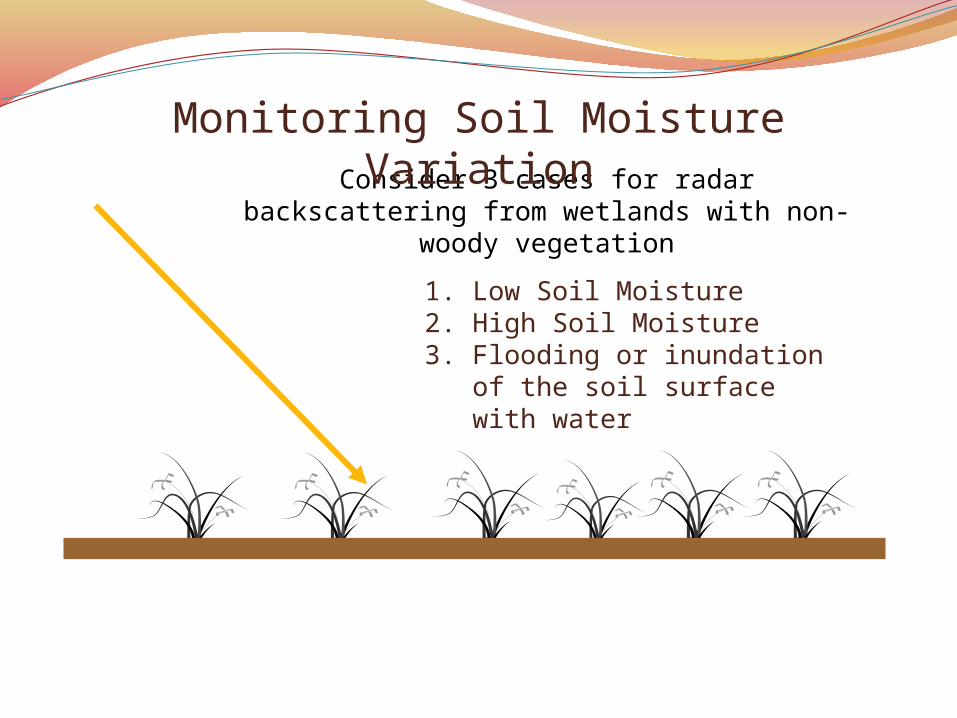
Consider 3 cases for radar backscattering from wetlands with non-woody vegetation
1. Low Soil Moisture2. High Soil Moisture3. Flooding or inundation of
the soil surface with water
Monitoring Soil Moisture Variation
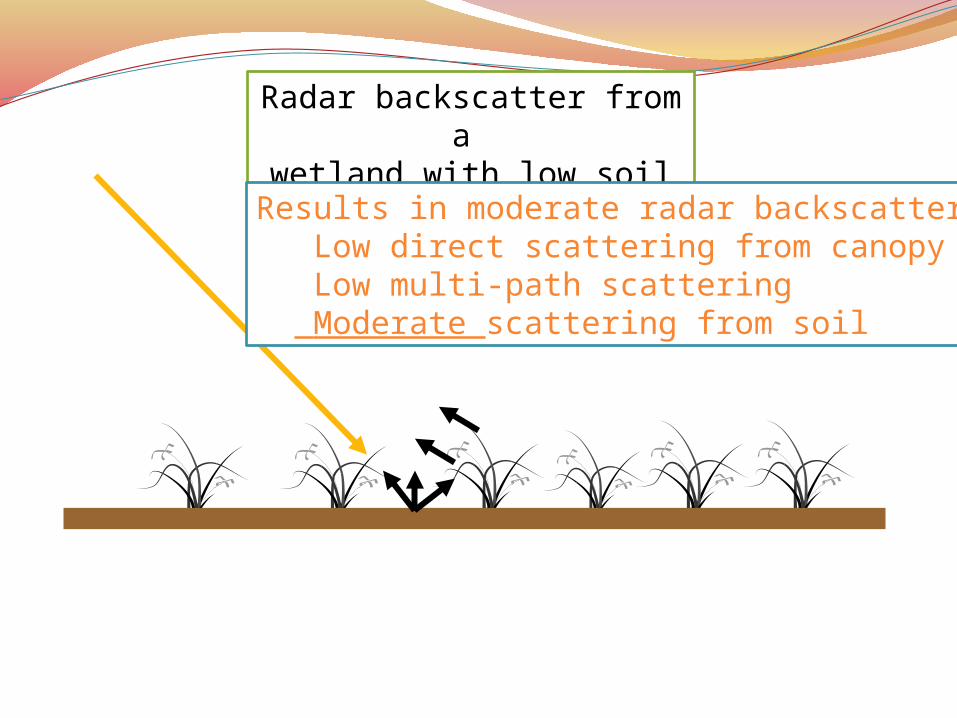
Radar backscatter from a wetland with low soil
moistureResults in moderate radar backscatter Low direct scattering from canopy Low multi-path scattering Moderate scattering from soil

Radar backscatter from a wetland with high soil
moistureResults in high radar backscatter Low direct scattering from canopy Low multi-path scattering High scattering from soil
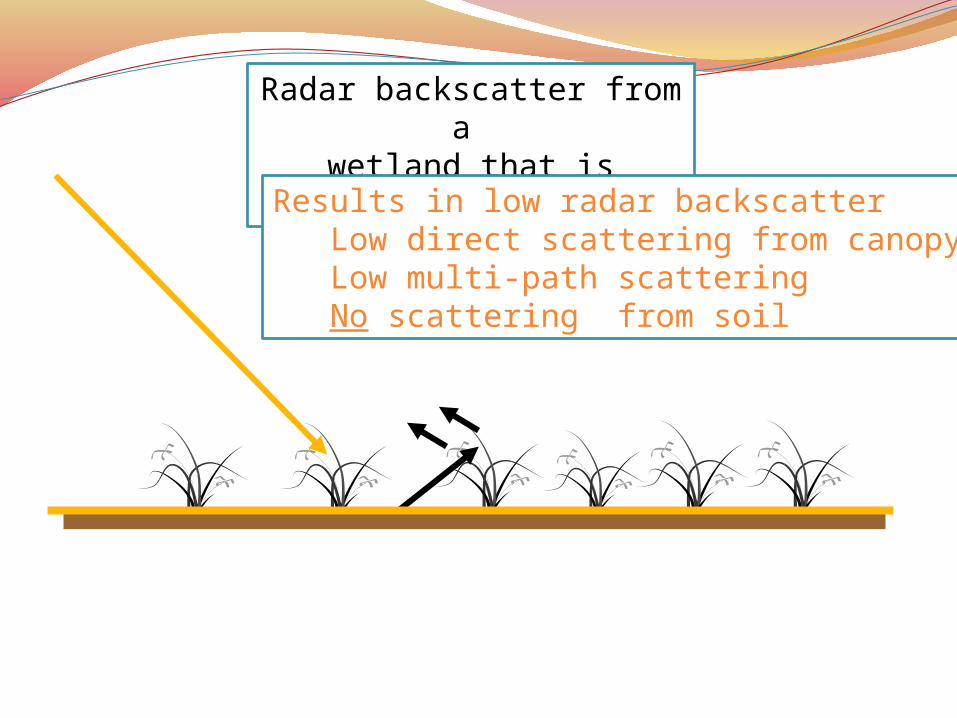
Radar backscatter from a wetland that is flooded
Results in low radar backscatter Low direct scattering from canopy Low multi-path scattering No scattering from soil

Areas that have exposed, but moist soils during the dry season
Regions that are flooded during the wet season
Lecture Topics
1. Radar definition and radar basics2. Measurements made with a radar3. Real aperture imaging radar or
SLAR4. Synthetic Aperture Radar (SAR)5. Unique imaging characteristics6. Image speckle7. Why do imaging radars see what
they see?8. Spaceborne SAR systems

Primary Spaceborne SAR SystemsSeasatSIR-CERS-1/ERS-2JERS-1RadarsatEnvisat
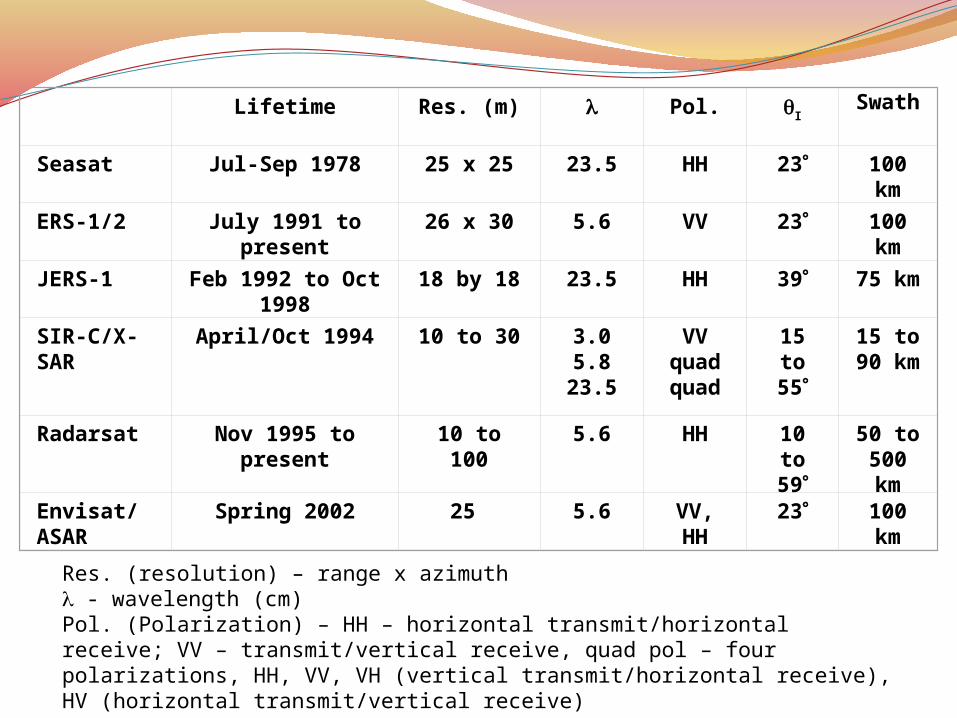
Lifetime Res. (m) Pol. ISwath
Seasat Jul-Sep 1978 25 x 25 23.5 HH 23 100 km
ERS-1/2 July 1991 to present
26 x 30 5.6 VV 23 100 km
JERS-1 Feb 1992 to Oct 1998
18 by 18 23.5 HH 39 75 km
SIR-C/X-SAR
April/Oct 1994 10 to 30 3.05.8
23.5
VVquadquad
15 to 55
15 to90 km
Radarsat Nov 1995 to present
10 to 100
5.6 HH 10 to59
50 to 500 km
Envisat/ASAR
Spring 2002 25 5.6 VV,HH
23 100 km
Res. (resolution) – range x azimuth - wavelength (cm)Pol. (Polarization) – HH – horizontal transmit/horizontal receive; VV – transmit/vertical receive, quad pol – four polarizations, HH, VV, VH (vertical transmit/horizontal receive), HV (horizontal transmit/vertical receive)
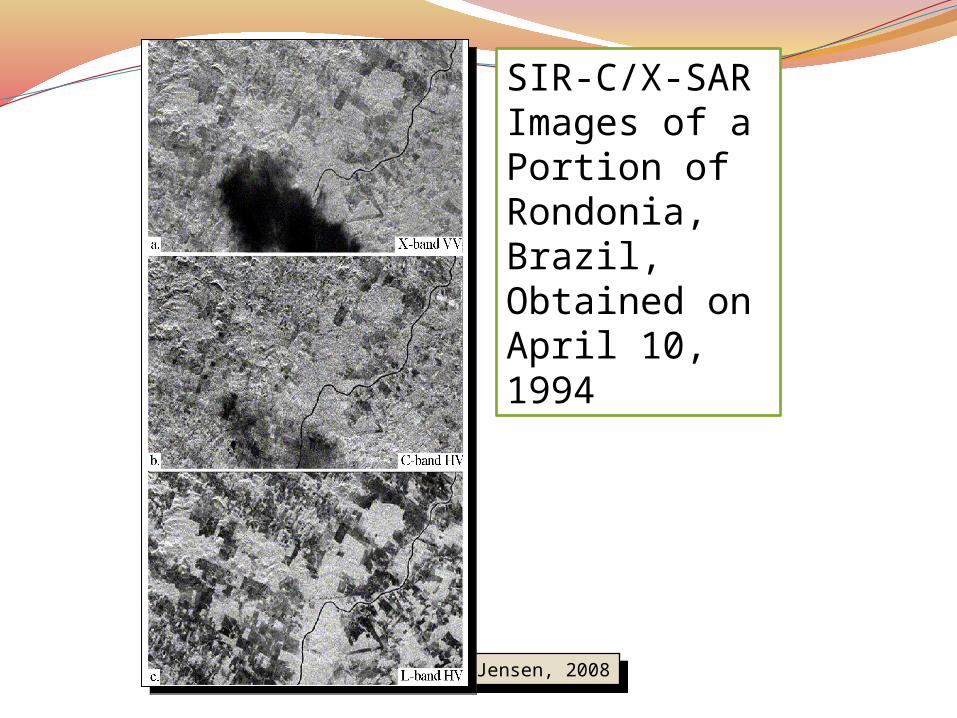
SIR-C/X-SAR Images of a Portion of Rondonia, Brazil, Obtained on April 10, 1994
Jensen, 2008Jensen, 2008
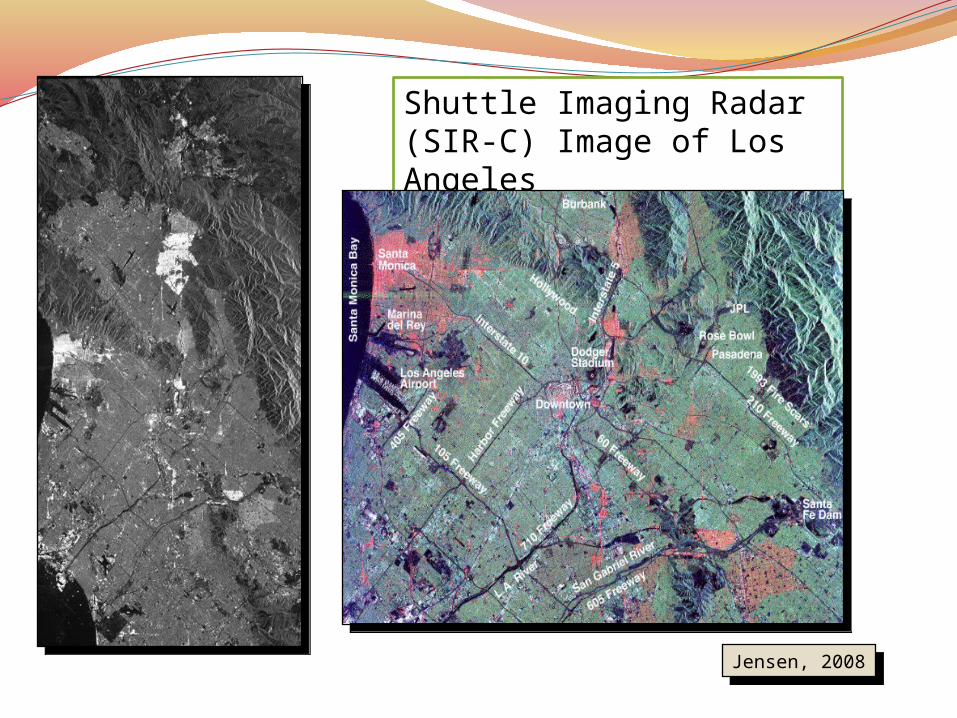
Shuttle Imaging Radar (SIR-C) Image of Los Angeles
Jensen, 2008Jensen, 2008
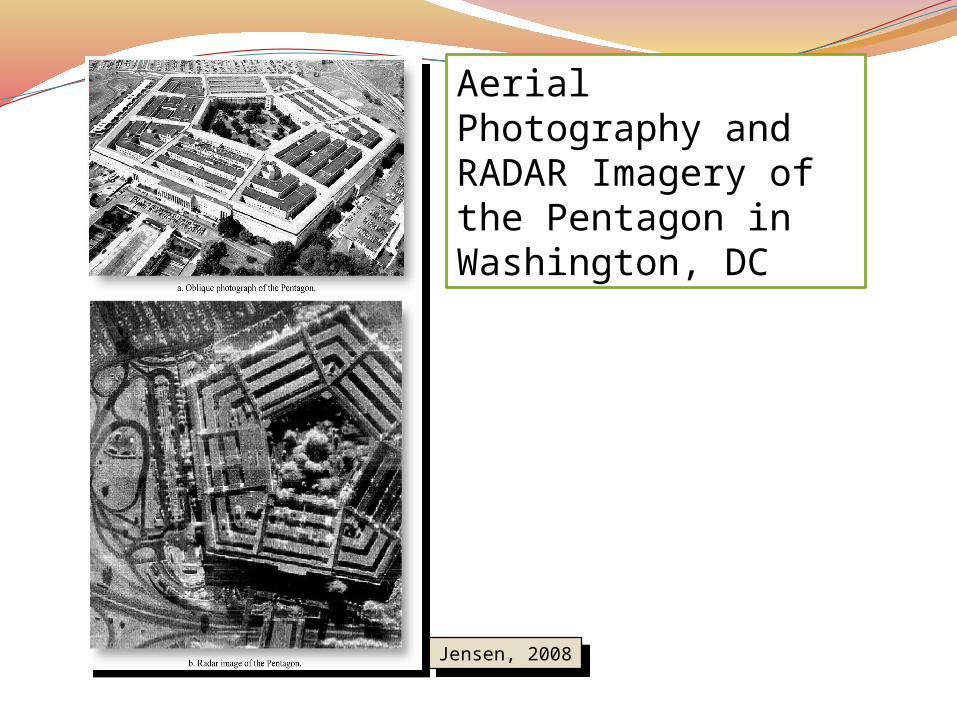
Aerial Photography and RADAR Imagery of the Pentagon in Washington, DC
Jensen, 2008Jensen, 2008
Jensen, 2008Jensen, 2008
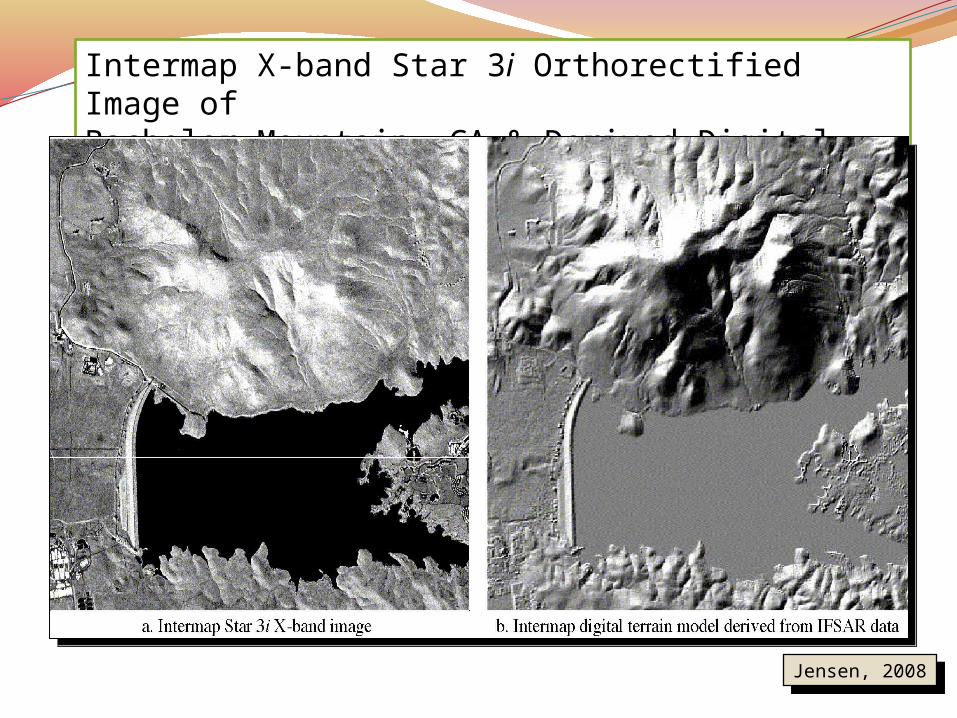
Intermap X-band Star 3i Orthorectified Image of Bachelor Mountain, CA & Derived Digital Elevation Model
Jensen, 2008Jensen, 2008