summer drinks
TRANSCRIPT


EXCEL MENU

Description of the problem to
approach
Summer Drinks is not having enough revenues to maintain the stability of the company. It is important to analyze our income and expenses to have enough information to come up with a creative solution. Summer Drinks wants to know which were the most purchased products. In the same way, it wants to know how the company would be affected if they eliminate products. Also it is important to evaluate employees to analyze the possibility of firing some of them.

Statistical Functions: sum was used to know the
total daily revenues; max was used to know which
was the best sale, and min to know which was the
worst sale.

Advanced filter: the AND filter was used to know how many products with plastic containers had sales above 50 units daily.

The OR filter was used to identify which were the
products with sales below 50 units or with cost of
17.50. This was done because the company realized
that their most expensive products were not being
purchased enough. With this filter the company can
analyze these two factors regarding the number of
sales

Database functions: The first function was used to determine the maximum sales per day of the gloss bottles products. The second function was used to identify the minimum cost of the can container. And finally the last function was used to know the number of items sold above to 50 units.

Conditional Formatting: The conditional formatting was used to determine the top 10 products that had the greater revenues per day between all the products of the company.
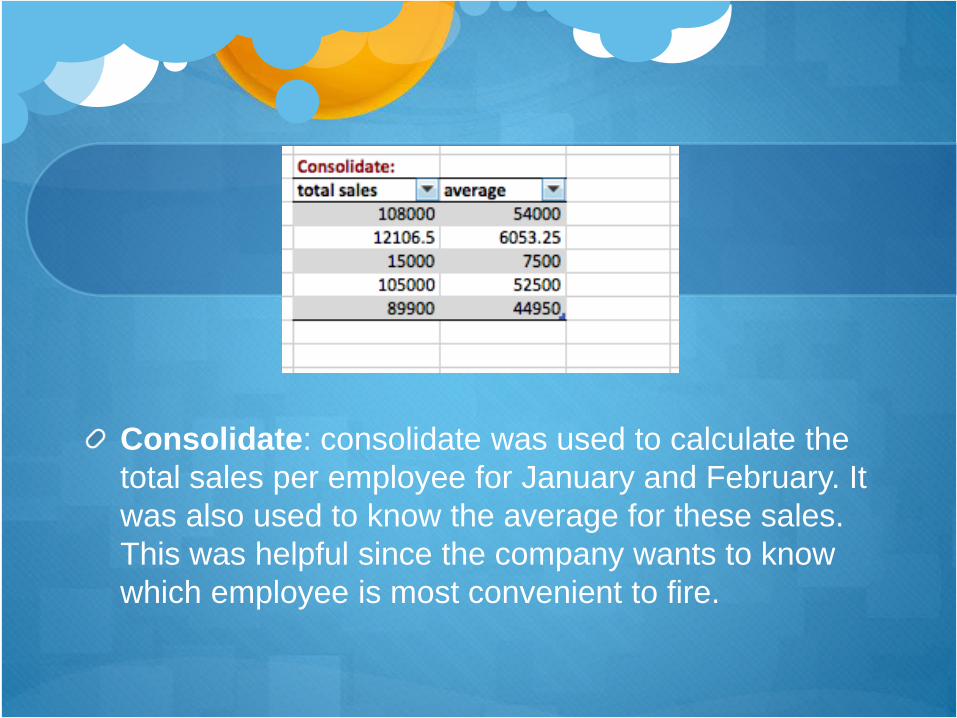
Consolidate: consolidate was used to calculate the
total sales per employee for January and February. It
was also used to know the average for these sales.
This was helpful since the company wants to know
which employee is most convenient to fire.

Scenario: the beverage summer cocktail is not being
purchased therefore the company wanted to know
what the impact in their total revenues would be if
they discontinued this product.

Pivot tables and charts: this was used to have visual representations of products sales per units and the sum of the daily sales for each container type.


Financial functions: financial functions were used to
calculate the following. What will be the monthly amount
to pay for supplier services of 100,000 pesos over 5
month with an annual interest rate of 8% compounded
monthly. What would be the future value if the company
deposits the daily revenues into an account with an
annual interest rate of 10% compounded monthly for one
year. How many periods are required to earn an
investment of 200,000 with an initial investment of 15,000
and a monthly payment of 15,000 made at the beginning
of each month and an annual interest rate of 5%. The
company wanted to know this to see what they would
need in case of doing that.

FINANCIAL FUNCTIONS

Advanced macros: macros were used in the invoice
sheets to make easier the process to make an
invoice.

Charts: the first chart in the daily revenues sheet
was to have a visual representation of the different
prices. On the other hand, the charts in the supplier’s
worksheet were used to compare the supplier’s
containers prices and shipping prices.


relationships


Clients

Menu

Order

Order Product

Product

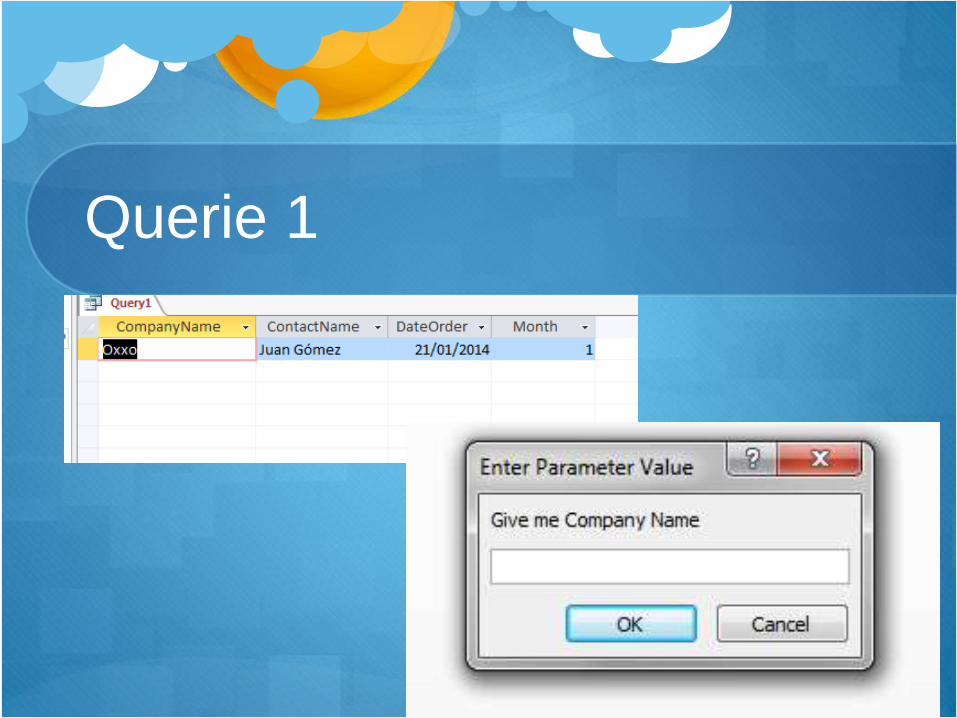
Querie 1

Querie 2
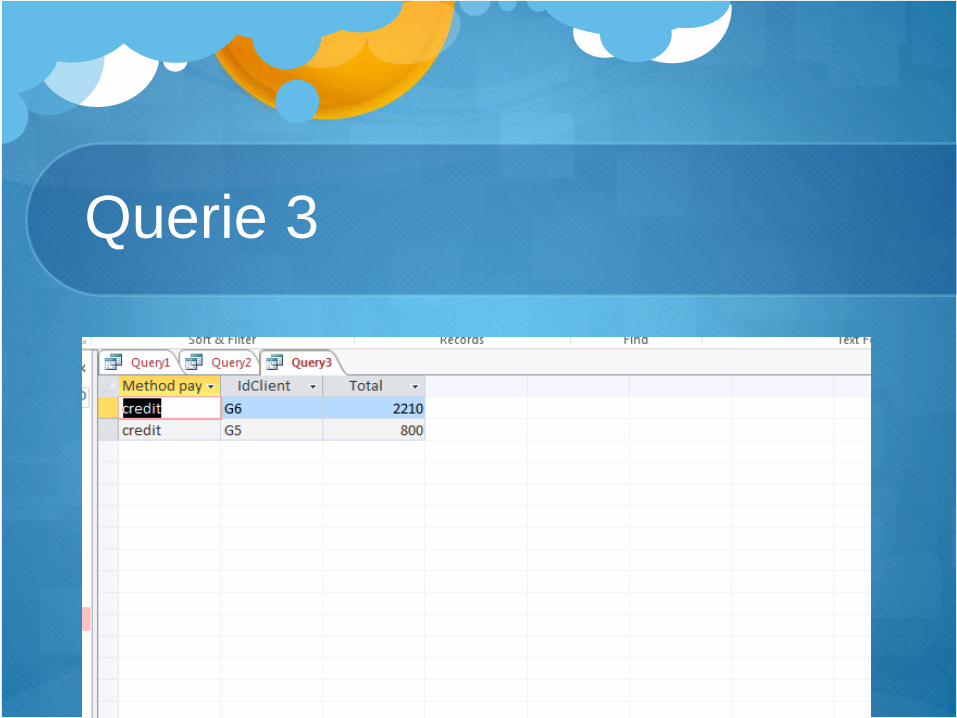
Querie 3


Clients Report

Product Report


Order Product

Product

Order

Clientes