summary of road safety - aaphilippines.org · data collection/information systems 2. road safety...
TRANSCRIPT

Road Safety & Vulnerable Road Safety & Vulnerable Road UsersRoad Users
Ricardo G. Sigua, D. Engg.Associate Professor, COEFaculty Affiliate, NCTS
University of the Philippines Diliman

Road Accident–A Global Problem
approximately 2 human lives approximately 2 human lives per minuteper minute
•• 1.2 million people get killed 1.2 million people get killed on the road worldwideon the road worldwide
•• 70% of the fatalities in 70% of the fatalities in developing countriesdeveloping countries

Leading Causes of Deaths
• Lower Respiratory Infections• Diarrheal Diseases• Conditions during prenatal period• Unipolar major depression• Ischaemic heart disease• Cerebrovascular disease• Tuberculosis• Measles• Road Traffic Accidents• Congenital anomalies• Malaria• Pulmonary diseases
• Ischaemic heart disease• Unipolar major depression• Road Traffic Accidents• Cerebrovascular disease• Chronic obstructive pulmonary
disease• Lower respiratory infections• Tuberculosis• War• Diarrheal diseases• HIV• Conditions during prenatal period• Congenital anomalies• measles
1990 2020
Source: The Global Burden of Disease: A comprehensive assessment of mortality and disability from diseases, ijuries, and risk factors. Harvard University Press

Leading Causes of Injuries Leading Causes of Injuries (Lim(Lim--QuizonQuizon, et al., Philippine National Injury Survey, 2003), et al., Philippine National Injury Survey, 2003)
1. Vehicular accidents2. Fall3. Injured by sharp objects4. Struck by an object5. Animal/insect bites6. Burn7. Assault8. Machine/tool injury9. Electrocution10. Self-harm

0
5
10
15
20
25
30
98 99 00 01 02 03
Year
Gro
wth
, % Population
GDP
VehicleRegistration
Year Population (million)
GDP(billion P)
VehicleRegistration (million)
No. of accidents (fatal & nonfatal)
Fatalities SeriouslyInjured
1998 73 888 3.3 2803 1213 1844
1999 75 917 3.5 2869 969 1637
2000 76 973 3.7 2463 866 1541
2001 78 1002 3.8 2026 737 1961
2002 80 1046 4.0 3748 714 1195
2003 81 1135 4.1 4095 644 1129
PopulationGDPVehicles
AllIncreasing.
No. of Deaths and Casualties appear to be decreasing!Is this likely ??For every 1 death only 1.7 serious injuries . Likely ??
SCALE OF ROAD SAFETY PROBLEM
0
500
1000
1500
2000
2500
98 99 00 01 02 03
Year
Num
ber
Fatalities
SeriouslyInjured

0
5,000,000
10,000,000
15,000,000
20,000,000
25,000,000
30,000,000
1996 1998 2000 2002 2004
Year
Vehi
cle
Regi
stra
tion
Brunei DarussalamCambodiaIndonesiaLao P.D.R.MalaysiaMyanmarPhilippinesSingaporeThailandVietnam
Growth in Number of Motor Vehicles in ASEAN Countries(Source of Data: ASEAN Region Road Safety Strategy and Action Plan, 2004)

0
50000
100000
150000
200000
250000
1996 1998 2000 2002 2004
Year
GD
P (m
illio
n US
$)
Brunei DarussalamCambodiaIndonesiaLao P.D.R.MalaysiaMyanmarPhilippinesSingaporeThailandVietnam
GDP Growth in ASEAN Countries(Source of Data: ASEAN Region Road Safety Strategy and Action Plan, 2004)

0
50000
100000
150000
200000
250000
1996 1998 2000 2002 2004
Year
Popu
latio
n x
1000
Brunei DarussalamCambodiaIndonesiaLao P.D.R.MalaysiaMyanmarPhilippinesSingaporeThailandVietnam
Population Growth in ASEAN Countries(Source of Data: ASEAN Region Road Safety Strategy and Action Plan, 2004)

• 9,000 road accident fatalities in CY 2003!!!(Lim-Quizon, et al., Phil. National Injury Survey, 2003)
Problem on Accident ReportingProblem on Accident Reporting
0100020003000400050006000700080009000
10000
1996 1998 2000 2002 2004
Year
No.
of F
atal
ities
PoliceHealth
• Gross under-reporting
of accidents!

Record of Road Accident Fatalities and Injuries in ASEAN Countries (Source of Data: ASEAN Region Road Safety Strategy and Action Plan, 2004)
Reported by Police Estimated Country
Fatalities Injuries Fatalities Injuries
Brunei Cambodia Indonesia Laos Malaysia Myanmar Philippines Singapore Thailand Viet Nam
28 824
8,761 415
6,282 1,308
995 211
13,116 11,319
645 6,329
13,941 6,231
46,420 9,299 6,790 7,975
69,313 20,400
28 1,017
30,464 581
6,282 1,308 9,500
211 13,186 13,186
1,273 20,340
2,550,000 18,690 46,420 45,780
774,000 9,072
1,529,034 31,000
Total 43,259 187,343 75,763 5,025,609
Serious Under-Reporting

- Accidents simply as common occurrences or even as natural phenomena ?- No clear understanding of the magnitude of the loss to the society incurred by traffic accidents?
Despite the frequency of occurrence of road accidents, there seems to be little effort to improve the situation:

Property DamageProperty Damage
Resource & Time Resource & Time WastageWastage
Consequences of Accidents
R I P
Lost of Lives and Limbs
Pain/Grief and Pain/Grief and SufferingsSufferings
Medical CostMedical Cost

National Cost of Traffic Accidents
2.6 % of the Philippines’ GDP
105,260(US$1.9B)
25,800
27,748
33,119
18,593
Adjusted for under- reporting
973,240
469,090
402,150
93,820
8,180
Adjusted for under- reporting
Based on reported accidents
As reported(Police)
2,548(U$45M)
12,806TOTAL
5299,62355,000Damage-Only
1151,67269,000Minor Injury
281797353,000Serious Injury
1,6237142,273,000Fatal
Total Cost(million pesos)
Number of AccidentsAverage
Cost (Pesos)Accident Type
Source: Sigua, UP NCTS

Economic Losses (Annual) Country US$ Millions % of GDP Brunei Cambodia Indonesia Laos Malaysia Myanmar Philippines Singapore Thailand Viet Nam TOTAL
65 116
6,032 47
2,400 200
1,900 457
3,000 885
15,102
1.0 3.2 2.9 2.7 2.4 3.0 2.6 0.5 2.1 2.4 ---
Estimated Annual Economic Loss of ASEAN Countries Due to Accident
Source: ASEAN Region Road Safety Strategy and Action Plan, Sept 2004
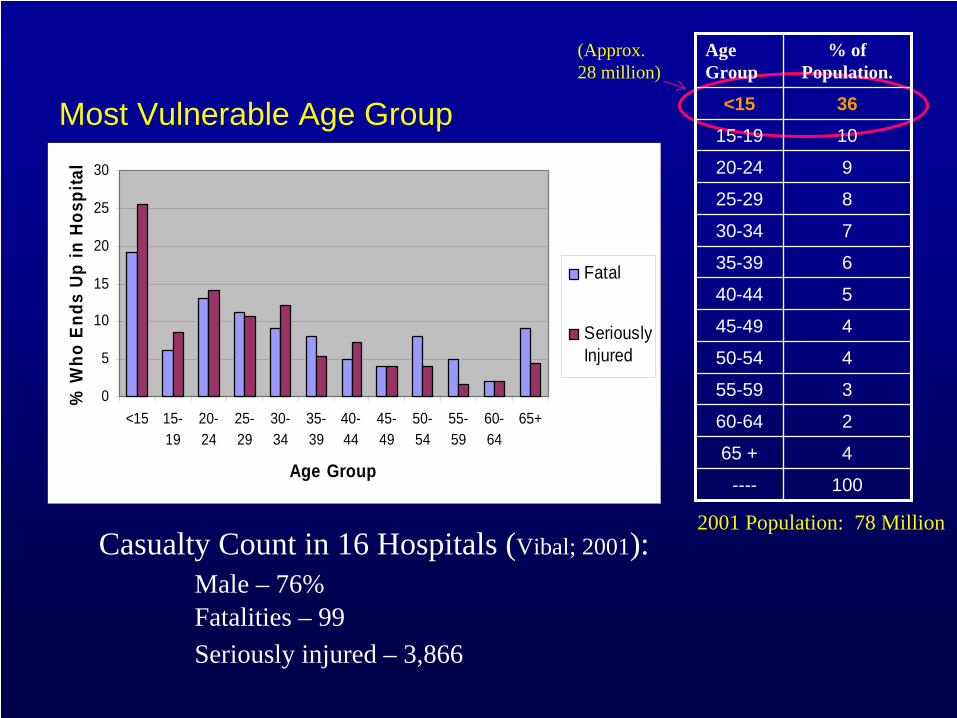
100----
465 +
260-64
355-59
450-54
445-49
540-44
635-39
730-34
825-29
920-24
1015-19
36<15
% of Population.
Age Group
2001 Population: 78 Million
(Approx. 28 million)
0
5
10
15
20
25
30
<15 15-19
20-24
25-29
30-34
35-39
40-44
45-49
50-54
55-59
60-64
65+
Age Group
% W
ho E
nds
Up
in H
ospi
tal
Fatal
SeriouslyInjured
Casualty Count in 16 Hospitals (Vibal; 2001):Male – 76%Fatalities – 99Seriously injured – 3,866
Most Vulnerable Age Group

Pedestrian casualties below 15 years old:Fatal : 24% Seriously Injured: 37%
0
20
40
60
80
100
120
140
160
180
98 99 0 01 02 03
Year
% C
umul
ativ
e
Total
MC/TC
Rate of Increase of MotorcyclesWill add to the safety problems
Another growing concern!
0
10
20
30
40
50
60
Cyclist s Passengerpr ivat e
Passengerpublic
Mot orcyclist s Pedest r ians Ot hers
Road User Group
Perc
enta
ge
Fatal
SeriouslyInjured
Most Vulnerable User Group (Vibal; 2001)

Percentage of Motorcycle Population in ASEAN countries (2003) (Source of Data: ASEAN Region Road Safety Strategy and Action Plan, 2004)
Reported by Police Estimated Country
Fatalities Injuries Fatalities Injuries
Brunei Cambodia Indonesia Laos Malaysia Myanmar Philippines Singapore Thailand Viet Nam
28 824
8,761 415
6,282 1,308
995 211
13,116 11,319
645 6,329
13,941 6,231
46,420 9,299 6,790 7,975
69,313 20,400
28 1,017
30,464 581
6,282 1,308 9,500
211 13,186 13,186
1,273 20,340
2,550,000 18,690 46,420 45,780
774,000 9,072
1,529,034 31,000
Total 43,259 187,343 75,763 5,025,609
0 2 0 4 0 6 0 8 0 1 0 0
B r u n e i
S in g a p o r e
My a n ma r
Ph ilip p in e s
M a la y s ia
Th a ila n d
Ca mb o d ia
In d o n e s ia
L a o P.D.R.
V ie tn a m
Coun
try
% M o to rc y c le s
Improving Road Safety
3. Resources3. Resources
3 Key Areas:1. Data Collection/Information Systems1. Data Collection/Information Systems
2. Road Safety Action Plans and Programs2. Road Safety Action Plans and Programs
1. Data Collection/Information Systems1. Data Collection/Information Systems
Issues and Concerns:• Individual effort; lack of coordination
among agencies• Health sector data need to be incorporated• Mechanism to integrate all accident data• Who will integrate?• Sustainability
Improving Road Safety (cont’d.)

PROPOSED INTEGRATED TRAFFIC ACCIDENT DATA MANAGEMENT SYSTEM
*Local roads in database only; **presently covers fatal and serious accidents only
Information
DisseminationNRSC
For annual reporting
Individual
database checked for duplication
Database Integration
and AnalysisUP NCTS
Integrated Database
Key commonitems?Data Collection Police Reports
PNP/TMG/TEGHealth SectorRecords
All Hospitals
Database forindividualagency’s use; more detailedanalysis
Processing and
AnalysisDOH
Computerized?National andlocal roads*
MManilaRoads**
Expressways
DPWHTARAS
MMDAMMARAS
PNCCothers

Improving Road Safety (cont’d.)
2. Road Safety Action Plans and Programs2. Road Safety Action Plans and Programs
Issues and Concerns:• National Road Safety Action Plan already
craftedWho will orchestrate? (NRSC has yet to be reconvened.)Responsibilities of each agency clear? A need for a CHAMPIONWho will monitor progress of the action plan?

Contents of Safety Action Plan
• Measurable Objectives• Balanced program of actions covering the
following areas:– Highway improvements – good design will save lives; low cost
improvements at dangerous sites are particularly effective– Vehicle safety – any improvement or testing program should
concentrate on basics such as tires, brakes, lights and reflectors.– Education, training, and publicity- key measures to improve
behavior and safety awareness of all categories of road users.– Legislation and enforcement – many countries have found that
taking actions on seat belt, crash helmet, alcohol and speed control have been particularly effective.
– Emergency services – prompt actions in the ‘golden hour’ immediately after an accident is particularly effective.

Sector Brunei Cambo-dia
Indo- nesia
Laos Malay-sia
Myan- mar
Philip- pines
Singa- pore
Thai- land
Viet Nam
1. Coordination & Management
2. Road Accident Data Systems
3. Road safety Funding
4. Safety Planning & Design of Roads
5. Improvement of Hazardous Locations
6. Road Safety Education of Children
7. Driver Training and Testing
8. Road Safety Publicity Campaigns
9. Veh Road Worthiness & Safety Stds.
10. Traffic Legislation
11. Traffic Police & Law Enforcement
12. Emergency Assistance
13. Road Safety Research & Costing
14. Cooperation & Collaboration
Qualitative Assessment of Current Initiatives.

Improving Road Safety (cont’d.)
3. Resources (Road Safety Budget)
Issues and Concerns:• Very weak commitment to earmark budget
for road safety programs • Safety still taken as low priority• Lack of public-private partnership

Funding and Support for Road Safety
• Road safety is only one of the many competing demands for our scarce resources
• But it is essential that it is not overlooked in developing plans and policies.

Resource Allocation in Time
Reduction in Number of Accidents
Resource Needed
time
Aim for least resourcewith greater impact on reduction

Conclusion• Knowing the extent of tangible wastage, not to
mention humanitarian considerations for irreplaceable lives lost, it is high time for our national authorities to accord road safety a higher priority in national planning and policy-making.