summary of financial statement udit and … reporting requirements.pdf · fy 2018 a gency f...
TRANSCRIPT

SSA’S FY 2018 AGENCY FINANCIAL REPORT 154
OTHER REPORTING REQUIREMENTS
SUMMARY OF FINANCIAL STATEMENT AUDIT AND MANAGEMENT ASSURANCES
Summary of Financial Statement Audit Table Financial Statement Audit
Audit Opinion Unmodified
Restatement No
Material Weaknesses Beginning Balance New Resolved Consolidated
Ending Balance
Total Material Weaknesses 0 0 0 0 0
Summary of Management Assurances Table Effectiveness of Internal Control over Financial Reporting (FMFIA Section 2)
Statement of Assurance Unmodified
Material Weaknesses Beginning Balance New Resolved Consolidated Reassessed
Ending Balance
Total Material Weaknesses 0 0 0 0 0 0
Effectiveness of Internal Control over Operations (FMFIA Section 2)
Statement of Assurance Unmodified
Material Weaknesses Beginning Balance New Resolved Consolidated Reassessed
Ending Balance
Total Material Weaknesses 0 0 0 0 0 0
Conformance with Federal Financial Management System Requirements (FMFIA Section 4) Statement of Assurance Federal Systems conform to financial management system requirements
Non-Conformances Beginning Balance New Resolved Consolidated Reassessed
Ending Balance
Total Non-Conformances 0 0 0 0 0 0
Compliance with Section 803(a) of the Federal Financial Management Improvement Act Agency Auditor
1. Federal Financial Management System Requirements No lack of compliance noted No lack of compliance noted
2. Applicable Federal Accounting Standards No lack of compliance noted No lack of compliance noted
3. United States Standard General Ledger at Transaction Level No lack of compliance noted No lack of compliance noted
SSA’S FY 2018 AGENCY FINANCIAL REPORT 155
ENTITLEMENT REVIEWS AND OFFICE OF THE INSPECTOR GENERAL ANTI-FRAUD ACTIVITIES
We are committed to improving financial management by preventing fraudulent and improper payments (see the Payment Integrity report for more information). Section 206 (g) of the Social Security Independence and Program Improvements Act, Public Law (P.L.) 103-296, requires us to report annually on the extent to which we reviewed cases of entitlement to monthly Old-Age and Survivors Insurance (OASI), Disability Insurance (DI) (referred to as OASDI when discussing them in combination), and Supplemental Security Income (SSI) benefits; and the extent to which the cases we reviewed were those that involved a high likelihood or probability of fraud.
ENTITLEMENT REVIEWS Entitlement reviews help ensure that continued monthly payments are correct, even though fraud is not an issue in the vast majority of cases. We select cases and undertake reviews, both prior to and after effectuation of payment, to ensure that development procedures and benefit awards are correct. We conduct the following major entitlement reviews:
DISABILITY QUALITY ASSURANCE REVIEWS
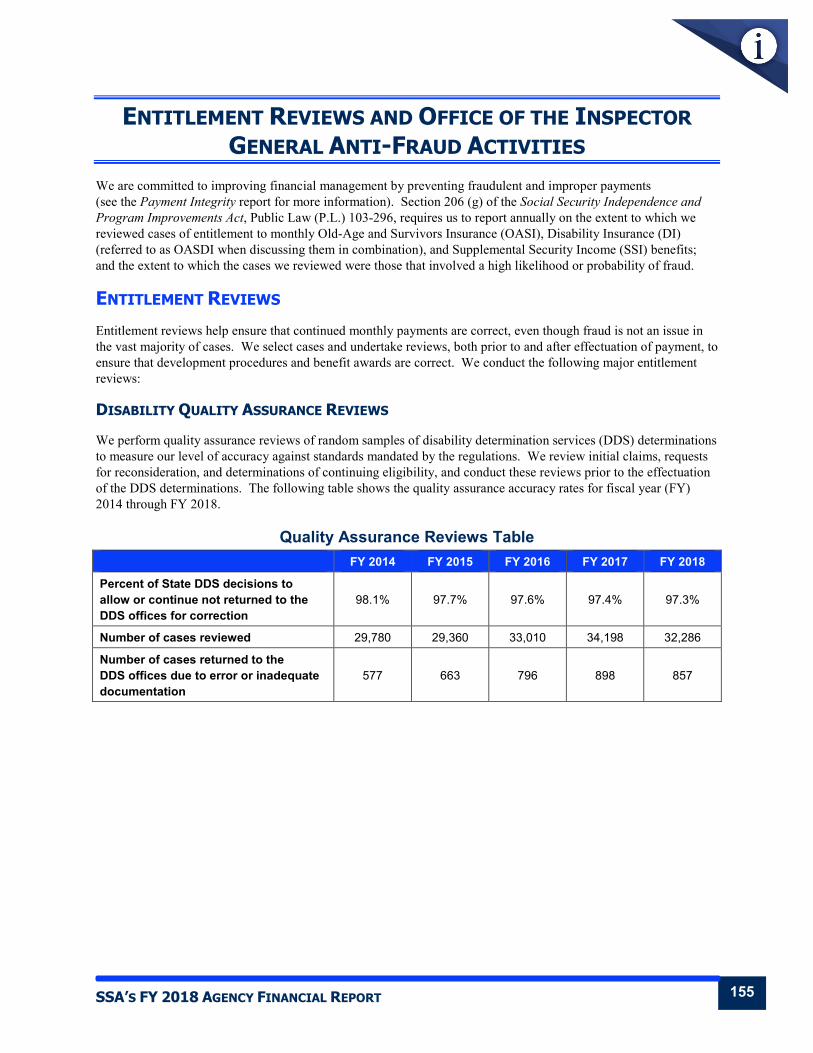
We perform quality assurance reviews of random samples of disability determination services (DDS) determinations to measure our level of accuracy against standards mandated by the regulations. We review initial claims, requests for reconsideration, and determinations of continuing eligibility, and conduct these reviews prior to the effectuation of the DDS determinations. The following table shows the quality assurance accuracy rates for fiscal year (FY) 2014 through FY 2018.
Quality Assurance Reviews Table FY 2014 FY 2015 FY 2016 FY 2017 FY 2018
Percent of State DDS decisions to allow or continue not returned to the DDS offices for correction
98.1% 97.7% 97.6% 97.4% 97.3%
Number of cases reviewed 29,780 29,360 33,010 34,198 32,286
Number of cases returned to the DDS offices due to error or inadequate documentation
577 663 796 898 857

SSA’S FY 2018 AGENCY FINANCIAL REPORT 156
DI PRE-EFFECTUATION REVIEWS
We also perform pre-effectuation reviews of favorable DI and concurrent DI/SSI initial and reconsideration determinations using a profiling system to select cases for review. This profiling system helps ensure the cost-effectiveness of pre-effectuation reviews, and it satisfies the legislative requirement that the cases we review are those that are most likely to be incorrect. We also review a sufficient number of continuing disability review (CDR) continuance determinations to ensure a high level of accuracy in those cases. The following table shows the DI pre-effectuation accuracy rates for FY 2014 through FY 2018.
DI Pre-Effectuation Reviews Table FY 2014 FY 2015 FY 2016 FY 2017 FY 2018
Percent of State DDS decisions to allow or continue not returned to the DDS offices for correction
96.9% 96.4% 95.8% 95.8% 95.5%
Number of cases reviewed 316,306 293,015 300,440 278,796 255,200
Number of cases returned to the DDS offices due to error or inadequate documentation
9,689 10,647 12,758 11,811 11,585
SSI PRE-EFFECTUATION REVIEWS
Following legislation enacted in February 2006, we began pre-effectuation reviews of favorable SSI initial and reconsideration adult determinations. As in DI cases, we also use a profiling system to select cases for review. The following table shows the SSI pre-effectuation accuracy rates for FY 2014 through FY 2018.
SSI Pre-Effectuation Reviews Table FY 2014 FY 2015 FY 2016 FY 2017 FY 2018
Percent of State DDS decisions to allow not returned to the DDS offices for correction
97.6% 97.1% 96.9% 96.9% 96.7%
Number of cases reviewed 105,628 104,808 112,875 106,777 98,540
Number of cases returned to the DDS offices due to error or inadequate documentation
2,562 2,988 3,508 3,288 3,297
CONTINUING DISABILITY REVIEWS
Periodic CDRs are a key activity in ensuring the integrity of the disability program. Through CDRs, we determine whether beneficiaries continue to be entitled to benefits because of their medical conditions. We also conduct a quality review of those decisions. The following table shows the CDR accuracy rates for FY 2014 through FY 2018.
CDR Accuracy Table FY 2014 FY 2015 FY 2016 FY 2017 FY 2018
Overall accuracy 97.6% 96.7% 97.1% 96.7% 96.9%
Continuance accuracy 98.3% 97.3% 97.8% 97.6% 98.0%
Cessation accuracy 95.5% 95.0% 94.9% 93.5% 92.9%

SSA’S FY 2018 AGENCY FINANCIAL REPORT 157
OASDI AND SSI QUALITY ASSURANCE REVIEWS
Quality assurance reviews assess the accuracy of benefit payments. The following tables show the OASDI and SSI accuracy rates for FY 2014 through FY 2017. Data for FY 2018 is not available at this time. We will report the FY 2018 data in our FY 2019 Agency Financial Report.
OASDI Accuracy Table FY 2014 FY 2015 FY 2016 FY 2017 FY 2018
Overpayment accuracy 99.5% 99.6% 99.8% 99.4% Data not yet available
Underpayment accuracy 99.9% 99.9% 99.9% 99.9% Data not yet available
SSI Accuracy Table FY 2014 FY 2015 FY 2016 FY 2017 FY 2018
Overpayment accuracy 93.0% 93.9% 92.4% 92.7% Data not yet available
Underpayment accuracy 98.5% 98.6% 98.8% 98.9% Data not yet available
SSI REDETERMINATIONS
SSI redeterminations are periodic reviews of non-medical factors to ensure that a recipient is still eligible for SSI payments and that we have paid and will continue to pay the recipient the correct amount. The following table shows the number of SSI redeterminations we completed for FY 2014 through FY 2018.
SSI Redeterminations Table (In Millions)
FY 2014 FY 2015 FY 2016 FY 2017 FY 2018
Number of redeterminations completed 2.628 2.267 2.530 2.590 2.913
SSA’S FY 2018 AGENCY FINANCIAL REPORT 158
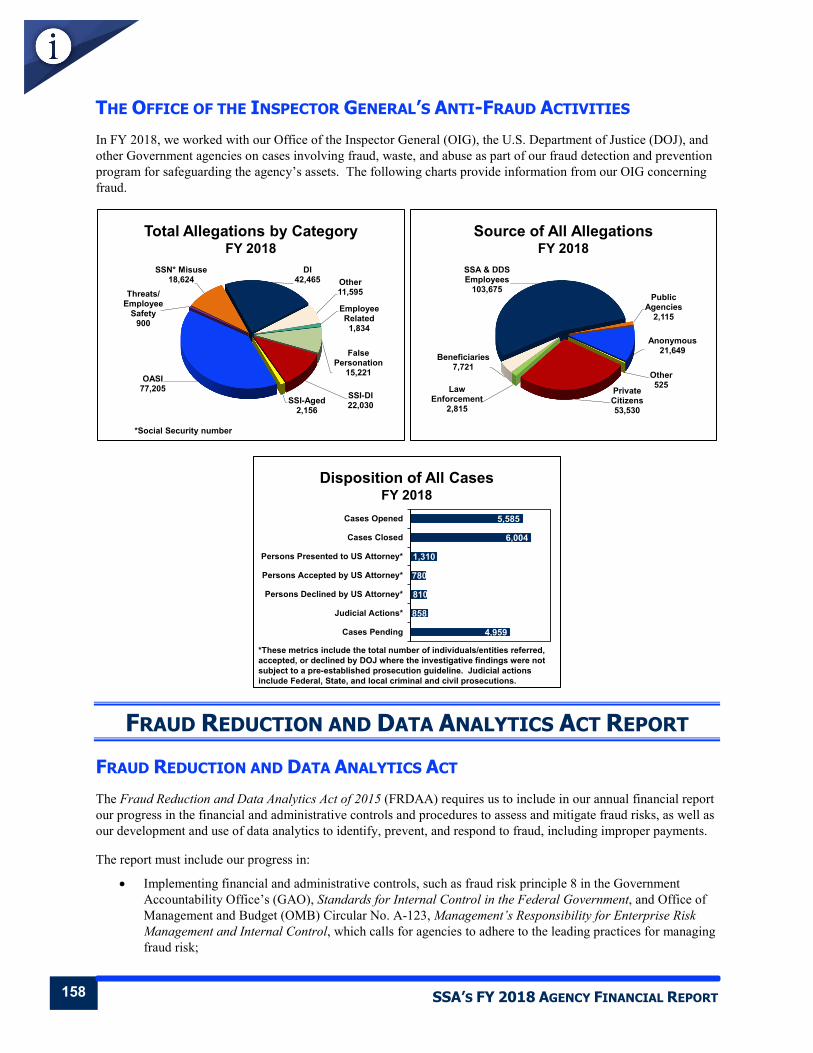
THE OFFICE OF THE INSPECTOR GENERAL’S ANTI-FRAUD ACTIVITIES In FY 2018, we worked with our Office of the Inspector General (OIG), the U.S. Department of Justice (DOJ), and other Government agencies on cases involving fraud, waste, and abuse as part of our fraud detection and prevention program for safeguarding the agency’s assets. The following charts provide information from our OIG concerning fraud.
Total Allegations by CategoryFY 2018
SSI-DI22,030SSI-Aged
2,156
OASI77,205
Threats/Employee
Safety900
SSN* Misuse18,624
DI42,465 Other
11,595
Employee Related
1,834
False Personation
15,221
*Social Security number
Source of All AllegationsFY 2018
Other525Private
Citizens53,530
Law Enforcement
2,815
Beneficiaries7,721
SSA & DDS Employees
103,675Public
Agencies2,115
Anonymous21,649
Disposition of All CasesFY 2018
4,959
858
810
780
1,310
6,004
5,585
Cases Pending
Judicial Actions*
Persons Declined by US Attorney*
Persons Accepted by US Attorney*
Persons Presented to US Attorney*
Cases Closed
Cases Opened
*These metrics include the total number of individuals/entities referred, accepted, or declined by DOJ where the investigative findings were not subject to a pre-established prosecution guideline. Judicial actions include Federal, State, and local criminal and civil prosecutions.
FRAUD REDUCTION AND DATA ANALYTICS ACT REPORT FRAUD REDUCTION AND DATA ANALYTICS ACT The Fraud Reduction and Data Analytics Act of 2015 (FRDAA) requires us to include in our annual financial report our progress in the financial and administrative controls and procedures to assess and mitigate fraud risks, as well as our development and use of data analytics to identify, prevent, and respond to fraud, including improper payments.
The report must include our progress in:
• Implementing financial and administrative controls, such as fraud risk principle 8 in the Government Accountability Office’s (GAO), Standards for Internal Control in the Federal Government, and Office of Management and Budget (OMB) Circular No. A-123, Management’s Responsibility for Enterprise Risk Management and Internal Control, which calls for agencies to adhere to the leading practices for managing fraud risk;

SSA’S FY 2018 AGENCY FINANCIAL REPORT 159
• Identifying risks and vulnerabilities to fraud; and
• Establishing strategies, procedures, and other steps to curb fraud.
OUR ANTI-FRAUD EFFORTS In FY 2018, the Acting Commissioner established a deputy commissioner-level organization, the Office of Analytics, Review, and Oversight (OARO). Under OARO, we realigned our anti-fraud programs, quality reviews, audits, appellate operations, business improvements, and advanced data analytics, allowing us to streamline collaborative efforts and increase effectiveness. Fraud threats are constantly evolving, and, in response, we must adapt our anti-fraud efforts. We continue to make changes to our processes to strengthen our ability to detect, deter, and prevent attempts to defraud agency programs. By realigning our organizational structure, we maximize our resources and better organize our efforts to centrally manage the oversight of the agency’s anti-fraud efforts.
In coordination with OIG, we are making progress in our efforts to enhance an organizational culture and structure conducive to fraud risk management. Our anti-fraud efforts include:
• Continuing to expand our identification and mitigation of potential fraud risks by developing additional mitigation strategies for key risks identified in the disability fraud risk assessment and beginning a new fraud risk assessment for key eServices;
• Expanding Cooperative Disability Investigations (CDI) units;
• Hiring additional Special Assistant U.S. Attorney fraud prosecutors;
• Reviewing potential fraud cases in centralized Fraud Prevention Units (FPU) and the Special Review Cadre (SRC) in the Office of Hearings Operations;
• Delivering mandatory national anti-fraud training for all employees;
• Publishing new policy for anomalous iClaims prevention efforts;
• Increasing recovery efforts for funds lost due to fraud;
• Continuing efforts to prevent fraudulent redirection of direct deposits;
• Enhancing our data-analytic capabilities to detect potential fraud;
• Identifying anti-fraud metrics;
• Increasing the number of fraud allegation referrals to OIG and the number of cases resulting in prosecutions; and
• Engaging in inter-agency information sharing.
FRDAA REPORTING REQUIREMENTS IMPLEMENTING FINANCIAL AND ADMINISTRATIVE CONTROLS
We are building on the accomplishments we reported in FY 2017, such as expanding our use of data analytics to enhance detection of potential fraud. In FY 2018, we deployed a new analytical model to detect potential fraud in disability claims. We also continued the use of data analytics to detect potential fraud within our iClaims workload, allowing us to detect and prevent fraudulent claims before a single payment is made. We continued our multi-year Anti-Fraud Communications Campaign, sharing information with the public regarding our anti-fraud capabilities. In July 2018, we released our annual, mandatory anti-fraud training to all of our employees.

SSA’S FY 2018 AGENCY FINANCIAL REPORT 160
In addition to these controls, we have financial and administrative controls in place to detect, deter, and mitigate fraud. Some examples of these controls are:
• CDI Units: CDI Units are joint efforts among SSA, OIG, and various State agencies to investigate potential fraud in the Title II and Title XVI disability programs. According to OIG, CDI units contributed more than $900 million to agency savings over the last 3 fiscal years. Currently, the CDI Program consists of 43 units covering 37 States, Washington, DC, and the Commonwealth of Puerto Rico. In FY 2019, we plan to add three additional CDI units. Our plan is to provide nationwide CDI coverage by the end of FY 2022.
• FPU: FPUs are specialized fraud units comprised of examiners dedicated to determining and acting on probable fraud cases and compiling data from the cases to help the agency further develop analytical tools to identify potential fraud.
• SRC: When OIG refers a cluster of cases in which there is a reason to believe that fraud or similar fault was involved, the SRC reviews and re-determines the identified hearing-level cases, consistent with the facts presented in the OIG referral, Office of the General Counsel advice, applicable laws, and agency policy.
• Sanctions: Administrative sanctions are penalties for making false or misleading statements or withholding material information in certain circumstances. Penalties are nonpayment of Title II benefits and ineligibility for Title XVI payments for specified periods.
• Civil Monetary Penalties (CMP): Section 1129 of the Social Security Act authorizes imposition of a CMP against anyone who makes false statements or misrepresentations, or materially withholds information in connection with obtaining or retaining benefits or payments under Titles II, VIII, or XVI of the Social Security Act. Additionally, OIG may impose CMPs against representative payees for wrongful conversion of payments for their own use or failure to notify us of a material change in a beneficiary’s living arrangements or work activity.
IDENTIFYING RISKS AND VULNERABILITIES TO FRAUD
Preventing and combatting fraud is a core agency value, and we have various tools in place and under development to help us succeed.
In accordance with the requirements set forth in OMB Circular No. A-123, the agency updated the Enterprise Risk Management (ERM) risk profile in 2018. Implementation of an ERM framework improves strategic and risk mitigation decision-making throughout the agency by enabling managers to have a better understanding of inherent risks.
We continued to expand our identification and mitigation of fraud risks across the agency. In FY 2017, we conducted a fraud risk assessment of the disability program and identified several key fraud risks. In FY 2018, we convened a workgroup to develop strategies to mitigate the risks we identified. We also began a fraud risk assessment of key eServices, including my Social Security and iClaims. We are developing a long-term strategy and schedule to conduct fraud risk assessments, determine fraud risk tolerances, and document fraud risk profiles for major lines of business and services.
As noted in the FY 2017 report, we continue to expand our current anti-fraud systems and processes. Over a five-year phased period, we plan to develop, integrate, test, and implement additional fraud detecting data analytics to additional agency lines of business, focusing on the highest risk areas as identified by our fraud risk assessments and mitigation strategies.
In FY 2018, we executed the first disability fraud analytical model, to identify potential fraud in disability cases. We evaluated the model output of 36 clusters, comprised of approximately 3,000 cases, and made appropriate referrals to OIG for investigation. We began to redesign the e8551 allegation referral process to modernize the way agency and State DDS employees develop and refer allegations of potential fraud to OIG.

SSA’S FY 2018 AGENCY FINANCIAL REPORT 161
We use a variety of internal controls and techniques designed to deter the risk of fraud in the award and administration of contracts and grants, and to ensure the agency receives the services expected. To help mitigate the risk of fraud, we:
• Select contractors who have demonstrated abilities and a record of successful performance;
• Ensure that contract awardees and grantees are not on lists of excluded entities maintained by the government;
• Require contract review and approval at multiple levels;
• Require grantees to properly track the use of funds and maintain adequate supporting documentation;
• Require selected grantees to use grant funds in accordance with the terms of their grant agreements and to act with integrity when applying for and reporting their use of Federal funds; and
• Ensure that all contractor and grantee invoices are reviewed and approved by the client component that received the goods and services prior to payment.
ESTABLISHING STEPS TO CURB FRAUD
In February 2018, the agency released the Fiscal Years 2018-2022 Agency Strategic Plan (www.socialsecurity.gov/asp), which serves as the agency’s blueprint to achieve its mission through 2022.
As part of our Strategic Goal to “Ensure Stewardship,” we centrally manage our anti-fraud efforts and develop consistent anti-fraud policies; refine employee training; and solidify relationships with other Federal, State, and private partners to identify individuals who wrongfully obtain Title II and Title XVI payments.
We continue to expand the use of data analytics and predictive modeling to enhance fraud prevention and detection in our programs. Despite an increase in attempted fraud within our iClaims workload, we have proactively detected and prevented the vast majority of these claims before a single payment is made. We will continue to develop and refine our predictive models, allowing us to better identify suspicious patterns of activities, and prevent fraudulent actions.
We will continue to develop and conduct regular fraud risk assessments of our programs, in alignment with the GAO Framework. In FY 2018, we began work on our second fraud risk assessment, related to key eServices such as my Social Security and iClaim. We are developing a long-term strategy and schedule to develop fraud risk assessments, determine fraud risk tolerances, and document fraud risk profiles for major lines of business and services (including payroll, grants, large contracts, asset safeguards, and purchase/travel cards), consistent with the GAO Framework, FRDAA, and OMB Circular No. A-123. We will use the results of monitoring and evaluations to improve the design and implementation of fraud-risk management activities. Regular reporting of our anti-fraud activities will further help identify trends and track progress.

SSA’S FY 2018 AGENCY FINANCIAL REPORT 162
CIVIL MONETARY PENALTY ADJUSTMENT FOR INFLATION The Social Security Act authorizes the Commissioner to impose a CMP for certain specific violations. Section 1129 of the Social Security Act authorizes the imposition of a CMP against anyone who makes any material false statements or representations to the agency or knowingly withholds a material fact from the agency, to obtain or retain benefits or payments under Titles II, VIII, or XVI of the Social Security Act. A CMP may also be imposed against representative payees for the wrongful conversion of Social Security payments entrusted to their care. Section 1140 of the Social Security Act authorizes the imposition of a CMP to protect the public from advertisements, solicitations, and other communications (including Internet websites) that may convey the false impression that the communication is approved, endorsed, or authorized by the agency. Section 1140 also prohibits the reproduction and sale of Social Security publications and forms without the agency’s authorization and places restrictions on the charging for services that the agency provides to the public without charge. The Commissioner delegated authority to enforce the agency’s CMP program to the Inspector General.
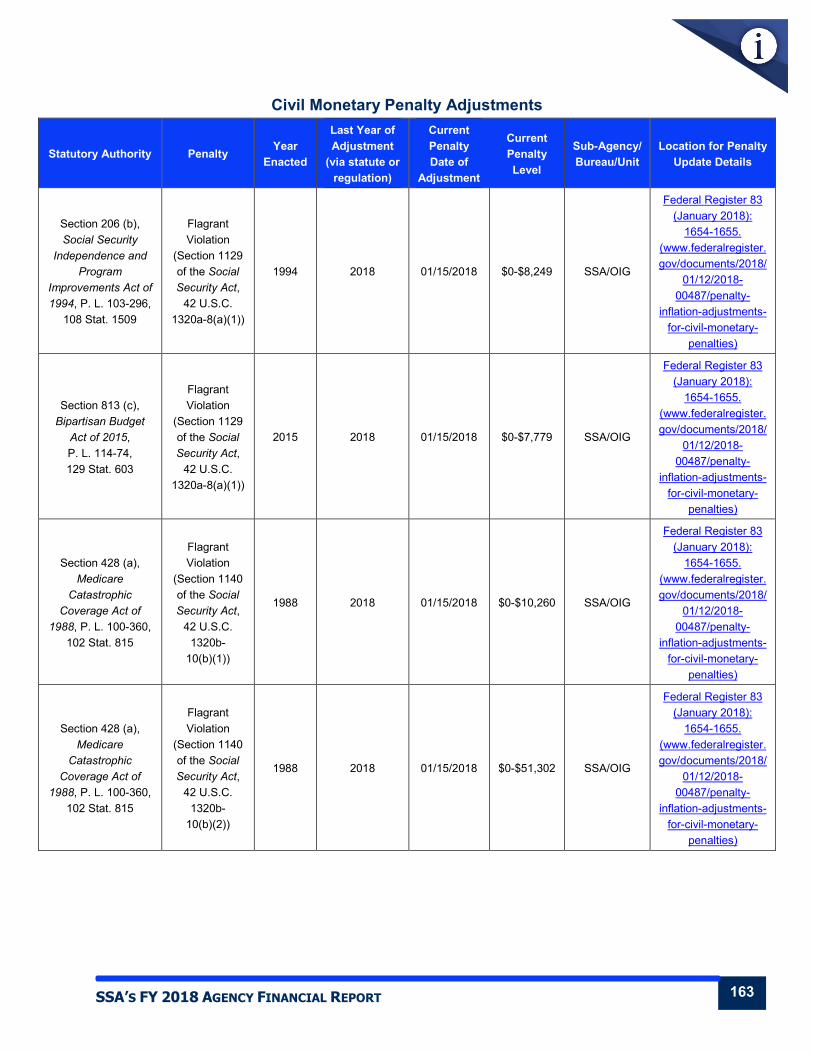
The Federal Civil Penalties Inflation Adjustment Act Improvements Act of 2015 expanded the categories of penalties that require adjustment for inflation to include CMPs under the Social Security Act and requires agencies to: (1) use an interim final rulemaking to adjust the level of CMPs in 2016 with an initial “catch-up” adjustment; (2) continue to make annual adjustments in future years; and (3) report on these adjustments annually. As required, we are providing information on our current CMPs; these amounts include the initial “catch-up” and annual adjustments. We will continue to make annual adjustments in future years and report on these adjustments annually.
SSA’S FY 2018 AGENCY FINANCIAL REPORT 163
Civil Monetary Penalty Adjustments
Statutory Authority Penalty Year Enacted
Last Year of Adjustment
(via statute or regulation)
Current Penalty Date of
Adjustment
Current Penalty Level
Sub-Agency/ Bureau/Unit
Location for Penalty Update Details
Section 206 (b), Social Security
Independence and Program
Improvements Act of 1994, P. L. 103-296,
108 Stat. 1509
Flagrant Violation
(Section 1129 of the Social Security Act,
42 U.S.C. 1320a-8(a)(1))
1994 2018 01/15/2018 $0-$8,249 SSA/OIG
Federal Register 83 (January 2018):
1654-1655. (www.federalregister.gov/documents/2018/
01/12/2018-00487/penalty-
inflation-adjustments-for-civil-monetary-
penalties)
Section 813 (c), Bipartisan Budget
Act of 2015, P. L. 114-74, 129 Stat. 603
Flagrant Violation
(Section 1129 of the Social Security Act,
42 U.S.C. 1320a-8(a)(1))
2015 2018 01/15/2018 $0-$7,779 SSA/OIG
Federal Register 83 (January 2018):
1654-1655. (www.federalregister.gov/documents/2018/
01/12/2018-00487/penalty-
inflation-adjustments-for-civil-monetary-
penalties)
Section 428 (a), Medicare
Catastrophic Coverage Act of
1988, P. L. 100-360, 102 Stat. 815
Flagrant Violation
(Section 1140 of the Social Security Act,
42 U.S.C. 1320b-
10(b)(1))
1988 2018 01/15/2018 $0-$10,260 SSA/OIG
Federal Register 83 (January 2018):
1654-1655. (www.federalregister.gov/documents/2018/
01/12/2018-00487/penalty-
inflation-adjustments-for-civil-monetary-
penalties)
Section 428 (a), Medicare
Catastrophic Coverage Act of
1988, P. L. 100-360, 102 Stat. 815
Flagrant Violation
(Section 1140 of the Social Security Act,
42 U.S.C. 1320b-
10(b)(2))
1988 2018 01/15/2018 $0-$51,302 SSA/OIG
Federal Register 83 (January 2018):
1654-1655. (www.federalregister.gov/documents/2018/
01/12/2018-00487/penalty-
inflation-adjustments-for-civil-monetary-
penalties)

SSA’S FY 2018 AGENCY FINANCIAL REPORT 164
BIENNIAL REVIEW OF USER FEE CHARGES SUMMARY OF FEES In FY 2017 and FY 2018, we earned $288 million and $281 million in user fees, respectively. This revenue accounted for less than one percent of our total financing sources. We derive over 74 percent of user fee revenues from agreements with 20 States and the District of Columbia to administer some or all of the States’ supplemental SSI benefits. During FY 2018, we charged a fee of $11.87 per payment for the cost of administering State supplemental SSI payments. This fee will increase to $12.21 for FY 2019. We adjust the user fee annually based on the Consumer Price Index, unless the Commissioner of Social Security determines a different rate is appropriate for the States. We charge full cost for other reimbursable activity, such as earnings record requests from pension funds and individuals.
BIENNIAL REVIEW The Chief Financial Officers Act of 1990 requires biennial reviews by Federal agencies of agency fees and other charges imposed for services rendered to individuals as opposed to the American public in general. The objective of these reviews is to identify such activities, charge fees as permitted by law, and periodically adjust these fees to reflect current costs or market value. Based on our FY 2018 review, we identified updates to the uniform standard fee structure for non-programmatic workloads previously implemented in FY 2016. We are planning to perform another review of these fees during FY 2020.
REDUCE THE FOOTPRINT In 2015, OMB issued Management Procedures Memorandum 2015-01, Implementation of OMB Memorandum M-12-12 Section 3: Reduce the Footprint, which calls for agencies to dispose of surplus properties, as well as make more efficient use of real property assets. This guidance requires agencies to reduce the total square footage of domestic office and warehouse inventory relative to a newly established 2015 baseline.
In accordance with Reduce the Footprint guidelines, we developed and implemented a Real Property Efficiency Plan to guide the agency in its efforts to comply with OMB’s requirements. This plan only measures our reduction goals based on designated office and warehouse facilities, excluding many of our public-facing facilities from our reporting requirements. The agency monitors the continuing implementation and submits to OMB the annual plan, describing the overall approach in managing our real property footprint. The following information reflects the overall change in the agency’s real property footprint from the FY 2015 baseline for Reduce the Footprint, as well as strategies we are pursuing to comply with the mandate.
Reduce the Footprint Policy Baseline Comparison
FY 2015 Baseline FY 2017 Change from
FY 2015 Baseline FY 2018 Change from FY 2015 Baseline
Useable square footage 11,701,596 11,443,466 -258,130 or -2.2% Not Available1 Not Available1
Note: 1. The agency works with the General Services Administration (GSA) to reconcile Reduce the Footprint useable square footage and it
will not be available until the second quarter of FY 2019. We will report the FY 2018 data in our FY 2019 Agency Financial Report.
The agency does not own or directly lease any buildings in its inventory. Per Federal Management Regulation, Subchapter C, GSA acts as the landlord for the Federal civilian Government, and is charged with promulgating regulations governing the acquisition, use, and disposal of real property. We work closely with GSA to manage our portfolio given changing workloads and the best business case for the agency.

SSA’S FY 2018 AGENCY FINANCIAL REPORT 165
Operation and Maintenance Cost – Owned and Direct Lease Buildings Table
FY 2015 Reported Cost FY 2018 Change
Operation and maintenance cost Not Applicable Not Applicable Not Applicable
We are pursuing the following strategies to comply with OMB’s Reduce the Footprint policy:
• Analyzing rent trend projections, while evaluating market gap opportunities to identify locations where it makes sense to renegotiate lower rent rates with lessors;
• Optimizing space by identifying and improving the overall utilization rate in new projects;
• Reviewing field and hearing office Federal building occupancies to determine if the current space meets the agency’s business and mission needs based on current space standards and staffing levels;
• Pursuing field and hearing office collocation opportunities when it makes business sense and does not adversely affect customer service; and
• Continuing to analyze our telework practices and seek opportunities to utilize our space more efficiently.
GRANTS OVERSIGHT AND NEW EFFICIENCY ACT REPORTING The Grants Oversight and New Efficiency Act requires agencies to report on Federal grant and cooperative agreement awards that have not yet been closed out and for which the period of performance, including any extensions, elapsed for more than two years. As noted in the following table, we have no such grants or cooperative agreements to report.
The agency has six grant programs monitored by Grants Management Officers (GMO). Each GMO is responsible for monitoring their workload to ensure timely grant closeouts. Although we currently do not have any expired grants that have exceeded the two-year timeframe for closeout, there are occasions when a GMO cannot immediately close a grant. In certain instances, closeout could be delayed by one year.
Grants and Cooperative Agreements Summary Table Category 2-3 Years >3-5 Years >5 Years
Number of Grants/Cooperative Agreements with Zero Dollar Balances Not Applicable Not Applicable Not Applicable
Number of Grants/Cooperative Agreements with Undisbursed Balances Not Applicable Not Applicable Not Applicable
Total Amount of Undisbursed Balances Not Applicable Not Applicable Not Applicable
DEBT COLLECTION AND MANAGEMENT DEBT COLLECTION We have a robust debt collection program to recover all types of overpayments. We use internal debt collection techniques (i.e., payment withholding and billing/follow-up), as well as external collection techniques authorized by the Debt Collection Improvement Act of 1996 for OASDI debts and the Foster Care Independence Act of 1999 for SSI debts.
In FY 2018, we recovered approximately $3.931 billion using both our internal and external collection tools. Over the last 5 years (FY 2014 through FY 2018), we have collected a total of $17.788 billion. The following tables provide a description
SSA’S FY 2018 AGENCY FINANCIAL REPORT 166
of each of our internal and external debt collection techniques for OASDI and SSI overpayments, and a summary of the results.
INTERNAL COLLECTIONS
We utilize internal collection tools to recover payments of delinquent debt for individuals in current pay. In FY 2018, we recovered $3.731 billion using our internal collection tools, which accounted for about 95 percent of our total collections amount. Over the last 5 years (FY 2014 through FY 2018), we have collected a total of $16.807 billion using our internal collection tools. The following table provides a description of each of our internal debt collection techniques for OASDI and SSI overpayments, and a summary of the results.
Internal Collections During Fiscal Year 2018 (Dollars in Billions)
Recovery Method Description OASDI SSI Total
Benefit Withholding
We withhold some or all benefit payments for Title II beneficiaries and Title XVI recipients in current pay. Benefit withholding typically accounts for the largest recovery of our total collections amount.
$2.098 $0.851 $2.949
Cross-Program Recovery (CPR)
CPR collects OASDI overpayments from monthly SSI payments and underpayments, and SSI overpayments from monthly OASDI benefit payments and underpayments.
$0.026 $0.167 $0.193
Other Collections These are mostly voluntary payments received because of a notice requesting a refund of an overpayment.
$0.331 $0.259 $0.590
Total Internal Collections
The total amount recovered by utilizing our internal collection tools. $2.454 $1.277 $3.731
Notes: 1. Totals do not necessarily equal the sum of rounded components.
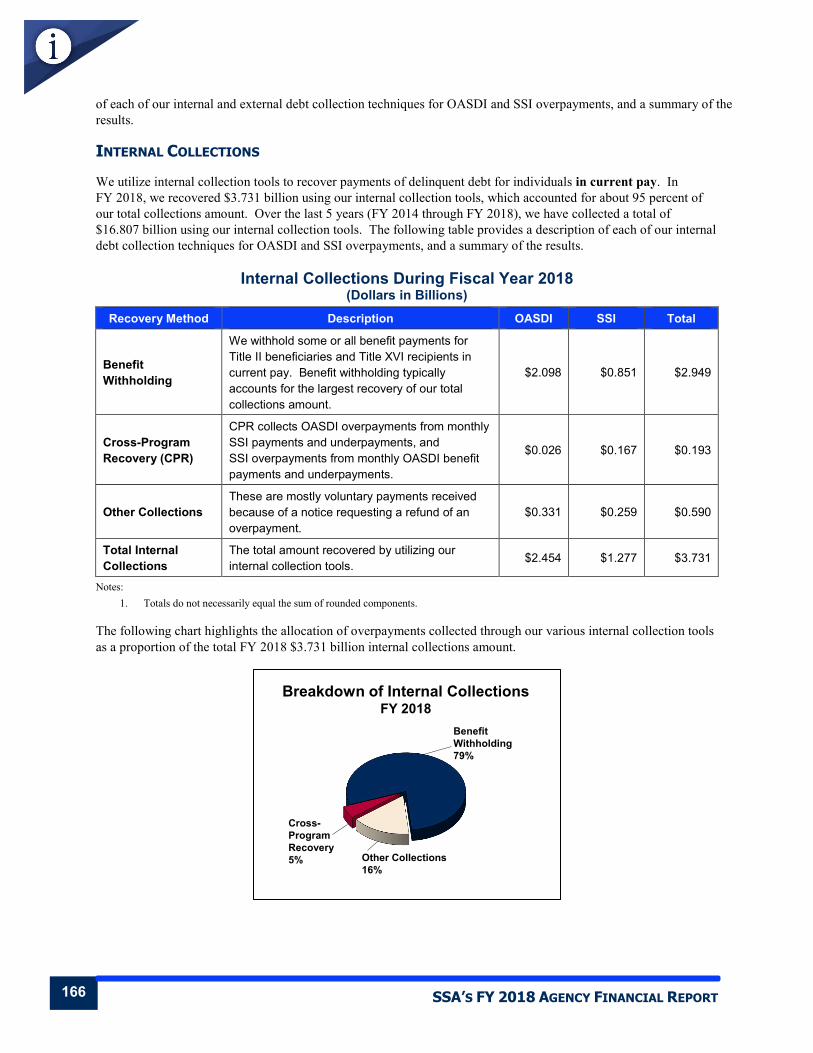
The following chart highlights the allocation of overpayments collected through our various internal collection tools as a proportion of the total FY 2018 $3.731 billion internal collections amount.
Breakdown of Internal CollectionsFY 2018
Other Collections16%
Cross-Program Recovery5%
Benefit Withholding79%

SSA’S FY 2018 AGENCY FINANCIAL REPORT 167
EXTERNAL COLLECTIONS
We utilize external collection tools to recover payments of delinquent debt for beneficiaries and recipients no longer in current pay. In FY 2018, we recovered $199.783 million using our external collection tools, which accounted for about 5 percent of our total collections amount. Over the last 5 years (FY 2014 through FY 2018), we have collected a total of $1 billion using our external collection tools. The following table provides a description of each of our external debt collection techniques for OASDI and SSI overpayments, and a summary of the results.
External Collections During Fiscal Year 2018 (Dollars in Billions)
Recovery Method Description OASDI SSI Total
Treasury Offset Program (TOP)
TOP allows us to collect delinquent debt by tax refund offset, administrative offset, and Federal salary offset.
$0.101 $0.077 $0.178
Administrative Wage Garnishment (AWG)
AWG allows us to recover delinquent OASDI and SSI overpayments by ordering a debtor’s employer to garnish up to 15 percent of the debtor's private-sector disposable pay (i.e., that part of a worker’s total compensation after deduction of health insurance premiums and required deductions).
$0.017 $0.005 $0.022
Total External Collections
The total amount recovered by utilizing our external collection tools. $0.118 $0.082 $0.200
Notes: 1. Totals do not necessarily equal the sum of rounded components. 2. For information on administrative overpayment collections, please refer to the Recapture of Improper Payments Reporting section of
the Payment Integrity report. 3. We also use credit bureau reporting, non-entitled debtors, and automatic netting SSI as external collection tools. Collections derived
from these recovery methods are subsets of the main recovery methods displayed in the table above. However, we still track these collections for informational and decision-making purposes.
The following chart highlights the allocation of overpayments collected through our various external collection tools as a proportion of the total FY 2018 $199.783 million external collections amount.
Breakdown of External CollectionsFY 2018
Administrative Wage Garnishment11%
Treasury Offset Program89%

SSA’S FY 2018 AGENCY FINANCIAL REPORT 168
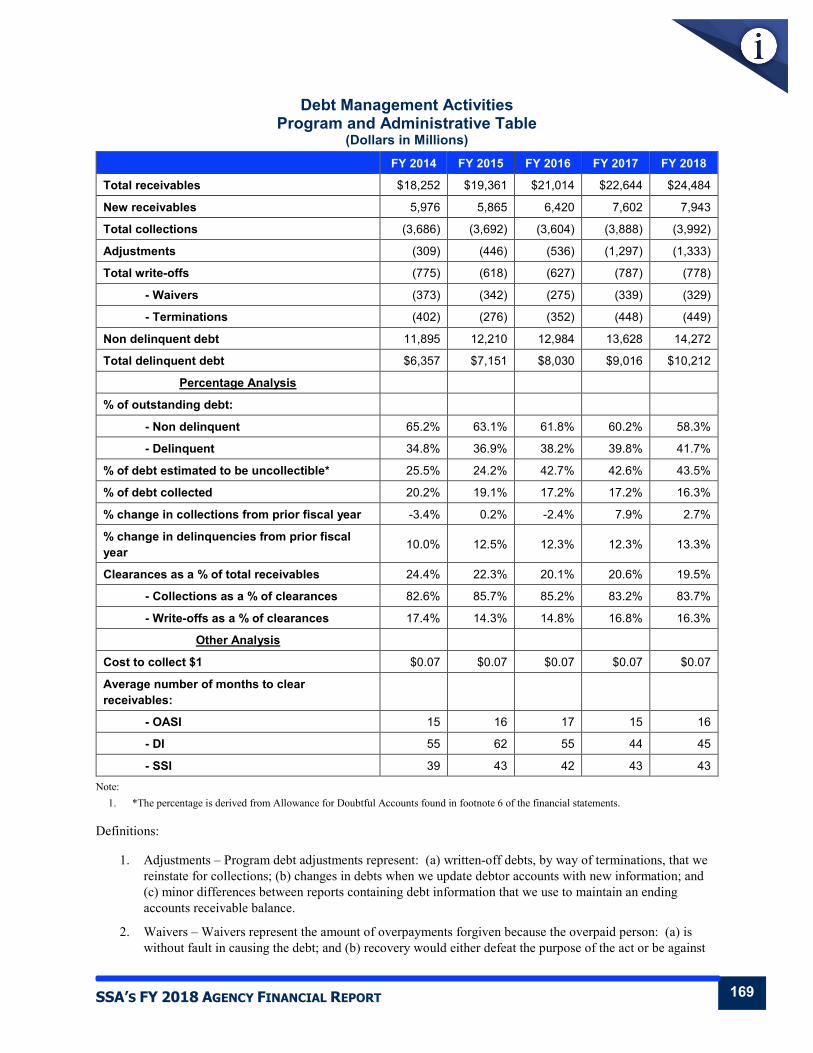
DEBT MANAGEMENT The following two tables provide information on our debt management activities. We calculated the data shown in the tables by using accounts receivable amounts taken directly from the financial statements. We provide definitions of certain line items immediately following the Debt Management Activities Program and Administrative Table. For more information on our agency’s effort to curb overpayments, please refer to the Payment Integrity report immediately following this section.
We identified a system limitation in the processing of certain overpayments. In July 2011, GAO issued an audit report on the DI program entitled, “Disability Insurance: SSA Can Improve Efforts to Detect, Prevent, and Recover Overpayments.” In that audit, GAO identified an OASDI system limitation concerning long-term withholding agreements that extend past the year 2049. When we detect overpayments, we often find that disabled beneficiaries lack the means to repay us immediately. In many of these cases, we establish long-term repayment plans and withhold a portion of individuals’ monthly benefits. We often withhold minimal amounts to avoid imposing undue hardships, and some repayment plans extend beyond the year 2049. We do so recognizing that a portion of this debt will prove uncollectible because some plans exceed beneficiaries’ expected lifetimes. We estimate that approximately 58,000 debts are affected by payment plans extending beyond the year 2049. We estimate the total gross value of the post year 2049 receivable amounts is approximately $688 million. This amount is not material to the consolidated financial statements.
The following tables do not include the amounts related to post year 2049 debt. Therefore, the Total New Receivables and Total Write-offs are understated. We are working to address the system limitation; however, the accounts receivable balance reported on the financial statements are presented fairly in all material respects.
FY 2018 Quarterly Debt Management Activities Program and Administrative Table
(Dollars in Millions) 1st Quarter 2nd Quarter 3rd Quarter 4th Quarter
Total receivables $22,828 $23,177 $23,623 $24,484
New receivables 1,697 3,507 5,345 7,943
Total collections (993) (1,954) (2,876) (3,992)
Adjustments (325) (647) (915) (1,333)
Total write-offs (195) (373) (575) (778)
- Waivers (84) (163) (245) (329)
- Terminations (111) (210) (330) (449)
Aging schedule of debts:
- Non delinquent debt 13,102 13,475 13,741 14,272
- Delinquent debt
- 180 days or less 2,063 1,816 1,764 1,900
- 181 days to 10 years 6,685 6,881 7,076 7,233
- Over 10 years 978 1,005 1,042 1,079
- Total delinquent debt $9,726 $9,702 $9,882 $10,212
SSA’S FY 2018 AGENCY FINANCIAL REPORT 169
Debt Management Activities Program and Administrative Table
(Dollars in Millions) FY 2014 FY 2015 FY 2016 FY 2017 FY 2018
Total receivables $18,252 $19,361 $21,014 $22,644 $24,484
New receivables 5,976 5,865 6,420 7,602 7,943
Total collections (3,686) (3,692) (3,604) (3,888) (3,992)
Adjustments (309) (446) (536) (1,297) (1,333)
Total write-offs (775) (618) (627) (787) (778)
- Waivers (373) (342) (275) (339) (329)
- Terminations (402) (276) (352) (448) (449)
Non delinquent debt 11,895 12,210 12,984 13,628 14,272
Total delinquent debt $6,357 $7,151 $8,030 $9,016 $10,212
Percentage Analysis
% of outstanding debt:
- Non delinquent 65.2% 63.1% 61.8% 60.2% 58.3%
- Delinquent 34.8% 36.9% 38.2% 39.8% 41.7%
% of debt estimated to be uncollectible* 25.5% 24.2% 42.7% 42.6% 43.5%
% of debt collected 20.2% 19.1% 17.2% 17.2% 16.3%
% change in collections from prior fiscal year -3.4% 0.2% -2.4% 7.9% 2.7%
% change in delinquencies from prior fiscal year 10.0% 12.5% 12.3% 12.3% 13.3%
Clearances as a % of total receivables 24.4% 22.3% 20.1% 20.6% 19.5%
- Collections as a % of clearances 82.6% 85.7% 85.2% 83.2% 83.7%
- Write-offs as a % of clearances 17.4% 14.3% 14.8% 16.8% 16.3%
Other Analysis
Cost to collect $1 $0.07 $0.07 $0.07 $0.07 $0.07
Average number of months to clear receivables:
- OASI 15 16 17 15 16
- DI 55 62 55 44 45
- SSI 39 43 42 43 43 Note:
1. *The percentage is derived from Allowance for Doubtful Accounts found in footnote 6 of the financial statements.
Definitions:
1. Adjustments – Program debt adjustments represent: (a) written-off debts, by way of terminations, that we reinstate for collections; (b) changes in debts when we update debtor accounts with new information; and (c) minor differences between reports containing debt information that we use to maintain an ending accounts receivable balance.
2. Waivers – Waivers represent the amount of overpayments forgiven because the overpaid person: (a) is without fault in causing the debt; and (b) recovery would either defeat the purpose of the act or be against

SSA’S FY 2018 AGENCY FINANCIAL REPORT 170
equity and good conscience. Waivers permanently remove debts from our accounts receivable balance, which precludes any further collection efforts.
3. Terminations – Terminations represent our decision to cease our own efforts to collect a debt because: (a) the debtor will not repay the debt or alleges they cannot pay the debt; (b) we cannot locate the debtor after diligent search; or (c) the debt is at least two years delinquent. Even though we terminate internal active collection, we may still use external collection efforts such as the TOP and AWG. If the debtor becomes entitled to OASDI benefits or eligible for SSI payments, we reinstate the debt and resume recovery through benefit/payment withholding.
4. Delinquent Debt – A debt is delinquent when no voluntary payment has been made 30 days after the latest of the following: (a) the date we establish an OASDI debt; (b) the date of the initial overpayment notice for a SSI debt; (c) the date of the last voluntary payment; (d) the date of an installment or periodic payment arrangement (if we do not receive a payment); and (e) the date we decide a debtor remains responsible for a debt, in response to a due process action by the debtor.