summary of financial results debt total liabilities minority interests total shareholders’ equity...
TRANSCRIPT

FOR YOUR CONVENIENCETRANSLATION ONLY
Summary of Financial Results( FY3/2003 Interim )
29 November 2002Explanatory Meeting for Investors
Tokyu Corporation
(9005)http://www.tokyu.co.jp/

ContentsConsolidated
Summary of Consolidated Financial Results (Interim) 1
3Statements of Income (Interim)
5Statements of Income (Annual Forecast)
8Balance Sheets (Interim)
10Statements of Cash Flows (Interim)
Financial Summary 11
Non-Consolidated12Statements of Income (Interim)
14Statements of Income (Annual Forecast)
16Balance Sheets (Interim)
18Financial Summary
Tokyu Group
19Financial Results and Forecast of Tokyu Group Publicly Traded Companies and Combined
Notes to Financial Results and Forecast of Tokyu Group Publicly Traded Companies and Combined 25
26Statements of Cash Flows of Tokyu Group Publicly Traded Companies Combined

Summary of Consolidated Financial Results(FY3/2003 Interim)
Summary of Consolidated Financial Results (Interim)
Operating Rev.
Operating Income
Recurring Income
Net Income
Actual
599.7
35.0
20.2
- 12.0
Original Forecast(as of 31 May 2002)
600.0
10.3
1.3
27.3
vs. Prior Interim
+ 127.8
+ 6.6
+ 10.4
- 16.5
< Consolidated Statements of Income (Interim)> (¥ billion)Influence of Major Newly Consolidated Subsidiaries
(vs. Prior Interim : ¥ billion)Operating Rev. Operating Income
Tokyu Store Chain 136.1 2.2
Tokyu Logistic 8.9 0.6
Tokyu Hotel Chain 26.4 1.3
Total 171.5 4.3
< Consolidated Balance Sheets (Interim)>
Current assets
Fixed assets
Total Assets
Actual
623.6
1,929.7
2,553.4
vs. Prior Year End
- 27.1
+ 83.6
+ 56.4
Interest-bearing Debt
Total Liabilities
Minority interestsTotal Shareholders’
Equity
Actual
1,556.0
2,366.2
47.9
139.3
vs. Prior Year End
+ 18.3
+ 47.4
+ 25.8
- 16.8Liabilities, Minority
interests and Shareholders' equity
2,553.4 + 56.4
(¥ billion)
5.5% - 0.8PEquity Ratio 1

Summary of Consolidated Financial Results (Interim)
Scope of Consolidated Accounting
Consolidated or accounted for by equity-method : 285 ( B+C+D )
Number of companies(as of 30 Sep. 2002)
Scope : 405( A+B+C+D+E )
Tokyu Group : 398 companies and 9 public entities
Companies reflected in consolidated financial statements of thecompanies which are subject to Tokyu Corp’s equity-method :
119 E
Company not subject to equity method : 11
AffiliatedCompanies :
38
Companies subjectto equity method 37 D
Subsidiaries :248 Company subject
to equity-method : 1 C
ConsolidatedSubsidiaries : 247 B
Tokyu Corporation A
2

Consolidated
Statements of Income (Interim) - 1(\ million)
FY3/2002 FY3/2003 FY3/2003Interim Interim InterimActual Forecast Actual
as of 31 May 2002
A B B-A
Transportation <Operating revenues> 2.7% <Operating income> 18.1%Operating revenues 127,331 134,000 130,729 3,398 Tokyu Logistic(*1) 17,014, Tokyo Tsuun(*2) -5,476, Tokyu Freight Service(*2) -3,140, Tokyu Corp. 607Operating income 21,072 22,500 24,891 3,819 Tokyu Logistic(*1) 661, Tokyo Tsuun(*2) -153, Tokyu Corp. 2,586
Real Estate <Operating revenues> 4.0% <Operating income> 26.8%Operating revenues 66,036 67,600 68,655 2,619 Tokyu Corp. 3,113, Tokyu Logistic(*1) 545, Jotetsu -1,111Operating income 8,987 9,100 11,394 2,407 Tokyu Corp. 1,690, Tokyu Construction 617
Retail <Operating revenues> 250.9% <Operating income> 297.7%Operating revenues 56,161 196,700 197,096 140,935 Tokyu Store Chain(*1) 136,178Operating income 684 2,300 2,720 2,036 Tokyu Store Chain(*1) 2,249
Leisure and Services <Operating revenues> -4.8%Operating revenues 46,856 50,100 44,595 -2,261 Tokyu Tourist -1,537, Tokyu Corp. -1,056, its communications 676Operating income -3,688 -1,600 -1,208 2,480 Tokyu Tourist 1,185, Tokyu Corp. 630, its communications 376
Hotel <Operating revenues> 74.5%Operating revenues 34,330 58,500 59,901 25,571 Tokyu Hotel Chain(*3) 26,452, Tokyu Corp. 640Operating income -1,023 -600 -516 507 Tokyu Hotel Chain(*3) 1,395, Tokyu Corp. 357, Amortization of the consolidation adjusting account -1,338
Construction <Operating revenues> -24.8%Operating revenues 134,511 97,100 101,098 -33,413 Tokyu Construction -31,985Operating income 1,092 -4,800 -3,486 -4,578 Tokyu Construction -3,393, Amortization of the consolidation adjusting account -977
Other <Operating revenues> -1.2% <Operating income> -45.0%Operating revenues 36,095 37,000 35,651 -444 Toyoko Industry -936, Gold Pak -571, Tokyu Technical Service 614Operating income 1,753 900 964 -789 Gold Pak -302, Tokyu Tourist -245
Elimination / HeadquartersOperating revenues -29,454 -41,000 -38,025 -8,571Operating income -492 -500 258 750
Consolidated <Operating revenues> 27.1% <Operating income> 23.4%Operating revenues 471,869 600,000 599,702 127,833Operating income 28,384 27,300 35,017 6,633
*1 Newly Consolidated beginning this term*2 Included in Tokyu Logistic beginning this term(Tokyo Tsuun : Wholly-owned subsidiary, Tokyu Freight Service : Merged)
*3 Statements of income consolidated beginning second half of previous fiscal year
Major Variance(B-A)
IncreasedAmount
3

Consolidated
Statements of Income (Interim) - 2(\ million)
FY3/2002 FY3/2003 FY3/2003Interim Interim InterimActual Forecast Actual
as of 31 May 2002
A B B-A
Non-operating income 3,628 2,000 4,690 1,062Interest and dividend income 1,106 1,300 981 -125 Interest income 181, Dividend income 800Equity in income of affiliates - - 613 613Others 2,522 700 3,095 573
Non-operating expenses 22,220 19,000 19,484 -2,736Interest expenses 18,253 17,500 16,836 -1,417 Tokyu Corp. 11,189, Tokyu Construction 2,549Equity in losses of affiliates 1,408 200 - -1,408Others 2,559 1,300 2,647 88
Recurring income 9,792 10,300 20,223 10,431 106.5%
Extraordinary gains 8,289 3,800 6,233 -2,056Sale of subsidiary stocks 151 - 30 -121Application from the UrbanRailways Improvement Reserve 2,653 2,653 2,653 -Sale of fixed assets 3,172 - 2,045 -1,127Sale of investment securities 178 - 156 -22Others 2,133 1,147 1,348 -785
Extraordinary losses 6,277 7,000 45,053 38,776Retirement of fixed assets 393 - 631 238Sale of subsidiary stocks 1 - 608 607Write-down of real estate inventories 289 - 2,809 2,520Write-down of investment securities 386 - 2,548 2,162Provision for the Urban RailwaysImprovement Reserve 1,157 1,170 1,176 19Write-down of fixed assets - - 15,678 15,678 Tokyu YMM Properties 15,318Sale of fixed assets 1,519 - 17,657 16,138 Tokyu Corp. 15,044Retirement pay 199 - 1,234 1,035Past service costs for retirement benefits 1,513 - - -1,513Others 816 5,830 2,707 1,891
11,803 7,100 -18,595 -30,398Income taxes-current 6,723 6,500 12,810 6,087Income taxes-deferred 1,127 0 -18,925 -20,052Minority interests in income of consolidated subsidiaries -565 -700 -401 164
Net income 4,518 1,300 -12,078 -16,596
Remarks (B)
Income before income taxes andminority interests in income ofconsolidated subsidiaries
IncreasedAmount
4

Consolidated
Statements of Income (Annual Forecast) - 1FY3/2002 FY3/2003 FY3/2003
Actual Forecast Forecastas of 31 May 2002 as of 27 Nov. 2002
A B B-A
TransportationOperating revenues 250,867 268,600 262,500 11,633Operating income 33,955 40,000 39,100 5,145
Total assets 702,966 744,400 751,700 48,734Depreciation and amortization 29,636 32,000 30,400 764Capital expenditures 62,120 65,300 66,900 4,780
Real EstateOperating revenues 150,349 162,400 167,200 16,851Operating income 18,480 20,600 22,100 3,620
Total assets 768,542 710,700 682,300 -86,242Depreciation and amortization 13,776 13,000 13,000 -776Capital expenditures 24,188 21,800 39,100 14,912
RetailOperating revenues 110,682 390,200 389,700 279,018Operating income 827 5,800 6,300 5,473
Total assets 75,933 210,400 205,800 129,867Depreciation and amortization 1,250 5,200 5,200 3,950Capital expenditures 1,974 5,300 5,400 3,426
Leisure and ServicesOperating revenues 95,292 101,300 90,600 -4,692Operating income -5,888 -900 -2,500 3,388
Total assets 240,849 238,400 236,500 -4,349Depreciation and amortization 7,086 8,000 7,600 514Capital expenditures 4,004 5,600 4,000 -4
HotelOperating revenues 91,868 116,700 118,000 26,132Operating income -2,456 -1,300 -2,300 156
Total assets 187,680 183,900 181,400 -6,280Depreciation and amortization 6,647 7,700 7,800 1,153Capital expenditures 12,216 9,400 7,200 -5,016
*1 Newly Consolidated be*2 Included in Tokyu Log*3 Statements of income c
IncreasedAmount
(\ million)
<Operating revenues> 4.6% <Operating income> 15.2%Tokyu Logistic(*1) 33,072, Tokyo Tsuun(*2) -10,780, Tokyu Freight Service(*2) -6,482, Tokyu Corp. 2,011Tokyu Logistic(*1) 930, Tokyo Tsuun(*2) -777, Tokyu Freight Service(*2) -173, Tokyu Corp. 4,533
Tokyu Logistic(*1) 24,900Tokyu Logistic(*1) 1,500Tokyu Logistic(*1) 1,800
<Operating revenues> 11.2% <Operating income> 19.6%Tokyu Construction 17,675, Tokyu Logistic(*1) 1,075, Tokyu Corp. -2,855Tokyu Corp. 2,135, Tokyu Construction 1,205, Izukyu 888
<Operating revenues> 252.1% <Operating income> 661.8%Tokyu Store Chain(*1) 271,752Tokyu Store Chain(*1) 4,700
Tokyu Store Chain(*1) 150,400Tokyu Store Chain(*1) 3,900Tokyu Store Chain(*1) 4,500
<Operating revenues> -4.9% Tokyu Hotel Chain(*3) -4,599, Tokyu Corp. -1,688, its communications 1,544Tokyu Tourist 1,484, Tokyu Corp. 815, its communications 600
<Operating revenues> 28.4% Tokyu Hotel Chain(*3) 28,668, Tokyu Corp. 1,026Tokyu Corp.787, Tokyu Hotel Chain(*3) 749, Amortization of the consolidation adjusting account -1,338
eginning this termistic beginning this term(Tokyo Tsuun : Wholly-owned subsidiary, Tokyu Freight Service : Merged)
consolidated beginning second half of previous fiscal year
Major Variance(B-A)
5

Consolidated
Statements of Income (Annual Forecast) - 2
FY3/2002 FY3/2003 FY3/2003Actual Forecast Forecast
as of 31 May 2002 as of 27 Nov. 2002
A B B-A
ConstructionOperating revenues 364,618 360,400 387,300 22,682Operating income 9,896 9,100 8,900 -996
Total assets 307,173 306,800 305,000 -2,173Depreciation and amortization 955 900 900 -55Capital expenditures 465 500 700 235
OtherOperating revenues 77,109 113,600 110,000 32,891Operating income 2,032 3,400 3,100 1,068
Total assets 131,634 200,800 203,100 71,466Depreciation and amortization 1,744 1,600 3,200 1,456Capital expenditures 3,377 800 2,400 -977
Elimination / HeadquartersOperating revenues -82,631 -113,200 -125,300 -42,669Operating income -4,127 -2,900 400 4,527
Total assets 82,261 77,300 59,300 -22,961Depreciation and amortization 1,210 0 0 -1,210Capital expenditures -2,491 0 0 2,491
ConsolidatedOperating revenues 1,058,156 1,400,000 1,400,000 341,844Operating income 52,719 73,800 75,100 22,381
Total assets 2,497,041 2,672,700 2,625,100 128,059Depreciation and amortization 62,308 68,400 68,100 5,792Capital expenditures 105,856 108,700 125,700 19,844
IncreasedAmount
(\ million)
<Operating revenues> 6.2% <Operating income> -10.1%Tokyu Construction 21,657Tokyu Construction 1,077, Amortization of the consolidation adjusting account -1,819
<Operating revenues> 42.7% <Operating income> 52.6%Tokyu Car(*1) 29,945Tokyu Car(*1) 1,645
Tokyu Car(*1) 96,500
<Operating revenues> 32.3% <Operating income> 42.5%
*1 Statements of income consolidated beginning second half of this fiscal year
Major Variance(B-A)
6

Consolidated
Statements of Income (Annual Forecast) - 3FY3/2002 FY3/2003 FY3/2003
Actual Forecast Forecastas of 31 May 2002 as of 27 Nov. 2002
A B B-A
Non-operating income 9,517 10,000 15,000 5,483Interest and dividend income 1,560 1,700 1,500 -60Equity in income of affiliates - 2,600 3,500 3,500Amortization of the consolidationadjusting account 562 900 3,600 3,038Others 7,394 4,800 6,400 -994
Non-operating expenses 43,943 37,000 36,500 -7,443Interest expenses 35,362 34,800 33,500 -1,862Equity in losses of affiliates 2,678 - - -2,678Others 5,902 2,200 3,000 -2,902
Recurring income 18,293 46,800 53,600 35,307
Extraordinary gains 31,764 12,000 16,500 -15,264Sale of fixed assets 7,693 4,500 8,000 307Sale of subsidiary stocks 151 - 30 -121Sale of investment securities 562 - 156 -406Receipt of contribution for construction 13,378 - 34 -13,344Application from the Urban RailwaysImprovement Reserve 5,307 5,307 5,307 -Others 4,671 2,193 2,973 -1,698
Extraordinary losses 26,089 28,000 66,600 40,511Sale of fixed assets 5,020 - 20,000 14,980Advanced depreciation deductionconcerning fixed assets 8,419 - 68 -8,351Retirement of fixed assets 936 - 631 -305Write-down of real estate inventories 1,787 - 2,809 1,022Write-down of investment securities 1,444 - 2,548 1,104Retirement pay 433 - 1,234 801Provision for the Urban RailwaysImprovement Reserve 2,310 2,338 2,346 36Write-down of fixed assets 1,511 - 15,678 14,167Past service costs for retirementbenefits 1,513 - - -1,513Others 2,713 25,662 21,286 18,573
23,968 30,800 3,500 -20,468Income taxes-current 13,571 14,000 12,000 -1,571Income taxes-deferred 322 300 -11,900 -12,222Minority interests in income ofconsolidated subsidiaries -1,817 1,500 1,400 3,217
Net income 11,891 15,000 2,000 -9,891
Income before income taxes and minorityinterests in income of consolidatedsubsidiaries
IncreasedAmount
(\ million)
Interest income 400, Dividend income 1,100
Tokyu Corp. 22,200, Tokyu Construction 5,400
193.0%
Tokyu YMM Properties 15,318
-83.2%
Remarks (B)
7

Consolidated
Balance Sheets (Interim) - 1
A B B-A( Assets)
Current assets 650,865 623,669 -27,196Cash and cash equivalents 100,834 67,796 -33,038Trade notes and accounts receivable 172,269 131,004 -41,265Securities 441 553 112Inventories 333,053 364,279 31,226Deferred tax assets 5,706 9,727 4,021Others 44,987 56,446 11,459
-6,428 -6,136 292
Fixed assets 1,846,175 1,929,788 83,613
Property and equipment 1,504,391 1,562,010 57,619Buildings and structures 608,664 624,747 16,083
64,819 69,782 4,963Land 443,901 508,212 64,311Construction in progress 366,841 337,331 -29,510Others 20,164 21,936 1,772
Intangible assets 66,361 61,213 -5,14826,060 23,734 -2,326
Others 40,300 37,478 -2,822275,423 306,564 31,141
Investments in securities 169,275 157,663 -11,6123,227 3,247 20
Deferred tax assets 33,955 56,393 22,438Others 83,985 104,352 20,367
-15,019 -15,092 -73
Total assets 2,497,041 2,553,458 56,417
IncreasedAmount3/2002 9/2002
Allowance for doubtful accounts
Rolling stock and machinery
Consolidation adjusting account
Investments and long-term loans
Long-term loans
Allowance for doubtful accounts
( \million)
-4.2% Tokyu Store Chain (*1) 26,754, Tokyu Logistic (*1) 6,431Tokyu Finance and Accounting -30,904Tokyu Construction -49,290
Tokyu Construction 35,316
4.5% Tokyu Store Chain (*1) 118,904, Tokyu Logistic (*1) 13,550<Capital expenditures> 53,777 (FY3/2003 Interim Actual), 125,700( FY3/2003 Forecast)
Tokyu Store Chain (*1) 33,254, Tokyu Canada -8,682, Tokyu Corp. -6,143
Tokyu Store Chain (*1) 33,459, Tokyu Construction 18,734, Tokyu Corp. 15,198Tokyu Corp. -16,522
Shares of Tokyu Store Chain -11,225, Shares of Tokyu Logistic -4,610
Tokyu Store Chain (*1) 10,094
2.3% Tokyu Store Chain (*1) 145,658, Tokyu Logistic (*1) 19,982*1 Newly Consolidated beginning this term
Major Variance( B-A)
8

Consolidated
Balance Sheets (Interim) - 2
A B B-A( Liabilities, M inority interests and Shareholders' equity)
Current liabilities 1,131,358 1,199,005 67,647Trade notes and accounts payable 189,142 164,718 -24,424Short-term loans 601,744 619,537 17,793Current portion of bonds 37,640 78,000 40,360Accrued income taxes 8,483 12,391 3,908
590 481 -109Bonus payment reserve 11,811 14,225 2,414Advances received 193,397 228,373 34,976Commercial Paper 8,000 - -8,000Others 80,549 81,276 727
Long-term liabilities 1,143,673 1,124,919 -18,754336,101 311,101 -25,000554,238 547,404 -6,834
79,127 90,207 11,080
3,307 3,506 199
3,432 3,205 -227136,829 137,365 536
10,176 12,494 2,318
7,605 7,605 -12,855 12,028 -827
<Total interest-bearing debt> 1,537,724 1,556,042 18,318( Bonds+ Loans+ Commercial Paper)
Reserve under special act 43,771 42,294 -1,477
43,771 42,294 -1,477Total liabilities 2,318,803 2,366,219 47,416M inority interests 22,094 47,913 25,819
Common stock 108,819 108,819 -Capital surplus 120,702 120,715 13Earned surplus -72,983 -88,077 -15,094Premises revaluation difference 10,871 10,878 7
-743 1,759 2,502
-9,980 -11,729 -1,749Treasury stock -543 -3,042 -2,499
Total shareholders' equity 156,143 139,324 -16,819
2,497,041 2,553,458 56,417
Foreign currency translation adjustingaccount
Unrealized holding gains on securities
Liabilities incurred from applyingequity methodDeposits on contractDeferred tax liabilitiesDeferred tax liabilities fromrevaluation of land
Total liabilities, minority interests andshareholders' equity
Others
The Urban Railways ImprovementReserve
BondsLong-term loansReserve for retirement allowancefor employeesReserve for retirement allowancefor directors and corporate auditors
Reserve for compensation forcompleted works
IncreasedAmount3/2002 9/2002
( \ million)
6.0% Tokyu Store Chain (*1) 60,746, Tokyu Logistic (*1) 2,918Tokyu Construction -41,544, Tokyu Store Chain (*1) 13,065
Tokyu Corp. 40,360
Tokyu Construction 25,555, Tokyu Corp. 10,591
-1.6% Tokyu Store Chain (*1) 51,590, Tokyu Logistic (*1) 3,576Tokyu Corp. -25,000
Tokyu Store Chain (*1) 22,978, Tokyu Hotel Chain -8,572
Existing -41,391 (Tokyu Construction -17,065, Tokyu Corp. -11,711), Tokyu Store Chain (*1) 59,166
-3.4%
2.0% Tokyu Store Chain (*1) 112,337, Tokyu Logistic (*1) 6,494116.9%
-10.8% <Equity Ratio> 5.5% (-0.8P)
2.3%*1 Newly Consolidated beginning this term
M ajor V ariance( B-A)
9

Consolidated
Statements of Cash Flows (Interim)(\ million)
FY3/2002 FY3/2003 FY3/2003
Interim Interim Annual Forecast
Actual Actual As of 27 Nov. 2002
Cash Flows from Operating Activities 13,885 42,810 Tokyu Corp. 44,141 143,000Tokyu Construction -11,802
Cash Flows from Investing Activities -30,225 -28,150 Capital expenditures -53,777 -50,800Sale of fixed assets 22,561
Cash Flows from Financing Activities -27,453 -44,533 Interest-bearing debt -41,391 -112,600Dividend -2,803
Net Increase in Cash and Cash Equivalents -41,970 -31,606 -20,400
Cash and Cash Equivalents at End of the Period 90,805 74,688 90,600
Reference
10

Consolidated
Financial Summary(\m illio n )
F Y 3 /1 9 9 3 F Y 3 /1 9 9 4 F Y 3 /1 9 9 5 F Y 3 /1 9 9 6 F Y 3 /1 9 9 7 F Y 3 /1 9 9 8 F Y 3 /1 9 9 9 F Y 3 /2 0 0 0 F Y 3 /2 0 0 1 F Y 3 /2 0 0 2
O p e ra tin g R e v e n u e s 4 7 6 ,5 8 0 4 5 8 ,6 6 2 4 6 9 ,6 5 0 4 8 4 ,0 3 7 4 9 8 ,7 4 6 4 8 4 ,8 3 2 5 7 3 ,4 2 3 9 9 5 ,2 2 8 1 ,0 1 2 ,8 9 0 1 ,0 5 8 ,1 5 61 7 1 ,7 8 4 1 6 9 ,7 0 7 1 7 4 ,8 4 4 1 8 2 ,5 4 1 1 9 1 ,8 4 5 1 8 8 ,5 2 7 1 9 9 ,0 4 1 2 4 0 ,0 9 2 2 5 9 ,7 9 5 2 5 0 ,8 6 71 1 6 ,7 9 6 1 0 1 ,3 4 5 1 0 0 ,9 3 2 1 1 2 ,0 7 0 1 1 4 ,0 6 7 1 1 3 ,4 7 8 1 3 7 ,6 4 2 1 2 9 ,1 3 9 1 5 0 ,0 7 1 1 5 0 ,3 4 9
R e ta il 1 1 5 ,2 8 1 1 0 2 ,3 9 1 1 1 2 ,8 6 3 1 1 1 ,7 0 3 1 2 1 ,3 0 7 9 8 ,5 7 8 1 4 5 ,0 7 8 1 0 7 ,7 6 7 1 0 1 ,4 2 4 1 1 0 ,6 8 28 5 ,4 3 7 9 2 ,0 8 4 8 9 ,0 3 5 8 7 ,9 3 3 9 1 ,3 1 8 8 9 ,5 3 0 9 7 ,8 2 4 1 4 1 ,1 4 5 1 5 0 ,5 9 7 9 5 ,2 9 2
H o te l (* 1 ) - - - - - - - - - 9 1 ,8 6 8C o n s tru c t io n ( * 2 ) - - - - - - 3 ,3 2 2 4 2 5 ,9 2 1 4 1 2 ,1 9 5 3 6 4 ,6 1 8O th e r 1 8 ,3 0 8 1 8 ,7 4 7 1 6 ,9 6 4 2 0 ,5 0 3 2 1 ,8 3 9 1 1 ,9 8 6 1 2 ,4 9 0 1 8 ,4 5 7 1 9 ,6 4 3 7 7 ,1 0 9
-3 1 ,0 2 8 -2 5 ,6 1 5 -2 4 ,9 9 0 -3 0 ,7 1 4 -4 1 ,6 3 2 -1 7 ,2 6 7 -2 1 ,9 7 5 -6 7 ,2 9 5 -8 0 ,8 3 7 -8 2 ,6 3 1
O p e ra tin g In c o m e 4 7 ,8 5 0 4 0 ,0 7 9 4 4 ,3 1 5 4 9 ,7 7 3 6 0 ,9 7 1 5 3 ,4 9 5 4 8 ,9 6 5 6 0 ,4 1 6 6 4 ,3 7 4 5 2 ,7 1 92 5 ,4 5 9 2 2 ,7 2 7 2 2 ,5 5 1 2 8 ,3 2 4 3 4 ,9 4 8 3 6 ,9 5 7 3 4 ,9 1 0 3 0 ,3 5 0 3 6 ,7 5 4 3 3 ,9 5 52 7 ,1 7 8 2 2 ,8 8 3 2 7 ,5 2 5 2 6 ,6 3 8 2 9 ,2 3 2 2 4 ,6 8 2 2 1 ,9 5 8 2 8 ,8 7 0 2 2 ,3 4 7 1 8 ,4 8 0
R e ta il 4 3 1 4 2 8 3 2 0 3 1 5 9 6 -7 2 1 -3 2 2 -6 4 2 9 4 8 2 7-6 ,2 9 2 -7 ,2 9 1 -7 ,3 9 1 -7 ,1 3 9 -4 ,9 2 3 -8 ,3 8 5 -8 ,3 0 3 -1 1 ,8 3 9 -4 ,9 4 3 -5 ,8 8 8
H o te l (* 1 ) - - - - - - - - - -2 ,4 5 6C o n s tru c t io n ( * 2 ) - - - - - - 1 8 1 4 ,9 5 2 1 4 ,7 1 3 9 ,8 9 6O th e r 1 ,3 4 4 1 ,1 0 7 1 ,3 8 4 1 ,4 4 3 1 ,4 4 2 6 8 1 5 7 2 1 ,9 0 8 1 ,5 0 2 2 ,0 3 2
-2 7 2 2 2 4 -7 3 1 9 1 1 7 5 2 8 0 1 3 1 -3 ,7 6 0 -6 ,2 9 4 -4 ,1 2 7
4 3 ,3 7 8 4 4 ,8 8 1 4 3 ,7 0 0 4 1 ,3 8 4 4 2 ,0 7 4 4 5 ,5 6 0 5 2 ,2 6 8 5 0 ,9 0 8 5 6 ,1 8 5 6 2 ,3 0 8
-2 9 1 -2 ,3 0 8 -9 7 8 1 6 9 -6 8 4 -1 ,2 4 5 -3 ,3 7 4 -1 ,7 8 9 -8 ,2 9 9 -2 ,6 7 8
R e c u rr in g In c o m e 1 2 ,2 2 4 1 0 ,2 5 9 2 1 ,9 6 6 2 4 ,5 9 7 3 3 ,0 1 4 1 8 ,8 2 2 2 4 ,4 5 4 3 1 ,2 4 9 2 3 ,6 3 4 1 8 ,2 9 3
2 ,0 5 9 9 9 3 1 ,8 8 9 2 ,0 0 0 3 0 ,7 5 1 2 ,1 8 3 -2 7 ,9 0 0 1 ,7 6 4 -3 0 ,1 6 3 1 1 ,8 9 1
T o ta l A sse ts 1 ,4 9 5 ,6 8 9 1 ,5 2 2 ,9 0 1 1 ,5 6 9 ,9 1 2 1 ,5 7 9 ,3 4 0 1 ,5 9 0 ,8 9 2 1 ,7 1 7 ,5 4 6 2 ,3 6 0 ,4 2 7 2 ,5 2 8 ,3 5 3 2 ,4 9 9 ,8 8 6 2 ,4 9 7 ,0 4 1
S h a re h o ld e rs ' E q u ity 2 3 9 ,8 2 6 2 3 5 ,6 3 8 2 3 8 ,2 4 8 2 2 8 ,0 5 9 2 4 8 ,8 9 0 2 3 9 ,7 7 8 1 7 6 ,3 1 4 1 7 6 ,4 6 5 1 3 9 ,0 6 6 1 5 6 ,1 4 3
In te re s t-b e a r in g D e b t 9 1 1 ,1 5 7 9 2 6 ,9 3 4 9 5 4 ,9 6 4 9 6 2 ,9 1 2 9 1 8 ,8 4 5 9 8 1 ,3 5 5 1 ,4 3 8 ,7 4 0 1 ,5 3 6 ,8 3 1 1 ,5 0 6 ,9 1 6 1 ,5 3 7 ,7 2 4L o a n s 7 5 1 ,7 9 4 7 3 2 ,9 0 6 7 0 9 ,2 3 6 7 1 7 ,2 8 6 7 1 0 ,7 5 5 7 1 6 ,3 5 5 1 ,0 8 6 ,9 0 0 1 ,1 4 8 ,9 9 1 1 ,1 4 5 ,8 7 5 1 ,1 5 5 ,9 8 3B o n d s 1 5 9 ,3 6 3 1 9 4 ,0 2 8 2 4 5 ,7 2 8 2 4 5 ,6 2 6 2 0 8 ,0 9 0 2 6 5 ,0 0 0 3 3 1 ,8 4 0 3 6 3 ,8 4 0 3 6 1 ,0 4 1 3 7 3 ,7 4 1C o m m e rc ia l P a p e r - - - - - - 2 0 ,0 0 0 2 4 ,0 0 0 - 8 ,0 0 0
- - - 1 0 0 ,1 4 3 1 0 9 ,9 3 9 1 2 5 ,0 2 8 1 0 1 ,8 4 9 1 4 6 ,7 3 9 1 0 7 ,3 1 6 1 0 5 ,8 5 6
6 2 6 6 1 1 3 1 1 5 1 1 6 1 4 7 1 7 1 2 3 2 2 2 3 2 4 31 5 1 4 5 5 5 5 5 5 4 4 5 7 4 6 4 7 4 2
* 1 In d e p e d e n tly l is te d f ro m " L e isu re a n d se rv ic e s" s e g m e n t f ro m F Y 3 /2 0 0 2 .* 2 In d e p e d e n tly l is te d f ro m " O th e r" s e g m e n t f ro m F Y 3 /1 9 9 9 .* 3 D a ta a v a ila b le f ro m F Y 3 /1 9 9 6
D e p re c ia tio n a n d A m o rtiz a t io n
E q u ity in In c o m e o f A ffi l ia te s
N u m b e r o f c o n so lid a te d su b s id ia r ie sN u m b e r o f e q u ity -m e th o d a f f i l ia te s
N e t In c o m e
C a p ita l E x p e n d itu re s (* 3 )
E lim in a tio n
T ra n sp o rta tio nR e a l e s ta te
T ra n sp o rta tio nR e a l e s ta te
L e isu re a n d se rv ic e s
L e isu re a n d se rv ic e s
E lim in a tio n
11

Non-Consolidated
Statements of Income (Interim) - 1(\ million)
FY3/2002 FY3/2003 FY3/2003Interim Interim InterimActual Forecast Actual
as of 10 May 2002
A B B-A
Railway <Operating revenues> +0.9% <Operating income> +13.5%Operating revenues 66,575 67,100 67,202 627
Passenger revenues 58,734 59,282 59,691 956 +1.6% Commuter 25,803 25,878 25,950 146 +0.6%, Business 139 (+0.6%), Student 7 (+0.3%)Non-commuter 32,931 33,404 33,741 809 +2.5%
Misc. transport revenues 7,840 7,818 7,510 -329Operating expenses 47,469 47,100 45,516 -1,953 Retirement cost of fixed assets -675, Depreciation and Amortization -559
Operating income 19,105 20,000 21,685 2,580<Passenger Volume> Total +1.0%, Commuter +0.1% (Business +0.2%, Student -0.2%), Non-commuter +2.3%
Real Estate <Operating revenues> +7.5% <Operating income> +21.6%Real Estate Sales <Operating revenues> +9.7% <Operating income> +16.3%
Operating revenues 18,955 18,400 20,797 1,842 Land & Housing 1,883 Operating expenses 15,771 15,400 17,095 1,323 Real Estate Cost 1,328Operating income 3,183 3,000 3,702 519 Land & Housing 555
Real Estate Leasing <Operating revenues> +5.6% <Operating income> 25.3%Operating revenues 22,481 23,500 23,729 1,248 JR Tokyu Meguro Building 606, Tokyu Department Store's Toyoko Store 148Operating expenses 17,859 19,100 17,937 77Operating income 4,621 4,400 5,792 1,170 <Vacancy Ratio as of 9/2002> 1.54% (0.27% as of 3/2002)
Hotel <Operating revenues> +3.2%Operating revenues 24,827 26,400 25,632 804 Cerulean Tower Tokyu Hotel 1,779, Closure of Kyoto Tokyu Inn -694Operating expenses 25,951 27,300 26,399 448 Cerulean Tower Tokyu Hotel 514, Closure of Kyoto Tokyu Inn -618
Operating income -1,123 -900 -766 356<Occupancy> 80.8% (+3.2P) (Cerulean Tower Tokyu Hotel 79.2% (+23.5P), Others 80.9% (+2.4P))
Other <Operating revenues> -12.6%Operating revenues 7,611 6,600 6,650 -961 Media -743, Golf Course -163, Grandeco (ski resort) -13Operating expenses 9,232 8,300 7,641 -1,591 Media -1,056, Golf Course -340, Grandeco (ski resort) -142Operating income -1,620 -1,700 -990 630 Media 313, Golf Course 177, Grandeco (ski resort) 128
Total <Operating revenues> +2.5% <Operating income> +21.8%Operating revenues 140,451 142,000 144,012 3,561Operating expenses 116,284 117,200 114,589 -1,695Operating income 24,166 24,800 29,423 5,256
Major Variance(B-A)
IncreasedAmount
12
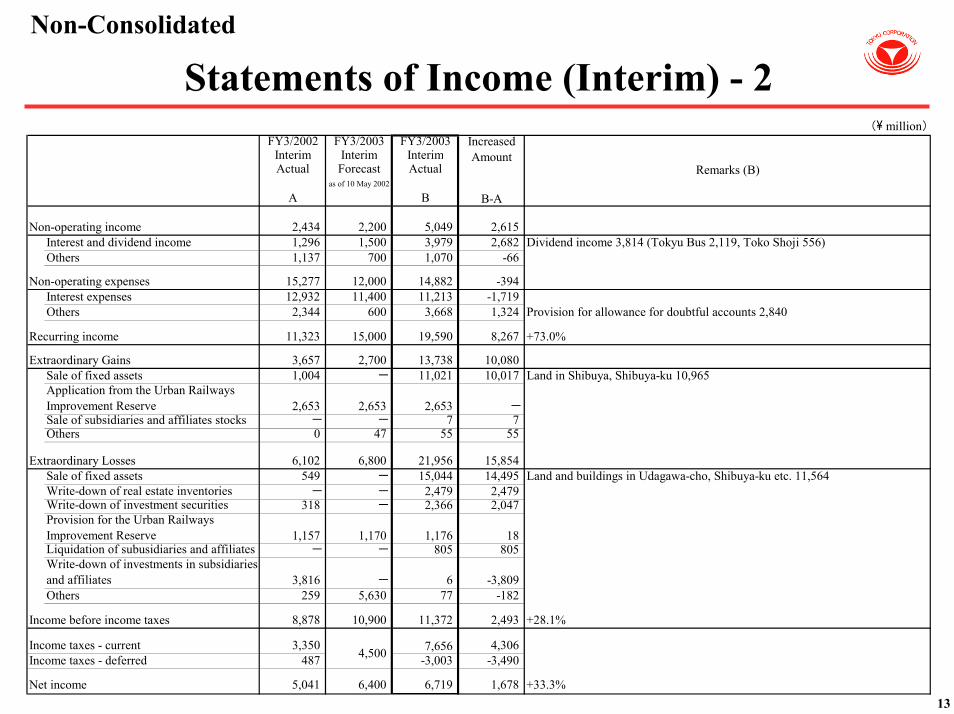
Non-Consolidated
Statements of Income (Interim) - 2(\ million)
FY3/2002 FY3/2003 FY3/2003Interim Interim InterimActual Forecast Actual
as of 10 May 2002
A B B-A
Non-operating income 2,434 2,200 5,049 2,615Interest and dividend income 1,296 1,500 3,979 2,682 Dividend income 3,814 (Tokyu Bus 2,119, Toko Shoji 556)Others 1,137 700 1,070 -66
Non-operating expenses 15,277 12,000 14,882 -394Interest expenses 12,932 11,400 11,213 -1,719Others 2,344 600 3,668 1,324 Provision for allowance for doubtful accounts 2,840
Recurring income 11,323 15,000 19,590 8,267 +73.0%
Extraordinary Gains 3,657 2,700 13,738 10,080Sale of fixed assets 1,004 - 11,021 10,017 Land in Shibuya, Shibuya-ku 10,965
2,653 2,653 2,653 -- - 7 7
Others 0 47 55 55
Extraordinary Losses 6,102 6,800 21,956 15,854549 - 15,044 14,495 Land and buildings in Udagawa-cho, Shibuya-ku etc. 11,564
- - 2,479 2,479318 - 2,366 2,047
1,157 1,170 1,176 18- - 805 805
3,816 - 6 -3,809Others 259 5,630 77 -182
Income before income taxes 8,878 10,900 11,372 2,493 +28.1%
Income taxes - current 3,350 7,656 4,306Income taxes - deferred 487 -3,003 -3,490
Net income 5,041 6,400 6,719 1,678 +33.3%
4,500
Remarks (B)
IncreasedAmount
Write-down of investments in subsidiariesand affiliates
Write-down of investment securitiesProvision for the Urban RailwaysImprovement Reserve
Application from the Urban RailwaysImprovement ReserveSale of subsidiaries and affiliates stocks
Sale of fixed assetsWrite-down of real estate inventories
Liquidation of subusidiaries and affiliates
13

Non-Consolidated
Statements of Income (Annual Forecast) - 1(\ million)
FY3/2002 FY3/2003 FY3/2003 IncreasedActual Forecast Forecast Amount
as of 10 M ay 2002 as of 25 Oct. 2002
A B B-A
Railway <Operating revenues> +1.7% <Operating income> +15.4%Operating revenues 132,486 134,500 134,700 2,214
117,181 118,661 119,115 1,934 +1.7%Commuter 50,867 50,802 51,129 262 +0.5% , Business 257 (+0.6% ), Student 4 (+0.1% )Non-commuter 66,313 67,859 67,986 1,673 +2.5%
15,304 15,838 15,585 281
Operating expenses 102,320 99,700 99,900 -2,420Retirement cost of fixed assets -2,900,Depreciation and Amortization -1,000, Cost of repairs 1,500
Operating income 30,166 34,800 34,800 4,634<Passenger V olume>Total +1.0% , Commuter +0.1% ( Business +0.3% , Student -0.4% ), Non-commuter +2.3%
Real Estate <Operating revenues> -2.8% <Operating income> +12.4%Real Estate Sales <Operating revenues> -6.8% <Operating income> +31.3%
Operating revenues 57,279 52,300 53,400 -3,879Operating expenses 49,511 42,100 43,200 -6,311Operating income 7,767 10,200 10,200 2,433 M arginal profit from Land & Housing sales 3,100
Real Estate Leasing <Operating revenues> +2.2% <Operating income> -3.2%Operating revenues 46,184 45,900 47,200 1,016 JR Tokyu M eguro Building 1,200, Tokyu Department Store's Toyoko Store 600Operating expenses 36,785 38,100 38,100 1,315 Building clearance expense 1,000Operating income 9,398 7,800 9,100 -298
Hotel <Operating revenues> +2.1%Operating revenues 50,367 52,000 51,400 1,033 Cerulean Tower Tokyu Hotel 2,100, Closure of Kyoto Tokyu Inn -1,400
Operating expenses 52,487 55,200 54,500 2,013
Cerulean Tower Tokyu Hotel 1,100,Settlement of hotel operation company retiring-allowance 1,800,Closure of K yoto Tokyu Inn -1,400
Operating income -2,120 -3,200 -3,100 -980
Other <Operating revenues> -11.1%Operating revenues 15,641 14,000 13,900 -1,741 M edia -1,600, Golf Course 0, Grandeco(ski resort) 0Operating expenses 18,657 16,300 16,100 -2,557 M edia -2,000, Golf Course -100, Grandeco(ski resort) -200Operating income -3,015 -2,300 -2,200 815 M edia 400, Golf Course 100, Grandeco(ski resort) 200
Total <Operating revenues> -0.5% <Operating income> +15.7%Operating revenues 301,959 298,700 300,600 -1,359Operating expenses 259,762 251,400 251,800 -7,962Operating income 42,196 47,300 48,800 6,604
M ajor V ariance(B-A)
Passenger revenues
M isc. transport revenues
14

Non-Consolidated
Statements of Income (Annual Forecast) - 2(\ million)
FY3/2002 FY3/2003 FY3/2003 IncreasedActual Forecast Forecast Amount
as of 10 May 2002 as of 25 Oct. 2002
A B B-A
Non-operating income 6,925 8,900 11,900 4,9751,870 2,100 4,700 2,830 Dividend income 4,400(Tokyu Bus 2,119, Toko Shoji 556)
Others 5,054 6,800 7,200 2,146
Non-operating expenses 31,648 24,200 26,700 -4,948Interest expenses 24,423 22,600 22,200 -2,223Others 7,225 1,600 4,500 -2,725 Provision for allowance for doubtful accounts 2,840
Recurring income 17,473 32,000 34,000 16,527 +94.6%
Extraordinary gains 23,169 8,400 22,500 -6693,559 3,000 17,100 13,541 Land in Shibuya, Shibuya-ku 10,965
5,307 5,307 5,307 013,315 - - -13,315
738 - - -738Others 249 93 93 -156
Extraordinary losses 25,710 27,400 43,400 17,6902,468 - 17,400 14,932 Land and buildings in Udagawa-cho, Shibuya-ku etc. 11,564
924 - 2,480 1,556610 - 2,373 1,763
2,310 2,338 2,346 36- - 805 805
11,677 - - -11,677
7,447 - - -7,447Others 271 25,062 17,996 17,725
14,932 13,000 13,100 -1,832 -12.3%
8,308Income taxes - deferred -1,032
Net income 7,656 7,600 7,600 -56 -0.7%
Income taxes - current
Provision for the Urban RailwaysImprovement Reserve
Write-down of investments insubsidiaries and affiliates
Remarks(B)
5,400 5,500 -1,776
Write-down of real estate inventoriesWrite-down of investment securities
Liquidation of subsidiaries and affiliates
Advanced depreciation deductionconcerning fixed assets
Income before income taxes
Interest and dividend income
Sale of fixed assets
Sale of fixed assetsApplication from the Urban RailwaysImprovement ReserveReceipt of contribution for constructionSale of subsidiaries and affiliates stocks
15

Non-Consolidated
Balance Sheets (Interim) - 1(\ million)
A B B-A(Assets)
187,604 175,430 -12,173 -6.5%4,251 5,313 1,0611,511 1,425 -85
16,905 13,515 -3,3891,438 1,457 19
Accrued consumption taxes 421 - -42114,348 12,511 -1,836
135,733 126,356 -9,376 Land -10,920(Devaluation -2,479)2,777 2,829 52
886 990 1032,961 4,540 1,5798,032 8,749 717
-1,664 -2,262 -598
1,386,152 1,398,406 12,254 +0.9%<Capital expenditures> 37,571 ( FY3/2003 Interim Actual ), 94,000(FY3/2003 Forecast)
287,766 286,963 -802 Sale of land and buildings in Udagawa-cho, Shibuya-ku etc. -18,417172,197 184,405 12,208 Purchase of West & South buildings of Tokyu Dept. Store's Toyoko Store 16,49745,210 43,873 -1,337 Toyoko Line quadruple-tracking project 1,67693,297 91,581 -1,716 Oimachi Line Improvement & Extension project 1,43818,208 17,875 -332 Toyoko Line & MM21 Line mutual through train service project 1,354
349,185 332,662 -16,522 Depreciation -19,431420,285 441,044 20,758
Investments in securities 71,724 72,185 460
288,252 311,743 23,490916 916 -
19,482 19,482 -6,908 6,484 -423
22,819 22,866 4722,143 21,527 -615
-11,961 -14,162 -2,201
Total assets 1,573,756 1,573,836 80 +0.0%
Investments in capitalLong-term loansLong-term prepaid expenses
Fixed assets relating to each business areaConstruction in progressInvestments and long-term loans
Investments in subsidiaries andaffiliates
Fixed assets of other businesses
Deferred tax assetsOthersAllowance for doubtful accounts
Fixed assets
Fixed assets of railway business
Current assetsCashAccrued fareAccounts receivableAccrued revenues
Short-term loans Land and housing for saleSuppliesPrepaid expenses
Fixed assets of real estate business Fixed assets of hotel business
IncreasedAmount3/2002 9/2002 Major Variance(B-A)
Present Value Application 3,275, Devaluation -2,372Tokyu YMM Properties 23,000 ( Undertaking capital-increase ),Shibuya Development 7,455 ( Purchase ), Tokyu Bus -3,950 ( Capital decrease with write offs ),Tokyu Canada -3,465 ( Resolution to dissolve / allocate proceeds from liquidation )
Deferred tax assetsOthersAllowance for doubtful accounts
16

Non-Consolidated
Balance Sheets (Interim) - 2(\ m illion)
A B B -A(L iab ilities and Shareholders' equity)
C urren t liab ilities 440 ,824 469,327 28 ,502 + 6.5%Short-te rm loans 240 ,666 227,634 -13 ,032
37,690 78,000 40 ,310A ccoun ts payab le 12 ,828 5 ,611 -7 ,217A ccrued expenses 5 ,003 5 ,476 472
5,120 6 ,929 1 ,8082 ,756 2 ,915 158
D eposits rece ived 13,331 13,986 654U nearned fare 6 ,848 7 ,611 762A dvance received 97 ,723 108,314 10 ,591 For subcon tracted railw ay construc tion 9 ,029B onus paym en t reserve 3 ,807 3 ,834 27C om m ercial paper 8 ,000 - -8 ,000
7 ,047 9 ,015 1 ,967
L ong-te rm liab ilities 831 ,650 799,062 -32 ,587 -3 .9%B onds 275 ,300 250,300 -25 ,000C onvertib le bonds 52 ,000 52,000 -L ong-term loans 381 ,878 379,019 -2 ,858
12 ,230 11,493 -736
1 ,508 1 ,145 -363107,786 104,547 -3 ,239 G uaran tee and D eposit w ith land lo rd -2 ,127 , G olf M em bersh ip -1 ,111
946 556 -389
< T ota l in terest-bearing deb t> 995,535 986,954 -8 ,581
R eserve under specia l act 43 ,771 42,294 -1 ,477 -3 .4%43,771 42,294 -1 ,477
1 ,316 ,246 1 ,310 ,684 -5 ,562 -0 .4%
C om m on stock 108,819 108,819 -C apital su rp lus 117 ,671 117,671 -
C apita l surp lus reserve 117 ,671 27,204 -90 ,466 T ransferO ther capital su rp lus - 90,466 90 ,466
E arned su rp lus 31 ,914 35,743 3 ,829E arned su rp lus reserve 13 ,002 - -13 ,002 T ransferA ppropria ted 950 950 -U nappropria ted 17 ,961 34,793 16 ,831
-716 1 ,181 1 ,897-179 -263 -84
257,509 263,152 5 ,642 + 2.2% < E qu ity R atio> 16 .7% (+ 0 .3P)1 ,573 ,756 1 ,573 ,836 80 + 0.0%
U nrealized ho ld ing ga ins on securities
T ota l liab ilities and shareho lders ' equ ity
T reasu ry s tock
O thers
T he U rban R ailw ays Im provem ent
D eposits on con trac t
T ota l shareho lders ' equ ity
T ota l liab ilities
(B onds + L oans+ C om m ercia l pap er)
O thers
R eserve for re tirem ent a llow ance ford irec to rs and co rporate audito rs
R eserve for re tirem ent a llow ance forem ployees
C urren t po rtion o f bonds
A ccrued incom e taxesD eposits o f connection fare
M ajor V ariance(B -A )3/2002 9/2002 Increased
A m ount
17

Non-Consolidated
Financial Summary(\ m illion)
FY 3/1993 FY 3/1994 FY 3/1995 FY 3/1996 FY 3/1997 FY 3/1998 FY 3/1999 FY 3/2000 FY 3/2001 FY 3/2002
269,806 265,910 264,917 282,414 292,399 284,262 301,977 282,691 292,499 301,959106,542 105,784 105,490 113,405 122,874 122,352 123,370 124,177 127,990 132,486
72,826 70,941 70,773 82,445 79,914 77,822 99,900 85,633 91,127 103,46353,353 51,644 50,182 48,160 48,510 45,894 43,998 42,396 43,857 50,36737,085 37,540 38,470 38,402 41,099 38,192 34,707 30,483 29,524 15,641
229,514 229,164 223,004 235,705 235,416 231,111 251,604 228,768 246,166 259,76246,948 45,697 45,655 46,878 45,344 45,755 47,342 50,361 45,873 42,58772,638 75,501 72,922 72,810 78,116 74,442 74,792 77,305 85,878 97,13159,871 54,368 52,909 63,009 61,258 61,302 81,530 54,635 64,262 64,05515,743 17,170 16,222 18,180 16,037 15,159 13,116 13,233 12,757 13,71034,312 36,426 35,294 34,827 34,660 34,452 34,822 33,232 37,393 42,277
40,292 36,746 41,913 46,708 56,982 53,150 50,373 53,922 46,333 42,19622,997 20,469 20,393 26,681 33,429 34,629 34,507 29,500 32,362 30,16622,003 22,501 27,025 26,153 29,200 25,589 23,781 31,847 20,688 17,165
1 ,139 1 ,008 973 362 113 -1,331 -2 ,409 -2 ,310 -2 ,099 -2,120-5 ,848 -7 ,233 -6,480 -6 ,488 -5 ,760 -5,737 -5 ,505 -5 ,114 -4 ,618 -3,015
11,916 12,083 23,989 24,827 30,897 20,235 32,890 31,026 18,443 17,473
6 ,794 6 ,245 6,258 6 ,272 6 ,283 6,296 9 ,501 6 ,306 6 ,997 7,656
1 ,271 ,280 1,317 ,080 1 ,363,246 1 ,366 ,231 1 ,356 ,106 1,406,454 1 ,460 ,409 1 ,540 ,669 1,571 ,073 1,573,756
232,279 232,941 233,939 234,628 235,332 236,047 241,538 242,259 248,833 257,509
767,586 794,034 840,795 828,521 801,900 824,495 897,161 980,292 974,717 995,535618,893 610,362 597,467 585,195 574,578 531,805 548,671 605,802 622,727 622,545
G overnm ent financial agency 132,067 146,950 170,237 185,595 197,131 205,133 243,359 267,677 285,327 286,337Private financial institu te 486 ,825 463,412 427,229 399,600 377,446 326,672 305,312 338,125 337,400 336,207
148,693 183,672 243,328 243,326 227,322 292,690 328,490 350,490 351,990 364,990- - - - - - 20,000 24,000 - 8,000
30,157 27,597 24,908 22,082 19,113 15,994 12,717 9 ,224 5,570 1,696 C apital E xpenditures 136,108 86,568 86,746 68,346 74,004 88,995 80,616 106,173 87,473 81,865
R ailw ay 49,070 49,737 49,539 41,002 44,875 34,638 33,021 61,084 50,857 35,300O thers 87 ,038 36,831 37,207 27,344 29,129 54,357 47,595 45,089 36,615 46,564
Secured loan from Japan R ailw ayC onstruction Public C orporation
B ondsC om m ercial Paper
T otal A ssets
Shareholders ' E quity
Interest-bearing D ebtL oans
O perating E xpenses
O perating Incom eR ailw ayR eal estate
D epreciation and am ortization
O perating R evenuesR ailw ayR eal estate
O therH otel
N et Incom e
W ages, salaries and benefitsSundry operating expenses C ost o f salesT axation
O ther
R ecurring Incom e
H otel
18

Tokyu GroupFinancial Forecast of Tokyu Group Publicly Traded Companies and Combined
for the Fiscal Year Ending 31 March 2003
CombinedTokyuCorp.
TokyuConstruction
TokyuTourist Izukyu
TokyuLogistic
TokyuStore Chain
TokyuLand
TokyuCommunity
TokyuLivable
* 1 * 1 * 1 * 1 * 1 * 2 * 2
Operating Revenues(\million) 2,564,393 1,400,000 396,000 30,300 16,809 34,900 273,000 505,000 92,900 38,700Operating Income(\million) 121,863 75,100 9,900 685 1,054 1,570 4,700 28,000 3,110 3,360Recurring Income(\million) 82,615 53,600 4,500 670 143 2,090 3,500 17,500 3,380 3,320Net Income(\million) 23,168 2,000 1,300 280 333 2,440 1,600 6,000 1,870 1,300Depreciation and Amortization(\million) 101,977 75,700 1,541 604 1,592 1,871 4,100 11,800 693 610Interest and Dividend Income(\million) 1,920 1,500 300 40 21 27 120 190 27 15Interest Expenses(\million) 50,084 33,500 5,400 3 1,046 231 800 10,880 36 140Total Assets(\million) 3,961,271 2,625,100 501,500 30,442 76,294 42,701 139,800 869,800 46,115 52,600Capital Expenditures(\million) 184,484 125,700 21,481 604 1,800 2,494 5,300 21,300 1,288 5,200Shareholders' Equity(\million) - 159,500 56,570 756 12,606 19,120 34,100 69,400 16,720 9,300Interest-bearing Debt(\million) 2,188,280 1,517,100 223,125 - 47,764 10,184 52,300 465,000 1,514 8,640EBITDA(\million) 223,840 150,800 11,441 1,289 2,646 3,441 8,800 39,800 3,803 3,970
Interest-bearing Debt/EBITDAMultiple (times) 9.8 10.1 19.5 0.0 18.1 3.0 5.9 11.7 0.4 2.2
Free Cash Flow(\million) -10,728 -8,400 -15,440 682 -200 716 2,700 7,620 2,479 -1,370
Operating Income/Interest ExpensesRatio (times) 2.4 2.2 1.8 228.3 1.0 6.8 5.9 2.6 86.4 24.0
ROA(%) 3.0 3.0 1.9 2.4 1.4 5.1 3.4 3.2 6.8 6.8
ROE(%) - 1.3 2.3 45.5 2.7 15.1 4.8 9.0 11.8 14.7
* 1:Consolidated Subsidiary of Tokyu Corp. * 2:Consolidated Subsidiary of Tokyu Land Corp. * 3:Consolidated Subsidiary of Tokyu Department Store Co.* 4:Depreciation and amortization cost of Tokyu Corp. includes amortization cost of the consolidation adjusting account of 7,600 million yen (forecast) posted as sales and g
* 4
Forecast as of 27 Nov. 2002
TokyuDepartment
Store
Nagano TokyuDepartment
StoreTokyu
RecreationSeikitokyu
Kogyo Shiroki* 3
437,900 29,883 20,493 93,000 108,000
10,400 665 1,333 2,330 4,700
4,100 483 1,435 1,580 4,400
12,300 159 338 530 2,000
6,719 433 961 1,213 5,584
86 27 90 27 27
4,294 155 10 801 599
260,000 23,998 37,055 93,532 75,784
25,800 202 1,672 4,679 5,333
34,837 7,889 23,045 10,591 21,939
141,694 8,647 - 38,219 27,767
17,119 1,098 2,294 3,543 10,284
8.3 7.9 0.0 10.8 2.7
-12,975 741 612 -1,937 4,352
2.4 4.3 133.3 2.9 7.8
3.4 2.6 3.8 2.5 6.4
43.5 2.1 1.5 5.2 9.6
.,Ltd.general administrative expenses.
19

Financial Results of Tokyu Group Publicly Traded Companies and Combinedfor the Fiscal Year Ended 31 March 2002
Tokyu Group
CombinedTokyuCorp.
TokyuConstruction
TokyuTourist Izukyu
SotetsuTransportation
Japan AirSystem
TokyuLand
TokyuCommunity
TokyuLivable
* 1 * 1 * 1 * 2 * 2
Operating Revenues(\million) 3,002,547 1,058,156 358,174 32,707 18,325 19,073 420,791 494,453 89,402 33,751Operating Income(\million) 106,794 52,719 7,528 -1,444 1,304 996 10,883 25,578 2,736 3,189Recurring Income(\million) 45,347 18,293 2,063 -1,238 332 1,130 3,500 14,751 3,024 3,170Net Income(\million) 286 11,891 641 -1,008 327 539 927 7,241 1,656 1,301Depreciation and Amortization(\million) 123,637 66,504 1,647 680 1,519 846 23,770 12,738 731 627Interest and Dividend Income(\million) 3,235 1,560 298 61 6 31 140 760 21 13Interest Expenses(\million) 63,389 35,362 5,452 4 1,063 20 8,631 11,201 55 109Total Assets(\million) 4,627,184 2,497,041 561,016 29,249 78,303 19,982 458,464 875,909 46,110 47,028Capital Expenditures(\million) 159,436 105,856 2,456 513 2,618 1,495 14,367 14,787 745 2,525Shareholders' Equity(\million) - 156,143 55,502 476 12,282 13,158 26,145 63,388 15,028 8,423Interest-bearing Debt(\million) 2,707,568 1,537,724 257,711 229 49,674 631 319,373 472,759 2,143 9,100EBITDA(\million) 230,431 119,223 9,175 -764 2,823 1,842 34,653 38,316 3,467 3,816
Interest-bearing Debt/EBITDAMultiple (times) 11.8 12.9 28.1 - 17.6 0.3 9.2 12.3 0.6 2.4
Free Cash Flow(\million) 7,606 -21,995 1,267 -1,281 -858 327 11,655 12,328 2,667 1,182
Operating Income/Interest ExpensesRatio (times) 1.7 1.5 1.4 - 1.2 49.8 1.3 2.3 49.7 29.3
ROA(%) 2.3 2.2 1.4 -4.5 1.7 5.3 2.4 3.0 6.1 7.3
ROE(%) - 8.1 2.1 -102.1 2.7 4.1 3.5 11.9 11.6 16.5
* 1:Consolidated Subsidiary of Tokyu Corp. * 2:Consolidated Subsidiary of Tokyu Land Corp. * 3:Consolidated Subsidiary of Tokyu Department Store Co.* 4:Depreciation and amortization cost of Tokyu Corp. includes amortization cost of the consolidation adjusting account of 4,196 million yen posted as sales and general adm
* 4
TokyuDepartment
Store
Nagano TokyuDepartment
StoreTokyu
Store ChainTokyu
RecreationSeikitokyu
KogyoTokyu
Car Shiroki* 3
464,351 33,379 280,085 18,412 92,254 55,205 99,767
7,704 581 2,944 1,246 1,497 54 3,173
1,584 393 2,072 1,264 703 -1,370 3,420
-8,699 -1,953 -11,055 262 353 -2,844 1,671
7,015 574 4,046 683 1,105 1,516 5,414
231 29 141 153 48 121 50
5,053 168 971 48 853 485 765
350,365 29,730 145,658 38,764 94,025 74,387 72,589
12,487 783 2,930 840 670 337 5,667
21,696 7,362 33,167 22,873 9,955 23,129 19,880
219,182 11,658 59,166 2,168 37,290 31,877 27,398
14,719 1,155 6,990 1,929 2,602 1,570 8,587
14.9 10.1 8.5 1.1 14.3 20.3 3.2
-2,821 204 3,089 1,041 1,079 748 2,155
1.5 3.5 3.0 26.0 1.8 0.1 4.1
2.2 2.1 2.1 3.4 1.6 0.2 4.4
-33.4 -23.4 -28.4 1.1 3.6 -11.4 8.6
.,Ltd.ministrative expenses.
20

Financial Results of Tokyu Group Publicly Traded Companies and Combinedfor the Fiscal Year Ended 31 March 2001
Tokyu Group
CombinedTokyuCorp.
TokyuConstruction
TokyuTourist Izukyu
TokyuHotel Chain
SotetsuTransportation
Japan AirSystem
TokyuLand
TokyuCommunity
TokyuLivable
* 1 * 1 * 1 * 2 * 2
Operating Revenues(\million) 3,076,724 1,012,890 422,087 34,958 19,505 64,402 15,986 418,385 488,872 85,468 31,935Operating Income(\million) 126,276 64,374 11,622 6 1,493 1,193 984 17,743 25,516 2,393 3,249Recurring Income(\million) 42,469 23,634 5,901 160 282 -1,069 1,095 7,499 11,052 2,735 3,109Net Income(\million) -66,074 -30,163 2,369 -677 495 -7,811 250 2,241 2,883 14 1,217Depreciation and Amortization(\million) 117,928 56,185 2,597 712 1,517 2,845 736 23,681 12,704 681 580Interest and Dividend Income(\million) 5,101 2,543 387 61 14 67 47 127 1,027 33 33Interest Expenses(\million) 71,584 38,873 6,125 9 1,214 997 12 9,094 12,438 81 110Total Assets(\million) 4,795,979 2,499,886 578,573 32,858 77,565 96,059 18,532 477,078 890,835 44,234 40,573Capital Expenditures(\million) 174,656 107,316 2,643 753 1,558 1,869 1,122 4,985 27,084 435 1,772Shareholders' Equity(\million) - 139,066 5,492 1,498 11,938 17,362 12,991 26,305 58,376 13,524 7,341Interest-bearing Debt(\million) 2,819,833 1,506,916 279,553 203 48,998 56,951 30 333,703 504,716 3,104 6,300EBITDA(\million) 244,204 120,559 14,219 718 3,010 4,038 1,720 41,424 38,220 3,074 3,829
Interest-bearing Debt/EBITDAMultiple (times) 11.5 12.5 19.7 0.3 16.3 14.1 0.0 8.1 13.2 1.0 1.6
Free Cash Flow(\million) -2,036 -25,630 5,451 -44 238 1,172 586 27,345 -1,302 2,558 1,947
Operating Income/Interest ExpensesRatio (times) 1.8 1.7 1.9 0.7 1.2 1.2 82.0 2.0 2.1 29.5 29.5
ROA(%) 2.7 2.7 2.0 0.2 1.9 1.3 5.7 3.7 3.0 5.6 7.1
ROE(%) - -19.1 61.3 -36.9 4.2 -35.0 1.9 9.2 6.0 0.1 17.6
* 1:Consolidated Subsidiary of Tokyu Corp. * 2:Consolidated Subsidiary of Tokyu Land Corp. * 3:Consolidated Subsidiary of Tokyu Department Store Co.,Ltd.
TokyuDepartment
Store
Nagano TokyuDepartment
StoreTokyu
Store ChainTokyu
RecreationSeikitokyu
KogyoTokyuCar Shiroki
* 3
510,599 32,826 284,075 17,612 105,447 55,228 103,228
6,549 359 4,381 1,205 2,758 -1,612 3,185
-5,999 203 2,990 1,278 1,804 -2,900 3,085
-28,491 -147 879 239 -289 -2,831 -2,981
8,701 505 4,359 644 1,187 1,643 5,243
624 36 179 170 83 161 73
6,678 171 1,088 68 1,005 436 895
378,918 28,016 143,184 43,418 100,008 74,911 73,150
11,515 359 4,923 9,299 794 1,134 4,615
30,424 9,316 44,792 23,325 9,689 26,677 18,977
247,224 10,882 64,532 6,936 39,570 28,845 30,410
15,250 864 8,740 1,849 3,945 31 8,428
16.2 12.6 7.4 3.8 10.0 930.5 3.6
-2,943 334 2,729 -7,518 2,146 -1,539 2,918
1.0 2.1 4.0 17.7 2.7 - 3.6
1.7 1.4 3.2 3.4 2.7 -1.9 4.3
-63.8 -1.6 2.0 1.1 -2.9 -10.4 -14.4
21

Financial Results of Tokyu Group Publicly Traded Companies and Combinedfor the Fiscal Year Ended 31 March 2000
Tokyu Group
CombinedTokyuCorp.
TokyuConstruction
TokyuTourist Izukyu
TokyuHotel Chain
SotetsuTransportation
Japan AirSystem
TokyuLand
TokyuCommunity
TokyuLivable
* 1 * 1 * 1 * 2 * 2
Operating Revenues(\million) 3,070,930 995,228 433,727 34,801 25,140 67,682 16,132 390,330 484,860 80,430 30,459Operating Income(\million) 106,364 60,416 11,324 -3,523 2,386 272 1,156 9,578 20,412 2,152 2,274Recurring Income(\million) 43,130 31,249 4,978 -3,126 665 -1,304 1,257 2,483 8,152 2,454 2,040Net Income(\million) -5,400 1,764 -16,739 -5,556 -2,015 -721 84 1,139 -14,291 1,216 656Depreciation and Amortization(\million) 112,073 50,908 2,467 732 1,572 3,035 752 23,171 12,195 631 512Interest and Dividend Income(\million) 5,294 2,640 415 59 33 72 30 170 919 36 21Interest Expenses(\million) 76,408 38,939 7,095 45 1,459 1,137 12 9,682 13,686 83 114Total Assets(\million) 4,927,553 2,528,353 626,170 35,546 80,837 90,951 17,889 486,309 872,457 42,743 51,598Capital Expenditures(\million) 229,191 146,739 14,362 678 1,910 1,230 425 18,844 32,842 1,180 1,199Shareholders' Equity(\million) - 176,465 2,239 2,172 11,604 27,247 12,968 22,394 36,982 13,731 6,482Interest-bearing Debt(\million) 2,977,868 1,536,831 301,677 208 52,359 51,194 50 357,812 539,000 4,382 6,300EBITDA(\million) 218,437 111,324 13,791 -2,791 3,958 3,307 1,908 32,749 32,607 2,783 2,786
Interest-bearing Debt/EBITDAMultiple (times) 13.6 13.8 21.9 - 13.2 15.5 0.0 10.9 16.5 1.6 2.3
Free Cash Flow(\million) -87,162 -74,354 -7,666 -3,514 589 940 1,471 4,223 -13,921 1,520 1,473
Operating Income/Interest ExpensesRatio (times) 1.4 1.6 1.6 - 1.6 0.2 96.3 1.0 1.5 25.9 19.9
ROA(%) 2.3 2.6 1.8 -9.6 3.3 0.4 6.8 2.0 2.3 5.3 4.0
ROE(%) - 1.0 - -227.3 -50.0 -2.6 0.6 5.3 -33.1 9.3 12.5
* 1:Consolidated Subsidiary of Tokyu Corp. * 2:Consolidated Subsidiary of Tokyu Land Corp. * 3:Consolidated Subsidiary of Tokyu Department Store Co.,Ltd.
TokyuDepartment
Store
Nagano TokyuDepartment
StoreTokyu
Store ChainTokyu
RecreationSeikitokyu
KogyoTokyuCar Shiroki
* 3
511,632 32,925 288,312 18,154 105,902 61,449 106,109
5,954 198 5,242 1,145 3,330 -5,916 2,389
-2,342 33 3,652 1,445 2,423 -6,090 1,540
14,788 533 935 168 55 -8,128 822
7,157 461 4,057 630 1,444 1,648 5,504
613 8 185 266 72 194 100
7,941 171 1,125 78 957 421 971
484,710 29,070 145,471 36,864 112,412 74,018 78,119
16,724 664 5,623 1,035 1,471 3,590 668
58,942 9,251 43,792 19,141 9,997 27,718 22,328
313,015 12,217 66,113 7,404 44,052 28,614 33,783
13,111 659 9,299 1,775 4,774 -4,268 7,893
23.9 18.5 7.1 4.2 9.2 - 4.3
-11,554 -176 2,551 662 2,346 -8,279 6,254
0.7 1.2 4.7 14.7 3.5 - 2.5
1.3 0.7 3.7 3.6 3.0 -7.2 3.2
35.2 6.0 2.1 0.9 0.6 -25.6 3.7
22

Financial Results of Tokyu Group Publicly Traded Companies and Combinedfor the Fiscal Year Ended 31 March 1999
Tokyu Group
CombinedTokyuCorp.
TokyuConstruction
TokyuTourist Izukyu
TokyuHotel Chain
SotetsuTransportation
Japan AirSystem
TokyuLand
TokyuCommunity
* 1 * 2
Operating Revenues(\million) 3,171,035 573,423 490,138 36,258 22,496 73,772 16,240 369,008 525,851 77,901Operating Income(\million) 74,978 48,965 556 -5,571 2,887 -1,619 1,076 1,154 17,417 2,415Recurring Income(\million) 12,742 24,454 -9,890 -5,690 8 -3,000 1,161 3,662 2,574 2,551Net Income(\million) -199,417 -27,900 -74,775 -3,774 802 -7,383 528 536 -22,587 992Depreciation and Amortization(\million) 113,336 52,268 3,683 605 1,335 3,558 849 20,842 11,587 544Interest and Dividend Income(\million) 6,259 1,986 776 82 62 81 37 179 1,224 53Interest Expenses(\million) 79,021 33,776 7,920 38 1,662 1,086 15 9,324 15,171 77Total Assets(\million) 4,993,318 2,360,427 683,359 36,605 67,516 101,228 16,929 478,506 947,501 40,419Capital Expenditures(\million) 286,168 101,849 61,647 1,723 1,999 2,479 1,071 74,296 35,252 3,116Shareholders' Equity(\million) - 176,314 -6,961 2,717 -3,547 27,989 12,900 20,457 49,324 12,296Interest-bearing Debt(\million) 3,039,740 1,438,740 354,501 338 60,784 58,799 80 369,177 579,715 4,215EBITDA(\million) 188,314 101,233 4,239 -4,966 4,222 1,939 1,925 21,996 29,004 2,959
Interest-bearing Debt/EBITDAMultiple (times) 16.1 14.2 83.6 - 14.4 30.3 0.0 16.8 20.0 1.4
Free Cash Flow(\million) -176,875 -34,392 -65,328 -6,727 561 -1,626 839 -61,624 -21,419 -234
Operating Income/Interest ExpensesRatio (times) 0.9 1.4 0.1 - 1.7 - 71.7 0.1 1.1 31.4
ROA(%) 1.6 2.5 0.2 -14.2 4.4 -1.5 6.5 0.3 1.9 6.4
ROE(%) - -13.4 -486.3 -96.7 - -23.2 4.1 2.7 -37.4 8.7
* 1:Consolidated Subsidiary of Tokyu Corp. * 2:Consolidated Subsidiary of Tokyu Land Corp. * 3:Consolidated Subsidiary of Tokyu Department Store Co.
TokyuDepartment
Store
Nagano TokyuDepartment
StoreTokyu
Store ChainTokyu
RecreationSeikitokyu
KogyoTokyu
Car Shiroki* 3
487,500 34,601 297,188 18,077 105,801 51,603 103,680
5,516 282 7,328 1,042 256 -5,495 1,466
-345 388 5,767 723 -569 -6,731 618
-62,476 -163 1,176 286 -1,978 -2,016 144
5,953 492 3,990 583 1,641 1,744 4,698
778 13 204 411 106 212 121
6,319 184 1,255 89 932 362 1,072
520,030 28,429 144,959 41,692 112,739 85,930 79,256
54,646 696 2,374 1,783 1,143 2,669 4,884
25,177 8,602 43,597 19,120 9,942 35,814 21,597
355,274 11,729 55,474 11,686 45,930 28,028 35,715
11,469 774 11,318 1,625 1,897 -3,751 6,164
31.0 15.2 4.9 7.2 24.2 - 5.8
-49,496 -106 7,689 -247 -178 -6,782 208
0.9 1.5 5.8 11.7 0.3 - 1.4
1.3 1.0 5.1 3.4 0.3 -6.3 2.0
-128.4 -1.9 2.7 1.5 -18.1 -5.5 0.7
.,Ltd. 23

Financial Results of Tokyu Group Publicly Traded Companies and Combinedfor the Fiscal Year Ended 31 March 1998
Tokyu Group
24
CombinedTokyuCorp.
TokyuConstruction
TokyuTourist Izukyu
TokyuHotel Chain
SotetsuTransportation
Japan AirSystem
TokyuLand
TokyuDepartment
Store
Nagano TokyuDepartment
Store* 1
Operating Revenues(\million) 3,244,124 484,832 614,342 40,416 20,660 72,683 16,691 358,623 493,769 521,757 35,944Operating Income(\million) 73,626 53,495 -6,276 -1,482 -818 859 977 -8,640 23,445 7,051 872Recurring Income(\million) 16,946 18,822 -11,510 -1,725 -2,440 -362 1,073 -1,772 10,278 1,480 1,146Net Income(\million) -50,832 2,183 -22,824 -2,275 -4,864 -1,744 614 -1,824 -4,218 -15,379 465Depreciation and Amortization(\million) 109,495 45,560 4,561 313 1,340 3,037 784 21,933 12,751 6,087 455Interest and Dividend Income(\million) 7,438 2,349 962 108 48 137 57 63 1,413 912 14Interest Expenses(\million) 77,433 33,743 6,835 9 1,724 970 16 8,564 14,708 7,488 134Total Assets(\million) 5,086,921 1,717,546 786,973 40,770 66,533 102,562 17,082 433,603 988,416 462,972 29,863Capital Expenditures(\million) 277,119 125,028 8,819 483 1,920 6,425 2,346 88,747 11,226 17,130 342Shareholders' Equity(\million) - 239,778 37,713 5,089 -4,285 35,784 12,598 19,935 71,479 72,174 8,911Interest-bearing Debt(\million) 2,832,732 981,355 379,725 545 60,412 48,034 20 330,913 587,907 270,949 11,767EBITDA(\million) 183,121 99,055 -1,715 -1,169 522 3,896 1,761 13,293 36,196 13,138 1,327
Interest-bearing Debt/EBITDAMultiple (times) 15.5 9.9 - - 115.7 12.3 0.0 24.9 16.2 20.6 8.9
Free Cash Flow(\million) -171,431 -59,716 -17,369 -1,661 -3,122 -3,499 -601 -84,018 10,262 -11,480 851
Operating Income/Interest ExpensesRatio (times) 1.0 1.6 - - - 0.9 61.1 - 1.6 0.9 6.5
ROA(%) 1.6 3.4 -0.7 -3.1 -1.1 1.0 6.2 -2.1 2.4 1.8 3.1
ROE(%) - 0.9 -45.9 -36.6 - -4.7 4.9 -8.7 -5.7 -19.1 5.3
* 1:Consolidated Subsidiary of Tokyu Department Store Co.,Ltd.
TokyuStore Chain
TokyuRecreation
SeikitokyuKogyo
TokyuCar Shiroki
307,552 17,782 127,034 62,047 105,936
6,944 711 1,720 -3,953 -407
5,304 989 1,001 -3,961 -231
1,354 346 -97 -1,207 -897
4,214 590 1,689 1,785 4,851
233 515 161 314 166
1,096 103 891 327 959
148,529 42,960 121,204 80,613 77,158
3,115 636 1,841 4,376 5,027
43,164 19,054 11,920 37,832 21,682
56,991 11,395 45,030 24,752 34,704
11,158 1,301 3,409 -2,168 4,444
5.1 8.8 13.2 - 7.8
6,947 562 677 -6,871 -1,542
6.3 6.9 1.9 - -
4.8 2.7 1.5 -4.3 -0.3
3.2 1.8 -0.8 -3.1 -4.0

Tokyu GroupNotes to Financial Results and Forecast
of Tokyu Group Publicly Traded Companies and Combined
25
・Interest-bearing Debt= Bonds+ Loans+ Commercial Paper
・EBITDA= Operating Income+ Depreciation and Amortization
・Interest-bearing Debt / EBITDA M ultiple= Interest-bearing Debt / EBITDA
・Free Cash Flow= EBITDA- Capital Expenditures- Interest Expenses
・Operating Income / Interest Expenses Ratio= Operating Income / Interest Expens
・ROA= (Operating Income+ Interest and D ividend Income) / Average Total Asset
・ROE= Net Income / Average Shareholders' Equity × 100
・Figures of companies designated *1, *2, *3 are excluded from the "combined" fig
of Tokyu Corp., Tokyu Land Corp. and Tokyu Department Store Co., Ltd., respec
Regarding the figures of Izukyu Corp. for FY 3/2000 and Tokyu Construction Co.
included in the "combined" figures since those income statements were not consol
subsidiaries near the end of the periods concerned.
・Figures of Tokyu Hotel Chain Co., Ltd. have been included in Tokyu Corp.'s cons
Tokyu Hotel Chain Co., Ltd. became a wholly-owned subsidiary of Tokyu Corp. t
・Projected figures of Tokyu Car Corp. for FY 3/2003 are included in Tokyu Corp.'s
Corp. became a wholly-owned subsidiary of Tokyu Corp. through a share exchang
・Projected figures of Japan A ir System Co., Ltd. for FY 3/2003 are not shown beca
through the integration in October 2002 w ith Japan Airlines Co., Ltd.
・Sotetsu Transportation Co., Ltd. changed its company name to Tokyu Logistic Co
・In FY 3/2003 forecast, operating revenues of both Tokyu Department Store Co., L
"sales volume and other operating revenues".
・Figures of depreciation and amortization cost were obtained from the consolidated
"Yukashoken-hokokusho (financial statement report)" or the "Kessan-tanshin (ean
and FY 3/2002 of Tokyu Corp. includes amortization cost of the consolidation adj
・Capital expenditure figures were obtained from the "Facility conditions" figures in
to segment information in the "Yukashoken-hokokusho" or "Kessan-tanshin".
・Capital expenditure figures in the "Yukashoken-hokokusho" of Tokyu Constructio
"Yukashoken-hokokusho" of the company.)
・In FY 3/2003 forecast, "combined" interest-bearing debt represents the difference
publicly traded companies excluding companies designated *1, *2, *3, and projec
M anagement System (CM S) between Tokyu Corp. (consolidated subsidiary Tokyu
companies accounted for by the equity method.
ses
ts × 100
ures because those figures are included in the consolidated financial accounts
ctively.
., Ltd. for FY 3/1999, figures in the income statements of both companies are
lidated into Tokyu Corp.'s financial accounts due to the fact that they became
solidated financial accounts and not shown independently since FY 3/2002 because
through a share exchange in July 2001, thus becoming a privately-owned company.
s consolidated financial accounts and not shown independently because Tokyu Car
ge in October 2002, thus becoming a privately-owned company.
ause the company has become a Japan Airlines Group company
. Ltd. in April 2002.
Ltd. and Nagano Tokyu Department Store Co., Ltd. are the sum of
d statements of cash flows or segment information in the
nings report)". Depreciation and amortization cost in FY 3/2003 forecast
justing account posted as sales and general administrative expenses.
n the "Yukashoken-hokokusho" or from capital expenditure figures pertaining
on Co., Ltd. include non-cash items. (Please refer to the
between the sum total of projected interest-bearing debt of Tokyu Group
cted inter-group company loans extended using a proprietary Cash
u Finance and Accounting Co., Ltd.) and Tokyu Group publicly traded

Tokyu GroupStatements of Cash Flows
of Tokyu Group Publicly Traded Companies Combined
FY3/2003Forecast
as of 27 Nov. 2002
Cash Flows from Operating Activities
Cash Flows from Investing Activities
Cash Flows from Financing Activities
Net Increase in Cash and Cash Equivalents
Cash and Cash Equivalents at End of Year
Tokyu Corporation(Consolidated)
FY3/2001 FY3/2002
89 65
-63
143
-70 -50
124 99 90
-42 -30
-13 -33
-112
-20
(\ billion)Tokyu Group
(Tokyu Group Publicly Traded Companies'
Cosolidated C/F Statements Combined)
FY3/2003Forecast
as of 27 Nov. 2002
-46
FY3/2001 FY3/2002
132
-54
-127
157220262
-27
-167
184
-29
-202
-47
195
-59
26