section - opec : home · section oil transportation ... united arab emirates 6,091.0 6,091.0...
TRANSCRIPT

117
Taxes on oil
OPEC Annual Statistical Bulletin 2017
SECTIONOil transportation
9SECTIONNatural gas data

Natural gas data

119
Natural gas data
OPEC Annual Statistical Bulletin 2017
Feature Box: Section 9
Historical trends in OECD natural gas and oil demand
OECD natural gas and oil demand accounted for roughly 46 and 49 per cent of world natural gas and oil demand, respectively, in 2016. While their overall shares of both natural gas and oil have shown declining trends during the last decade, they differ substantially in the development of their respective trends. Natural gas demand grew by more than 14 per cent during the period 2006–2015, and gas seemed to be particularly favoured in regions and countries with increasing domestic production, such as the United States and Canada. During the same period, 2006–2015, oil requirements fell by almost seven per cent. Furthermore, average year-on-year growth has slowed down during the last decade for both natural gas and oil — from around two per cent to one per cent for natural gas and from one per cent to a slight decline for oil. The co-evolution of historical demand for both OECD natural gas and oil could be further examined by applying simple linear regression models with the inclusion of the year and a dummy variable — with the latter capturing a structural break beginning in 2006. For both oil and natural gas regression models, the effect of the binary variable has been significantly different than zero (p < 0.00), though with diverse developments. OECD oil demand switched from average yearly growth of b11 ≈ 0.60m b/d during the period 1986–2005 to an average decline of b12 ≈ –0.36m b/d during the years thereafter. Natural gas grew on average stronger by b21 ≈30.86bn s cu m between 1986–2005 compared to the last decade when it was b22 ≈ 18.62bn s cu m. Yearly growth in OECD natural gas requirements is significantly higher than OECD oil requirements for the majority of years between 1986 and 2016 (p < 0.01), with the differences becoming even larger as of 2006.
OECD demand (bn s cu m)
Year-on-year demand growth (%)
Statistics of OECD demand
Regression model Coefficient Estimate p-value R2
Oil (1986–2005) b11 0.60 <0.00 0.97
Oil (2006–2016) b12 –0.36 <0.00 0.54 Natural gas (1986–2005) b21 30.86 <0.00 0.98 Natural gas (2006–2016) b22 18.62 <0.00 0.87
1. Simple linear regression model with the year as an independent variable.
Graph 9.1 : OECD demand
1986 9590 00 05 10
1,800
1,200
1,000
1,600
1,400
800
55
52
49
46
40
37
43
2016
m b/d
Natural gasOil (RHS)
19861987
19881989
19901991
19921993
19941995
19961997
19981999
20002001
20022003
20042005
20062007
20082009
20102011
20122013
20142015
2016
4
6
2
0
–2
–4
Feature Box 9.2: Year-On-year demand growth
OilNatural gas
%

120
Natural gas data
OPEC Annual Statistical Bulletin 2017
2012 2013 2014 2015 2016 % change16/15
North America 11,121.0 11,725.5 11,212.4 11,365.1 11,365.1 –Canada 1,660.0 1,700.0 2,028.0 2,180.7 2,180.7 –United States 9,461.0 10,025.5 9,184.4 9,184.4 9,184.4 –Latin America 7,971.4 7,997.8 7,980.8 7,982.9 7,876.4 –1.3Argentina 316.0 328.0 332.0 341.0 325.0 –4.7Bolivia 317.0 296.0 300.0 305.0 300.5 –1.5Brazil 459.0 458.0 471.0 429.0 391.7 –8.7Chile 41.0 41.0 40.0 40.0 40.0 –Colombia 162.0 156.0 135.0 123.0 112.8 –8.3Ecuador 6.4 6.0 10.9 10.9 10.9 –Mexico 360.0 347.0 324.0 317.5 269.9 –15.0Peru 359.0 425.8 413.9 399.0 384.2 –3.7Trinidad & Tobago 375.0 346.0 325.0 305.0 289.8 –5.0Venezuela 5,563.0 5,581.0 5,617.0 5,701.5 5,739.7 0.7Others 13.0 13.0 12.0 11.0 12.0 9.1Eastern Europe and Eurasia 64,921.0 65,327.1 65,795.6 66,291.7 66,291.1 –Armenia 18.0 18.0 18.0 18.0 18.0 –Azerbaijan 1,308.0 1,300.0 1,292.0 1,284.0 1,284.0 –Kazakhstan 1,950.0 1,929.0 1,918.0 1,907.0 1,907.0 –Poland 69.0 69.0 62.9 60.7 60.7 –Romania 109.0 113.0 109.2 103.0 103.0 –Russia 48,810.0 49,335.0 49,896.0 50,485.0 50,485.0 –Turkmenistan 10,000.0 9,933.8 9,904.2 9,870.0 9,870.0 –Ukraine 969.0 969.0 960.0 952.0 952.0 –Uzbekistan 1,661.0 1,632.0 1,608.0 1,585.0 1,585.0 –Others 27.0 28.2 27.3 27.0 26.4 –2.2Western Europe 4,564.0 4,394.1 4,098.7 3,821.2 3,751.2 –1.8Denmark 95.0 90.0 88.0 85.0 72.3 –15.0Germany 71.0 62.5 51.2 46.4 45.5 –2.0Italy 62.0 56.0 53.7 49.1 46.6 –5.0Netherlands 1,072.0 989.0 864.0 773.0 799.3 3.4Norway 2,685.0 2,654.0 2,547.0 2,445.1 2,362.0 –3.4United Kingdom 481.0 452.0 407.0 333.0 336.0 0.9Others 98.0 90.6 87.8 89.6 89.6 –Middle East 80,131.0 80,087.0 80,102.2 79,419.3 80,060.4 0.8IR Iran 33,780.0 34,020.0 34,020.0 33,500.0 33,721.2 0.7Iraq 3,158.0 3,158.0 3,158.0 3,158.0 3,819.9 21.0Kuwait 1,784.0 1,784.0 1,784.0 1,784.0 1,784.0 –Oman 950.0 950.0 950.0 931.0 884.5 –5.0Qatar 25,069.0 24,681.0 24,531.3 24,299.1 24,072.5 –0.9Saudi Arabia 8,235.0 8,317.0 8,488.9 8,588.2 8,619.3 0.4United Arab Emirates 6,091.0 6,091.0 6,091.0 6,091.0 6,091.0 –Others 1,064.0 1,086.0 1,079.0 1,068.0 1,068.0 –Africa 14,591.4 14,515.3 14,761.2 14,617.5 14,808.5 1.3Algeria 4,504.0 4,504.0 4,504.0 4,504.0 4,504.0 –Angola 275.0 275.0 308.1 308.1 308.1 –Cameroon 153.0 144.0 154.0 153.0 153.0 –Congo 124.0 121.0 118.0 115.0 115.0 –Egypt 2,185.0 2,185.0 2,185.0 2,086.0 2,086.0 –Gabon 27.0 26.0 25.5 25.5 25.5 –Libya 1,549.0 1,506.0 1,504.9 1,504.9 1,504.9 –Nigeria 5,118.4 5,107.1 5,324.0 5,284.3 5,475.2 3.6Others 656.0 647.2 637.8 636.8 636.8 –Asia and Pacific 16,493.0 16,562.2 16,107.6 16,244.2 16,386.4 0.9Australia 3,727.0 3,769.0 3,215.0 3,205.0 3,205.0 –Bangladesh 474.0 436.0 412.0 385.0 385.0 –Brunei 288.0 269.7 263.0 258.0 258.0 –China 3,051.0 3,200.0 3,275.0 3,438.8 3,610.7 5.0India 1,331.0 1,355.0 1,427.0 1,488.0 1,458.2 –2.0Indonesia 2,917.0 2,875.4 2,839.1 2,775.1 2,775.1 –Malaysia 2,389.0 2,611.0 2,676.0 2,740.0 2,740.0 –Myanmar 496.0 297.0 290.0 282.0 282.0 –Pakistan 762.0 749.0 736.0 723.0 723.0 –Thailand 256.0 238.3 219.5 219.5 219.5 –Vietnam 220.0 216.0 211.0 207.0 207.0 –Others 582.0 545.8 544.0 522.8 522.8 –Total world 199,792.7 200,608.9 200,058.4 199,742.0 200,539.1 0.4of whichOPEC 95,159.7 95,056.1 95,367.5 94,759.4 95,676.2 1.0OPEC percentage 47.6 47.4 47.7 47.4 47.7OECD 20,150.0 20,639.1 19,250.5 19,088.7 18,970.5 –0.6FSU 64,721.0 65,121.8 65,601.2 66,106.0 66,106.0 –
Notes: Figures as at year-end.
Table 9.1World proven natural gas reserves by country (bn s cu m)
121
Natural gas data
OPEC Annual Statistical Bulletin 2017
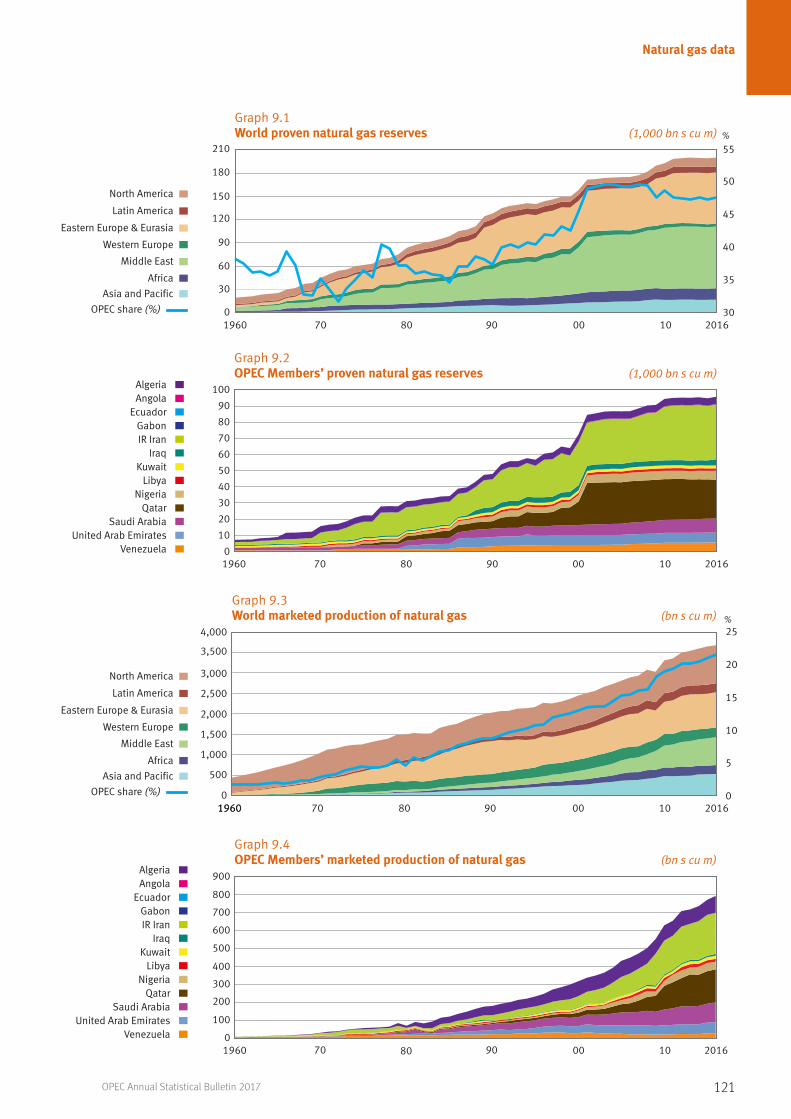
Graph 9.2OPEC Members’ proven natural gas reserves (1,000 bn s cu m)
Graph 9.3World marketed production of natural gas (bn s cu m)
Graph 9.4OPEC Members’ marketed production of natural gas (bn s cu m)
Graph 9.1World proven natural gas reserves (1,000 bn s cu m)
30
35
40
45
50
55
Graph 9.1 World Proven Natural Gas reserves(1,000 bn standard cu m)
210
180
150
120
90
60
30
01960 70 80 90 00 201610
%
North America
Latin America
Eastern Europe & Eurasia
Western Europe
Middle East
Africa
Asia and Pacific
OPEC share (%)
North America
Latin America
Eastern Europe & Eurasia
Western Europe
Middle East
Africa
Asia and Pacific
OPEC share (%)
AlgeriaAngola
IR Iran IraqKuwaitLibyaNigeriaQatarSaudi ArabiaUnited Arab EmiratesVenezuela
Ecuador
AlgeriaAngola
IR Iran Iraq
KuwaitLibya
NigeriaQatar
Saudi ArabiaUnited Arab Emirates
Venezuela
Ecuador
North America
Latin America
Eastern Europe & Eurasia
Western Europe
Middle East
Africa
Asia and Pacific
OPEC share (%)
North America
Latin America
Eastern Europe & Eurasia
Western Europe
Middle East
Africa
Asia and Pacific
OPEC share (%)
AlgeriaAngola
IR Iran IraqKuwaitLibyaNigeriaQatarSaudi ArabiaUnited Arab EmiratesVenezuela
Ecuador
AlgeriaAngola
IR Iran Iraq
KuwaitLibya
NigeriaQatar
Saudi ArabiaUnited Arab Emirates
Venezuela
Ecuador
Graph 9.2: OPEC Members’ proven natural gas reserves (1,000 bn standard cu m )
100
90
80
70
60
50
40
30
20
10
01960 70 80 90 00 201610
%
Graph 9.3: World Marketed Production of Natural gas (bn standard cu m )
3,500
4,000
3,000
2,500
2,000
1,500
1,000
500
019601960 70 80 90 00 201610
25
20
15
10
5
0
Graph 9.4: OPEC Members marketed production of natural gas(bn standard cum)
1960
800
900
700
600
500
400
300
200
100
070 80 90 00 201610
North America
Latin America
Eastern Europe & Eurasia
Western Europe
Middle East
Africa
Asia and Pacific
OPEC share
North America
Latin America
Eastern Europe & Eurasia
Western Europe
Middle East
Africa
Asia and Pacific
OPEC share
AlgeriaAngolaEcuadorGabonIR IranIraqKuwaitLibyaNigeriaQatarSaudi ArabiaUnited Arab EmiratesVenezuela
AlgeriaAngola
EcuadorGabonIR Iran
IraqKuwait
LibyaNigeria
QatarSaudi Arabia
United Arab EmiratesVenezuela
North America
Latin America
Eastern Europe & Eurasia
Western Europe
Middle East
Africa
Asia and Pacific
OPEC share
North America
Latin America
Eastern Europe & Eurasia
Western Europe
Middle East
Africa
Asia and Pacific
OPEC share
AlgeriaAngolaEcuadorGabonIR IranIraqKuwaitLibyaNigeriaQatarSaudi ArabiaUnited Arab EmiratesVenezuela
AlgeriaAngola
EcuadorGabonIR Iran
IraqKuwait
LibyaNigeria
QatarSaudi Arabia
United Arab EmiratesVenezuela

122
Natural gas data
OPEC Annual Statistical Bulletin 2017
Table 9.2Yearly and cumulative marketed natural gas production in OPEC Members (million s cu m)
Cumulative marketed natural gas production up to and including year
Marketed natural gas production yearly
1960 1970 1980 1990 2000 2010 2016
Algeria 600.0 15,663.0 89,443.0 472,787.0 1,102,956.0 1,941,218.0 2,449,574.6
Angola – 40.0 844.0 4,684.0 10,354.0 17,147.0 23,007.6
Ecuador 10.0 48.0 355.0 1,095.0 2,175.0 4,526.0 7,403.9
Gabon 55.2 195.2 2,180.2 3,210.2 4,190.2 5,060.2 7,271.3
IR Iran 1,030.0 33,063.0 203,263.0 353,113.0 790,718.0 1,906,280.0 3,163,131.0
Iraq 600.0 6,991.0 19,128.0 43,668.0 72,138.0 109,021.8 155,804.3
Kuwait 1,040.0 22,483.0 59,123.0 109,793.0 179,932.0 290,934.0 385,522.0
Libya – 294.0 43,981.0 93,091.0 155,921.0 269,950.0 361,972.4
Nigeria – 861.0 6,387.0 35,998.0 95,883.0 335,691.0 589,548.1
Qatar 10.0 2,844.0 23,060.0 78,833.0 237,213.0 821,429.0 1,839,683.1
Saudi Arabia – 8,588.0 58,961.0 275,956.0 708,196.0 1,410,617.0 2,019,927.0
United Arab Emirates – 2,379.0 30,627.0 178,652.0 491,312.0 967,964.0 1,304,681.2
Venezuela 5,720.0 69,435.0 184,608.0 363,836.0 628,796.0 862,302.0 1,003,217.1
OPEC 9,065.2 162,884.2 721,960.2 2,014,716.2 4,479,784.2 8,942,140.0 13,310,743.7
1960 1970 1980 1990 2000 2010 2016
Algeria 235.0 2,599.0 11,647.0 51,600.0 83,119.0 84,615.0 93,152.0
Angola – 40.0 260.0 540.0 570.0 733.0 1,919.0
Ecuador 10.0 10.0 30.0 100.0 140.0 330.0 530.0
Gabon 55.2 20.0 70.0 100.0 80.0 80.0 551.1
IR Iran 960.0 12,881.0 7,138.0 24,200.0 60,240.0 187,357.0 226,905.0
Iraq 604.0 780.0 1,281.0 3,980.0 3,150.0 7,510.8 10,416.4
Kuwait 943.0 2,037.0 4,071.0 4,190.0 9,600.0 11,733.0 17,291.0
Libya – 294.0 5,170.0 6,200.0 5,880.0 16,814.0 15,570.5
Nigeria – 111.0 1,070.0 4,010.0 12,460.0 28,099.0 42,562.4
Qatar 10.0 1,005.0 4,741.0 6,300.0 24,900.0 131,165.0 182,830.3
Saudi Arabia – 1,230.0 11,431.0 33,520.0 49,810.0 87,660.0 110,860.0
United Arab Emirates – 756.0 6,863.0 22,110.0 38,380.0 51,282.0 61,083.7
Venezuela 4,958.0 7,710.0 14,805.0 21,966.0 27,801.0 19,728.0 27,718.0
OPEC 7,775.2 29,473.0 68,577.0 178,816.0 316,130.0 627,106.8 791,389.4

Visit our
Interactive ASB
asb.opec.org
123OPEC Annual Statistical Bulletin 2017

124
Natural gas data
OPEC Annual Statistical Bulletin 2017
Table 9.3World marketed production of natural gas by country (million s cu m)
2012 2013 2014 2015 2016 % change16/15
North America 839,521.0 843,040.0 896,903.0 931,910.0 925,114.0 –0.7
Canada 156,547.0 156,068.0 162,102.0 164,010.0 174,051.0 6.1
United States 682,974.0 686,972.0 734,801.0 767,900.0 751,063.0 –2.2
Latin America 218,041.4 219,059.1 219,579.4 221,003.6 222,691.9 0.8
Argentina 37,640.0 35,560.0 35,530.0 36,400.0 36,545.6 0.4
Bolivia 17,910.0 20,480.0 21,094.4 22,597.0 23,500.9 4.0
Brazil 16,976.4 19,029.2 20,353.3 20,410.5 20,618.5 1.0
Colombia 11,930.0 12,800.0 12,680.0 12,806.8 12,934.9 1.0
Ecuador 517.0 515.0 577.9 496.9 530.0 6.7
Mexico 53,713.0 52,423.0 50,510.0 45,984.0 41,227.0 –10.3
Peru 11,850.0 11,633.1 12,925.7 13,512.0 14,454.0 7.0
Trinidad & Tobago 42,609.0 42,846.9 42,082.0 40,875.0 43,374.0 6.1
Venezuela 22,726.0 21,819.8 21,878.0 26,004.4 27,718.0 6.6
Others 2,170.0 1,952.0 1,948.0 1,917.0 1,789.0 –6.7
Eastern Europe and Eurasia 857,221.0 879,188.0 853,693.0 852,338.5 859,816.0 0.9
Azerbaijan 17,236.0 17,851.0 18,633.0 19,365.0 18,773.0 –3.1
Hungary 2,462.0 2,001.0 1,854.0 1,758.0 1,841.0 4.7
Kazakhstan 19,490.0 19,650.0 20,150.0 21,157.5 22,003.8 4.0
Poland 6,193.0 6,206.0 6,081.0 6,081.0 5,794.0 –4.7
Romania 10,979.0 11,017.0 11,215.0 11,170.0 9,890.0 –11.5
Russia 656,286.0 671,546.0 642,997.0 637,386.0 642,242.0 0.8
Turkmenistan 66,000.0 72,000.0 74,160.0 80,162.0 81,765.2 2.0
Ukraine 18,890.0 20,160.0 19,510.0 19,000.0 19,271.0 1.4
Uzbekistan 58,730.0 58,080.0 58,500.0 55,700.0 57,700.0 3.6
Others 955.0 677.0 593.0 559.0 536.0 –4.1
Western Europe 267,472.0 262,996.0 248,376.0 240,197.0 238,593.0 –0.7
Austria 1,910.0 1,370.0 1,247.0 1,233.0 1,199.0 –2.8
Croatia 1,610.0 1,480.0 1,805.0 1,829.0 1,691.0 –7.5
Denmark 5,725.0 4,846.0 4,613.0 4,593.0 4,505.0 –1.9
France 508.0 323.0 15.0 21.0 34.0 61.9
Germany 12,299.0 11,886.0 10,191.0 8,392.0 7,606.0 –9.4
Ireland 373.0 343.0 151.0 132.0 2,998.0 2,171.2
Italy 8,605.0 7,734.0 7,147.0 6,773.0 5,783.0 –14.6
Netherlands 80,145.0 86,401.0 72,683.0 54,379.0 50,543.0 –7.1
Norway 114,055.0 109,040.0 111,014.0 120,589.0 120,193.0 –0.3
United Kingdom 40,989.0 38,360.0 38,410.0 41,201.0 43,022.0 4.4
Others 1,253.0 1,213.0 1,100.0 1,055.0 1,019.0 –3.4
Middle East 596,744.7 627,323.1 640,299.7 666,252.5 679,380.5 2.0
Bahrain 13,740.0 17,220.0 20,629.4 21,286.2 22,350.5 5.0
IR Iran 202,431.0 199,293.0 212,796.0 226,673.0 226,905.0 0.1
Iraq 6,675.1 7,444.9 7,927.2 7,685.4 10,416.4 35.5
Kuwait 15,515.0 16,311.2 15,028.8 16,909.0 17,291.0 2.3

125
Natural gas data
OPEC Annual Statistical Bulletin 2017
2012 2013 2014 2015 2016 % change16/15
Middle East (cont’d)
Oman 31,583.0 32,620.0 30,897.0 31,823.9 32,778.6 3.0
Qatar 157,049.6 177,602.0 174,056.7 181,444.1 182,830.3 0.8
Saudi Arabia 99,330.0 100,030.0 102,380.0 104,450.0 110,860.0 6.1
Syrian Arab Republic 5,800.0 5,300.0 4,900.0 4,300.0 3,870.0 –10.0
United Arab Emirates 54,300.0 54,600.0 54,244.6 60,181.0 61,083.7 1.5
Others 10,321.0 16,902.0 17,440.0 11,500.0 10,995.0 –4.4
Africa 228,883.0 215,572.8 214,723.9 210,642.1 216,958.7 3.0
Algeria 86,454.0 79,647.3 83,295.6 83,040.7 93,152.0 12.2
Angola 760.0 925.0 732.2 772.5 1,919.0 148.4
Egypt 60,717.0 56,180.9 48,790.3 44,327.8 42,102.2 –5.0
Equatorial Guinea 6,370.0 6,550.0 6,160.0 6,200.0 6,212.4 0.2
Côte d’Ivoire 1,650.0 1,800.0 1,900.0 1,900.0 1,900.0 –
Gabon 110.0 380.0 550.0 550.0 551.1 0.2
Libya 18,118.0 18,462.6 16,523.3 15,493.0 15,570.5 0.5
Mozambique 4,890.0 5,280.0 5,600.0 5,712.0 5,826.2 2.0
Nigeria 42,571.0 38,411.0 43,841.6 45,148.1 42,562.4 –5.7
South Africa 2,400.0 2,400.0 2,140.0 2,003.0 1,962.9 –2.0
Tunisia 2,783.0 2,786.0 2,561.0 2,475.0 2,180.0 –11.9
Others 2,060.0 2,750.0 2,630.0 3,020.0 3,020.0 –
Asia Pacific 486,202.5 489,914.3 520,545.9 523,553.4 531,916.4 1.6
Australia 49,940.0 51,690.0 53,771.0 53,125.0 56,293.0 6.0
Bangladesh 22,030.0 22,800.0 23,800.0 25,259.6 25,512.2 1.0
Brunei 11,830.0 12,206.0 11,852.0 12,452.0 11,132.0 –10.6
China 106,429.0 111,640.0 128,481.0 133,279.0 136,628.0 2.5
India 41,700.0 35,120.0 34,574.1 32,693.2 31,138.5 –4.8
Indonesia 72,309.0 71,450.0 70,891.0 70,274.0 74,026.0 5.3
Japan 4,845.0 4,695.0 4,686.0 4,430.0 4,175.0 –5.8
Malaysia 62,000.0 64,000.0 65,421.0 63,433.0 64,428.0 1.6
Myanmar 11,970.0 13,541.0 18,724.0 19,004.0 18,528.9 –2.5
New Zealand 4,646.0 4,866.0 5,177.0 4,975.0 5,063.0 1.8
Pakistan 44,414.8 42,901.4 42,555.2 41,759.5 42,209.4 1.1
Philippines 2,750.0 3,496.0 3,950.0 3,482.0 3,951.0 13.5
Thailand 41,306.7 41,802.9 42,102.7 39,818.2 38,929.2 –2.2
Vietnam 8,320.0 8,580.0 8,990.0 9,079.9 9,297.8 2.4
Others 1,712.0 1,126.0 5,571.0 10,489.0 10,604.4 1.1
Total world 3,494,085.6 3,537,093.3 3,594,120.8 3,645,897.1 3,674,470.6 0.8
of which
OPEC 706,556.7 715,441.7 733,831.9 768,848.0 791,389.4 2.9
OPEC percentage 20.2 20.2 20.4 21.1 21.5
OECD 1,231,620.0 1,233,930.0 1,274,025.0 1,296,076.0 1,285,373.0 –0.8
FSU 836,762.0 859,397.0 834,040.0 832,860.5 841,845.0 1.1
Table 9.3World marketed production of natural gas by country (million s cu m)
126
Natural gas data
OPEC Annual Statistical Bulletin 2017
2012 2013 2014 2015 2016 % change16/15
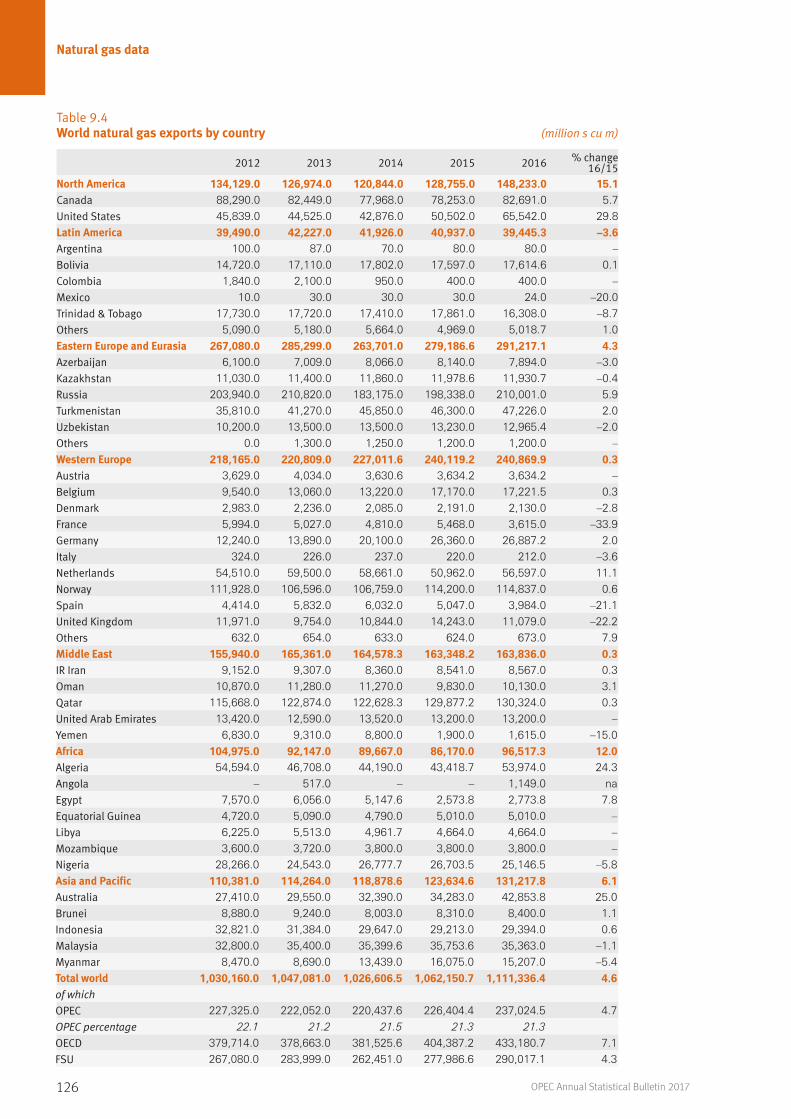
North America 134,129.0 126,974.0 120,844.0 128,755.0 148,233.0 15.1Canada 88,290.0 82,449.0 77,968.0 78,253.0 82,691.0 5.7United States 45,839.0 44,525.0 42,876.0 50,502.0 65,542.0 29.8Latin America 39,490.0 42,227.0 41,926.0 40,937.0 39,445.3 –3.6Argentina 100.0 87.0 70.0 80.0 80.0 –Bolivia 14,720.0 17,110.0 17,802.0 17,597.0 17,614.6 0.1Colombia 1,840.0 2,100.0 950.0 400.0 400.0 –Mexico 10.0 30.0 30.0 30.0 24.0 –20.0Trinidad & Tobago 17,730.0 17,720.0 17,410.0 17,861.0 16,308.0 –8.7Others 5,090.0 5,180.0 5,664.0 4,969.0 5,018.7 1.0Eastern Europe and Eurasia 267,080.0 285,299.0 263,701.0 279,186.6 291,217.1 4.3Azerbaijan 6,100.0 7,009.0 8,066.0 8,140.0 7,894.0 –3.0Kazakhstan 11,030.0 11,400.0 11,860.0 11,978.6 11,930.7 –0.4Russia 203,940.0 210,820.0 183,175.0 198,338.0 210,001.0 5.9Turkmenistan 35,810.0 41,270.0 45,850.0 46,300.0 47,226.0 2.0Uzbekistan 10,200.0 13,500.0 13,500.0 13,230.0 12,965.4 –2.0Others 0.0 1,300.0 1,250.0 1,200.0 1,200.0 –Western Europe 218,165.0 220,809.0 227,011.6 240,119.2 240,869.9 0.3Austria 3,629.0 4,034.0 3,630.6 3,634.2 3,634.2 –Belgium 9,540.0 13,060.0 13,220.0 17,170.0 17,221.5 0.3Denmark 2,983.0 2,236.0 2,085.0 2,191.0 2,130.0 –2.8France 5,994.0 5,027.0 4,810.0 5,468.0 3,615.0 –33.9Germany 12,240.0 13,890.0 20,100.0 26,360.0 26,887.2 2.0Italy 324.0 226.0 237.0 220.0 212.0 –3.6Netherlands 54,510.0 59,500.0 58,661.0 50,962.0 56,597.0 11.1Norway 111,928.0 106,596.0 106,759.0 114,200.0 114,837.0 0.6Spain 4,414.0 5,832.0 6,032.0 5,047.0 3,984.0 –21.1United Kingdom 11,971.0 9,754.0 10,844.0 14,243.0 11,079.0 –22.2Others 632.0 654.0 633.0 624.0 673.0 7.9Middle East 155,940.0 165,361.0 164,578.3 163,348.2 163,836.0 0.3IR Iran 9,152.0 9,307.0 8,360.0 8,541.0 8,567.0 0.3Oman 10,870.0 11,280.0 11,270.0 9,830.0 10,130.0 3.1Qatar 115,668.0 122,874.0 122,628.3 129,877.2 130,324.0 0.3United Arab Emirates 13,420.0 12,590.0 13,520.0 13,200.0 13,200.0 –Yemen 6,830.0 9,310.0 8,800.0 1,900.0 1,615.0 –15.0Africa 104,975.0 92,147.0 89,667.0 86,170.0 96,517.3 12.0Algeria 54,594.0 46,708.0 44,190.0 43,418.7 53,974.0 24.3Angola – 517.0 – – 1,149.0 naEgypt 7,570.0 6,056.0 5,147.6 2,573.8 2,773.8 7.8Equatorial Guinea 4,720.0 5,090.0 4,790.0 5,010.0 5,010.0 –Libya 6,225.0 5,513.0 4,961.7 4,664.0 4,664.0 –Mozambique 3,600.0 3,720.0 3,800.0 3,800.0 3,800.0 –Nigeria 28,266.0 24,543.0 26,777.7 26,703.5 25,146.5 –5.8Asia and Pacific 110,381.0 114,264.0 118,878.6 123,634.6 131,217.8 6.1Australia 27,410.0 29,550.0 32,390.0 34,283.0 42,853.8 25.0Brunei 8,880.0 9,240.0 8,003.0 8,310.0 8,400.0 1.1Indonesia 32,821.0 31,384.0 29,647.0 29,213.0 29,394.0 0.6Malaysia 32,800.0 35,400.0 35,399.6 35,753.6 35,363.0 –1.1Myanmar 8,470.0 8,690.0 13,439.0 16,075.0 15,207.0 –5.4Total world 1,030,160.0 1,047,081.0 1,026,606.5 1,062,150.7 1,111,336.4 4.6of which
OPEC 227,325.0 222,052.0 220,437.6 226,404.4 237,024.5 4.7OPEC percentage 22.1 21.2 21.5 21.3 21.3OECD 379,714.0 378,663.0 381,525.6 404,387.2 433,180.7 7.1FSU 267,080.0 283,999.0 262,451.0 277,986.6 290,017.1 4.3
Table 9.4World natural gas exports by country (million s cu m)

127
Natural gas data
OPEC Annual Statistical Bulletin 2017
Table 9.5World natural gas imports by country (million s cu m)
2012 2013 2014 2015 2016 % change16/15
North America 118,033.0 108,349.0 98,218.0 96,592.0 105,702.0 9.4
Canada 29,180.0 26,699.0 21,890.0 19,627.0 20,988.0 6.9
United States 88,853.0 81,650.0 76,328.0 76,965.0 84,714.0 10.1
Latin America 52,664.0 54,987.7 55,985.0 57,687.0 60,663.0 5.2
Argentina 8,700.0 11,200.0 11,312.0 10,660.0 10,649.3 –0.1
Brazil 13,730.0 16,770.0 17,480.0 19,960.0 19,560.8 –2.0
Chile 3,830.0 3,778.0 3,715.0 3,494.0 4,380.0 25.4
Mexico 21,827.0 18,529.0 19,698.0 20,393.0 24,519.0 20.2
Venezuela 1,877.0 1,820.7 950.0 400.0 – nap
Others 2,700.0 2,890.0 2,830.0 2,780.0 1,553.8 –44.1
Eastern Europe and Eurasia 137,130.0 130,121.0 116,404.9 106,858.9 105,100.9 –1.6
Armenia 2,070.0 1,960.0 2,080.0 2,050.0 2,050.0 –
Belarus 20,252.0 20,260.0 20,052.0 18,790.0 18,640.0 –0.8
Bulgaria 2,370.0 2,590.0 2,600.0 285.0 278.7 –2.2
Czech Republic 10,220.0 9,970.0 7,950.0 8,200.0 8,610.0 5.0
Hungary 6,060.0 6,130.0 6,536.0 7,259.0 7,526.0 3.7
Kazakhstan 3,930.0 5,280.0 4,840.0 4,700.0 4,615.4 –1.8
Latvia 1,050.0 1,060.0 1,150.0 1,210.0 1,150.0 –5.0
Lithuania 3,110.0 2,530.0 2,640.0 2,620.0 2,627.9 0.3
Moldova 2,910.0 2,250.0 2,630.0 2,720.0 2,924.0 7.5
Poland 11,270.0 12,690.0 11,754.0 12,115.0 13,069.0 7.9
Romania 2,040.0 1,300.0 1,040.0 728.0 1,494.0 105.2
Russia 33,770.0 28,010.0 27,729.9 24,956.9 24,457.8 –2.0
Slovakia 5,030.0 5,080.0 3,740.0 4,527.0 4,477.0 –1.1
Tajikistan 188.0 150.0 150.0 120.0 120.0 –
Ukraine 30,890.0 28,023.0 19,133.0 14,185.0 10,602.0 –25.3
Others 1,970.0 2,838.0 2,380.0 2,393.0 2,459.1 2.8
Western Europe 414,350.0 416,273.2 399,367.0 425,334.5 441,023.0 3.7
Austria 7,810.0 6,390.0 7,800.0 6,000.0 8,226.0 37.1
Belgium 28,580.0 31,850.0 28,500.0 34,100.0 35,464.0 4.0
Bosnia & Herzegovina 240.0 240.0 240.0 240.0 240.0 –
Croatia 1,280.0 1,370.0 1,040.0 1,072.0 1,328.0 23.9
Finland 3,661.0 3,340.0 3,057.0 2,709.0 2,488.0 –8.2
France 44,940.0 47,990.0 45,134.0 44,711.0 46,444.0 3.9
Germany 90,530.0 96,200.0 92,550.0 103,040.0 109,222.4 6.0
Greece 4,340.0 3,700.0 2,928.0 3,161.0 3,319.1 5.0
Ireland 5,290.0 4,880.0 4,500.0 4,690.0 2,341.0 –50.1
Italy 67,802.0 61,953.0 55,758.0 61,200.0 65,285.0 6.7
Luxembourg 1,206.0 1,028.0 973.0 877.0 802.0 –8.6

128
Natural gas data
OPEC Annual Statistical Bulletin 2017
2012 2013 2014 2015 2016 % change16/15
Western Europe (cont’d)
Netherlands 15,390.0 15,560.0 15,900.0 25,000.0 26,250.0 5.0
Portugal 4,610.0 4,840.0 4,453.0 5,127.0 5,369.0 4.7
Serbia 2,240.0 2,195.2 1,900.0 1,814.5 1,814.5 –
Spain 36,754.0 35,399.0 36,383.0 32,391.0 32,405.0 –
Sweden 1,130.0 1,120.0 891.0 809.0 888.0 9.8
Switzerland 3,420.0 3,650.0 3,255.0 3,381.0 3,419.0 1.1
Turkey 44,300.0 43,710.0 49,262.0 48,427.0 46,332.0 –4.3
United Kingdom 49,100.0 48,944.0 43,405.0 45,062.0 47,906.0 6.3
Others 1,727.0 1,914.0 1,438.0 1,523.0 1,480.0 –2.8
Middle East 38,595.7 41,510.2 35,643.0 44,269.7 45,425.5 2.6
IR Iran 6,720.0 5,329.0 4,422.0 9,015.0 9,246.3 2.6
Jordan 586.8 867.2 221.0 2,210.0 2,210.0 –
Kuwait 688.0 3,517.0 3,025.0 3,852.0 4,311.0 11.9
Oman 1,950.0 1,950.0 1,970.0 1,987.7 1,973.8 –0.7
Syrian Arab Republic 350.0 250.0 125.0 25.0 25.0 –
United Arab Emirates 28,201.0 29,047.0 25,800.0 27,100.0 27,479.4 1.4
Others 100.0 550.0 80.0 80.0 180.0 125.0
Africa 6,580.1 7,160.0 7,420.0 11,150.0 12,578.0 12.8
Morocco 660.0 580.0 500.0 500.0 500.0 –
South Africa 3,600.0 3,720.0 3,456.0 3,749.0 3,942.0 5.1
Tunisia 1,890.0 2,260.0 2,864.0 2,711.0 2,986.0 10.1
Others 430.1 600.0 600.0 4,190.0 5,150.0 22.9
Asia and Pacific 272,823.0 293,769.0 297,313.0 297,986.1 305,717.1 2.6
China 39,700.0 51,800.0 55,944.0 59,169.1 64,494.3 9.0
India 17,920.0 17,380.0 13,709.0 17,074.0 21,455.0 25.7
Japan 122,243.0 122,489.0 127,521.0 122,534.0 120,073.0 –2.0
South Korea 48,120.0 52,980.0 49,086.0 43,428.0 44,001.0 1.3
Thailand 9,760.0 10,360.0 10,592.0 13,329.0 12,978.0 –2.6
Others 35,080.0 38,760.0 40,461.0 42,452.0 42,715.8 0.6
Total world 1,040,175.8 1,052,170.1 1,010,350.9 1,039,878.2 1,076,209.4 3.5
of which
OPEC 37,486 39,714 34,197 40,367 41,037 1.7
OPEC percentage 3.6 3.8 3.4 3.9 3.8
OECD 753,422 749,251 721,062 737,650 767,229 4.0
FSU 100,140 92,361 82,785 73,745 69,646 –5.6
Table 9.5World natural gas imports by country (million s cu m)

129
Natural gas data
OPEC Annual Statistical Bulletin 2017
Graph 9.6World natural gas imports (bn s cu m)
Graph 9.5World natural gas exports (bn s cu m) %
Graph 9.5: World natural gas exports (bn standard cu m)
1,400
1,200
1,000
800
600
400
200
019601960 70 80 90 00 201610
15
10
5
0
20
25
%
Graph 9.6: World natural gas imports (bn standard cu m)
1,200
1,000
800
600
400
200
019601960 70 80 90 00 201610
3
2
1
0
4
5
North America
Latin America
Eastern Europe & Eurasia
Western Europe
Middle East
Africa
Asia and Pacific
OPEC share (%)
North America
Latin America
Eastern Europe & Eurasia
Western Europe
Middle East
Africa
Asia and Pacific
OPEC share (%)
AlgeriaAngola
IR Iran IraqKuwaitLibyaNigeriaQatarSaudi ArabiaUnited Arab EmiratesVenezuela
Ecuador
AlgeriaAngola
IR Iran Iraq
KuwaitLibya
NigeriaQatar
Saudi ArabiaUnited Arab Emirates
Venezuela
Ecuador
North America
Latin America
Eastern Europe & Eurasia
Western Europe
Middle East
Africa
Asia and Pacific
OPEC share (%)
North America
Latin America
Eastern Europe & Eurasia
Western Europe
Middle East
Africa
Asia and Pacific
OPEC share (%)
AlgeriaAngola
IR Iran IraqKuwaitLibyaNigeriaQatarSaudi ArabiaUnited Arab EmiratesVenezuela
Ecuador
AlgeriaAngola
IR Iran Iraq
KuwaitLibya
NigeriaQatar
Saudi ArabiaUnited Arab Emirates
Venezuela
Ecuador

130
Natural gas data
OPEC Annual Statistical Bulletin 2017
2012 2013 2014 2015 2016 % change16/15
North America 823,542.4 844,598.8 860,514.0 882,342.0 893,130.0 1.2
Canada 100,291.2 103,505.7 104,510.0 104,396.0 113,783.0 9.0
United States 723,251.2 741,093.2 756,004.0 777,946.0 779,347.0 0.2
Latin America 219,061.1 223,969.3 239,276.3 238,411.0 237,227.8 –0.5
Argentina 46,246.5 47,996.8 49,876.0 51,372.3 50,858.6 –1.0
Bolivia 3,190.0 3,370.0 3,850.0 3,340.0 3,380.1 1.2
Brazil 30,338.3 38,405.4 41,744.0 43,831.2 44,313.3 1.1
Colombia 10,090.0 10,700.0 11,700.0 11,510.0 11,820.8 2.7
Ecuador 517.0 515.0 577.9 496.9 530.0 6.7
Mexico 68,580.7 64,589.1 70,169.0 66,349.0 65,596.0 –1.1
Peru 6,610.9 5,900.8 7,350.0 7,570.5 8,100.4 7.0
Trinidad & Tobago 20,002.8 20,202.9 21,763.0 22,045.9 20,943.6 –5.0
Venezuela 24,606.5 23,643.3 23,720.4 24,076.2 23,715.0 –1.5
Others 8,878.3 8,645.9 8,526.0 7,819.0 7,970.0 1.9
Eastern Europe and Eurasia 686,794.9 674,892.8 642,573.0 675,368.0 668,645.7 –1.0
Azerbaijan 7,431.1 10,911.5 11,158.0 11,575.0 10,737.0 –7.2
Hungary 10,149.4 9,284.0 8,522.0 9,126.0 9,725.0 6.6
Kazakhstan 12,390.0 13,490.0 14,150.0 13,610.0 13,596.4 –0.1
Poland 18,116.6 18,231.6 17,835.0 18,196.0 19,104.0 5.0
Romania 13,477.9 12,599.0 11,584.0 11,229.0 11,480.0 2.2
Russia 444,943.0 441,772.5 409,257.9 446,718.0 437,863.0 –2.0
Turkmenistan 23,003.3 24,003.4 34,200.0 37,620.0 37,996.2 1.0
Ukraine 52,707.5 49,000.0 41,618.0 30,521.0 31,221.0 2.3
Uzbekistan 52,717.5 46,136.5 48,031.0 50,300.0 50,702.4 0.8
Others 51,858.7 49,464.2 46,217.1 46,473.0 46,220.7 –0.5
Western Europe 469,990.5 465,405.8 420,608.4 436,451.0 464,691.0 6.5
Austria 9,034.3 8,529.2 7,775.0 8,278.0 8,738.0 5.6
Croatia 2,890.4 2,900.4 2,440.0 2,574.0 2,735.0 6.3
Denmark 3,893.6 3,721.5 3,159.0 3,170.0 3,195.0 0.8
France 43,131.1 43,774.2 36,279.0 38,788.0 42,699.0 10.1
Germany 84,996.0 88,457.5 77,611.0 81,292.0 89,105.0 9.6
Ireland 4,735.7 4,770.7 4,417.0 4,397.0 5,333.0 21.3
Italy 74,925.6 70,078.9 61,912.0 67,524.0 70,914.0 5.0
Netherlands 46,057.5 46,365.6 40,605.0 40,136.0 42,032.0 4.7
Norway 4,340.0 5,150.0 5,970.0 6,428.0 5,883.0 –8.5
United Kingdom 77,940.0 77,454.0 70,809.0 72,192.0 81,550.0 13.0
Others 118,046.3 114,203.9 109,631.4 111,672.0 112,507.0 0.7
Middle East 423,475.1 440,351.3 462,816.2 481,801.5 489,921.0 1.7
Bahrain 13,301.9 15,702.2 16,010.0 16,186.1 16,299.4 0.7
IR Iran 157,291.3 157,337.3 174,600.0 184,900.0 188,598.0 2.0
Iraq 6,675.1 5,991.9 6,839.2 6,868.3 9,101.2 32.5
Kuwait 16,205.3 16,884.4 18,490.0 20,761.0 21,602.0 4.1
Table 9.6World natural gas demand by country (million s cu m)

131
Natural gas data
OPEC Annual Statistical Bulletin 2017
2012 2013 2014 2015 2016 % change16/15
Middle East (cont’d)
Oman 22,606.2 21,923.1 22,654.0 23,356.3 23,211.5 –0.6
Qatar 32,453.6 41,120.0 40,500.0 38,400.0 38,592.0 0.5
Saudi Arabia 99,344.1 100,030.0 102,380.0 104,450.0 106,852.4 2.3
Syrian Arab Republic 6,150.9 5,650.8 4,900.0 4,300.0 4,000.0 –7.0
United Arab Emirates 65,329.2 66,699.4 66,500.0 72,700.0 71,798.5 –1.2
Others 4,117.6 9,012.1 9,943.0 9,879.8 9,866.1 –0.1
Africa 125,841.1 130,824.7 128,587.5 130,844.4 134,568.8 2.8
Algeria 36,295.1 36,655.2 37,497.8 39,018.5 39,546.0 1.4
Angola 760.0 925.0 732.2 770.0 770.0 –
Egypt 53,147.5 52,727.5 48,080.0 47,434.0 51,082.0 7.7
Equatorial Guinea 1,580.0 1,460.0 1,370.0 1,190.0 1,180.0 –0.8
Cote d’Ivoire 1,500.0 1,650.0 1,800.0 1,900.0 1,900.0 –
Gabon 110.0 380.0 550.0 550.0 551.1 0.2
Libya 5,730.8 6,487.9 5,940.0 5,934.1 5,892.5 –0.7
Mozambique 97.0 191.0 191.0 191.0 191.0 –
Nigeria 14,307.0 15,693.2 18,370.4 18,444.6 18,167.9 –1.5
South Africa 4,941.7 4,889.7 4,210.0 4,797.0 4,686.0 –2.3
Tunisia 3,760.5 5,318.0 5,423.0 5,191.0 5,178.0 –0.3
Others 3,611.3 4,447.2 4,423.0 5,424.2 5,424.2 –
Asia Pacific 639,699.6 658,909.2 681,072.4 687,323.5 720,257.3 4.8
Australia 23,541.0 23,073.0 27,663.0 26,121.0 25,337.4 –3.0
Bangladesh 22,033.1 22,863.2 23,800.0 26,800.0 27,068.0 1.0
Brunei 2,950.4 2,970.4 3,888.0 4,033.0 3,812.0 –5.5
China 143,696.3 163,130.1 180,461.6 185,875.4 209,008.0 12.4
India 58,908.3 51,607.3 50,607.2 51,229.0 52,448.0 2.4
Indonesia 39,020.0 42,180.0 41,760.0 46,075.0 50,060.0 8.6
Japan 126,647.9 127,226.0 124,158.0 122,745.0 124,644.0 1.5
Malaysia 31,610.0 32,810.0 35,180.0 31,180.0 31,211.2 0.1
Myanmar 3,530.5 3,048.0 3,540.0 3,450.0 3,400.0 –1.4
New Zealand 4,641.7 4,718.7 5,251.0 5,021.0 5,056.0 0.7
Pakistan 41,460.0 39,400.0 39,070.0 40,750.0 41,190.1 1.1
South Korea 50,791.2 53,162.5 47,587.0 42,960.0 45,873.0 6.8
Thailand 51,126.9 52,274.3 52,698.1 52,863.5 50,675.0 –4.1
Vietnam 8,401.2 8,801.2 11,013.0 11,165.0 11,276.6 1.0
Others 31,341.0 31,644.4 34,395.6 37,055.6 39,198.0 5.8
Total world 3,388,404.7 3,438,951.9 3,435,447.9 3,532,541.3 3,608,441.6 2.1
of which
OPEC 459,625.0 472,362.7 496,698.0 517,369.5 525,716.6 1.6
OPEC percentage 13.6 13.7 14.5 14.6 14.6
OECD 1,611,992.1 1,631,532.9 1,601,883.5 1,629,688.0 1,674,302.4 2.7
FSU 627,616.5 616,806.7 589,984.9 620,831.0 611,439.7 –1.5
Table 9.6World natural gas demand by country (million s cu m)

132
Natural gas data
OPEC Annual Statistical Bulletin 2017
no 2012
capacity no 2013
capacity no 2014
capacity no 2015
capacity no 2016
capacity
up to 19,999 19 183 20 199 23 208 23 208 23 208
20,000–39,999 3 94 3 94 1 23 1 23 5 137
40,000–59,999 3 122 – – – – – – – –
60,000–99,999 14 1,070 14 1,070 13 982 11 839 9 684
100,000 and over 334 51,679 335 51,856 349 54,134 380 59,196 406 63,544
Total world 373 53,148 372 53,219 386 55,347 415 60,266 443 64,573
Table 9.8World LNG carrier fleet by size (1,000 cu m)
Table 9.7LNG carrier fleet in OPEC Members (1,000 cu m)
Notes:Figures as at year-end.
Notes:Figures as at year-end.
no 2012
capacity no 2013
capacity no 2014
capacity no 2015
capacity no 2016
capacity
Algeria 9 1,057 9 1,073 9 1,073 9 1,073 9 1,104
Angola 3 263 3 263 3 263 3 270 3 270
Ecuador – – – – – – – – – –
Gabon – – – – – – – – – –
IR Iran – – – – – – – – – –
Iraq – – – – – – – – – –
Kuwait – – – – – – – – – –
Libya – – – – – – – – – –
Nigeria 24 3,346 24 3,346 13 1,738 11 1,680 13 1,913
Qatar 29 5,610 29 5,610 29 5,610 29 5,610 29 5,610
Saudi Arabia – – – – – – – – – –
United Arab Emirates 8 1,096 8 1,096 8 1,096 8 1,096 8 1,096
Venezuela – – – – – – – – – –
OPEC 73 11,372 73 11,388 62 9,780 60 9,729 62 9,993
Total world 373 53,148 372 53,219 386 55,347 415 60,266 443 64,573
OPEC percentage 21.4 21.4 17.7 16.1 15.5

133
Natural gas data
OPEC Annual Statistical Bulletin 2017
○ Length (miles) Diameter (inches)
Algeria
Alrar/Hassi R’Mel (3) Sonatrach 2 x 597, 330 2 x 42, 48
Hassi R’Mel/Skikda – El Kala Sonatrach 433 48
Hassi R’Mel/Skikda (2) Sonatrach 2 x 357 2 x 42
Hassi R’Mel/Oued Safsaf Sonatrach – 48
Hassi R’Mel/El Aricha Sonatrach 324 48
Hassi R’Mel/Arzew – Beni Saf (2) Sonatrach 272, 321 42, 48
Hassi R’Mel/Arzew (4) Sonatrach 315, 316, 2 x 318 2 x 40, 24/22, 42
Angola
Segmetnt A/NB-S WYE Chevron 20 20
Segment B/NB-S WYE Chevron 39 22
TL/NB-S WYE Chevron 19 14
AOKA-PLTG58306/NB-S WYE Esso 62 18
EL-2/NB-S WYE Total 42 16
FG451/NB-S WYE Total 20 12
PLEM 3 A/PLEM 2A Total 27 24
PLEM 2A/Tie in Point in 20m WD Total 45 24
Linha de Transporte de Gas/Tie in Point in 20m WD
BP 44 12
Ecuador
Amistad Platform (Offshore)/Bajo Alto Petroamazonas EP 44 13
Gabon
– – – –
IR Iran
Asaluyeh/Lushan NIGC 734 33
Asaluyeh/Aghajari NIGC 313 56
Asaluyeh/Bid Boland NIGC 306 56
Asaluyeh/Iranshahr NIGC 560 56
Asaluyeh/Naeen NIGC 489 56
Asaluyeh/Saveh NIGC 712 56
Bid Boland/Astara NIGC 685 42/40
Kangan/Qazvin NIGC 646 56
Kangan/Pataveh NIGC 262 56
Saveh/Miandoab NIGC 292 40, 48
Tehran/Dasht-e-Shad NIGC 327 42, 48
Table 9.9Main gas pipelines in OPEC Members, 2016

134
Natural gas data
OPEC Annual Statistical Bulletin 2017
Connection from/to Owner or operator Length (miles) Diameter (inches)
Iraq
Branch from Trans-Iraq dry gas pipeline/ Hilla-2 PWR St
OPC 25 24
Al-Ahdeb/Al-Zubaydia PWR St OPC 73 16
Baiji/Al-Mashriq OPC 131 18
Baiji/Al-Kaem OPC 268 16
Khor Al-Zubair gas distribution station/ Hartha PWR St
OPC 48 24
Kirkuk/Baiji OPC 90 24
Kirkuk/North Oil OPC 21 18
Kirkuk/Taji OPC 272 16
Mishraq cross road/Mousil PWR St OPC 38 12
North Rumaila/Khor Al-Zubair gas dis station OPC 54 42
Rumaila/Nasiriyaha PWR St OPC 134 24
Strategic pipeline/Al-Najaf PWR St OPC 23 16
Strategic pipeline/Hilla PWR St OPC 45 16
Strategic pipeline/Kabesa cement OPC 24 10
Taji/South Baghdad PWR St OPC 35 18
Trans-Iraqi dry gas pipeline/Daura PWR St OPC 29 18
Trans-Iraqi dry gas pipeline/Najaf PWR St OPC 74 24
Trans-Iraqi dry gas pipeline/Dewania OPC 50 24
Kuwait
Khafji offshore/Khafji onshore (2) KJO 68 12, 42
Wafa/KOC booster station2 WJO 38 18
Libya
Brega/Al Khums Sirte Oil 399.9 34
Mellitah/Gela (Italy) Green Stream 335 32
Wafa/Mellitah (2) Mellitha Oil & Gas 2 x 326 16, 32
Brega/Benghazi Sirte Oil 152.52 34
Intisar/Zueitina Zueitina 136.4 20
Intisar/Brega1 Zueitina 129 42
Nasser/Brega Sirte Oil 107 36
Bu Attifel/Intisar (2) Mellitha Oil & Gas, Eni Oil 2 x 82 34, 10
Tripoli/Mellitah1 Sirte Oil 71 34
Faregh/Intisar Waha 68 24
Waha/Nasser Waha 68 24
Al Khums/Tripoli1 Sirte Oil 68 34
Bahr es Salam/Mellitah (2) Mellitha Oil & Gas 2 x 68 10, 36
Nasser/KM-81.5 Sirte Oil 57 30
Table 9.9Main gas pipelines in OPEC Members, 2016

135
Natural gas data
OPEC Annual Statistical Bulletin 2017
Connection from/to Owner or operator Length (miles) Diameter (inches)
Libya (cont’d)
KM-91.5/Brega (2) Sirte Oil 2 x 57 16, 36
Raguba/KM-110 Sirte Oil 55 20
KM-81.5/Brega Sirte Oil 51 30
Jakhira/Intisar (2) Wintershall 2 x 50 8, 20
Intisar/Sahl Sirte Oil 50 30
Sahl/KM-81.5 Sirte Oil 30 30
Attahaddy/KM-91.5 (2) Sirte Oil 2 x 16 12, 30
Bouri offshore/Bahr Es Salam (2) Mellitha Oil & Gas 2 x 12 4, 10
Nigeria
Ajaokuta/Obajana Nigerian Gas Company 56 18
Aladja pipeline system/Aladja Nigerian Gas Company 65 6, 8, 14, 16
Alagbado/Ewekoro (WAPCO) Nigerian Gas Company 17 6
Alagbado/Ota-Agbara distr (SNG) Nigerian Gas Company 25 24
Alagbado/Ota-Agbara distr (SNG) Nigerian Gas Company 25 24
Alakiri/Ikot-Abasi (ALSCON) Nigerian Gas Company 73 24
Escravos/WGTP Nigerian Gas Company 36 36
Ewekoro node/Abeokuta (GDZ) Nigerian Gas Company 20 18
Ikpe Anang/EHGC (UNICEM) Nigerian Gas Company 67 24
Imo River/Aba (SPDC) Nigerian Gas Company 20 12
Int scrapper station/Ikot-Abasi (ALSCON) Nigerian Gas Company 23 24
Kew Metal/Ogijo Nigerian Gas Company 63 6
KP 331/Itoki Nigerian Gas Company 25 24
Oben/Ajaokuta Nigerian Gas Company 123 24
Oben/Geregu (PHCN) Nigerian Gas Company 123 20/24
Oben/Sapele (PHCN) Nigerian Gas Company 22 18
Obiafu gas plant (GTS-1)/Ubeta Node (GTS-1) Nigerian LNG Ltd 18 24
PS 4 (Itoki)/Ibese Nigerian Gas Company 21 18
Rumuji Node (GTS-1)/NLNG Bonny Nigerian LNG Ltd 53 36
Soku Gas Plant (GTS-1)/Rumuji Node (GTS-1) Nigerian LNG Ltd 25 28
Ubeta Node (GTS-1)/Rumuju Node (GTS-1) Nigerian LNG Ltd 21 28
Utorogu/Ughelli (PHCN) Nigerian Gas Company 22 1
Warri/Egbin node (PS4) Nigerian Gas Company 214 30
WGTP/WRPC Nigerian Gas Company 36 36
Table 9.9Main gas pipelines in OPEC Members, 2016

136
Natural gas data
OPEC Annual Statistical Bulletin 2017
Connection from/to Owner or operator Length (miles) Diameter (inches)
Qatar
BRZ-WHPs/Ras Laffan landfall BRZ 84 32
DOL WHPs /Ras Laffan landfall Dolphin/Del 82 36
NF B-PU/Ras Laffan landfall Qatar Gas 78 32
PEARL-1/Ras Laffan landfall Shell 58 30
PS-2 Offshore/PS-1 Offshore QP 20 6
PS-3 Offshore/PS-1 Offshore QP 37 10
PS-4/Ras Laffan landfall (2) QP 2 x 77 12, 34
Qatargas WHPs/Ras Laffan landfall (2) Qatar Gas 73, 91 38, 34
Ras Laffan/Mesaieed QP 135 20
Ras Laffan/NFGP (2) QP 2x137 12, 34
Ras Laffan/UAE Dolphin /DEL 363 48
Ras Laffan: Station V/Station S (2) QP 124 36
Ras Laffan: Station V/Station T3 QP 87 36
Rasgas WHPs/Ras Laffan landfall Ras Gas 98 38
RG-A/Ras Laffan landfall Ras Gas 90 32
Saudi Arabia
Abqaiq/Yanbu Saudi Aramco 741 48
UBTG-1/Berri (2) Saudi Aramco 2 x 155 56, 36/38/40/42
UBTG-1/AY-1 KP 916 Saudi Aramco 152 56
UBTG-1/Ju’aymah Saudi Aramco 127 28/30/38/40
Safaniya/Ju’aymah Saudi Aramco 123 40
AY-1 KP 943/Riyadh Saudi Aramco 95 48
Tanajib/Berri Saudi Aramco 90 30
Abqaiq/Berri Saudi Aramco 85 24/36
Haradh/Uthmaniya (2) Saudi Aramco 77, 87 24/ 32, 48
UA-1/Uthmaniya Saudi Aramco 62 24/32
Hawiyah/UBTG-1 Saudi Aramco 35 56
Ju'aymah/Jubail Saudi Aramco 35 30/38/40
Abqaiq/Shedgum Saudi Aramco 33 42
Waqr/Haradh Saudi Aramco 31 30
Hawiyah/ Uthmaniyah Saudi Aramco 29 32
Qatif North/Berri Saudi Aramco 28 32
Tinat/Haradh Saudi Aramco 27 20
Haradh/Hawiyah (3) Saudi Aramco 3 x 27 30
Aindar/Shedgum Saudi Aramco 21 12
Depco/Abqaiq Saudi Aramco 20 40
Table 9.9Main gas pipelines in OPEC Members, 2016

137
Natural gas data
OPEC Annual Statistical Bulletin 2017
Connection from/to Owner or operator Length (miles) Diameter (inches)
United Arab Emirates
Umm Shaif Field/Das Island ADMA OPCO 22 46
TABK/Umm Shaif field ADMA OPCO/TABK 26.7 30
ABK/USCC ABK 26.4 30
Mubarraz field/Mubarraz terminal ADOC 21.9 14
Taweelah/Fujirah Dolphin 151.6 48
Al Ain/Fujirah Dolphin 108.1 24
Venezuela
Anaco/Barquisimeto PDVSA 1,535 8, 10, 12, 16, 20, 26, 30, 36
Anaco/Puerto La Cruz, Margarita PDVSA 480 12, 16, 20, 26, 36
Anaco/Puerto Ordaz PDVSA 484 16, 20, 26, 36
Compressor plant Orocual/Plant Jusepin PDVSA 15.1 16
ICO Pipeline/TyD Gas Metano–PDVSA Gas PDVSA 164 30/36
Muscar Operations Center/Soto Valves Estacion (ANACO)
PDVSA 71.5 26
Quiriquire/Jusepin PDVSA 32/32 20
San Genaro de Boconoito/Obispo PDVSA 27 12
Santa Barbara/Aguasay 5A-Plant PDVSA 40.73 36Sistema ULE–Amuay/TyD Gas Metano–PDVSA Gas
PDVSA 222 16/20
Trans-Caribbean Pipeline/TyD Gas Metano– PDVSA Gas
PDVSA 125.71 26
Table 9.9Main gas pipelines in OPEC Members, 2016
