summary of consolidated financial results for the · pdf file(reference translation) may 10,...
TRANSCRIPT

(Reference Translation)
May 10, 2017
Summary of Consolidated Financial Results for the Fiscal Year Ended March 31, 2017
<under Japanese GAAP> Company name: MIKUNI CORPORATION Listing: First Section of Tokyo Stock Exchange Securities code: 7247 URL: http://www.mikuni.co.jp/ Representative: Hisataka Ikuta, President & COO Inquiries: Koji Kaneda, Board Director, Executive Officer, CFO, General Manager of
Corporate Planning and Administrative Division TEL: +81-3-6895-0038 Scheduled date of Ordinary General Meeting of Shareholders: June 28, 2017 Scheduled date to commence dividend payments: June 29, 2017 Scheduled date to file the Annual Securities Report: June 28, 2017 Preparation of supplementary material on financial results: Yes Holding of financial results presentation meeting: Yes (for institutional investors and analysts)
(Millions of yen with fractional amounts discarded, unless otherwise noted) 1. Consolidated financial results for the fiscal year ended March 31, 2017
(from April 1, 2016 to March 31, 2017) (1) Consolidated operating results
(Percentages indicate year-on-year changes. Figures in parentheses are negative figures.)
Net sales Operating income Ordinary income Net income attributable to
owners of parent
Fiscal year ended Millions of yen % Millions of yen % Millions of yen % Millions of yen %
March 31, 2017 94,787 (3.2) 3,453 11.6 3,469 13.9 2,685 111.5
March 31, 2016 97,874 (0.7) 3,094 (37.0) 3,046 (29.6) 1,269 (57.6)
Note: Comprehensive income Fiscal year ended March 31, 2017: 2,966 million yen [– %] Fiscal year ended March 31, 2016: (1,271) million yen [– %]
Basic earnings
per share Diluted earnings
per share Return on equity
Ratio of ordinary income to total
assets
Ratio of operating income to net sales
Fiscal year ended yen yen % % %
March 31, 2017 79.87 – 9.6 4.0 3.6
March 31, 2016 37.67 – 4.6 3.5 3.2
Reference: Share of income (loss) of entities accounted for using equity method Fiscal year ended March 31, 2017: 32 million yen Fiscal year ended March 31, 2016: 58 million yen

(2) Consolidated financial position
Total assets Net assets Equity ratio Net assets per share
As of Millions of yen Millions of yen % yen
March 31, 2017 89,181 30,058 32.8 868.69
March 31, 2016 85,590 27,950 31.0 789.18
Reference: Equity As of March 31, 2017: 29,207 million yen As of March 31, 2016: 26,534 million yen (3) Consolidated cash flows
Cash flows from
operating activities Cash flows from
investing activities Cash flows from
financing activities
Cash and cash equivalents at end of
period
Fiscal year ended Millions of yen Millions of yen Millions of yen Millions of yen
March 31, 2017 5,185 (5,270) 426 4,945
March 31, 2016 4,630 (4,746) (384) 4,743
2. Dividends
Annual dividends
Total dividends(Total)
Dividend payout ratio
(Consolidated)
Ratio of dividends to
net assets (Consolidated)
First
quarter-end
Second quarter-
end
Third quarter-
end
Fiscal year- end
Total
yen yen yen yen yen Millions of yen % %
Fiscal year ended March 31, 2016 – 5.00 – 10.00 15.00 508 39.8 1.8
Fiscal year ended March 31, 2017 – 5.00 – 7.00 12.00 406 15.0 1.4
Fiscal year ending March 31, 2018 (Forecast)
– 5.00 – 7.00 12.00 19.2
The dividend of 5.00 yen paid at the second quarter-end of the fiscal year ended March 31, 2016 was a commemorative dividend to mark the Company’s shift to the First Section of the Tokyo Stock Exchange.
3. Consolidated earnings forecasts for the fiscal year ending March 31, 2018
(from April 1, 2017 to March 31, 2018) (Percentages indicate year-on-year changes. Figures in parentheses are negative figures.)
Net sales Operating income Ordinary incomeNet income
attributable to owners of parent
Basic earnings per share
Millions of yen % Millions of
yen % Millions of yen % Millions of
yen % yen
Six months ending September 30, 2017 48,400 6.1 1,400 9.8 1,300 6.8 600 (23.2) 17.85
Fiscal year ending March 31, 2018 100,000 5.5 3,700 7.1 3,500 0.9 2,100 (21.8) 62.46
* Notes
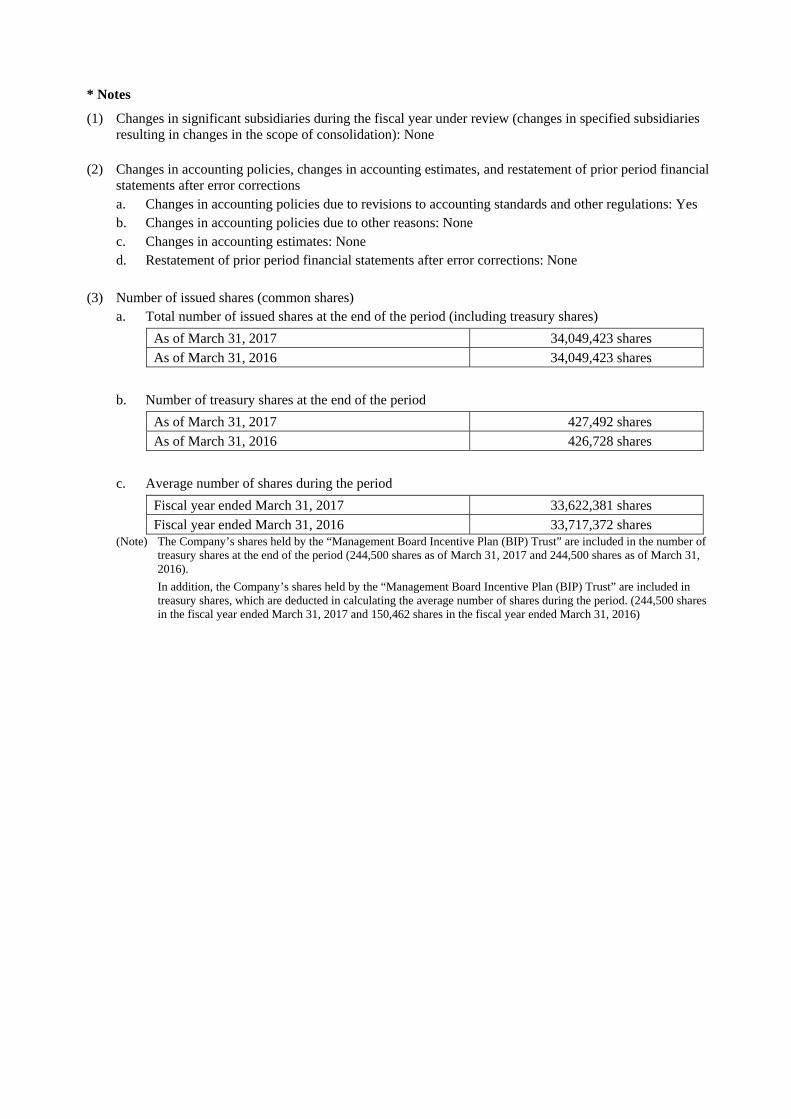
(1) Changes in significant subsidiaries during the fiscal year under review (changes in specified subsidiaries resulting in changes in the scope of consolidation): None
(2) Changes in accounting policies, changes in accounting estimates, and restatement of prior period financial
statements after error corrections a. Changes in accounting policies due to revisions to accounting standards and other regulations: Yes b. Changes in accounting policies due to other reasons: None c. Changes in accounting estimates: None d. Restatement of prior period financial statements after error corrections: None
(3) Number of issued shares (common shares)
a. Total number of issued shares at the end of the period (including treasury shares)
As of March 31, 2017 34,049,423 shares
As of March 31, 2016 34,049,423 shares
b. Number of treasury shares at the end of the period
As of March 31, 2017 427,492 shares
As of March 31, 2016 426,728 shares
c. Average number of shares during the period
Fiscal year ended March 31, 2017 33,622,381 shares
Fiscal year ended March 31, 2016 33,717,372 shares (Note) The Company’s shares held by the “Management Board Incentive Plan (BIP) Trust” are included in the number of
treasury shares at the end of the period (244,500 shares as of March 31, 2017 and 244,500 shares as of March 31, 2016).
In addition, the Company’s shares held by the “Management Board Incentive Plan (BIP) Trust” are included in treasury shares, which are deducted in calculating the average number of shares during the period. (244,500 shares in the fiscal year ended March 31, 2017 and 150,462 shares in the fiscal year ended March 31, 2016)
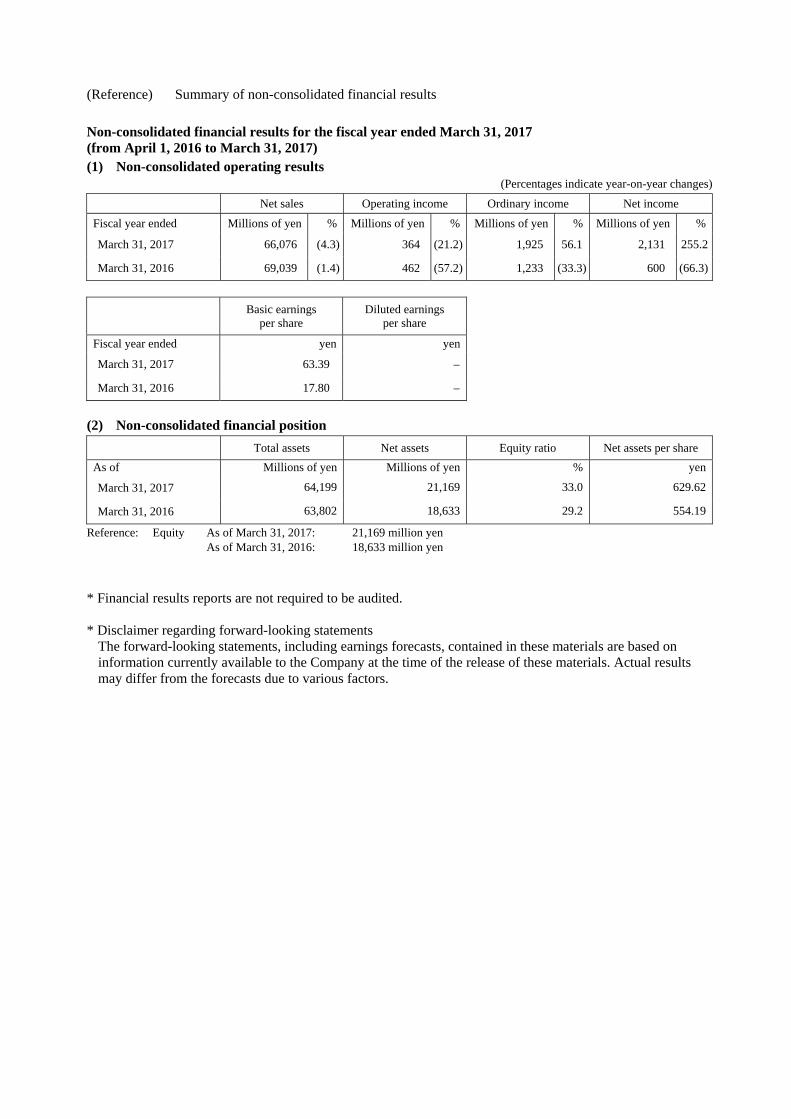
(Reference) Summary of non-consolidated financial results Non-consolidated financial results for the fiscal year ended March 31, 2017 (from April 1, 2016 to March 31, 2017) (1) Non-consolidated operating results
(Percentages indicate year-on-year changes)
Net sales Operating income Ordinary income Net income
Fiscal year ended Millions of yen % Millions of yen % Millions of yen % Millions of yen %
March 31, 2017 66,076 (4.3) 364 (21.2) 1,925 56.1 2,131 255.2
March 31, 2016 69,039 (1.4) 462 (57.2) 1,233 (33.3) 600 (66.3)
Basic earnings
per share Diluted earnings
per share
Fiscal year ended yen yen
March 31, 2017 63.39 –
March 31, 2016 17.80 –
(2) Non-consolidated financial position
Total assets Net assets Equity ratio Net assets per share
As of Millions of yen Millions of yen % yen
March 31, 2017 64,199 21,169 33.0 629.62
March 31, 2016 63,802 18,633 29.2 554.19
Reference: Equity As of March 31, 2017: 21,169 million yen As of March 31, 2016: 18,633 million yen
* Financial results reports are not required to be audited. * Disclaimer regarding forward-looking statements
The forward-looking statements, including earnings forecasts, contained in these materials are based on information currently available to the Company at the time of the release of these materials. Actual results may differ from the forecasts due to various factors.
- 1 -
[Attached Material]
Index
1. Overview of Operating Results and Others ............................................................................................ 2 (1) Overview of operating results for the fiscal year ............................................................................. 2 (2) Overview of financial position for the fiscal year ............................................................................ 4 (3) Basic policy for distributing incomes, and dividends for the fiscal year under review and next
fiscal year ......................................................................................................................................... 5
2. Status of the Corporate Group ................................................................................................................ 6
3. Basic concept regarding selection of accounting standards ................................................................... 6
4. Consolidated financial statements and significant notes thereto ............................................................ 7 (1) Consolidated balance sheet .............................................................................................................. 7
(2) Consolidated statement of income and consolidated statement of comprehensive income ............. 9 (3) Consolidated statement of changes in equity ................................................................................. 11 (4) Consolidated statement of cash flows ............................................................................................ 13
(5) Notes to consolidated financial statements .................................................................................... 15 (Notes on premise of going concern) ............................................................................................. 15 (Significant matters forming the basis of preparing the consolidated financial statements) .......... 15 (Changes in accounting policies) ................................................................................................... 15 (Segment information) ................................................................................................................... 16 (Per share information) .................................................................................................................. 18 (Significant subsequent events) ..................................................................................................... 18
5. Others ................................................................................................................................................... 18 (1) Changes in Directors and Audit & Supervisory Board members .................................................. 18

- 2 -
1. Overview of Operating Results and Others
(1) Overview of operating results for the fiscal year In the current fiscal year (from April 1, 2016 to March 31, 2017), as for the Japanese economy, production and employment improved and consumer spending picked up, so domestic business conditions continued to be in a gradual recovery trend. In regard to overseas, economic conditions were robust in the United States and other advanced countries, and the Chinese economy appeared to pick up, so the global economy made a moderate recovery. In this business environment, in the Automobile-related Products Business, the Group continued research and development and strategic investment with a focus on the strengthening of environmental regulations. In the area of production, quality control was thoroughly carried out, and production efficiency was improved. Mikuni Life & Auto Co., Ltd., which centers on the manufacture and sale of welfare and care devices, steadily expanded its customer base. As a result of these initiatives, the Group’s net sales amounted to 94,787 million yen (down 3.2% year-on-year). Production efficiency increased centering on products for four-wheeled automobiles, and operating margin improved. As such, operating income stood at 3,453 million yen (up 11.6% year-on-year). Net financial revenue improved, and thus, ordinary income amounted to 3,469 million yen (up 13.9% year-on-year). Compensation income was recorded as extraordinary income, so net income attributable to owners of parent amounted to 2,685 million yen (up 111.5% year-on-year). Operating results by segment are as follows:
(i) <Automobile-related Products Business>
Sales in this business, which centers on the manufacture and sale of fuel injection systems for automobiles, motorcycles, and general purpose engines and engine-related functional components, decreased compared with the previous fiscal year. In regard to products for automobiles, while performance was robust centering on overseas, domestic minivehicle production was at a low level in the first half of the fiscal year, and partly for this reason, sales remained flat year-on-year. As for products for motorcycles, sales of models equipped with the Company’s products increased in the large motorcycles market, but due to the effects of sluggish motorcycle demand in emerging markets, sales decreased. In regard to operating income, the operating margin declined slightly due to factors such as decreased sales from products for motorcycles. As a result, net sales in this business amounted to 59,011 million yen (down 1.8% year-on-year), and operating income was 2,462 million yen (down 3.0% year-on-year).
(ii) <Household Appliances Device Products Business>
Sales in this business, which centers on the manufacture and sale of control systems for gas appliances and water appliances, declined from the previous fiscal year. In the domestic market, a decrease in sales of lower-price range stove burners had an impact on the results. As for overseas, sales of gas flow control valves for hot-water heaters were robust mainly in China. The efficiency of production was increased, and thus the segment’s operating margin improved compared to the previous year. As a result, net sales in this business amounted to 7,213 million yen (down 2.9% year-on-year), and operating income was 412 million yen (up 43.6% year-on-year).
(iii) <Aircraft Component Import and Sales Business>
Sales of aircraft components declined from the previous fiscal year. While the domestic aircraft industry is expected to see continued growth over the long term, a decrease in the production of existing mass-produced models had an effect on the results in the fiscal year. This business was also affected by exchange fluctuations, resulting from the fact that domestic sales are mainly on a U.S. dollar basis. As a result, net sales in this business amounted to 21,272 million yen (down 7.5% year-on-year), and operating income was 282 million yen (down 10.0% year-on-year).
(iv) <Other Businesses>
Sales in this segment, which handles the sale of turf-maintenance equipment, etc. and the manufacture and sale of vehicle heaters, welfare and care devices and other products decreased compared with the previous fiscal year. As for turf-maintenance equipment, etc., while there appeared to be a seasonal recovery toward the end of the fiscal year, the fact that the replacement

- 3 -
cycle of golf carts is getting longer had an effect, so sales decreased. In regard to vehicle heaters, sales increased due to the robust performance of products for tourist buses. Mikuni Life & Auto Co., Ltd., which is in the welfare and care devices business, had an increase in sales and income compared to the previous year due to an expansion of its customer base, even though the fiscal year was nine months long for part of its business. As a result, net sales in this business amounted to 7,290 million yen (down 1.4% year-on-year), while operating income was 295 million yen (compared with an operating loss of 43 million yen in the previous fiscal year).
[Comparison table of Operating results by segment] (Millions of yen)
Fiscal year ended March 31, 2016
Fiscal year ended March 31, 2017
Change in net sales
Change in operating income
Net sales Operating
incomeNet sales
Operating income
Amount Ratio Amount Ratio
Automobile-related Products Business
60,064 2,537 59,011 2,462 (1,053) (1.8)% (75) (3.0)%
Household Appliances Device Products Business
7,428 287 7,213 412 (215) (2.9)% 125 43.6%
Aircraft Component Import and Sales Business
22,987 313 21,272 282 (1,714) (7.5)% (31) (10.0)%
Other Businesses 7,393 (43) 7,290 295 (103) (1.4)% 339 –Total 97,874 3,094 94,787 3,453 (3,086) (3.2)% 358 11.6%
Reference: exchange rate 1 USD = 121.10 yen 1 USD = 108.78 yen – – (Notes) 1. The figures inside parentheses in the column presenting operating income indicate the amount of operating loss.
2. Amounts less than one million yen are discarded. 3. “–” indicates a negative change in the current fiscal year or the previous fiscal year or both.
[Reference] Performance trends for each quarter from the fiscal year ended March 31, 2015 to fiscal year ended March 31, 2017
(Millions of yen) Fiscal year ended March 31, 2015
Fiscal year ended March 31, 2016
Fiscal year ended March 31, 2017
First quarter
Second quarter
Third quarter
Fourth quarter
First quarter
Second quarter
Third quarter
Fourth quarter
First quarter
Second quarter
Third quarter
Fourth quarter
Automobile-related Products Business
Net sales 14,595 15,611 15,735 17,455 15,044 15,116 14,643 15,260 13,945 13,829 14,798 16,438Operating income 905 948 952 1,264 598 386 330 1,222 756 321 476 908
Household Appliances Device Products Business
Net sales 1,820 1,942 1,966 1,895 1,639 1,945 1,919 1,924 1,557 1,777 1,882 1,995
Operating income 55 19 69 41 27 48 60 150 (39) 152 79 219
Aircraft Component Import and Sales Business
Net sales 5,195 4,243 5,297 6,159 6,282 5,507 5,445 5,752 5,681 5,345 4,928 5,317
Operating income 85 148 378 149 216 89 47 (39) 0 (52) 225 108
Other Businesses Net sales 1,439 1,579 1,540 2,039 1,981 1,639 1,724 2,048 1,709 1,773 1,718 2,088Operating income (46) (28) (32) 3 (6) (112) (19) 94 33 102 69 90
Total Net sales 23,051 23,377 24,540 27,549 24,947 24,208 23,732 24,986 22,893 22,727 23,328 25,839Operating income 1,000 1,088 1,367 1,457 836 412 418 1,427 751 523 850 1,328
(Notes) 1. The figures inside parentheses in the row presenting operating income indicate the amount of operating loss. 2. Amounts less than one million yen are discarded.
Future outlook
The business environment surrounding the Group is exposed to the influence of not only macroeconomic and political trends in Japan and overseas, but also changes in regulatory structures such as environmental regulations. Responding to these changes in the business environment, the Group aims to be a sustainable and highly profitable company underpinned by our manufacturing expertise. Looking forward, the Group is expecting the global economy to continue on a moderate recovery but at the same time recognizes numerous uncertainties. Accordingly, we will continue our research and development with a close eye on the increasingly stricter environmental regulations and strategic investment while striving to make improvements in production efficiency. Based on the current information, our consolidated earnings forecasts for the next fiscal year (ending March 31, 2018) are as follows:
- 4 -
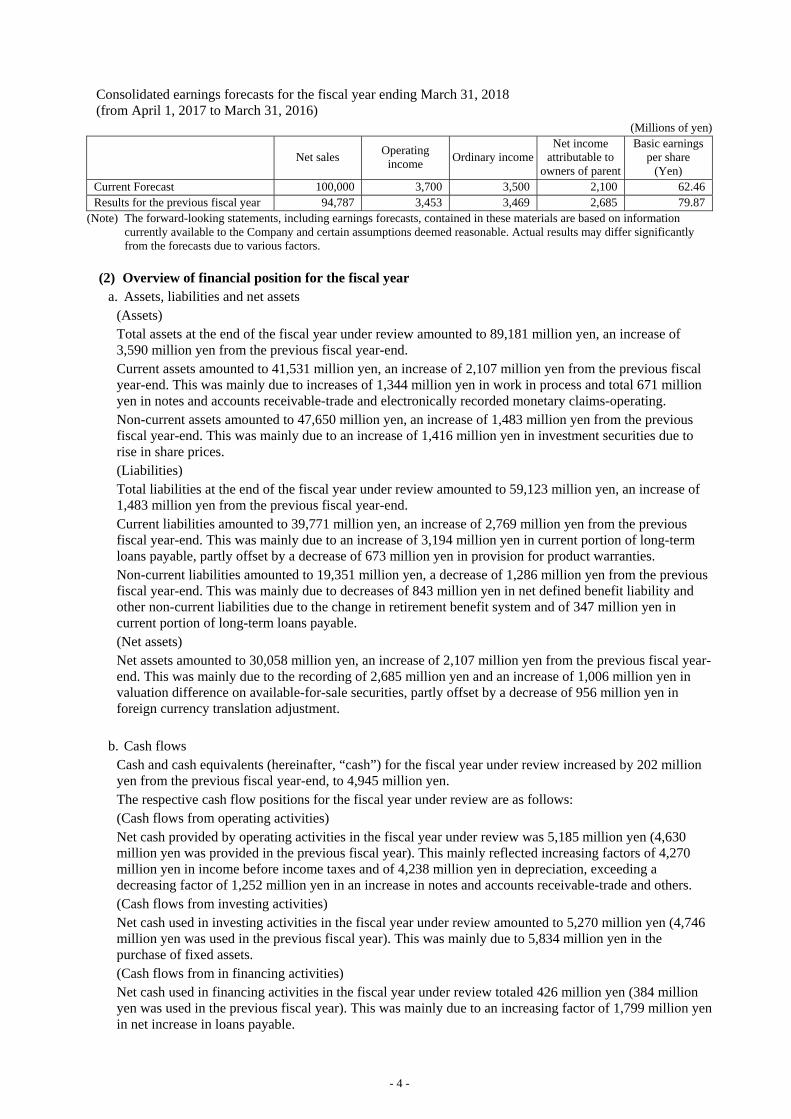
Consolidated earnings forecasts for the fiscal year ending March 31, 2018 (from April 1, 2017 to March 31, 2016)
(Millions of yen)
Net sales Operating
income Ordinary income
Net income attributable to
owners of parent
Basic earnings per share
(Yen) Current Forecast 100,000 3,700 3,500 2,100 62.46Results for the previous fiscal year 94,787 3,453 3,469 2,685 79.87
(Note) The forward-looking statements, including earnings forecasts, contained in these materials are based on information currently available to the Company and certain assumptions deemed reasonable. Actual results may differ significantly from the forecasts due to various factors.
(2) Overview of financial position for the fiscal year
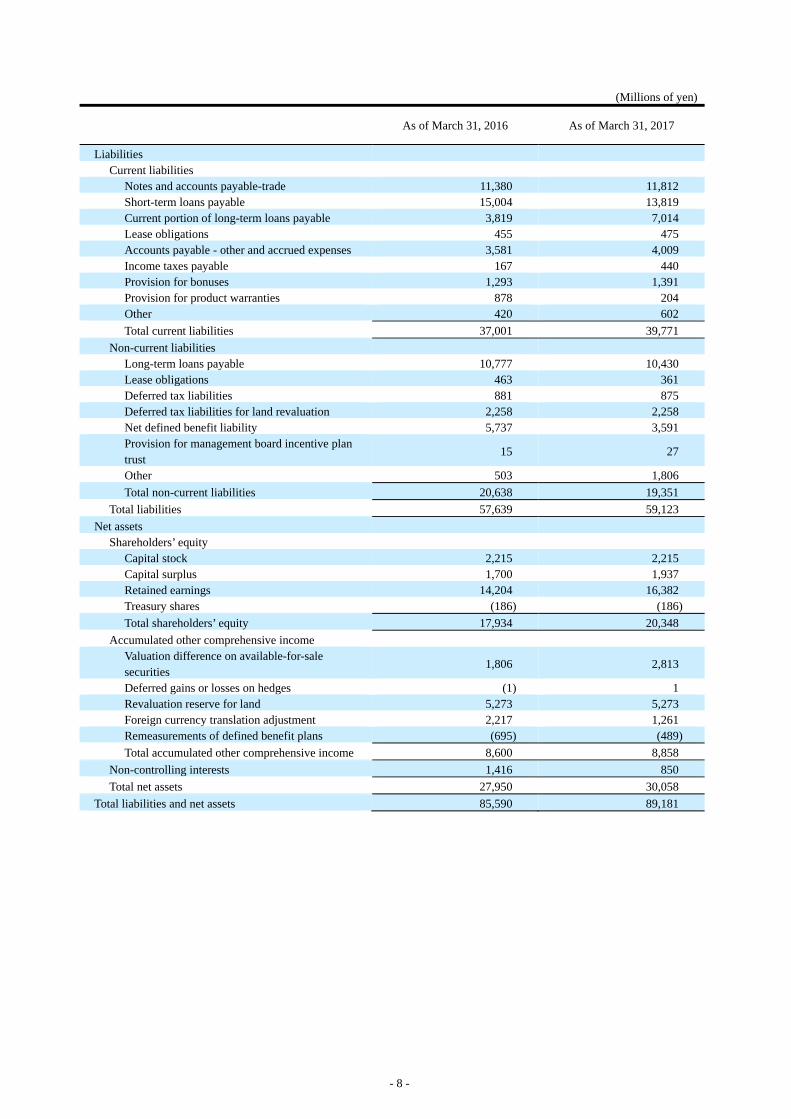
a. Assets, liabilities and net assets (Assets) Total assets at the end of the fiscal year under review amounted to 89,181 million yen, an increase of 3,590 million yen from the previous fiscal year-end. Current assets amounted to 41,531 million yen, an increase of 2,107 million yen from the previous fiscal year-end. This was mainly due to increases of 1,344 million yen in work in process and total 671 million yen in notes and accounts receivable-trade and electronically recorded monetary claims-operating. Non-current assets amounted to 47,650 million yen, an increase of 1,483 million yen from the previous fiscal year-end. This was mainly due to an increase of 1,416 million yen in investment securities due to rise in share prices. (Liabilities) Total liabilities at the end of the fiscal year under review amounted to 59,123 million yen, an increase of 1,483 million yen from the previous fiscal year-end. Current liabilities amounted to 39,771 million yen, an increase of 2,769 million yen from the previous fiscal year-end. This was mainly due to an increase of 3,194 million yen in current portion of long-term loans payable, partly offset by a decrease of 673 million yen in provision for product warranties. Non-current liabilities amounted to 19,351 million yen, a decrease of 1,286 million yen from the previous fiscal year-end. This was mainly due to decreases of 843 million yen in net defined benefit liability and other non-current liabilities due to the change in retirement benefit system and of 347 million yen in current portion of long-term loans payable. (Net assets) Net assets amounted to 30,058 million yen, an increase of 2,107 million yen from the previous fiscal year-end. This was mainly due to the recording of 2,685 million yen and an increase of 1,006 million yen in valuation difference on available-for-sale securities, partly offset by a decrease of 956 million yen in foreign currency translation adjustment.
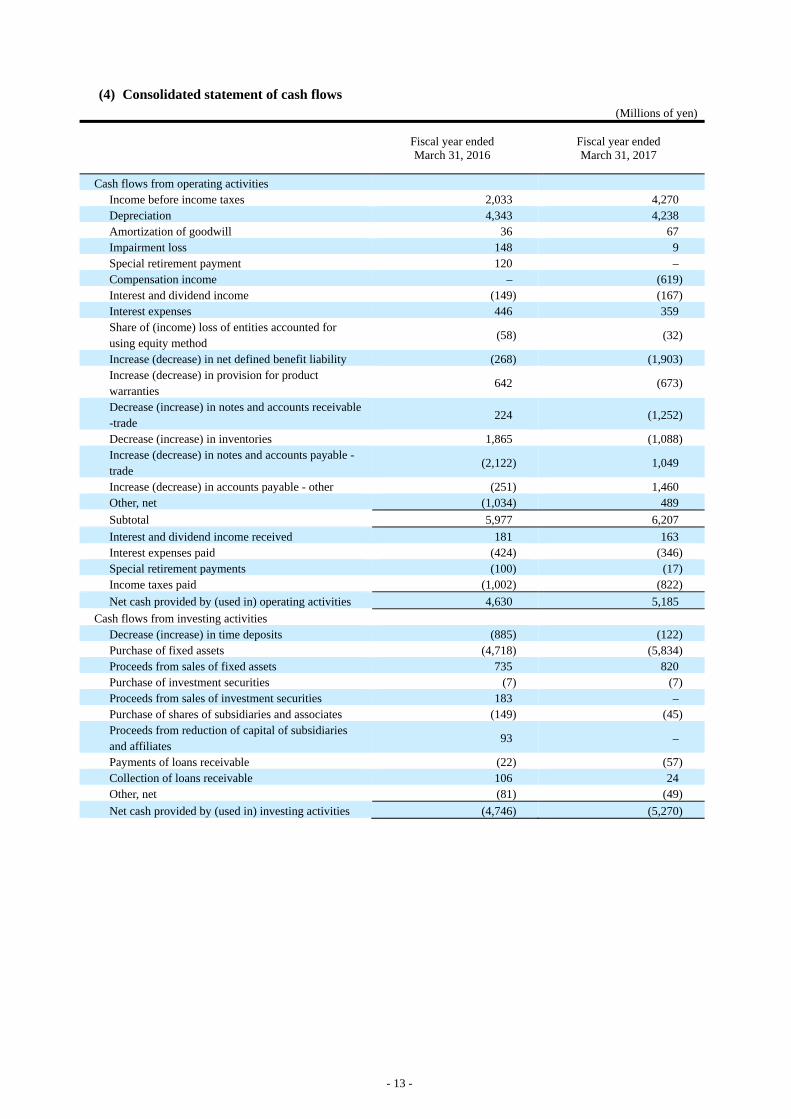
b. Cash flows Cash and cash equivalents (hereinafter, “cash”) for the fiscal year under review increased by 202 million yen from the previous fiscal year-end, to 4,945 million yen. The respective cash flow positions for the fiscal year under review are as follows: (Cash flows from operating activities) Net cash provided by operating activities in the fiscal year under review was 5,185 million yen (4,630 million yen was provided in the previous fiscal year). This mainly reflected increasing factors of 4,270 million yen in income before income taxes and of 4,238 million yen in depreciation, exceeding a decreasing factor of 1,252 million yen in an increase in notes and accounts receivable-trade and others. (Cash flows from investing activities) Net cash used in investing activities in the fiscal year under review amounted to 5,270 million yen (4,746 million yen was used in the previous fiscal year). This was mainly due to 5,834 million yen in the purchase of fixed assets. (Cash flows from in financing activities) Net cash used in financing activities in the fiscal year under review totaled 426 million yen (384 million yen was used in the previous fiscal year). This was mainly due to an increasing factor of 1,799 million yen in net increase in loans payable.

- 5 -
(3) Basic policy for distributing incomes, and dividends for the fiscal year under review and next fiscal year The Company, taking into consideration the operating results of the fiscal year and future business development, has a basic policy regarding dividends from surplus, etc. of carrying out result-based distributions in a stable manner based on a medium- to long-term perspective. Stable dividends and future business development, etc. were comprehensively examined, and as a result, a plan is in place to submit a proposal at the 95th Ordinary General Meeting of Shareholders, which is scheduled to be held on June 28, 2017, increasing the year-end dividend for the fiscal year by 2 yen from the initial forecast to a regular dividend of 7 yen per share of common shares of the Company. Regarding projected dividends for the next fiscal year (ending March 31, 2018), the Company expects, based on earnings forecasts and current forecasts of the financial position, to pay a regular interim dividend of 5 yen per share of common shares, and a regular year-end dividend of 7 yen per share, giving projected annual dividends of 12 yen per share. (Note) The forecasts for the next fiscal year contained in these materials are forward-looking statements including risks
and uncertainties. Therefore, the actual results may differ from the forecasts stated herein due to changes of various factors.

- 6 -
2. Status of the Corporate Group
The Group (the Company and its affiliates) consists of the Company (MIKUNI CORPORATION), 20 subsidiaries, and six associates. The Group is engaged in manufacturing and sales of fuel injection-related products, carburetors, heaters, pumps, gas control devices, etc., the import and sales of aircraft components, and real estate leasing and other services. Business organization chart Reportable segments are the Automobile-related Products Business, the Household Appliances Device Products Business, and the Aircraft Component Import and Sales Business. The business organization chart of the Group as of March 31, 2017 (showing the Company and its main affiliates) is shown below.
3. Basic concept regarding selection of accounting standards
The Group has prepared the consolidated financial statements in accordance with Japanese GAAP, and there is no immediate plan to change its accounting standards. Concerning the policy for the application of IFRS, the Group will respond to this issue appropriately while giving consideration to various circumstances in Japan and overseas.
(Consolidated subsidiary) Mikuni Partec Corporation (Entity accounted for using equity method) Mikuni Aim Corporation
MIKUNI CORPORATION
(the Company)
External custom
ers
Domestic
(Consolidated subsidiary) Mikuni Life & Auto Co., Ltd.
Manufacturing and sales companies (Consolidated subsidiaries) Mikuni (Thailand) Co., Ltd. Mikuni (Shanghai) Co., Ltd. Tianjin Mikuni Co., Ltd. Mikuni (Chengdu) Machinery & Electronics Co., Ltd. Mikuni (Zhejiang) Co., Ltd. Mikuni Mexicana S.A.de C.V. PT. Mikuni Indonesia Mikuni India Private Limited (Entity accounted for using equity method) Mikuni R. K. Corporation
Autom
obile-related Products B
usiness H
ousehold Appliances D
evice P
roducts Business
Overseas
Autom
obile-related P
roducts Business
External custom
ers
Manufacturing and sales company
Autom
obile-related Products B
usiness, Household A
ppliances Device P
roducts Business and A
ircraft Com
ponent Import and
Sales B
usiness
(Consolidated subsidiary) Asahi Air Supply Inc.
Aircraft C
omponent
Import and Sales B
usiness
Sales company
Other B
usinesses
Manufacturing and sales company
Autom
obile-related Products Business
Household A
ppliances Device
Products B
usiness, Aircraft C
omponent
Import and Sales B
usiness
(Consolidated subsidiaries) Mikuni American Corporation Mikuni Europe GmbH Mikuni Taiwan Corporation
Manufacturing and sales companies
Sales companies
Services company
Other B
usinesses
(Consolidated subsidiary) Corbin Properties Incorporated
Finished goods/ merchandise
Components Services

- 7 -
4. Consolidated financial statements and significant notes thereto (1) Consolidated balance sheet
(Millions of yen)
As of March 31, 2016 As of March 31, 2017
Assets Current assets
Cash and deposits 5,671 5,999 Notes and accounts receivable-trade 18,202 18,508 Electronically recorded monetary claims-operating
943 1,309
Merchandise and finished goods 7,400 6,841 Work in process 2,518 3,863 Raw materials and supplies 1,188 1,532 Deferred tax assets 1,072 818 Other 2,515 2,726 Allowance for doubtful accounts (90) (67)
Total current assets 39,423 41,531
Non-current assets Property, plant and equipment
Buildings and structures, net 10,263 10,236 Machinery, equipment and vehicles, net 9,016 10,106 Tools, furniture and fixtures, net 2,262 2,151 Land 12,050 11,888 Construction in progress 2,602 2,078
Total property, plant and equipment 36,194 36,460
Intangible assets Goodwill 239 207 Other 736 775
Total intangible assets 976 983
Investments and other assets Investment securities 5,133 6,550 Long-term loans receivable 8 16 Deferred tax assets 1,711 1,092 Other 2,342 2,752 Allowance for doubtful accounts (200) (205)
Total investments and other assets 8,996 10,205
Total non-current assets 46,167 47,650
Total assets 85,590 89,181
- 8 -
(Millions of yen)
As of March 31, 2016 As of March 31, 2017
Liabilities Current liabilities
Notes and accounts payable-trade 11,380 11,812 Short-term loans payable 15,004 13,819 Current portion of long-term loans payable 3,819 7,014 Lease obligations 455 475 Accounts payable - other and accrued expenses 3,581 4,009 Income taxes payable 167 440 Provision for bonuses 1,293 1,391 Provision for product warranties 878 204 Other 420 602
Total current liabilities 37,001 39,771
Non-current liabilities Long-term loans payable 10,777 10,430 Lease obligations 463 361 Deferred tax liabilities 881 875 Deferred tax liabilities for land revaluation 2,258 2,258 Net defined benefit liability 5,737 3,591 Provision for management board incentive plan trust
15 27
Other 503 1,806
Total non-current liabilities 20,638 19,351
Total liabilities 57,639 59,123
Net assets Shareholders’ equity
Capital stock 2,215 2,215 Capital surplus 1,700 1,937 Retained earnings 14,204 16,382 Treasury shares (186) (186)
Total shareholders’ equity 17,934 20,348
Accumulated other comprehensive income Valuation difference on available-for-sale securities
1,806 2,813
Deferred gains or losses on hedges (1) 1 Revaluation reserve for land 5,273 5,273 Foreign currency translation adjustment 2,217 1,261 Remeasurements of defined benefit plans (695) (489)
Total accumulated other comprehensive income 8,600 8,858
Non-controlling interests 1,416 850
Total net assets 27,950 30,058
Total liabilities and net assets 85,590 89,181

- 9 -
(2) Consolidated statement of income and consolidated statement of comprehensive income
Consolidated statement of income (Millions of yen)
Fiscal year ended March 31, 2016
Fiscal year ended March 31, 2017
Net sales 97,874 94,787 Cost of sales 84,051 80,590
Gross profit 13,822 14,196
Selling, general and administrative expenses 10,727 10,743
Operating income 3,094 3,453
Non-operating income Interest income 48 68 Dividend income 100 99 Rent income 119 216 Share of income of entities accounted for using equity method
58 32
Other 247 216
Total non-operating income 575 633
Non-operating expenses Interest expenses 446 359 Rent expenses 54 96 Foreign exchange losses 26 24 Other 95 136
Total non-operating expenses 623 617
Ordinary income 3,046 3,469
Extraordinary income Gain on sales of fixed assets 30 133 Gain on sales of investment securities 105 – Gain on abolishment of retirement benefit plan – 171 Compensation income – 619 Other 0 0
Total extraordinary income 135 924
Extraordinary losses Loss on sales and retirement of fixed assets 55 75 Loss on valuation of investment securities 0 27 Impairment loss 148 9 Provision for product warranties 802 – Special retirement expenses 120 – Other 21 11
Total extraordinary losses 1,148 123
Income before income taxes 2,033 4,270
Income taxes - current 841 1,050 Income taxes - deferred (239) 378
Total income taxes 602 1,428
Net income 1,431 2,841
Net income attributable to non-controlling interests 161 156
Net income attributable to owners of parent 1,269 2,685

- 10 -
Consolidated statement of comprehensive income (Millions of yen)
Fiscal year ended March 31, 2016
Fiscal year ended March 31, 2017
Net income 1,431 2,841 Other comprehensive income
Valuation difference on available-for-sale securities (758) 1,006 Deferred gains or losses on hedges (11) 2 Revaluation reserve for land 119 – Foreign currency translation adjustment (1,792) (1,071) Remeasurements of defined benefit plans, net of tax (238) 205 Share of other comprehensive income of entities accounted for using equity method
(21) (18)
Total other comprehensive income (2,702) 124
Comprehensive income (1,271) 2,966
Comprehensive income attributable to Comprehensive income attributable to owners of parent
(1,226) 2,943
Comprehensive income attributable to non-controlling interests
(44) 22
- 11 -
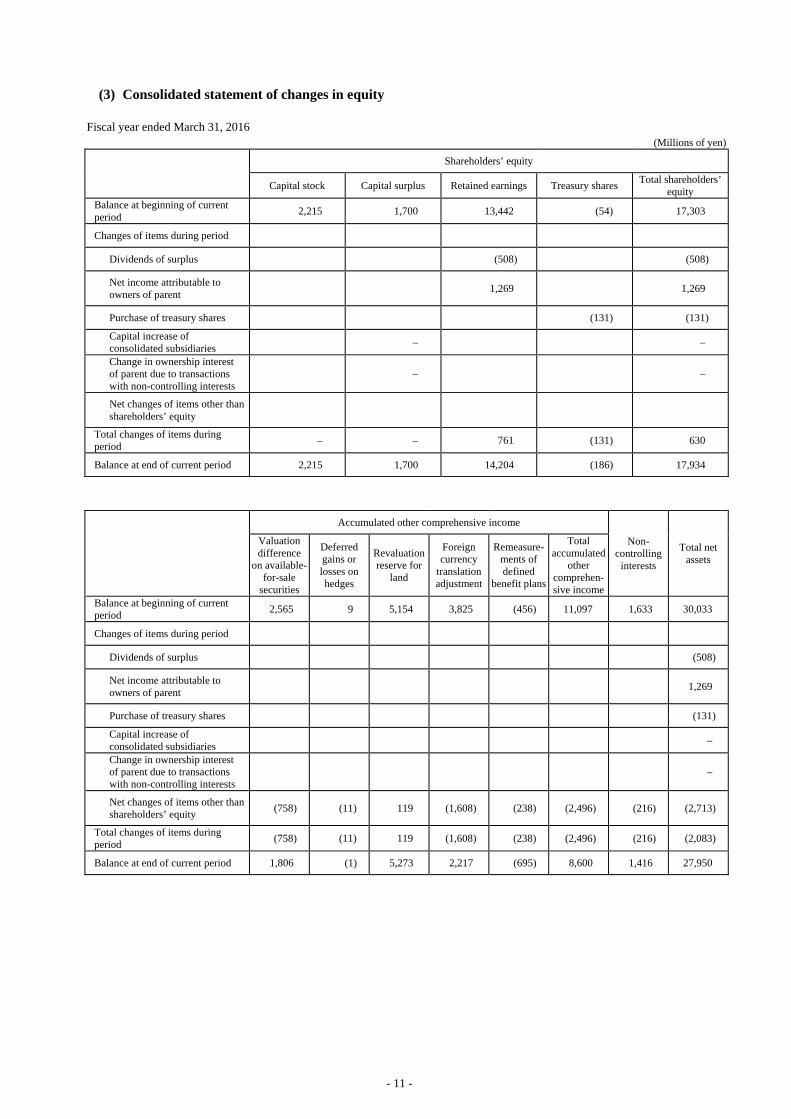
(3) Consolidated statement of changes in equity
Fiscal year ended March 31, 2016 (Millions of yen)
Shareholders’ equity
Capital stock Capital surplus Retained earnings Treasury shares Total shareholders’
equity Balance at beginning of current period
2,215 1,700 13,442 (54) 17,303
Changes of items during period
Dividends of surplus (508) (508)
Net income attributable to owners of parent
1,269 1,269
Purchase of treasury shares (131) (131)
Capital increase of consolidated subsidiaries
– –
Change in ownership interest of parent due to transactions with non-controlling interests
– –
Net changes of items other than shareholders’ equity
Total changes of items during period
– – 761 (131) 630
Balance at end of current period 2,215 1,700 14,204 (186) 17,934
Accumulated other comprehensive income
Non-controlling
interests
Total net assets
Valuation difference
on available-for-sale
securities
Deferred gains or losses on hedges
Revaluation reserve for
land
Foreign currency
translation adjustment
Remeasure-ments of defined
benefit plans
Total accumulated
other comprehen-sive income
Balance at beginning of current period
2,565 9 5,154 3,825 (456) 11,097 1,633 30,033
Changes of items during period
Dividends of surplus (508)
Net income attributable to owners of parent
1,269
Purchase of treasury shares (131)
Capital increase of consolidated subsidiaries
–
Change in ownership interest of parent due to transactions with non-controlling interests
–
Net changes of items other than shareholders’ equity
(758) (11) 119 (1,608) (238) (2,496) (216) (2,713)
Total changes of items during period
(758) (11) 119 (1,608) (238) (2,496) (216) (2,083)
Balance at end of current period 1,806 (1) 5,273 2,217 (695) 8,600 1,416 27,950

- 12 -
Fiscal year ended March 31, 2017 (Millions of yen)
Shareholders’ equity
Capital stock Capital surplus Retained earnings Treasury shares Total shareholders’
equity Balance at beginning of current period
2,215 1,700 14,204 (186) 17,934
Changes of items during period
Dividends of surplus (508) (508)
Net income attributable to owners of parent
2,685 2,685
Purchase of treasury shares (0) (0)
Capital increase of consolidated subsidiaries
(51) (51)
Change in ownership interest of parent due to transactions with non-controlling interests
289 289
Net changes of items other than shareholders’ equity
Total changes of items during period
– 237 2,177 (0) 2,414
Balance at end of current period 2,215 1,937 16,382 (186) 20,348
Accumulated other comprehensive income
Non-controlling
interests
Total net assets
Valuation difference
on available-for-sale
securities
Deferred gains or losses on hedges
Revaluation reserve for
land
Foreign currency
translation adjustment
Remeasure-ments of defined
benefit plans
Total accumulated
other comprehen-sive income
Balance at beginning of current period
1,806 (1) 5,273 2,217 (695) 8,600 1,416 27,950
Changes of items during period
Dividends of surplus (508)
Net income attributable to owners of parent
2,685
Purchase of treasury shares (0)
Capital increase of consolidated subsidiaries
(51)
Change in ownership interest of parent due to transactions with non-controlling interests
289
Net changes of items other than shareholders’ equity
1,006 2 – (956) 205 258 (565) (307)
Total changes of items during period
1,006 2 – (956) 205 258 (565) 2,107
Balance at end of current period 2,813 1 5,273 1,261 (489) 8,858 850 30,058
- 13 -
(4) Consolidated statement of cash flows (Millions of yen)
Fiscal year ended March 31, 2016
Fiscal year ended March 31, 2017
Cash flows from operating activities Income before income taxes 2,033 4,270 Depreciation 4,343 4,238 Amortization of goodwill 36 67 Impairment loss 148 9 Special retirement payment 120 – Compensation income – (619) Interest and dividend income (149) (167) Interest expenses 446 359 Share of (income) loss of entities accounted for using equity method
(58) (32)
Increase (decrease) in net defined benefit liability (268) (1,903) Increase (decrease) in provision for product warranties
642 (673)
Decrease (increase) in notes and accounts receivable -trade
224 (1,252)
Decrease (increase) in inventories 1,865 (1,088) Increase (decrease) in notes and accounts payable - trade
(2,122) 1,049
Increase (decrease) in accounts payable - other (251) 1,460 Other, net (1,034) 489
Subtotal 5,977 6,207
Interest and dividend income received 181 163 Interest expenses paid (424) (346) Special retirement payments (100) (17) Income taxes paid (1,002) (822)
Net cash provided by (used in) operating activities 4,630 5,185
Cash flows from investing activities Decrease (increase) in time deposits (885) (122) Purchase of fixed assets (4,718) (5,834) Proceeds from sales of fixed assets 735 820 Purchase of investment securities (7) (7) Proceeds from sales of investment securities 183 – Purchase of shares of subsidiaries and associates (149) (45) Proceeds from reduction of capital of subsidiaries and affiliates
93 –
Payments of loans receivable (22) (57) Collection of loans receivable 106 24 Other, net (81) (49)
Net cash provided by (used in) investing activities (4,746) (5,270)

- 14 -
(Millions of yen)
Fiscal year ended March 31, 2016
Fiscal year ended March 31, 2017
Cash flows from financing activities Increase (decrease) in short-term loans payable 940 (1,081) Proceeds from long-term loans payable 4,204 7,367 Repayments of long-term loans payable (4,284) (4,486) Payments from changes in ownership interests in subsidiaries that do not result in change in scope of consolidation
– (341)
Cash dividends paid (506) (504) Dividends paid to non-controlling interests (95) (63) Other, net (641) (463)
Net cash provided by (used in) financing activities (384) 426
Effect of exchange rate change on cash and cash equivalents
(401) (139)
Net increase (decrease) in cash and cash equivalents (902) 202
Cash and cash equivalents at beginning of period 5,646 4,743
Cash and cash equivalents at end of period 4,743 4,945

- 15 -
(5) Notes to consolidated financial statements
(Notes on premise of going concern)
Not applicable.
(Significant matters forming the basis of preparing the consolidated financial statements)
Disclosure omitted because there have been no significant changes from the items stated in the recent Annual Securities Report (filed on June 28, 2016) except for the changes described in (Changes in accounting policies).
(Changes in accounting policies)
(Application of Practical Solution on a Change in Depreciation Method Due to Tax Reform 2016) Following the revision to the Corporation Tax Act, the Company has applied the “Practical Solution on a Change in Depreciation Method Due to Tax Reform 2016” (ASBJ PITF No. 32, June 17, 2016) from the fiscal year ended March 31, 2017, and changed the depreciation method for facilities attached to buildings and structures acquired on or after April 1, 2016 from the declining-balance method to the straight-line method. As a result, the impact of this change on operating income, ordinary income and income before income taxes for the fiscal year ended March 31, 2017 is immaterial.
- 16 -
(Segment information)
[Segment information] 1. Outline of reportable segments
The reportable segments of the Group are components of the Group that have separate financial information available and are periodically examined to enable the Board of Directors to make decisions on the allocation of management resources and evaluate the results of business performance. The Company establishes comprehensive domestic and overseas strategies for each product and service, and undertakes business activities in cooperation with group companies. The Group accordingly consists of segments by product and service, with three reportable segments: Automobile Products-related Business, Household Appliances Device Products Business, and Aircraft Component Import and Sales Business. The Automobile Products-related Business mainly manufactures and sells fuel injection systems for automobiles, motorcycles, and general purpose engines and engine-related functional components. The Household Appliances Device Products Business mainly manufactures and sells control systems for gas appliances and water appliances. The Aircraft Component Import and Sales Business mainly imports and sells aircraft components.
2. Calculation method for the amounts of net sales, income/loss, assets and other items by reportable segment The accounting method for reportable segments is generally the same as the method described in “Significant matters forming the basis of preparing the consolidated financial statements.” Segment profit (loss) of reportable segments is provided on an operating income (loss) basis. (Application of Practical Solution on a Change in Depreciation Method Due to Tax Reform 2016) As described in “Changes in accounting policies”, the Company has applied the “Practical Solution on a Change in Depreciation Method Due to Tax Reform 2016” from the fiscal year ended March 31, 2017, and changed the depreciation method for facilities attached to buildings and structures acquired on or after April 1, 2016 from the declining-balance method to the straight-line method. The effect of this change on segment profit/loss for the fiscal year ended March 31, 2017 is immaterial.

- 17 -
3. Information regarding the amounts of net sales, income/loss, assets and other items by reportable segment
Fiscal year ended March 31, 2016 (April 1, 2015 to March 31, 2016) (Millions of yen)
Reportable segment Other
Businesses(Note)
Total Adjustments
Amounts reported in the consolidated
financial statements
Automobile Products-
related
Household Appliances
Device Products
Aircraft Component Import and
Sales
Total
Net sales To external customers 60,064 7,428 22,987 90,481 7,393 97,874 – 97,874Inter-segment sales or transfers
– – – – – – – –
Total 60,064 7,428 22,987 90,481 7,393 97,874 – 97,874Segment profit (loss) 2,537 287 313 3,138 (43) 3,094 – 3,094Segment assets 64,740 6,444 9,466 80,652 4,938 85,590 – 85,590Other items
Depreciation 3,857 284 61 4,204 139 4,343 – 4,343Amortization of goodwill and negative goodwill
– – 7 7 29 36 – 36
Investments in entities accounted for using equity method
206 296 – 502 – 502 – 502
Increase in property, plant and equipment and intangible assets
4,981 295 51 5,328 106 5,434 – 5,434
(Note) The “Other Businesses” category refers to a business segment not included in reportable segments including such businesses as sales of turf-maintenance equipment, etc. and manufacturing and sales of vehicle heaters and welfare and care devices, etc.
Fiscal year ended March 31, 2017 (April 1, 2016 to March 31, 2017) (Millions of yen)
Reportable segment Other
Businesses(Note)
Total Adjustments
Amounts reported in the consolidated
financial statements
Automobile Products-
related
Household Appliances
Device Products
Aircraft Component Import and
Sales
Total
Net sales To external customers 59,011 7,213 21,272 87,497 7,290 94,787 – 94,787Inter-segment sales or transfers
– – – – – – – –
Total 59,011 7,213 21,272 87,497 7,290 94,787 – 94,787Segment profit (loss) 2,462 412 282 3,157 295 3,453 – 3,453Segment assets 67,403 6,376 10,077 83,857 5,324 89,181 – 89,181Other items
Depreciation 3,842 230 63 4,137 101 4,238 – 4,238Amortization of goodwill and negative goodwill
– – 39 39 27 67 – 67
Investments in entities accounted for using equity method
216 280 – 496 – 496 – 496
Increase in property, plant and equipment and intangible assets
5,367 374 27 5,768 103 5,872 – 5,872
(Note) The “Other Businesses” category refers to a business segment not included in reportable segments including such businesses as sales of turf-maintenance equipment, etc. and manufacturing and sales of vehicle heaters and welfare and care devices, etc.

- 18 -
(Per share information)
Item Fiscal year ended March 31, 2016
(from April 1, 2015 to March 31, 2016)
Fiscal year ended March 31, 2017(from April 1, 2016 to March 31, 2017)
Net assets per share 789.18 yen 868.69 yen
Basic earnings per share 37.67 yen 79.87 yen
(Notes) 1. Diluted earnings per share is not presented since no potential shares exist. 2. The shares of the Company owned by the trust account of the “Management Board Incentive Plan (BIP) Trust”
have been excluded from the average number of shares during the period and the number of shares at the end of the period, both of which are the basis of the calculation of per share information.
Number of treasury shares at end of period deducted in calculating net assets per share Fiscal year ended March 31, 2016 244,500 shares Fiscal year ended March 31, 2017 244,500 shares
Average number of treasury shares during period deducted in calculating the basic earnings per share Fiscal year ended March 31, 2016 150,462 shares Fiscal year ended March 31, 2017 244,500 shares
3. The basis of the calculation of basic earnings per share is as follows:
Item Fiscal year ended March 31, 2016
(from April 1, 2015 to March 31, 2016)
Fiscal year ended March 31, 2017(from April 1, 2016 to March 31, 2017)
Net income attributable to owners of parent (million yen)
1,269 2,685
Amounts not attributable to common shareholders (million yen)
– –
Net income attributable to owners of parent available to common shares (million yen)
1,269 2,685
Average number of shares during the period (shares)
33,717,372 33,622,381
(Significant subsequent events)
Not applicable.
5. Others
(1) Changes in Directors and Audit & Supervisory Board members (i) Change in representative
Not applicable.
(ii) Other changes With regards to the changes in Directors and Audit & Supervisory Board members, please refer to the “Notice concerning the Appointment of Directors and Audit & Supervisory Board Members, etc.” released on March 31, 2017 in Japanese only.