summary of bog reports for mae department graduate programs april 13, 2012 mae dept. spring visiting...
TRANSCRIPT
Summary of BOG Reports forMAE Department Graduate
Programs
April 13, 2012
MAE Dept. Spring Visiting Committee Meeting
John Kuhlman
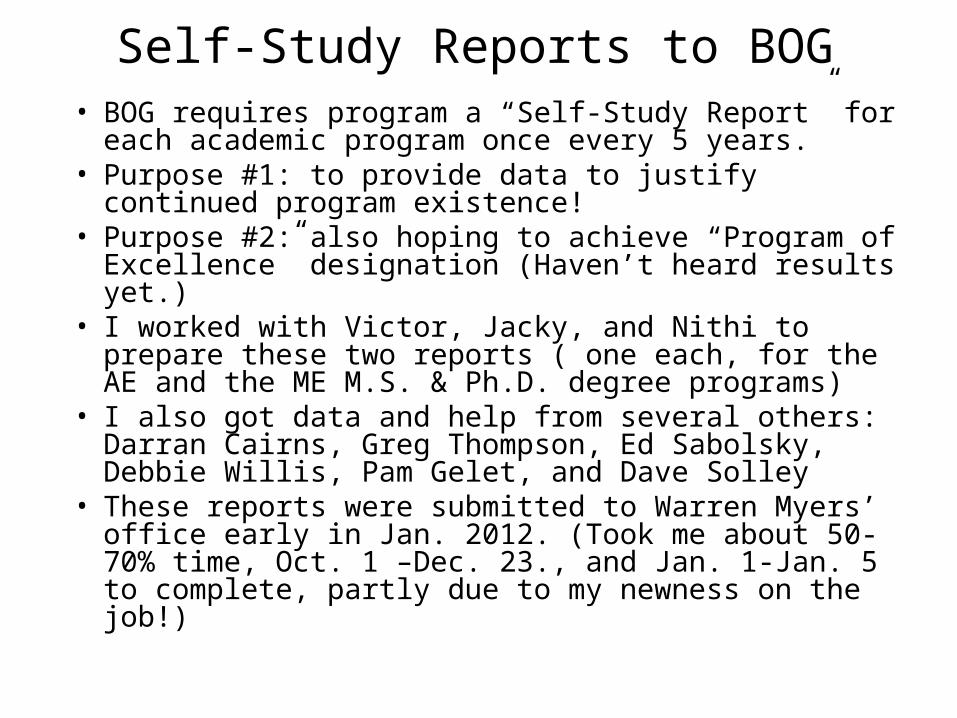
Self-Study Reports to BOG• BOG requires program a “Self-Study Report” for
each academic program once every 5 years.• Purpose #1: to provide data to justify continued
program existence! • Purpose #2: also hoping to achieve “Program of
Excellence” designation (Haven’t heard results yet.)• I worked with Victor, Jacky, and Nithi to prepare
these two reports ( one each, for the AE and the ME M.S. & Ph.D. degree programs)
• I also got data and help from several others: Darran Cairns, Greg Thompson, Ed Sabolsky, Debbie Willis, Pam Gelet, and Dave Solley
• These reports were submitted to Warren Myers’ office early in Jan. 2012. (Took me about 50-70% time, Oct. 1 –Dec. 23., and Jan. 1-Jan. 5 to complete, partly due to my newness on the job!)

Summary of BOG Self-Study Report Data
Fiscal Year: 2006-2007 2007-2008 2008-2009 2009-2010 2010-2011State Salary $2,284,519 $2,671,799 $2,711,367 $3,062,797 $3,284,677State GTA $100,445 $99,507 $106,446 $135,927 $121,721State Current $54,415 $56,892 $86,134 $40,841 $53,887Summer School Earned $73,765 $98,997 $127,329 $174,992Student Fees $220,848 $231,986 $252,733 $268,539 $276,958Not Endowed Gifts Research Expenditures $10,032,752 $9,945,664 $10,856,842 $11,215,652 $11,587,768
Overhead Return $363,129 $340,836 $373,860 $403,454 $469,662
Total $13,056,108 $13,420,450 $14,486,379 $15,254,539 $15,969,666
Budget Summaries of the MAE Department in the Last Five Years
Table 4 - Annual Revenues Enabled by the MSME & Ph.D./ME Programs (2010-2011 FY)Tuition $96,349Summer Teaching Revenue $15,972Student Fees $176,777Endowed Gifts $6,759Research $8,176,266Overhead Return $564,120Total: $9,036,242
Table 4 - Annual Revenues Enabled by the MSAE & Ph.D./AE Programs (2010-2011) Tuition $4,181 Summer Teaching Revenue $4,852 Student Fees $41,833 Endowed Gifts $1,643 Research $3,411,502 Overhead Return $223,837 Total: $3,687,848

Summary of BOG Self-Study Report Data
Fiscal Year: 2005-2006 2006-2007 2007-2008 2008-2009 2009-2010 5-Year Avg:
No. of Faculty 28 28 27 27 29 28
Research Awards $10,676,884 $9,013,481 $9,474,329 $11,879,531 $12,769,000 $10,762,645
Research Expenditures
$9,313,003 $10,032,752 $9,945,664 $10,856,842 $11,215,652 $10,272,783
Journal Papers 38 55 53 50 65 52
(Jan-Dec)
Undergrad Enrollment
401 417 415 419 437 418
MS Enrollment 89 73 68 80 87 79
Ph.D. Enrollment 55 66 73 80 75 70
Undergraduate Degrees
127 126 162 130 152 139
MS Degrees 31 43 22 25 18 28
Ph.D. Degrees 11 12 7 12 11 11
Undergrad Student Cr. Hrs.
10,036 9,900 10,140 11,358 11,861 10,659
Graduate Student Cr. Hrs.
2,827 2,315 3,228 3,432 2,952 2,951
Undergrad Course Cr. Hrs.
277 236 280 257 273 265
Graduate Course Cr. Hrs.
45 48 45 60 63 52
Summary of MAE Department Performance During the Current Review Period

Summary of BOG Self-Study Report DataComparisons Between Current Review Period and Most Recent Previous Review Period
5-Year Average:
Total Space 85,571 sq ft up 7% wrt prev 5 yrs; labs up 24%
No. of Faculty 28 avg. up 11% wrt prev 5 yrs
Research Awards $10,762,645 avg. up 23% wrt prev 5 yrs
Research Expenditures $10,272,783 avg. up 26% wrt prev 5 yrs
Journal Papers 52 avg. up 35% wrt prev 5 yrs
Undergrad Enrollment 418 avg. up 20% wrt prev 5 yrs
Ph.D. Enrollment 70 avg. up 41% wrt prev 5 yrs
Undergraduate Degrees 139 avg. up 22% wrt prev 5 yrs
MS Degrees 28 down 22% wrt prev 5 yrs
Ph.D. Degrees 10.6 avg. up 56% wrt prev 5 yrs
Undergrad Student Cr. Hrs. 10,659 avg. up 22% wrt prev 5 yrs
Graduate Student Cr. Hrs. 2,951 avg. up 11% wrt prev 5 yrs
Undergrad Course Cr. Hrs. 265 avg. up 19% wrt prev 5 yrs
Graduate Course Cr. Hrs. 52.2 avg. up 7% wrt prev 5 yrs
not incl. $15M this yr
conf. papers up 50%
36% of CEMR total
28% of CEMR total

Summary of BOG Self-Study Report DataComparisons Between MAE Dept Productivity & Other Ranked ME or MAE Departments
Ranking Of:
School: Engineering School/College Aerospace Grad Program Mechanical Grad Program
WVU 102 51 83
UCLA 11 11 16
Boston Univ. 39 43 51
Michigan Tech 85 (N/A) 48
For 2009-2010 Year:
School: Graduate Enrollment:
Ph.D. Graduates:
M.S. Graduates:
Journal Publications:
Research Expenditures:
WVU 164 11 (3 AE) 18 65 $11,215,652
UCLA 271 22 (4 AE) 81 ( 8 thesis) 102 $14,500,000
Boston Univ. 148 5 27 ( 7 thesis) 95 (N/A)
Michigan Tech 229 9 43 (N/A) $13,500,000
Faculty Size = 44 or 45 for UCLA, Boston U., and Michigan Tech.So, MAE published 2.2 journal papers/TT faculty, & had $373K expenditures/TT faculty UCLA published 2.3 journal papers/TT faculty, & had $325K expenditures/TT faculty Boston U. published 2.1 journal papers/TT faculty, and Michigan Tech. had $303K expenditures/TT facultyAlso, MAE had more PhD graduates than Boston U. & Michigan Tech., and compares reasonably well with UCLA on a per capita basis (0.4 PhD/yr/TT faculty for WVU vs. 0.5 PhD/yr/TT faculty for UCLA)
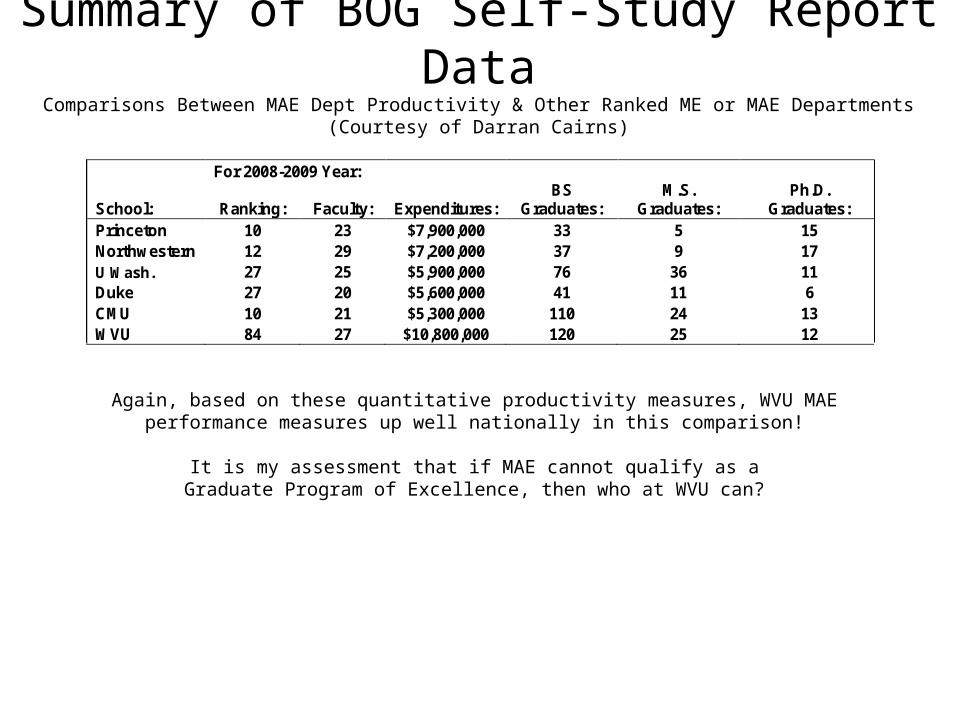
Summary of BOG Self-Study Report DataComparisons Between MAE Dept Productivity & Other Ranked ME or MAE Departments
(Courtesy of Darran Cairns)
For 2008-2009 Year:
School: Ranking: Faculty: Expenditures: BS
Graduates: M.S.
Graduates: Ph.D.
Graduates: Princeton 10 23 $7,900,000 33 5 15 Northwestern 12 29 $7,200,000 37 9 17 U Wash. 27 25 $5,900,000 76 36 11 Duke 27 20 $5,600,000 41 11 6 CMU 10 21 $5,300,000 110 24 13 WVU 84 27 $10,800,000 120 25 12
Again, based on these quantitative productivity measures, WVU MAEperformance measures up well nationally in this comparison!
It is my assessment that if MAE cannot qualify as aGraduate Program of Excellence, then who at WVU can?

Summary of Tours of National Institute of Aerospace (Hampton, VA) & Old Dominion University (Norfolk,
VA) Distance Learning Programs
April 13, 2012
MAE Dept. Spring Visiting Committee Meeting
John Kuhlman

• Why Distance Learning (DL)? (As a possible replacement for projected lost research revenues)
• Victor Mucino & I met once during fall 2011 semester with Dr. Sue Day-Perroots, WVU Dean of Extended Learning, to “get started”.
• Her office has offered to make ½-1 hour presentation to MAE Faculty about WVU DL programs.
• We hoped to do this in 2012, but it didn’t happen this semester.
• I also met with Dr. Andy Casiello, Assoc. VP of Distance Learning at ODU, in Norfolk, VA on December 16, 2011, and with Dr. Bernie Grossman, at the National Institute of Aerospace, in Hampton, VA on December 15, 2011.
Explore Opportunities forDistance Learning

Course-Only M.S. Degree Option
• This would be another possibility for additional revenues.
• Deliver courses at WVU Potomac State (e.g., ABL & Luke, MD Paper Mill) or at Fairmont-Bridgeport area?
• Consider whether to have:a.) Coursework onlyb.) Coursework plus comprehensive examc.) Coursework plus problem report
• Identify other opportunities (Fairmont, Clarksburg?)• Our hope would be to have increased degree
flexibility, as well as additional revenue

Overview of Visits to NIA and ODUDL Facilities
Selected photos of the ODU facilities:
Older-format DL classroom: students in rows DL classroom: moving to conference room format First ODU DL classroom in conference room format
DL classroom: current “best practice” DL video broadcast facilities: for inside bldg. ODU TV Facility
Have 10-12 similar classrooms; Moving to add’l smaller rooms (like conference rooms); NIA has similar facilities.

• I learned some details about current trends in Distance Learning.• NIA is a consortium of 6-8 universities, that does more than DL: has
secure facilities for on-site research (secret/ITAR), does workshops & conferences, PR and STEM education video clips, research staff on site, all for NASA LaRC. They focus on providing DL for graduate students of member universities who are doing their research on-site at NASA LaRC.
• ODU has been providing DL coursework since mid-1980s (began in engrng), and provide DL to deployed Navy personnel, as well as 2+2 BA/BS degree-completion DL to all state of VA community colleges. Have a $10M/yr budget. Provide faculty mentoring on implementing DL in their courses, as well as help in making posters for research meetings, graphics, etc!
• I prepared a brief report for Jacky, that I would be happy to send to anyone interested.
• They recommend we start “small” w faculty-driven pilot course.
Overview: Visits to NIA/ODU DL Facilities

Overview: Recruiting Efforts• This semester Ryan Sigler began College-wide graduate
recruitment efforts:• General Graduate Program brochure• Trip to Rose-Hulman Inst. Technology career fair this
semester (Dave Solley attended)• I prepared a list of the 71 colleges and universities in the US with
MS-only graduate programs. This has been provided to Ryan Sigler, and offered to graduate program coordinators in other Depts. (15 universities w/in 6 hrs of WVU; 24 w/in 7 hrs.)
• Dinner “Graduate Program Information Session” dinner meeting held this semester for our own students.
• Hope to organize graduate student posters display to coincide with similar dinner meeting in Fall 2012 semester. (Invite students from nearby programs from list above.)
• Also plan to continue to coordinate with Ryan Sigler’s efforts.