summary and presentation - norske skog company, the products and the future. ... power of attorney...
TRANSCRIPT

SUMMARY AND PRESENTATION
ANNUAL REPORT 2014 I NORSKE SKOG 15
CORPORATE SOCIAL RESPONSIB IL ITY
We are a progressive and viable group with belief in the company, the products and the future.
OUR CORE VALUESOur core values of openness, honesty and cooperation as well as our policies and guidelines build on the UN Universal Declaration of Human Rights and the 10 principles of UN Global Compact. Our values openness, honesty and cooperation guide our business activities and sustainability work across regions and are, together with our leadership principles, the fundament to ensure ethical and competitive business conduct within and on behalf of Norske Skog.
OUR BUSINESS GOALS AND RESPONSIBILITYThe Group’s aim is to maximize shareholders’ value through operations within the publication paper industry and other related industrial investments. Our attitude and ability to be entrepreneurial, empower each other and behave consistently, define our results in changing and challenging markets. Through reliable, responsible and sustainable conduct, we will win the trust and confidence of our stakeholders, both within and outside of Norske Skog. We monitor activities in order to achieve sustainable products and processes throughout the entire value chain. We continuously strive to maintain our status as the most attractive industry partner for suppliers and customers.
Our group has been a pioneer in setting a global standard for social responsibility and worker-management relations. We were the first international paper manufacturer to sign an agreement with the International Federation of Chemical, Energy, Mine and General Workers’ Unions (ICEM) and the Norwegian United Federation of Trade Unions concerning employee rights on a global basis. We were also an early adopter of the 10 principles in the UN Global Compact. Through our development programme for managers and employees, the whole organisation is being familiarised with the values, ethical standards and good business conduct on which we build our business.
To meet the future sustainability expectations, we conduct our business mandates and activities according to internally developed Steering Documents, Power of Attorney structure and Operating Model. These provide the basic framework for our mandates and activities. The Steering Documents describe in general how Norske Skog employees are expected to carry out activities and operations. The Power of Attorney structure, as set out by the Board of Directors to the CEO and further delegated through the organisation, describes financial empowerment to individual positions. The Operating Model establishes the functional roles, responsibilities and dependencies for organisational bodies and top management positions in Norske Skog.
Norske Skog’s business units have a high degree of independence and accountability. Local managers are responsible and accountable for decisions and results within their unit. However, we apply a uniform basis for our operations across countries and cultures with regard to HESQ (health, environment, safety and quality), people development, financial reporting and legal compliance. In these areas, our conduct must be based on the same sustainable principles to promote the shared interests of Norske Skog and our stakeholders.
BUSINESS CHALLENGESNorske Skog still faces some major challenges that must be resolved: declining demand and handling of the significant debt maturities. The fall in demand in recent years is due to both to changes in macroeconomic conditions (so-called cyclical reasons) and structural changes in the industry, such as changing reading habits and the phasing out of soft demand or free distribution of newspapers.
The fall in demand has led to major capacity cuts in the industry and in Norske Skog. However, the large gap between demand and supply of paper has decreased, due to substantial capacity reductions. Increased capacity utilisation at our plants both improves profitability and increases the opportunities for price increases for our products.
DOING THE RIGHT THING – THE RIGHT WAY
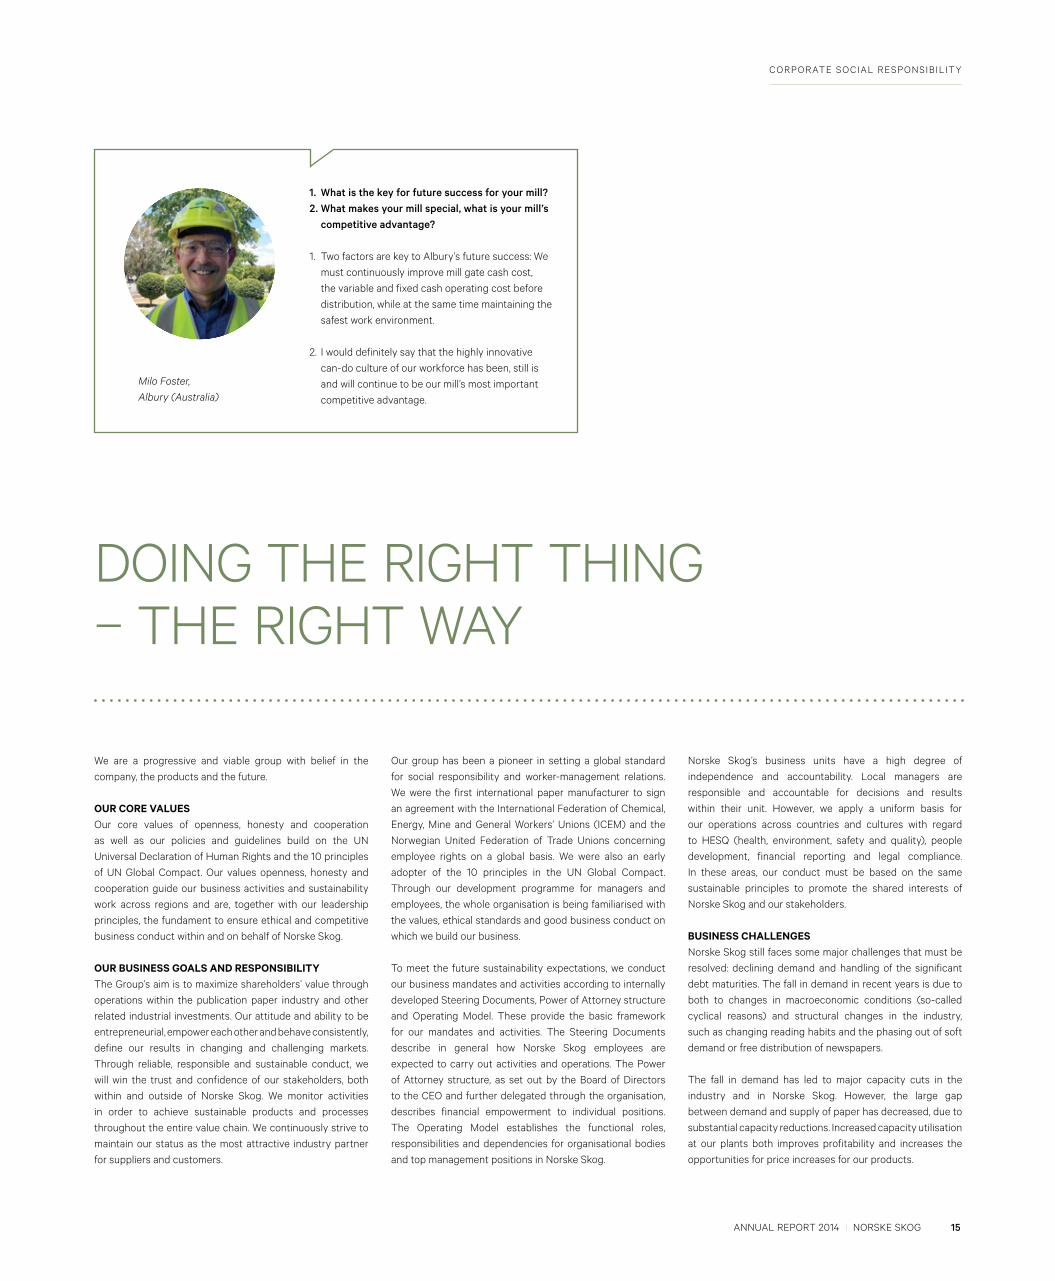
1. What is the key for future success for your mill?2. What makes your mill special, what is your mill’s
competitive advantage?
1. Two factors are key to Albury’s future success: We must continuously improve mill gate cash cost, the variable and fixed cash operating cost before distribution, while at the same time maintaining the safest work environment.
2. I would definitely say that the highly innovative can-do culture of our workforce has been, still is and will continue to be our mill’s most important competitive advantage.
Milo Foster,Albury (Australia)

16 ANNUAL REPORT 2014 I NORSKE SKOG
SUMMARY AND PRESENTATION
SUSTAINABLE FUTURENorske Skog is committed to contributing to sustainable development. Customers, suppliers and the world at large can rely on us. We have a serious intention to produce and deliver products in a sustainable manner in collaboration with customers, suppliers and local communities.
Our business units are often cornerstones of local communities. These facilities work closely at the local level with communities to assist with other needs. Social responsibility involves remaining sensitive to the needs of local communities and aware of the impact our operations have upon them. It means maintaining an open dialogue and responding with local measures. It also means showing respect for, and building upon, local cultures and traditions.
STAKEHOLDER AND MATERIALITY ANALYSISNorske Skog will report in line with the new GRI G4 sustainability reporting guidelines. To do so, a stakeholder and materiality analysis was carried out considering the vital terms of the company’s sustainability work. Corporate management and key personnel have discussed, evaluated and concluded on the effects the measured GRI G4 sustainability reporting guidelines will have on key operating performance and strategy development. The purpose of the assessment was to obtain a basis for comparison with the company’s own assessments and thus, for prioritisations in this report and continued work on sustainability.
The stakeholders affect Norske Skog’s decisions, activities and performance in many ways. In the stakeholder analysis part we have assessed to what extent different stakeholder groups are affected by our activities and/or to what extent they are affecting our sustainability work and performance. Our assessments build on our day-to-day interactions with key stakeholders as well as conducting interviews and reviewing homepages for selected stakeholders. In our opinion, our most important stakeholders are our own management and employees, local communities where we operate, investors and owners, creditors and lenders, our key suppliers, and regulatory authorities.
In the materiality analysis all 46 aspects of the GRI G4 guidelines were assessed on how important they are for Norske Skog and how important they are for our key stakeholders. The aspects cover the three main categories
Economic, Environmental and Social. The Social category in turn covers the sub-categories Labour Practices and Decent Work, Human rights, Society, and Product Responsibility. The materiality analysis highlights areas of opportunity and risk that will be a fundamental to the group’s strategy and integrated in daily operational activities.
The three main categories Economic, Environmental and Social represent vital but differentiated impacts on the group. The economic category reflects the fundamental ramifications and market conditions that encompass the underlying business case for Norske Skog’s operations. The environmental issues have been a concern to a great number of stakeholders since the start-up of Norske Skog in 1962. The aspects of the environmental category have undergone a substantial quality improvement and the group has achieved significant results in collaboration with stakeholders, governmental authorities and employee initiatives.
The outcome of the materiality analysis is shown in the picture on the next page. It shows that economic performance, raw materials, energy, water, effluent and waste, anti-corruption, occupational health and safety, product and service labelling have the most vital impact for the firm and our stakeholders. Further, the aspects biodiversity, indigenous rights, freedom of association and collective bargaining, forced and compulsory labour have high impact to the stakeholders. For Norske Skog, both emissions and anti-competitive behavior will have serious impact on daily and long-term business performance, whereas aspects such as market presence, employment, security practices, marketing communications, customer privacy and compliance have the least impact for both stakeholders and the firm. The impact on the firm and the stakeholders has some geographic differences described in the respective chapter in the CSR-report. Some of our mills are located in the vicinity of protected areas and/or along fresh water rivers or nearby salt-water recipients. Norske Skog has through the year been nationally recognized for its labour practices and decent work environment, and the outstanding health and safety performance compared to the industry average. The commercial organization in Norske Skog regularly performs customer surveys. The most important customers are followed up closely for each delivery.
The picture on the next page depicts the impact to both the stakeholders and the firm in a scale from low to high impact. Green area indicates the lowest level of reporting necessity, whereas the red area depicts the necessity to increase reporting and description of the issues in concern.
The corporate management will review the materiality analysis annually in connection with risk assessment and strategy work.
COMPLIANCEThe risk of non-compliance may entail unethical conduct and legal and financial consequences, and may affect our reputation negatively. Norske Skog emphasizes that the line organisation has the responsibility to comply with the Steering Documents. Compliance must take place where the risk lies, primarily in the production and commercial operations and their associated activities.
Norske Skog has common standards of conduct for all business units and all employees. This strengthens the quality of our operations and promotes our predictability and credibility with customers, suppliers and other partners. In this manner, the compliance work strengthens the company’s commercial position. Compliance is included a specific topic in the Group’s risk reporting, and is followed up centrally in order to ensure systematic follow-up locally.
The company has established a system where a compliance officer for the Group ensures that that the Steering Documents are up to date and ensures that adequate internal control systems exist globally and locally. Norske Skog has for a number of years maintained a whistle-blowing channel, where employees can report irregular conditions or matters he/she finds difficult to confront with superiors.
Norske Skog considers it important that each employee is ensured confidential and serious treatment of reported issues. Whistle blowing can be reported to:
1. What is the key for future success for your mill?2. What makes your mill special, what is your mill’s competitive
advantage?
1. We need to be among the most cost efficient SC producers, while maintaining consistent quality and developing new SC products to increase profitability.
2. Saugbrugs has a leading position when it comes to SC products with low grammage, or paper density. We have attractive wood prices and energy-efficient processes, especially in fibre processing. We also have high competence in fibre processing and SC production.Kjell-Arve Kure,
Saugbrugs (Norway)

ANNUAL REPORT 2014 I NORSKE SKOG 17
LOW IMPACT ON COMPANY HIGH
123
4
5 67
8 1012 13
17
19 20
24
2526
27
2830
31
33
3235 3436
37
18 2123
29
9 1114
151622
38394041
4243 44 45
46
LOW
IM
PAC
T O
N S
TA
KEH
OLD
ERS
H
IGH
1. Economic Performance
2. Materials
3. Water
4. Effluents and Waste
5. Occupational Health and Safety
6. Anti-corruption
7. Product and Service Labeling
8. Energy
9. Biodiversity
10. Emissions
11. Indigenous Rights
12. Compliance (environment)
13. Supplier Assessment for Labor Practices
14. Freedom of Association and Collective Bargaining
15. Child Labor
16. Forced or Compulsory Labor
17. Anti-competitive Behavior
18. Diversity and Equal Opportunity
19. Supplier Human Rights Assessment
20. Compliance (local communities)
21. Supplier Assessment for Impacts on Society
22. Procurement Practices
23. Products and Services (environment)
24. Indirect Economic Impacts
25. Non-discrimination
26. Local Communities
27. Supplier Environmental Assessment
28. Environmental Grievance Mechanisms
29. Human Rights Grievance Mechanisms
30. Customer Health and Safety
31. Equal Remuneration for Women and Men
32. Labor Practices Grievance Mechanisms
33. Public Policy
34. Grievance Mechanisms for Impacts on Society
35. Transport
36. Assessment (human rights)
37. Market Presence
38. Overall (environmental investments and costs)
39. Employment
40. Labor/Management Relations
41. Training and Education
42. Investment (human rights)
43. Security Practices
44. Marketing Communications
45. Customer Privacy
46. Compliance

18 ANNUAL REPORT 2014 I NORSKE SKOG
CORPORATE SOCIAL RESPONSIB IL ITY
HEALTH AND SAFETYHealth and Safety has the highest priority for Norske Skog, twenty four hours a day, seven days a week. Norske Skog’s health and safety programme at the business units, called “Take Care 24 hours”, is adapted to our different cultures, requirements and local requirements where we operate, but shall always meet the requirements of our health and safety standards for international activities. Our goal is a safe working environment where health and safety receive equal attention in planning and in the daily operations of the company.
All employees in Norske Skog must take responsibility for improving the working environment for themselves, their colleagues, visitors and sub-contractors. Internal cooperation, involving sharing of experience and best practice, enables us to adapt preventive activities to all our Business Units. Through the activities in Take Care 24 hours, the group stimulates and encourages the same attitudes and behaviour at work and during our spare time, for our own employees and their families. At Norske Skog, we believe that issues relating to health, safety and the environment must be fully integrated into all our activities at every level and not managed as a separate and distinct function. That is why everyone working in Norske Skog – whether an employee or contractor – is accountable for the company’s health, environmental and safety performance.
The Process for Safety Excellence (PSE) is an ongoing, structured process integrated into the day-to-day business of the company. Its aim is to achieve the highest level of health, safety and environmental performance. It applies to every organisation within Norske Skog and every activity carried out by its employees and contractors. PSE focuses on three management components, people, assets and systems. Each component includes ten elements (standards), which provide the framework for health, safety and loss prevention efforts.
Our identified nine key elements (standards) are:• Leadership commitment• Employee participation and safe behavior• Training and competence• Hazard and risk management• Management systems, reviews, audits, inspections• Performance measurement and reporting• Emergency prep. and response• Health• Contractors• PPE, Personal Protective Equipment
These Standards are applicable to all operations, throughout Norske Skog, which have the potential to adversely affect the health and safety of people, including employees, contractors, visitors and the public.
The objectives of these Standards are as follows:• To define the minimum requirements for the Health and
Safety Systems at all levels of operation,• To provide a framework for Health and Safety Systems
measurement,• To encourage a consistent approach to Health and Safety
Systems,• To assist with the identification and sharing of current best
practice between Mills/Units,
• To provide the Mills/Units the opportunity to assess themselves against the Standards and continually improve their systems,
• To enable inter-Mill/Unit reviews to provide an external perspective and recommendations for improvement.
Where Norske Skog has no operational responsibility, but has an equity stake, or where significant Norske Skog assets are involved in a subcontracting site, arrangements shall be made to ensure that comparable standards of safety are maintained. We strongly believe in Behavioral Based Safety Observations and Audits. These are observations of people’s workplace behaviour that enables positive feedback for safe behavior, recognition and correction of unsafe acts.
Norske Skog had an absence rate due to sickness of 3.8 per cent in 2014, an increase compared to last year. We achieved an H1 level, lost time injuries per million working hours, of 0.97 compared with 1.0 in 2013.
Our Norwegian business units have signed a letter of intent regarding a more inclusive workplace (IA Agreement) (with supplementary agreements). Although the IA Agreement is a distinctly Norwegian concept, it is fair to say that our other Business Units operate under similar conditions with the aim of reducing sickness absence rates and increasing focus on job attendance for all employees. The IA Agreement builds on a tripartite cooperation between the national authorities, the trade unions and the company. This cooperation ensures the participation of all parties involved.
The IA Agreement and Norske Skog’s operational objective is to develop targets for our work to prevent sickness and absence and to establish verifiable activity targets to achieve
a professional attitude to both preventive and reactive health care in the company.
The IA Agreement has been renewed until 2018 and continues the operational objectives for the cooperation:• Reduction of sick leave• Lower employee dropout rates and increase employment
of people with functional impairments• Increase the retirement age
Our work with the IA Agreement has been extended to apply to all of Norske Skog’s local business units and is intended to be an integral part of our targeted HSE work.
All our business units also have local HSE forums where the company and trade unions have regular meetings to address local HSE issues. At these meetings, there should be an equal number of representatives from the company and the employees, with as many different groups as possible from within the organisation represented. If the organisation has Occupational Health Services, it should also be represented on the committee. Occupational Health Services should be an advisory and independent body, and represent the interests of both the employer and the employees.
Norske Skog has used Synergi Life for many years. Synergi Life is an operational risk management tool from DNV GL. We have a monthly Management Focus Report (MFR), which is distributed to all business units for internal distribution and includes type of injury and rates of injury, occupational disease rate, lost work days accidents, absenteeism, total number of work-related personal injuries and fatalities, by region, gender and business unit.
GOVERNINGDOCUMENTS
APPLICATIONS FOR COMPLIANCE
REPORTING SYSTEMS
REVISIONS
DOCUMENT STRUCTURE NORSKE SKOG
HEALTHSAFETY
SECURITYPEOPLE
BUSINESSPRACTICES
ENVIRONMENT
FINANCIALMANGAMENT
ANDREPORTING
OTHERSTANDARDS
CORPORATE
PROCEDURES AND BEST PRACTICES, ETC
APPROVED BYTHE BOARD
COMMON ANDBINDINGTHROUGHOUTNORSKE SKOG
BINDING THROUGHOUT NORSKE SKOG BUT LOCAL ADJUSTMENTS OCCUR
ANNUAL REPORT 2014 I NORSKE SKOG 19
CORPORATE SOCIAL RESPONSIB IL ITY
NORSKE SKOG AND LOCAL COMMUNITIESOur activities affect employees, suppliers, customers and partners in many countries, regions, towns and villages. Our decisions and activities, production and sales have an impact on a multitude of individuals, groups and companies, both financially and otherwise. We recognize our impact and consider this when making decisions.
Sales revenue from production in Norske Skog in 2014 traced back to key stakeholders:• Purchase of goods and services: NOK 9.4 billion• Capital expenditures: NOK 0.3 billion• Salaries: NOK 1.6 billion• Taxes and public fees: NOK 0.4 billion• Financial costs and working capital: NOK 0.3 billion
The list shows that Norske Skog is important for many parts of society. Down-stream the value chain, our paper is a vital source of income for newspapers and magazines, with all their journalists and other contributors, and a natural source of ideas for business people and other readers throughout the world. This network of businesses, communities and individuals generates significant value in the public and private sectors, as well as stability and other benefits to all affected individuals. To improve and maintain our role in
society and as an important employer in local communities, our business units are encouraged to be active and open in their communication and contact with local stakeholders. Examples include reports to neighbors and other local stakeholders, open days for the public to inform about paper production, engagement in nature protection projects, support to local museums, involvement in sports and cultural initiatives, support to charitable organizations, as well as integration of immigrants and disabled persons through vocational training. We encourage employees to take part in local community work as many of them do. Most business units cooperate with educational institutions at different levels, such as visits from schools, colleges, high schools and universities, scholarships for students, trainees and apprentices working at our mills or engaged in project work.
All business units report this information in Synergi, which is also a source for the transfer of experience and sharing of best practices. Reports from Synergi are analysed and form the basis for our internal HSE audits conducted by our HSE&Q staff at the group level.
EMPLOYEESAs of December 31, 2014, Norske Skog employed 2 976 people in Europe and Australasia. This is a reduction of approximately 300 employees from one year ago, mainly due to the closure of one paper machine in Germany. The turnover of people, including retirement, was ten percent. Our employment levels are not subject to seasonal variations and the share of temporary employments is less than two percent of the total.
Female share of total workforce 10 %Females in management positions 10 %Females in top management positions 13 %
Norske Skog fully complies with all laws regulating collective bargaining and recognises freedom of association. In 2014, unions represented 85 percent of our employees for collective bargaining purposes. Our commitment to respecting the
freedom of association is embodied in the Global Framework Agreement on the Development of Good Working Relations, concluded by Norske Skog and the IndustriALL Global Union. Further, Norske Skog respects fundamental human rights and subscribes to the United Nations Global Compact principles. There has been no reported incidents of child labour, forced or compulsory labour during the reporting period. Nor has there been any reported incidents of discrimination in respect of employment or occupation. The risk of such incidents in the supply chain is considered low, and Norske Skog has no information about any violation by our suppliers.
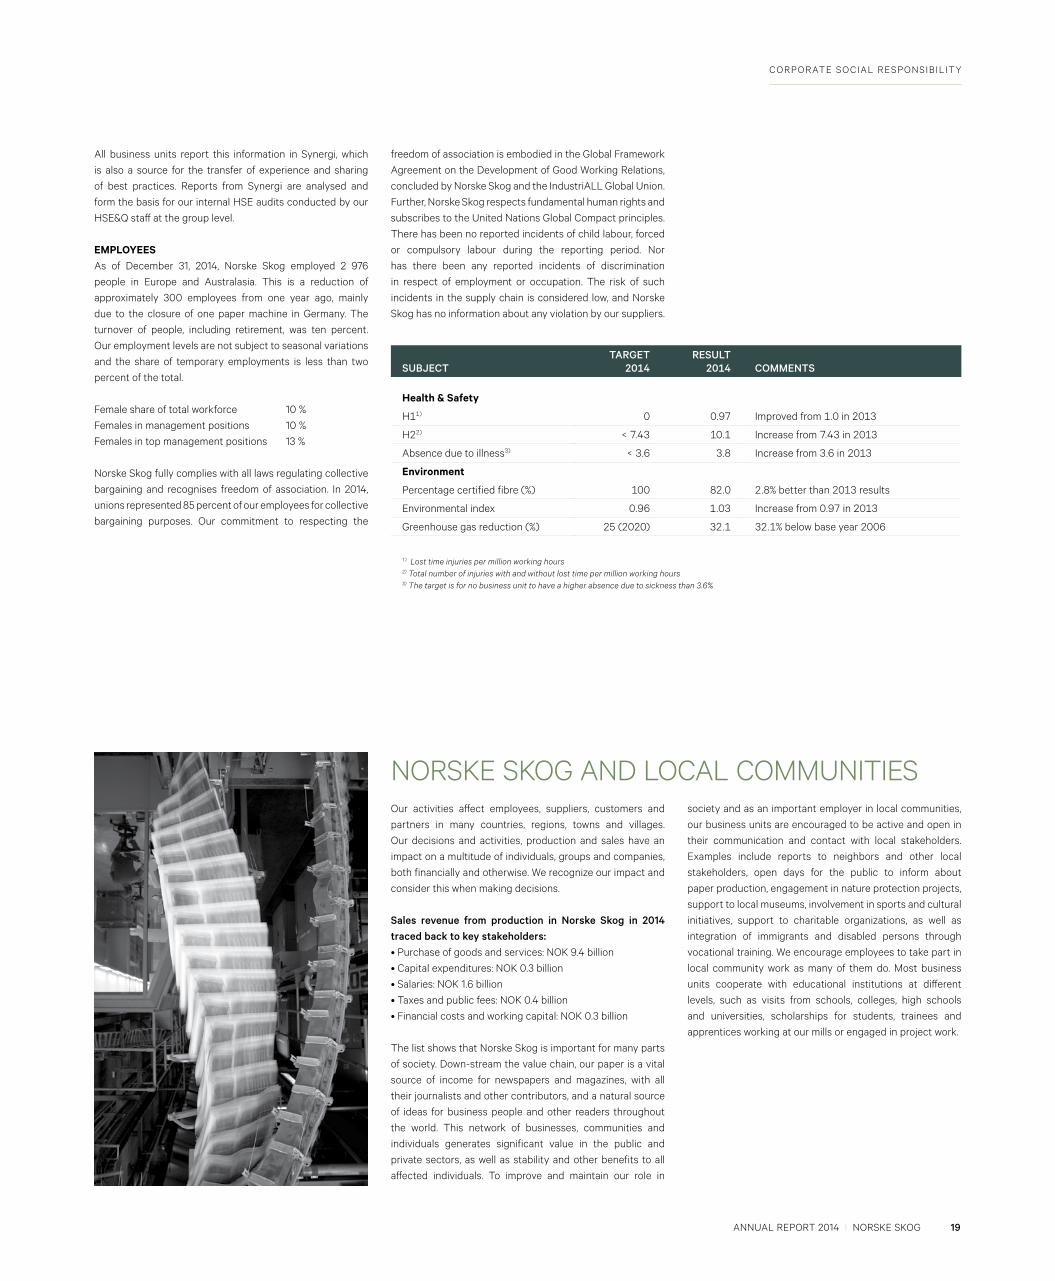
SUBJECT TARGET
2014RESULT
2014 COMMENTS
Health & Safety
H11) 0 0.97 Improved from 1.0 in 2013
H22) < 7.43 10.1 Increase from 7.43 in 2013
Absence due to illness3) < 3.6 3.8 Increase from 3.6 in 2013
Environment
Percentage certified fibre (%) 100 82.0 2.8% better than 2013 results
Environmental index 0.96 1.03 Increase from 0.97 in 2013
Greenhouse gas reduction (%) 25 (2020) 32.1 32.1% below base year 2006
1 ) Lost time injuries per million working hours2) Total number of injuries with and without lost time per million working hours3) The target is for no business unit to have a higher absence due to sickness than 3.6%
20 ANNUAL REPORT 2014 I NORSKE SKOG
BUSINESS UNITNUMBER OF EMPLOYEES (FTE)
END OF DECEMBER 2014
AVERAGE AGE OF ORDINARY
EMPLOYEES
AVERAGE SENIORITY OF
ORDINARY EMPLOYEES FEMALE
Ordinary Other employees Total End 2014 End 2014 End 2014
Norske Skog Albury 174 11 185 46.8 15.8 8.7
Norske Skog Boyer 259 31 300 47.6 21.3 5.3
Norske Skog Tasman (NZ) 163 18 181 48.8 18.6 12.0
Australia non mills 21 3 24 45.3 12.1 32.0
Australasia total 617 73 690 47.6 18.7 8.9
Norske Skog Saugbrugs 514 68 582 46.0 21.0 8.0
Norske Skog Skogn 371 29 400 48.5 21.0 5.0
Corporate headquarter 40 18 58 45.8 8.6 20.0
Norway total 925 115 1 040 47.0 20.5 7.3
Norske Skog Bruck 405 52 457 43.6 20.3 8.4
Parec 26 - 26 45.7 16.7 7.7
Norske Skog Golbey 386 30 416 46.8 17.8 14.6
Norske Skog Walsum 255 25 280 49.0 27.0 6.0
Sales offices in Europe 62 5 67 43.0 11.0 60.0
Europe total 1 134 112 1 246 45.9 20.4 12.8
Norske Skog group total 2 676 300 2 976 46.7 20.0 10.0
KEY FIGURES – EMPLOYEES
CORPORATE SOCIAL RESPONSIB IL ITY
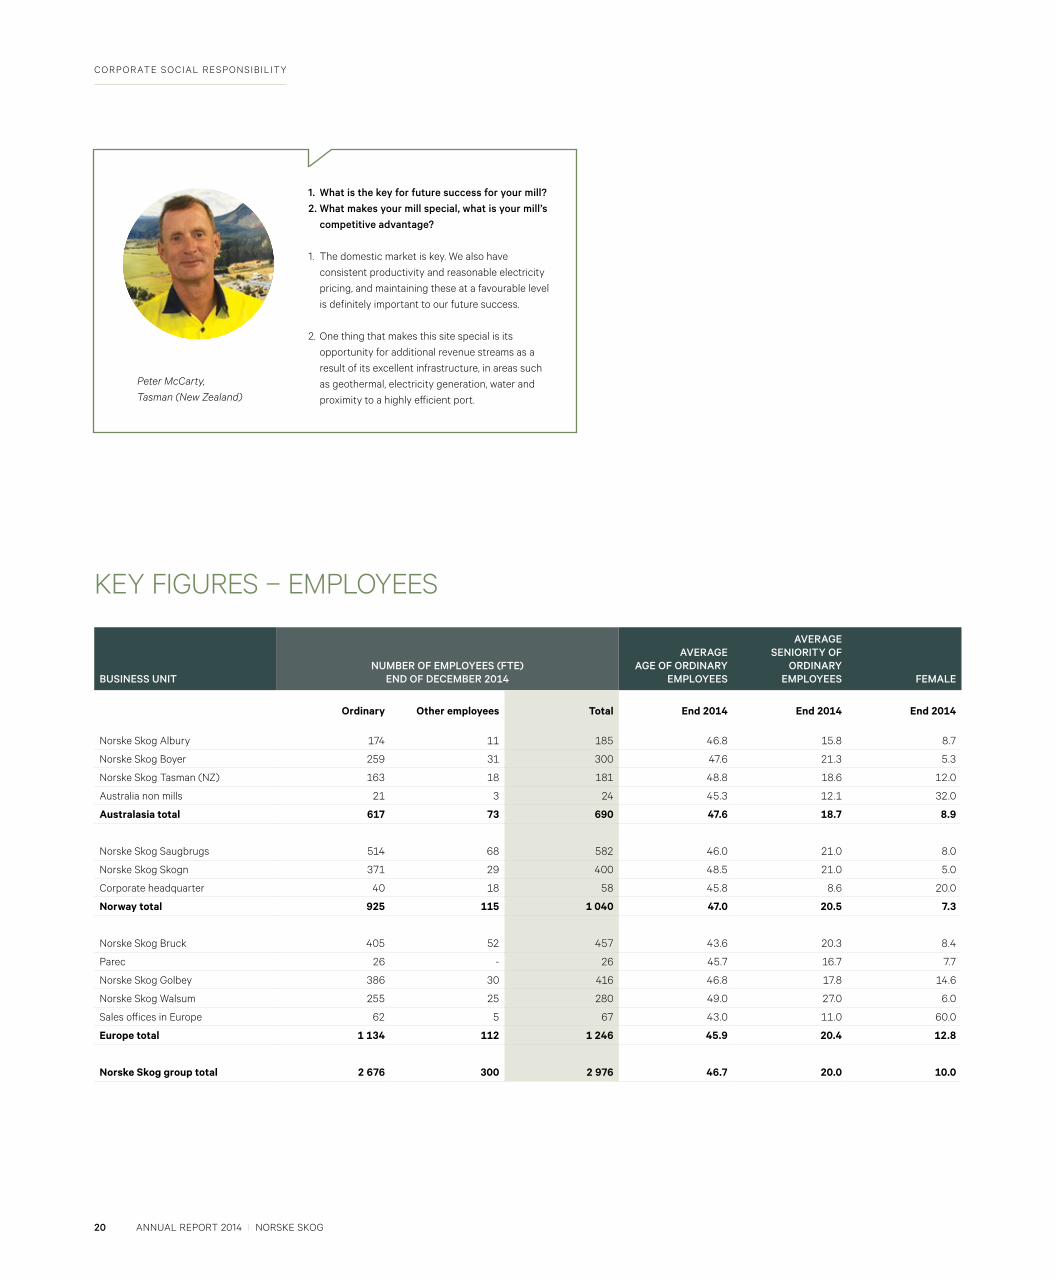
1. What is the key for future success for your mill?2. What makes your mill special, what is your mill’s
competitive advantage?
1. The domestic market is key. We also have consistent productivity and reasonable electricity pricing, and maintaining these at a favourable level is definitely important to our future success.
2. One thing that makes this site special is its opportunity for additional revenue streams as a result of its excellent infrastructure, in areas such as geothermal, electricity generation, water and proximity to a highly efficient port.
Peter McCarty, Tasman (New Zealand)

ANNUAL REPORT 2014 I NORSKE SKOG 21
SUMMARY AND PRESENTATION

22 ANNUAL REPORT 2014 I NORSKE SKOG
ROUNDWOOD
SAW MILL CHIPS
RAW MATERIALS
RECOVERED PAPER
RAW MATERIALS PAPER MILL
HEAT
PULP
CHEMICALS WATER ELECTRICITY
PAPER PRODUCTIONNorske Skog has the capacity to produce three million tonnes of publication paper each year, consisting of 1.9 tonnes of newsprint and 1.1 million tonnes of magazine paper.
The figures in this report contain the 100% owned mills at the end of December 2014 and figures compared to the same 100% owned mills in 2013.
The highly simplified diagram to the left illustrates the paper production process. In reality, the paper machines differ quite significantly. Raw materials consist mainly of wood and/or recovered paper, as well as electricity and chemicals. Wood and recovered fibres are separated during pulp production in two different processes. Pulp production based on recovered paper consumes less energy than production from fresh fibre because the fibres in recovered paper are more easily separated than those within wood. In the paper machine, the pulp passes along a web, firstly through a wet section, then a press section and finally through a drying section. The paper is finally rolled up on reels and then cut to the sizes ordered by the customer. During this process, more than 90% of the wood fibres in trees are converted to paper products.
PRODUCTION CAPACITY TONNES PER BUSINESS UNIT 31.12.2014
NEWSPRINT (INCLUDING IMPROVED NP)
SC (MAGAZINE PAPER)
LWC (MAGAZINE PAPER)
TOTAL CAPACITY
BUSINESS UNIT
Skogn 570 000 570 000
Saugbrugs 510 000 510 000
Golbey 615 000 615 000
Bruck 125 000 270 000 395 000
Walsum 205 000 205 000
Total Europe 1 310 000 510 000 475 000 2 295 000
Albury 275 000 275 000
Boyer 150 000 140 000 290 000
Tasman 155 000 155 000
Total outside Europe 580 000 140 000 720 000
Total Norske Skog group 1 890 000 510 000 615 000 3 015 000
Norske Skog’s production capacity has been re-assessed during 2013.
ANNUAL REPORT 2014 I NORSKE SKOG 23
EVALUATION OF OUR ENVIRONMENTAL PERFORMANCE
It is important for us to identify our environmental challenges, continuously improve our environmental standards throughout the value chain and report openly on our performance.
Environmental topics that the pulp and paper industry focus on include fibre supply, energy sources and use, greenhouse gas emissions, the efficiency of mill production processes, and the fate of our products at the end of the life cycle. The importance of these topics varies at local, regional and national levels. Norske Skog uses a combination of fresh fibres and recovered paper as raw material, depending on local conditions. Both sources are necessary to exploit the global fibre resources in a sustainable manner.
For Norske Skog it is important that our suppliers are also aware of their impact on their society and employees. Existing and new suppliers are, through our general purchase conditions, obliged to follow the laws and jurisdictions of their operating country, both for labour practices and human rights.
All our mills have traceability certificates for the purchase of timber to ensure that they come from sustainably managed forests. We do not source raw materials from controversial areas. Our suppliers comply with local rules and regulations and, where possible, we source wood locally to minimise costs and transport emissions. Our goal is to have a 100% certified wood supply. In Europe, the growth of forests is increasing in all countries where we purchase wood. In Australasia, we source only fresh fibre from plantations.
We use “Paper Profile” as our standard for disclosing our products’ environmental profile. For detailed information, see our web-page http://www.norskeskog.com/Products/Newsprint.aspx. And for general info on “Paper Profile” www.paperprofile.com.
In a world where increasing demands are being placed upon finite natural resources, and the ecosystems which supply them are more and more strained, it is important that our production processes are efficient and continuously improving. In addition to environmental management systems, Norske Skog has developed an internal environmental index to set targets and review our work to improve our resource use efficiency and reduce our emissions on a continuous basis. The goal is to use technology that meets the requirements of what the EU defines as the best available technology. The EU Commission finalized the BAT conclusions under the Industrial Emissions Directive 2010/75EU in September 2014. Norske Skog has revised the BAT levels to be used in the environmental index for 2015 accordingly. We have also implemented a water profile tool to compare, optimise, and reduce our water consumption. The EU Water Framework Directive establishes a legal framework to protect and restore clean water across Europe and ensure its long-term, sustainable use. Our European operations adhere to this directive and have established water management plans as required.
Climate change is the environmental issue receiving the greatest attention today. In 2007, Norske Skog established a greenhouse gas reduction target of 25% in total emissions by 2020. Greenhouse gas emissions differ considerably between
our mills. The main reason for this lies in the different energy sources used both for externally purchased energy and for energy produced on-site. Purchased energy is mainly electrical energy used for fibre processing and to operate machinery. Energy produced on-site is mainly used to dry paper on the production line. In many cases, we use energy several times, through heat recovery systems. Reducing greenhouse gas emissions mainly involves reducing the consumption of energy and/or changing the source of the energy we use.
The forest-based industry has a unique environmental position. The raw material is renewable, the products are highly recyclable and both the raw materials and products store carbon. Sustainably managed forests will absorb the carbon dioxide from the combustion of forest-based material. At the end of their life cycle, the products can be used to produce bio-energy.
Norske Skog is committed to sustainable development of the environment and natural resources including taking care of different aspects related to bio-diversity. This is attained through close cooperation with local authorities and managing our operations within the framework of our operational permits.
Norske Skog does not have any IUCN Red List species and national conservation list species with habitats in areas affected by our operations.
The below table is an overview of listed protected areas directly adjacent to our operations.
CORPORATE SOCIAL RESPONSIB IL ITY
NORSKE SKOG LOCATIONPROTECTED AREA
Type Location Size (ha) Comments
Walsum, Germany“Rheinaue Walsum” - Wetland Environmental conservation area Immediate vicinity of mill site 550
“Rheinaue Walsum” became part of wetland “Unterer Niederrhein” in 1993
Tasman, New ZealandWetland - New Zealand Ramsar Record on 02 February 2001
Adjacent to treatment ponds - located several km from mill site 6
Restoring previous clarifier solids landfill area to wetland
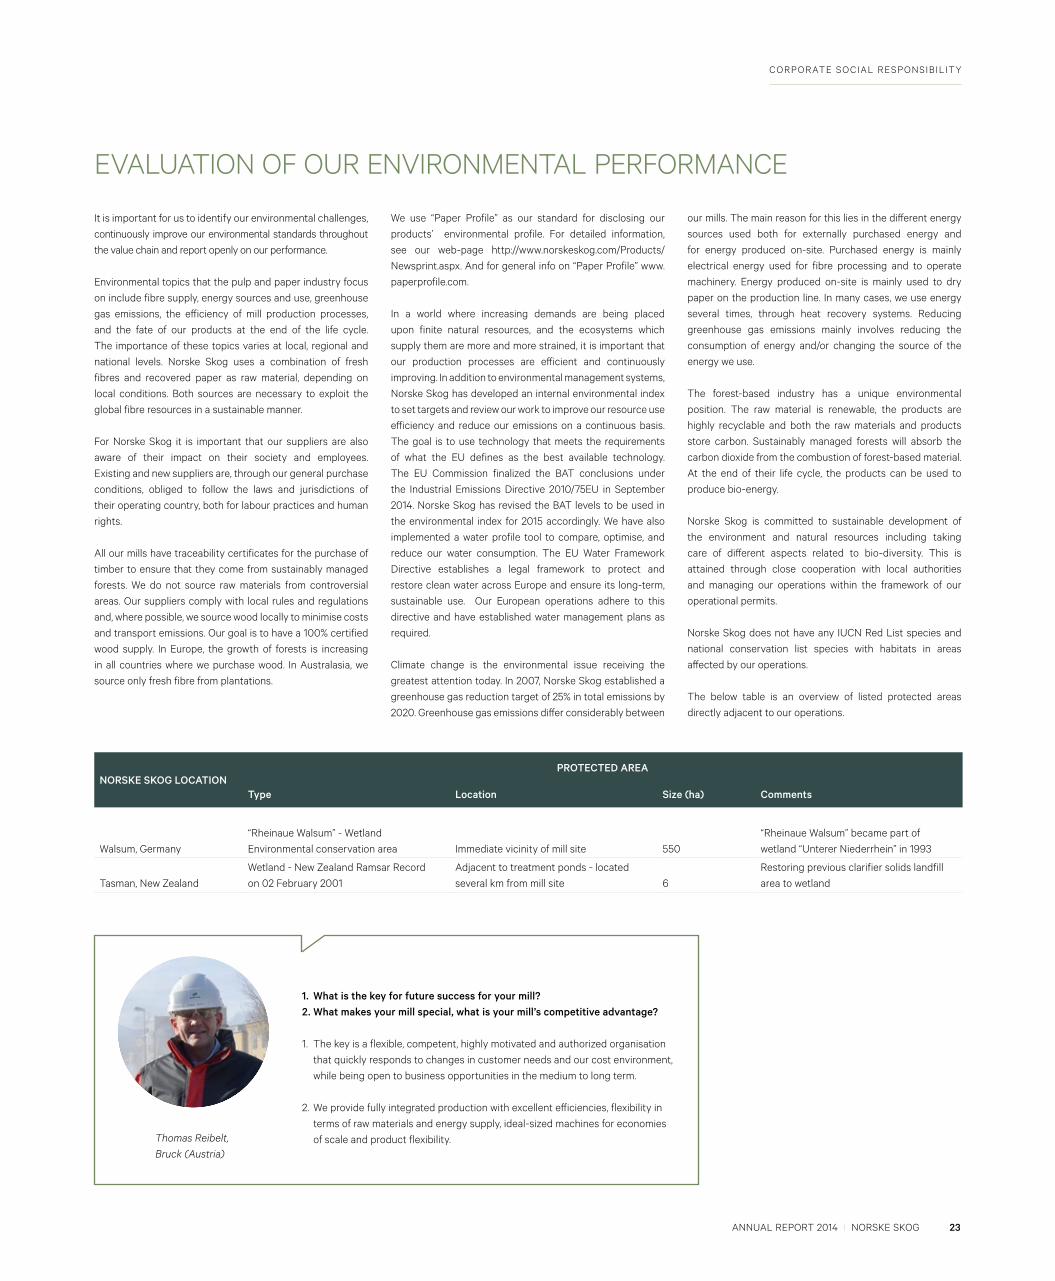
1. What is the key for future success for your mill?2. What makes your mill special, what is your mill’s competitive advantage?
1. The key is a flexible, competent, highly motivated and authorized organisation that quickly responds to changes in customer needs and our cost environment, while being open to business opportunities in the medium to long term.
2. We provide fully integrated production with excellent efficiencies, flexibility in terms of raw materials and energy supply, ideal-sized machines for economies of scale and product flexibility.Thomas Reibelt,
Bruck (Austria)

24 ANNUAL REPORT 2014 I NORSKE SKOG
CONSUMPTION OF RAW MATERIAL
SUSTAINABLE RAW MATERIALSForestry and use of forest products play an important role in the combat of climate change. For the forest value chain to be a part of the climate change solution, the forests must be managed sustainably. Norske Skog has several systems and processes to make sure that all wood used in Norske Skog’s products comes from sustainably managed forests. All Norske Skog mills utilising fresh fibre have third-party verified Chain of Custody (CoC) certification systems in place. The average share of certified fresh fibre in 2014 was 82%, an improvement of 3 percentage points compared to 2013.
FRESH FIBREIn 2014, Norske Skog consumed 1.4 million tonnes of fresh fibre. Our goal is to have 100% certified fibre in our products. Norske Skog is not a significant forest owner. A very small proportion of the wood we use comes from our own forests in Australia. The ability to increase the share of certified wood therefore depends largely on decisions taken by forest owners. Norske Skog encourages its suppliers to adopt forest certification. These certificates are the most credible way to demonstrate our responsible procurement of wood fibre. The most environmentally friendly purchases are delivered by local, certified forests. Today, only a relatively small portion of the global forest area is certified. The two main global certification systems are the Forest Stewardship Council (FSC), and the Programme for the Endorsement of Forest Certification (PEFC). Norske Skog regards the two systems as equally valuable tools to demonstrate responsible management and stewardship of the forest resources that our company and customers rely upon. Both systems are based on inspections and auditing by independent third parties. We recognise our responsibility as the purchaser of wood through our global procurement rules.
These state that all wood used in our paper shall originate from sustainably managed forests. Such forests are defined as:• Certified forests – we recognise the systems from FSC and
PEFC.• Forests declared to be managed according to national laws
and regulations.
All Norske Skog business units that buy fresh fibre have traceability certificates. The choice of the mill certification system depends on the certification system used in the forests or plantations. Roundwood accounted for 67% of our consumption of fresh fibres in 2014. Sawmill chips, a by-product from the sawmill industry, accounted for the remaining 33%. The roundwood component of our fresh fibre came from both forests (63%) and plantations (37%). In all countries where Norske Skog sources wood, forest areas are increasing.
The main global forest challenges are related to deforestation in developing countries and forest biodiversity degradation through the logging of high-conservation areas in many parts of the world. In order to meet these challenges, we need to ensure that more of the world’s forest areas are managed on a sustainable basis. Forest certification is an important tool in this context.
CERTIFICATION OF FRESH FIBRE THROUGH THE VALUE CHAINForest owners have systems for sustainable forest management (SFM). Forest product traders rely on chain of custody (CoC) certification. Traceability is important to ensure responsible purchasing, and to halt illegal logging. CoC tools make it possible to control and report the share of certified raw materials through the value chain from forest to finished product. CoC systems also require responsible purchasing of non-certified wood.
RECYCLED FIBRERecovered paper is an important fibre source for Norske Skog. In 2014, recycled fibre made up 32% of the raw materials used in our products. Mills utilising recovered paper consumed in total 0.906 million tonnes in 2014.
Some customers want paper based entirely on recovered paper. However, a value chain based only on recovered paper is not sustainable. About one third of the paper is lost in the recovered paper cycle. Factors such as consumer awareness, waste disposal and collection systems and alternative uses for used paper influence its collection rate. The structure and strength of the fibres of paper degrade with successive use. Recovered paper fibres that are no longer suitable for
papermaking are rejected in our mill pulping processes and are generally used as a source of renewable energy.
To make the recovered paper value chain sustainable, fresh fibre from forests, plantations or sawmill by-products must be added.
On a tonnage basis, our largest consumption of recovered paper takes place in continental Europe. The fibre source used at the different Norske Skog mills depends upon availability and economic considerations. The minimization of transport distances and costs is an increasingly important economic and environmental consideration.
FORESTS AND CLIMATE CHANGEThe main global challenges related to forest management and climate change are deforestation in developing countries. The use of forests, forest products and bio-energy can, however, be a sound climate change strategy, depending on where and how the forest biomass is harvested. It is important to distinguish between forest types and the existing use of the forest. In forest areas where biomass is accumulated (annual growth exceeds annual harvest), the use of forest resources for renewable products and energy will be possible while still keeping the forest stock stable. Forestland soil will release carbon dioxide after harvesting, but this is partly compensated for through increased radiation reflection from the same area (the Albedo effect). As long as only the net forest growth is harvested, the carbon stock will remain stable and bio-energy and forest products can substitute more carbon intensive products and fuels, thereby resulting in a positive climate effect.
There is a large potential in using forest resources more efficiently. Currently, forest residues - i.e. waste from the harvesting operation - are not utilised fully. As long as the removal of forest residues does not lead to loss of nutrients in the forest soil, these residues can be used for bio-energy purposes and to substitute fossil fuels. By-products from the forest value chain, such as sawmill chips, should be used for making products before being used as bio-energy at the end of their life cycle.
Norske Skog Albury, Australia 33 %
Norske Skog Bruck, Austria 92 %
Norske Skog Golbey, France 61 %
Norske Skog Skogn, Norway 28 %
RECOVERED PAPER IN NEWSPRINT PRODUCTION
0
20
40
60
100
80
2013 201420122011201020092008
CERTIFIED PROPORTION OF FRESH FIBRE (%)
Wood (roundwood and sawmill chips)50%
4% Purchased pulp
Recovered paper 32%
Inorganic fillers 14%
CORPORATE SOCIAL RESPONSIB IL ITY

ANNUAL REPORT 2014 I NORSKE SKOG 25
CERTIFIED FOREST
BY-PRODUCTS
RECOVERED PAPER
CERTIFIED PAPER
CERTIFIED SAW MILL CERTIFIED PAPER MILL
CERTIFIED WOOD PRODUCTS
CERTIFICATION OF FRESH FIBRE THROUGH THE VALUE CHAINForest owners have systems for sustainable forest management (SFM). Forest product traders rely on chain of custody (CoC) certification. Traceability is important to ensure responsible purchasing, and to halt illegal logging. CoC tools make it possible to control and report the share of certified raw materials through the value chain from forest to finished product. CoC systems also require responsible purchasing of non-certified wood.

26 ANNUAL REPORT 2014 I NORSKE SKOG
CORPORATE SOCIAL RESPONSIB IL ITY
ENERGY CONSUMPTIONNorske Skog has comprehensive programmes in place to continuously reduce energy consumption and to make it more environmentally friendly. We are already a large producer of bio-energy.
The production of paper is an energy-intensive process.Energy is consumed mainly for two purposes:• To separate, process and transport fibre and water
(electrical energy)• To provide process heat and to dry the paper (thermal
energy)
The major use of electrical energy in mills which process fresh fibre is the process which mechanically converts wood chips into fibres. This process is called the thermo mechanical pulping (TMP) process. Paper production based on recovered paper consumes less energy because the fibres from recovered paper are more easily separated than those within wood. The group’s average energy consumption per tonne of paper produced in 2014 was higher than in 2013. Five mills had lower or similar energy consumption per tonne of paper in 2014 compared to 2013.
52% of the total energy consumed by the group is electricity. In 2014, the remaining energy sources were fossil fuel (15%), bio-fuel (14%), heat recovery from TMP (12%) and other sources such as geothermal energy and heat (steam) purchased from third parties (7%). In 2014, 93% of electricity was purchased from the grid. A number of mills can generate
a proportion of the electricity requirement themselves, based on bio-fuel, natural gas or geothermal sources. Norske Skog is a large producer of bioenergy. Organic waste from the production processes is used as bio-fuel where possible. Some mills also purchase bio-fuel from external suppliers.
Natural gas is the most commonly used fossil fuel, with a share of 64%, down 2 percentage points from 2013. Coal constitutes 35% of fossil fuel consumption, up 2 percentage points from 2013. Oil makes up 0.3%, which is down compared to 2013.
Thermal energy is used for the heating and drying of paper. In contrast with electrical energy, thermal energy is mostly generated within the mill. The sources of this energy include recovered heat from the thermo mechanical pulping or effluent treatment processes, combustion of mill residues, purchased bio-fuel, oil, gas or coal. In some cases, the thermal energy is supplied by third parties located externally to the mill or in the form of geothermal energy.
The share of purchased energy makes up about half of the energy consumption in Europe and 55% in Australasia. There is, however, significant variation in thermal energy sources used between different geographic regions. The Australasian mills mainly use fossil and geothermal energy. In Europe, the mills use mainly bio-fuel, fossil fuel and heat recovered from the production of thermo-mechanical pulp from fresh fibre.
NORSKE SKOG ENERGY CONSUMPTION (TOTAL AND BY REGION)
Total 10211 GWh; 3.91 MWh/tonne of paper
CONSUMPTION OF FOSSIL FUEL (KWh/TONNE OF PAPER)
0
200
400
600
800
1000
2013 20142012201120102009
Coal Gas Oil
23% Fossil
AUSTRALASIA
Purchased electricity 55%
Recovered from TMP
5%
Bio 4%
Purchased electricity 52%
Recovered from TMP
12%
15% Fossil
NORSKE SKOG
Bio 14%
Other 7%
Purchased electricity 51%
11% Fossil
Recovered from TMP
15%
EUROPE
Bio 19%
Other 4%
Other 13%

ANNUAL REPORT 2014 I NORSKE SKOG 27
CORPORATE SOCIAL RESPONSIB IL ITY
As a large industry player, Norske Skog recognises its responsibility to reduce greenhouse gas emissions. In 2007, we established our goal of achieving 25% lower greenhouse gas emissions within 2020, compared with emissions in 2006. As of 2014, our emissions were 32% lower than in 2006.
Norske Skog has integrated reduction of greenhouse gas emissions as a key part of our business strategy. The goal is to reduce energy consumption, change the sources of energy and to optimise the use of process chemicals and transport.
In the work to reduce greenhouse gas emissions, we report on a greenhouse gas reduction target and our carbon footprint. The reduction target is based on the WRI/WBCSD Greenhouse Gas Protocol, the Pulp and Paper Workbook. The carbon footprint is built on the Confederation of the European Paper Industries’ (CEPI) tool developed in 2007. The CEPI carbon footprint is related to the products we make and covers the whole value chain, whilst the Norske Skog reduction target is focused on the paper production process and covers Scopes 1 and 2 as shown in the figure. Both the Norske Skog emission reduction target and the carbon footprint are based on greenhouse gas emission data from our 8 wholly-owned mills.
OUR REDUCTION TARGETNorske Skog’s target for reducing greenhouse gas emissions covers direct emissions (referred to as ‘Scope 1’ in the
NORSKE SKOG’S GREENHOUSE GAS EMISSIONS
CO2 CH4 N2O
SCOPE 2INDIRECT EMISSIONS
SCOPE 3INDIRECT EMISSIONS
SCOPE 1DIRECT EMISSIONS
PURCHASEDELECTRICITY AND HEAT INTERNAL TRANSPORT
EMISSIONS ASSOCIATED WITH TRANSPORT OF PAPER PRODUCTS ARE CALCULATED FOR EACH CUSTOMER
OUR REDUCTION TARGET
OUR CARBON FOOTPRINT
COMBUSTION OFFOSSIL FUELIN OUR MILLS
DELIVERED WOOD ANDRECOVERD PAPER
PRODUCTION OF FUEL ANDOTHER RAW MATERIALS
TRANSPORTOF RAW MATERIALS
NORSKE SKOG GREENHOUSE GAS EMISSIONSCO
21 000
CH4
N2O CO
2-equiv1 000
Direct (Scope 1) Emissions tonnes tonnes tonnes tonnesDirect emissions from stationary fuel combustion 462 19 3 466
Direct emissions from transportation and mobile sources 6 0 1 6
Total direct emissions 468 20 3 472
Indirect (Scope 2) Emissions Indirect emissions from steam and power imports 1 103 0 0 1 103
Total Fossil Fuel Based Emissions (Direct & Indirect)Direct & Indirect 1 571 20 3 1 575
CO2 emissions from combustion of biomass * 550
* Wood and bark residues only
Greenhouse Gas Protocol) from the combustion of fossil fuels in boilers, combined heat and power plants, infrared drying equipment, mobile machinery and other mill site based equipment, and indirect emissions (‘Scope 2’) from the purchase of electricity and heat.
Based on the above scope and emission estimation processes, Norske Skog operations emitted 1.57 million tonnes of fossil fuel derived CO
2-equivalents (including CO
2,
CH4 and N
2O) in 2014. The total emissions from our mills were
reduced by 7% in 2014 compared to emissions in 2013. The
main reason is lower paper production. The total emission reduction achieved to date, compared to our base year 2006 is 32%.
The greenhouse gas emissions arising from the combustion of bio-fuels are deemed to be ‘carbon neutral’ as only the net forest growth is harvested from sustainably managed forests and plantations, leaving the carbon stock stable. Direct emissions of biologically sequestered CO
2 from the
combustion of organic residues such as wood and bark are estimated to be approximately 0.550 million tonnes.

28 ANNUAL REPORT 2014 I NORSKE SKOG
CORPORATE SOCIAL RESPONSIB IL ITY
OUR CARBON FOOTPRINTBased on the CEPI carbon footprint tool, our carbon footprint covers emissions from the following elements of our value chain:
• Pulp and paper production• Forest and recycling operations• Producing other raw materials and fuels• Purchased electricity and heat• Transport – excluding transport to final customer which is
calculated on a case by case basis• Carbon stored in forest products (biogenic carbon) is
reported separately.
The average global carbon footprint per tonne of paper produced by the Norske Skog mills in 2014 was 742 kg CO
2
equivalents/tonne paper. This represents an increase of 2% compared to 2013. 1 336 kg/tonne biogenic CO
2 is estimated
to be contained in the product. As seen in the figure, the largest contributor to our carbon footprint is purchased
electricity and heat, which make up 57% of the emissions per tonne of paper. Pulp and paper production makes up 26%, forest and recycling operations 3%, production of other raw materials 10% and transport to the mills 4% of the total emissions per tonne of paper.
The carbon footprint varies considerably between the mills and regions, depending on the source of electricity and the type of fuel used to produce process heat. The emissions per tonne of paper production ranged from 414 kg CO
2-
equivalents/tonne of paper in Europe to 1 783 kg CO2-
equivalents/tonne in Australasia.
NORSKE SKOG CARBON FOOTPRINT KG CO2/TONNE OF PAPER
0
100
200
300
400
500
Pulp and paper production
Forest and recycling operations
Producing other raw materials and fuels
Purchased electricity and heat
Transport excluding transport to final customer

ANNUAL REPORT 2014 I NORSKE SKOG 29
CORPORATE SOCIAL RESPONSIB IL ITY
CONTINUOUSLY IMPROVING OUR PRODUCTION PROCESSES Norske Skog’s environmental policy commits us to continuous improvement in the environmental performance of our business units.
The wish to measure this continuous improvement in our mills and as a company over the short and long term led us to implement an environment index (E-index) several years ago. The E-index forms part of the regular reporting by the mills to corporate management and the board. In addition to being a performance reporting tool it allows us to:
• establish and review mill specific targets• identify areas for additional investment• demonstrate the environmental improvements following process
changes or investments
Mill performance is measured in the index against a standard which should be attainable with the use of Best Available Technology (BAT) or best practice, as described in the European Union IPPC reference document. An index value of 1.0 or less indicates that the mill has an environmental standard which satisfies the ambitious levels which can be attained with BAT or best practice. The BAT level of performance is mill specific
and is a function of age, technology, investment history and operational performance.
The environmental index for the whole group is calculated as an average of each mill’s index score weighted by production volumes.
The table below shows the targets for 2014 and 2015 for the parameters included in the E-index, as well as the results achieved during the last four years. The EU Commission finalized the BAT conclusions under the Industrial Emissions Directive 2010/75EU in September 2014. Norske Skog has revised the BAT-levels to be used in the environmental index for 2015 accordingly. The higher E-index target for 2015 is a result of the new lower BAT-values. These figures represent production-weighted averages for all mills. In 2014, three mills reached their E-index targets.
Increased amount of COD and suspended solids in 4 of our mills is the main reason for not achieving the 2014 target. The increase is linked to periods with process stability challenges in the water effluent plants.
Achieved Achieved Achieved Achieved Target Target
ENVIRONMENTAL INDEX 2011 2012 2013 2014 2014 2015
COD kg/tonne 4.61 3.7 3.9 4.2 3.5 3.7
Suspended solids kg/tonne 0.50 0.43 0.35 0.50 0.40 0.43
Nitrogen oxides g/GJ 95 89 95 95 97 97
Waste to landfill kg/tonne 21.2 16.8 14.8 13.3 14.0 15.5
Total energy consumption GJ/tonne 12.5 12.5 12.2 12.4 12.2 12.3
Environmental index 1.10 1.03 0.96 1.03 0.96 1.02
KEY FIGURESFOR NORSKE SKOG’S WHOLLY-OWNED MILLS
Consumption of raw materials
Roundwood m3 2 371 000
Sawmill chips m3 1 190 000
Recovered paper tonnes 906 000
Purchased pulp tonnes 107 000
Inorganic fillers tonnes 396 000
Energy
Electricity GWh 5 715
Heat GWh 4 500
Discharges to water
Discharged process water mill m3 48
Organic material (COD) tonnes 11 092
Suspended Solid (SS) tonnes 1 314
Phosphorus (Tot-P) tonnes 37
Emission to air
CO2-equivalents (direct) tonnes 472 000
SO2 tonnes 205
NOX tonnes 846
Production waste
Sludge (dry) tonnes 280 000
Bark tonnes 109 000
Other tonnes 30 000
Products
Newsprint grades tonnes 1 659 000
Magazine paper tonnes 956 000
Total tonnes 2 615 000
1. What is the key for future success for your mill?2. What makes your mill special, what is your mill’s
competitive advantage?
1. I would say being customer focused and maintaining good and stable quality, high productivity and cost competitiveness.
2. We are situated in the middle of our main market, meaning low transport costs. We are also one of the few mills that in addition to offset can deliver LWC in gravure quality, and we have no limitation when it comes to reel width and core size.
Trond Sverre Flaten, Walsum (Germany)
30 ANNUAL REPORT 2014 I NORSKE SKOG
OTHER LOSSES0.3
CHEMICALS
WATER IN PRODUCTS
0.08
GROUND WATER4.3
SURFACE WATER39.3
MUNICIPAL WATER0.04
RECYCLED PAPER AND PURCHASED PULP
0.03
PRODUCTION
EVAPORATION1.0
TO SURFACE WATER FROM EFFLUENT TREATMENT
18.4
OTHER WATER INPUTS
0.1
WATER IN WOOD0.6
TO SURFACE WATER FROM COOLING
24.5

ANNUAL REPORT 2014 I NORSKE SKOG 31
CORPORATE SOCIAL RESPONSIB IL ITY
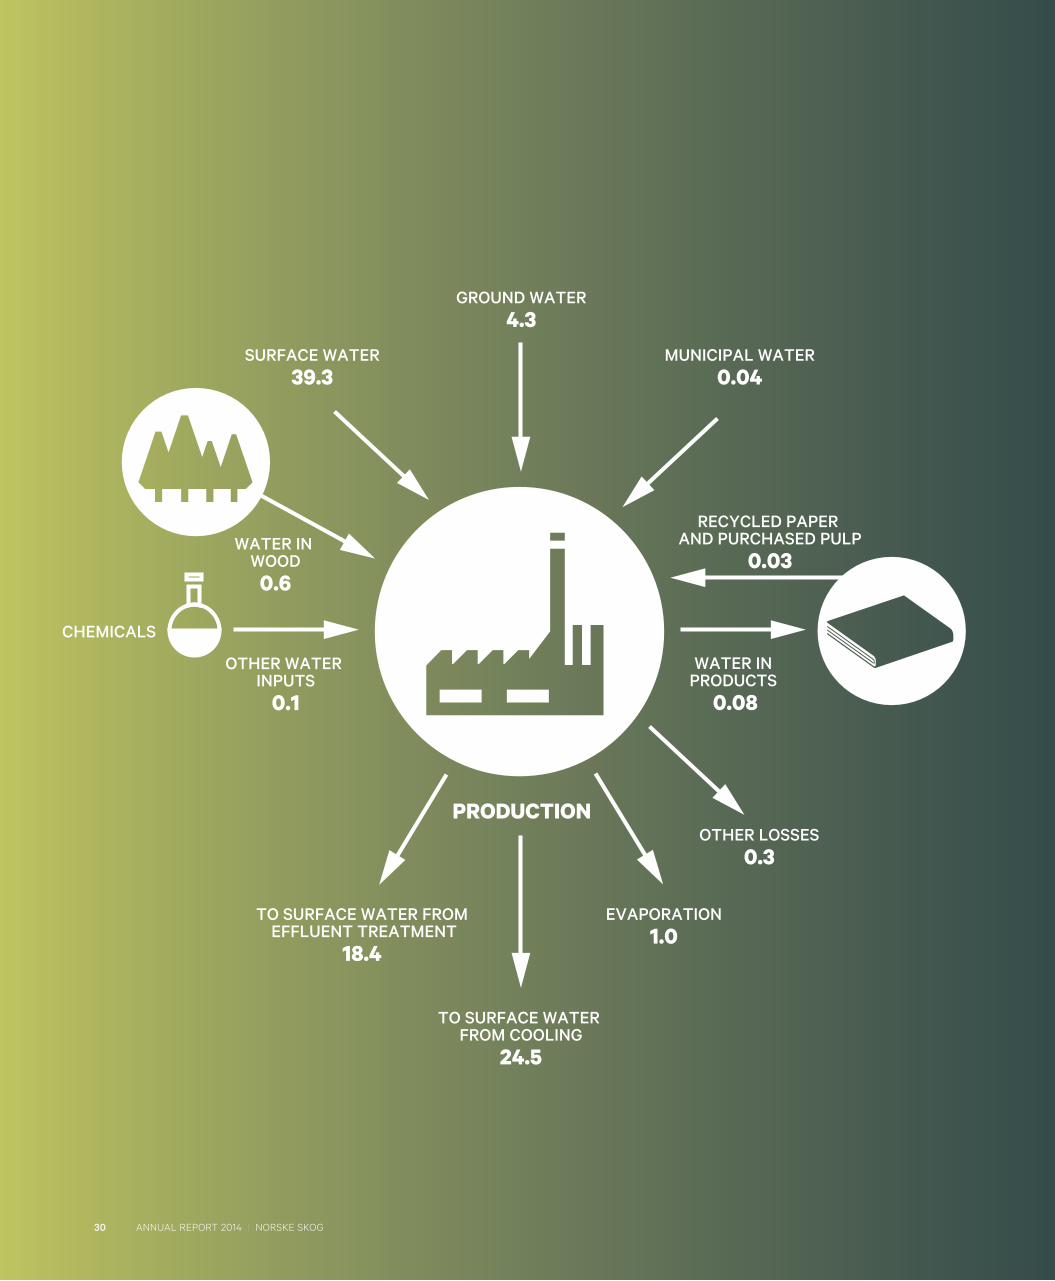
THE NORSKE SKOG WATER PROFILE: GLOBAL AVERAGE WATER USE M3/TONNE OF PAPERThe figure presents the 2014 water profile for Norske Skog. The profile has been developed by examining the major inputs and outputs of water in the manufacturing process. The data presented is a combination of all eight wholly owned mills and represents a ‘group average’.
The total water use per tonne of paper in 2014 decreased by 2% compared to 2013. 98% of the water entering our mills is returned to rivers and lakes after treatment. Approximately 2% is returned to the atmosphere as water vapour, retained in the products or used for irrigation of forest plantations or agricultural areas.
WATER SUPPLYThe majority of fresh water used by Norske Skog’s mills (88%) originates from surface water sources. A further 10% is supplied from ground water supplies and a relatively small amount, 0.1%, comes from municipal water supplies.
Water also enters the manufacturing process through the raw materials which are purchased. Fibre based raw materials (wood, wood chips, recycled fibre and purchased pulp) constitute approximately 1% of water input. Non-fibre raw materials (such as chemicals and steam) make up the balance.
WATER USEThe majority of water which enters our mills (55%) is used to cool machinery and equipment performing electricity or steam generation and/or pulp and paper manufacturing activities. The rest of the water is used in the papermaking processes (“process” water).
Most mill effluents are discharged to river and lake systems after treatment. No effluent is discharged to groundwater aquifers.
WATER FOOTPRINT: THE TOTAL WATER CONSUMPTION IN THE PAPER VALUE CHAINMankind’s increasing use of freshwater resources places a strain on global water resources. Policies and practices for sustainable use of this natural resource are a prerequisite for a sustainable global development. To help assess the impact of different products on water resources, different water footprint tools are under development. Water footprint accounting includes monitoring of both direct and indirect use of freshwater, measured over the full supply chain. For paper products, this includes water evaporated during tree growth (green water), water consumed during the production phase (blue water) and the water required to assimilate the discharged pollutants based on existing ambient water quality standards (grey water).
It is important to realise that the water footprint figure itself does not reveal much about the actual impact of operations at the local watershed level. A low water footprint could be less sustainable than a high water footprint. For instance, the water footprint for paper depends mainly on the time it takes for trees to grow. Trees use a lot of water to grow and paper will therefore have a large water footprint. Boreal forests are characterised by a humid climate, where precipitation is higher than evaporation. Forests sustain and slow down the surface runoff, preventing flooding, erosion and leaching of nutrients. A sustainability assessment using many indicators is needed to gain understanding of whether mill operation and forest management practices are within the boundaries of what a water catchment can sustainably support.
Norske Skog will implement water footprint reporting when an international standard has been agreed upon. In the meantime, we will report our water profile. Water scarcity is not an issue in any of the forest or plantation areas supplying Norske Skog or in any area where our mills are located. 98% of the water entering Norske Skog mills is returned to rivers and lakes after treatment.
1. What is the key for future success for your mill?2. What makes your mill special, what is your mill’s
competitive advantage?
1. Our ambition is to make Skogn one of the most cost-effective and profitable newsprint suppliers in the market and thereby ensuring full utilization of all the machines at the mill.
2. Norske Skog Skogn delivers standard newsprint and improved newsprint to markets where we are competitive on logistics costs. We have an excellent infrastructure and a flexible staff that makes us cost competitive.
Amund Saxrud, Skogn (Norway)

32 ANNUAL REPORT 2014 I NORSKE SKOG
EMISSIONS TO AIR AND DISCHARGE TO WATERManufacturing pulp and paper requires raw materials and energy. Norske Skog’s environmental policy requires us to make efficient use of these resources and to work continuously to reduce our emissions and discharges.
SOLID RESIDUES AND EMISSIONS TO AIREmissions to air occur primarily from energy generation processes, and the majority of solid wastes occur from the processing of fibre inputs (wood or recovered paper) and from the treatment of effluent (fibre and biological solids). Most of our mills have their own boilers or incinerators for producing thermal energy from these solid residues. Fossil fuels in the form of natural gas, oil and coal may also be used. The main emissions associated with these activities include carbon dioxide, particulates, sulphur dioxide and nitrogen oxides. A number of technologies are used to reduce and control these discharges. Ash residues result from combustion processes involving solid fuels.
In 2014, the emission of sulphur dioxide per tonne of paper was down by 11% compared to 2013. The emissions of NOx per tonne of paper were up by 6% compared to last year.
The total quantity of production waste generated by the group in 2014 was 419 000 dry tonnes. This is a reduction of about 17 000 tonnes compared to 2013. In 2014, 143 000 tonnes of ash were generated from combustion, an increase of 5 600 tonnes compared to 2013.
The residues from the production processes are reused or disposed of in a number of ways as shown in the figure. Where possible, process residues are used to generate energy for the pulp and paper manufacturing process. In 2014, 77% of the waste was used as bio-fuel, up from 75% in 2013. Other residues, for example ash, are used in concrete
or brick making, or in road construction. Agricultural re-use is also an option for some ash and organic materials. Part of the production residues are deposited in landfills. Many of our mills participate in projects to find alternative or additional methods of reusing the by-products from the production processes. Hazardous waste amounted to 506 tonnes in 2014. Hazardous waste is disposed through authorized collection systems in accordance with national regulations.
WATER DISCHARGESWater is generally used and recovered multiple times through the pulp and papermaking processes before finally being discharged to a number of treatment stages. These treatments remove solid particles as well as dissolved organic material, making the water suitable for safe return to the natural environment. In 2014, water discharge from the production process per tonne of paper was up 5% compared to 2013. The discharges of dissolved organic material and suspended matters per tonne of paper increased by 9% and 43% compared to 2013. The discharge of nitrogen and phosphorus increased by 13% and 32% compared to 2013. The difference in results from one year to the next is the result of many factors, including process improvements, utilization of equipment, production issues and product changes.
During 2014, the mills Norske Skog Saugbrugs, Norske Skog Albury and Norske Skog Tasman reported to the local authorities that they had incidents resulting in exceeding permit limits linked to the quality of discharged water. None of these overruns resulted in sanctions from the authorities.
Norske Skog does not use bleaching chemicals containing chlorine in any mills. Chlorinated organic compounds are therefore not created and AOX is not included in our emission reporting.
TRENDS IN DISCHARGES OF ORGANIC SUBSTANCES (COD) PER TONNE OF PAPER
0
2
4
6
8
10
12
201420132012201120102009
Europe
Australasia
South America
Asia
Total
Europe
Australasia
South America
Asia
Total
TRENDS IN DISCHARGES OF WASTEWATER PER TONNE OF PAPER
0
5
10
15
20
25
30
35
201420132012201120102009
DISPOSAL OF MILL PRODUCTION WASTE
Energy Recovery
Landfill
Cement Industry
Agriculture
Sale/Delivered
0 %
20 %
40 %
60 %
80 %
100 %
Energy recovery Landfill Cement industry Agriculture Sale/delivered collectors
Nor
ske
Skog
tota
l
Euro
pa
Aus
tral
asia
PRODUCTION WASTE
Total 420 000 tonnes
Sludge 67%
Other 7%
Bark26%
CORPORATE SOCIAL RESPONSIB IL ITY

ANNUAL REPORT 2014 I NORSKE SKOG 33

34 ANNUAL REPORT 2014 I NORSKE SKOG
CORPORATE SOCIAL RESPONSIB IL ITY
Bruck Golbey Saugbrugs Skogn Walsum Albury Boyer Tasman
PRODUCTION
Paper tonnes 375 034 537 832 429 250 450 874 195 447 261 999 219 849 144 385
CONSUMPTION
Roundwood 1 000 m3 215 171 537 567 0 371 482 28
Sawmill chips 1 000 m3 0 358 136 185 215 3 0 293
Recovered paper 1 000 tonnes 205 444 0 160 0 98 0 0
Purchased pulp 1 000 tonnes 27 0 41 0 32 0 5 0
Pigments and fillers 1 000 tonnes 100 17 134 31 74 0 36 5
Electric power MWh/tonne 1.17 1.66 2.51 2.39 2.21 2.49 2.92 3.45
GWh 440 895 1077 1 079 431 652 643 498
Thermal energy 1) GJ/tonne 4.23 5.62 6.05 6.06 7.12 6.51 8.83 8.29
TJ 1 585 3 023 2 597 2 734 1 392 1 706 1 941 1 197
DISCHARGE TO WATER
Treated process water m3/tonne 13.0 10.1 17.5 16.8 18.0 10.8 36.6 56.7
1 000 m3 4 870 5 450 7 491 7 587 3 508 2 828 8 044 8 190
Organic material (COD) kg/tonne 3.3 1.9 6.4 4.3 3.6 2.9 9.9 3.6
tonnes 1 231 1 027 2 739 1 953 703 749 2 168 524
Suspended solids (SS) kg/tonne 0.3 0.1 0.7 0.7 0.1 0.1 1.3 1.3
tonnes 130 55 318 294 11 34 286 185
Phosphorus (tot-P) g/tonne 4.2 14.6 14.2 16.2 9.7 4.5 51.8 n.r.
tonnes 1.6 7.9 6.1 7.3 1.9 1.2 11.4 n.r.
AIR EMISSIONS 2)
CO2-e (fossil) (total direct) tonne/tonne 0.486 0.065 0.004 0.008 0.052 0.188 0.862 0.002
CO2-e (fossil) (indirect) tonne/tonne 0.040 0.125 0.016 0.014 1.124 2.216 0.351 0.883
CO2-e (fossil) (total) 1 000 tonnes 197 102 8 10 230 630 267 131
WASTE 3)
Waste to landfill kg/tonne 0.83 2.40 19.56 16.85 0 6.67 70.98 6.52
tonnes 310 1 292 8 394 7 600 0 1 749 15 605 941
MANAGEMENT SYSTEMS
Environmental MS 4) Certificate ISO/EMAS ISO ISO ISO ISO/EMAS ISO ISO ISO
CoC-systems Certificate PEFC/FSC PEFC/FSC PEFC/FSC PEFC/FSC PEFC/FSC PEFC PEFC/FSC FSC
FORESTRY CERTIFICATION 5)
Certified (PEFC or FSC) % 88 66 83 89 79 83 99 74
1) Includes heat recovered from the production process 2) Emissions from production. internal transport and purchased energy 3) Production waste (organic and inorganic) 4) ISO = ISO 14001. EMAS = EU Eco management and audit scheme 5) Of the quantity roundwood + sawmill chips + purchased pulp
MILL FIGURES

ANNUAL REPORT 2014 I NORSKE SKOG 35
CORPORATE SOCIAL RESPONSIB IL ITY
Bruck Golbey Saugbrugs Skogn Walsum Albury Boyer Tasman
PRODUCTION
Paper tonnes 375 034 537 832 429 250 450 874 195 447 261 999 219 849 144 385
CONSUMPTION
Roundwood 1 000 m3 215 171 537 567 0 371 482 28
Sawmill chips 1 000 m3 0 358 136 185 215 3 0 293
Recovered paper 1 000 tonnes 205 444 0 160 0 98 0 0
Purchased pulp 1 000 tonnes 27 0 41 0 32 0 5 0
Pigments and fillers 1 000 tonnes 100 17 134 31 74 0 36 5
Electric power MWh/tonne 1.17 1.66 2.51 2.39 2.21 2.49 2.92 3.45
GWh 440 895 1077 1 079 431 652 643 498
Thermal energy 1) GJ/tonne 4.23 5.62 6.05 6.06 7.12 6.51 8.83 8.29
TJ 1 585 3 023 2 597 2 734 1 392 1 706 1 941 1 197
DISCHARGE TO WATER
Treated process water m3/tonne 13.0 10.1 17.5 16.8 18.0 10.8 36.6 56.7
1 000 m3 4 870 5 450 7 491 7 587 3 508 2 828 8 044 8 190
Organic material (COD) kg/tonne 3.3 1.9 6.4 4.3 3.6 2.9 9.9 3.6
tonnes 1 231 1 027 2 739 1 953 703 749 2 168 524
Suspended solids (SS) kg/tonne 0.3 0.1 0.7 0.7 0.1 0.1 1.3 1.3
tonnes 130 55 318 294 11 34 286 185
Phosphorus (tot-P) g/tonne 4.2 14.6 14.2 16.2 9.7 4.5 51.8 n.r.
tonnes 1.6 7.9 6.1 7.3 1.9 1.2 11.4 n.r.
AIR EMISSIONS 2)
CO2-e (fossil) (total direct) tonne/tonne 0.486 0.065 0.004 0.008 0.052 0.188 0.862 0.002
CO2-e (fossil) (indirect) tonne/tonne 0.040 0.125 0.016 0.014 1.124 2.216 0.351 0.883
CO2-e (fossil) (total) 1 000 tonnes 197 102 8 10 230 630 267 131
WASTE 3)
Waste to landfill kg/tonne 0.83 2.40 19.56 16.85 0 6.67 70.98 6.52
tonnes 310 1 292 8 394 7 600 0 1 749 15 605 941
MANAGEMENT SYSTEMS
Environmental MS 4) Certificate ISO/EMAS ISO ISO ISO ISO/EMAS ISO ISO ISO
CoC-systems Certificate PEFC/FSC PEFC/FSC PEFC/FSC PEFC/FSC PEFC/FSC PEFC PEFC/FSC FSC
FORESTRY CERTIFICATION 5)
Certified (PEFC or FSC) % 88 66 83 89 79 83 99 74
1) Includes heat recovered from the production process 2) Emissions from production. internal transport and purchased energy 3) Production waste (organic and inorganic) 4) ISO = ISO 14001. EMAS = EU Eco management and audit scheme 5) Of the quantity roundwood + sawmill chips + purchased pulp
1. What is the key for future success for your mill?2. What makes your mill special, what is your mill’s competitive
advantage?
1. In order to maintain our position as Europe’s leading newsprint mill, we must make continuous improvements, find and implement new solutions, develop a lean and flexible organisation and create new revenue streams.
2. The mill is large, modern, efficient and located in the heart of Europe – with an ambition to proactively shape our future. I would also emphasize our strong entrepreneurial culture and committed people.
Yves Bailly, Golbey (France)

36 ANNUAL REPORT 2014 I NORSKE SKOG
CORPORATE SOCIAL RESPONSIB IL ITY
ENVIRONMENT AND CORPORATE SOCIAL RESPONSIBILITY REPORTINGThe environment report contains information which Norske Skog believes covers the material environmental aspects of the value chain of the company’s activities. Environmental data for 2014 includes wholly owned paper mills which were part of the group as at 31 December 2014.
Environmental data has been collected from the mills using established reporting routines. These include monthly standardised reporting for the key environmental data as well as a standardised collection of supplementary information on an annual basis. The monthly reporting includes production, consumption of raw materials, energy consumption, emissions and discharges and waste. Data from this reporting is collated by the environment manager on the group level in standardised monthly reports to the corporate management and to the board quarterly. The basis and methodology for the reporting on greenhouse gas emissions
and the Environmental Index is described on pages 27 and 29. The figures in the environmental report are collated and processed to make the presentation of data as uniform and practical as possible.
Norske Skog also supports the work to develop a global standard for reporting of sustainable development. We therefore use the Global Reporting Initiative’s (GRI) guidelines for reporting relating to sustainability as a tool in our work to report environmental and corporate responsibility. Our reporting practice is, in our view, for all practical purposes in line with the GRI reporting routines. On our website, (www.norskeskog.com/gri.aspx), there is a GRI table containing references to where in the annual report relevant information about the various aspects and indicators in GRI can be found. In our opinion, our reporting for 2014 is in accordance with level CORE of GRI-G4.
Norske Skog is committed to contribute to sustainable development. We have signed the UN Global Compact, are members of Global Compact Nordic Network (GCNN), where participants from Denmark, Finland, Norway and Sweden discuss common challenges and the implementation of the ten principles in the UN Global Compact. There is a UN GlobalCompact table, with reference to where in the annual report relevant information about the ten principles can be found, on our website (www.norskeskog.com/globalcompact.aspx).
TO THE MANAGEMENT OF NORSKE SKOGINDUSTRIER ASA
INDEPENDENT AUDITOR’S REPORT
We have reviewed the environmental information presented in Norske Skog’s 2014 Annual Report, pages 15 - 35 (“the Report”). The Report is the responsibility of and has been approved by the management of the Company. Our responsibility is to draw a conclusion based on our review.
We have based our work on the international standard ISAE 3000 “Assurance Engagements other than Audits or Reviews of Historical Financial Information”, issued by the International Auditing and Assurance Standards Board. The objective and scope of the engagement were agreed with the management of the Company and included those subject matters on which we have concluded below.
Based on an assessment of materiality and risks, our work included analytical procedures and interviews as well as a review on a sample basis of evidence supporting the subject matters.
We believe that our work provides an appropriate basis for us to conclude with a limited level of assurance on the subject matters. In such an engagement, less assurance is obtained than would be the case had an audit-level engagement been performed.
CONCLUSIONBased on our review, nothing has come to our attention causing us not to believe that:• The environmental aspects presented in the Report
comprise the most significant ones at corporate level.
• Norske Skog has applied procedures, as summarised on page 36, for the purpose of collecting, compiling and validating environmental data from its reporting units for inclusion in the Report.
• The aggregated information accumulated as a result of the procedures noted above is consistent with the data reported from reporting units and appropriately reflected in the Report.
• The environmental information for 2014 reported from a sample of two reporting units (Norske Skog Skogn and Norske Skog Boyer) was reported according to the procedures noted above and was consistent with the source documentation presented to us.
• Norske Skog applies a reporting practice for its environmental reporting aligned with the Global Reporting Initiative (GRI) Sustainability Reporting Guidelines, version G4, reporting principles. The GRI Index referred to on page 36 in the Report appropriately reflects where relevant information on each of the elements and performance indicators of the GRI guidelines is to be found within the Norske Skog Annual Report 2014. The UN Global Compact table referred to on page 36, appropriately reflects where relevant information is presented in the Norske Skog Annual Report 2014.
Oslo, 11 March 2015Deloitte AS
Eivind SkaugState Authorized Public Accountant
Frank DahlDeloitte Sustainability

ANNUAL REPORT 2014 I NORSKE SKOG 37
CORPORATE SOCIAL RESPONSIB IL ITY