sumatran elephant elephas maximus sumatranuseprints.bournemouth.ac.uk/31522/1/collins, nicola jane_...
TRANSCRIPT

Sumatran elephant Elephas maximus sumatranus
density and habitat use in relation to forest
characteristics in the Leuser Ecosystem,
North Sumatra
Nicola Jane Collins
This thesis is submitted in partial fulfilment of the requirements of the
degree Masters by Research (MRes).
January 2018
Bournemouth University

This copy of the thesis has been supplied on condition that anyone who
consults it is understood to recognise that its copyright rests with its
author and due acknowledgement must always be made of the use of
any material contained in, or derived from, the thesis.
1
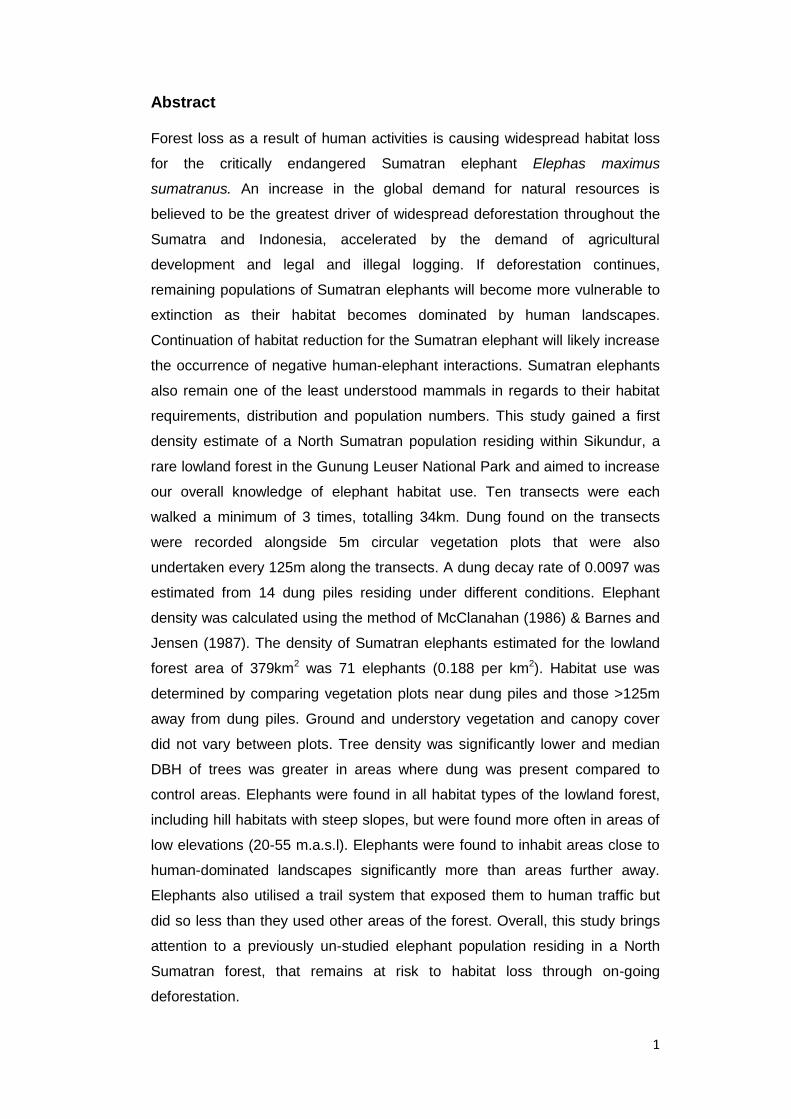
Abstract
Forest loss as a result of human activities is causing widespread habitat loss
for the critically endangered Sumatran elephant Elephas maximus
sumatranus. An increase in the global demand for natural resources is
believed to be the greatest driver of widespread deforestation throughout the
Sumatra and Indonesia, accelerated by the demand of agricultural
development and legal and illegal logging. If deforestation continues,
remaining populations of Sumatran elephants will become more vulnerable to
extinction as their habitat becomes dominated by human landscapes.
Continuation of habitat reduction for the Sumatran elephant will likely increase
the occurrence of negative human-elephant interactions. Sumatran elephants
also remain one of the least understood mammals in regards to their habitat
requirements, distribution and population numbers. This study gained a first
density estimate of a North Sumatran population residing within Sikundur, a
rare lowland forest in the Gunung Leuser National Park and aimed to increase
our overall knowledge of elephant habitat use. Ten transects were each
walked a minimum of 3 times, totalling 34km. Dung found on the transects
were recorded alongside 5m circular vegetation plots that were also
undertaken every 125m along the transects. A dung decay rate of 0.0097 was
estimated from 14 dung piles residing under different conditions. Elephant
density was calculated using the method of McClanahan (1986) & Barnes and
Jensen (1987). The density of Sumatran elephants estimated for the lowland
forest area of 379km2 was 71 elephants (0.188 per km2). Habitat use was
determined by comparing vegetation plots near dung piles and those >125m
away from dung piles. Ground and understory vegetation and canopy cover
did not vary between plots. Tree density was significantly lower and median
DBH of trees was greater in areas where dung was present compared to
control areas. Elephants were found in all habitat types of the lowland forest,
including hill habitats with steep slopes, but were found more often in areas of
low elevations (20-55 m.a.s.l). Elephants were found to inhabit areas close to
human-dominated landscapes significantly more than areas further away.
Elephants also utilised a trail system that exposed them to human traffic but
did so less than they used other areas of the forest. Overall, this study brings
attention to a previously un-studied elephant population residing in a North
Sumatran forest, that remains at risk to habitat loss through on-going
deforestation.
2
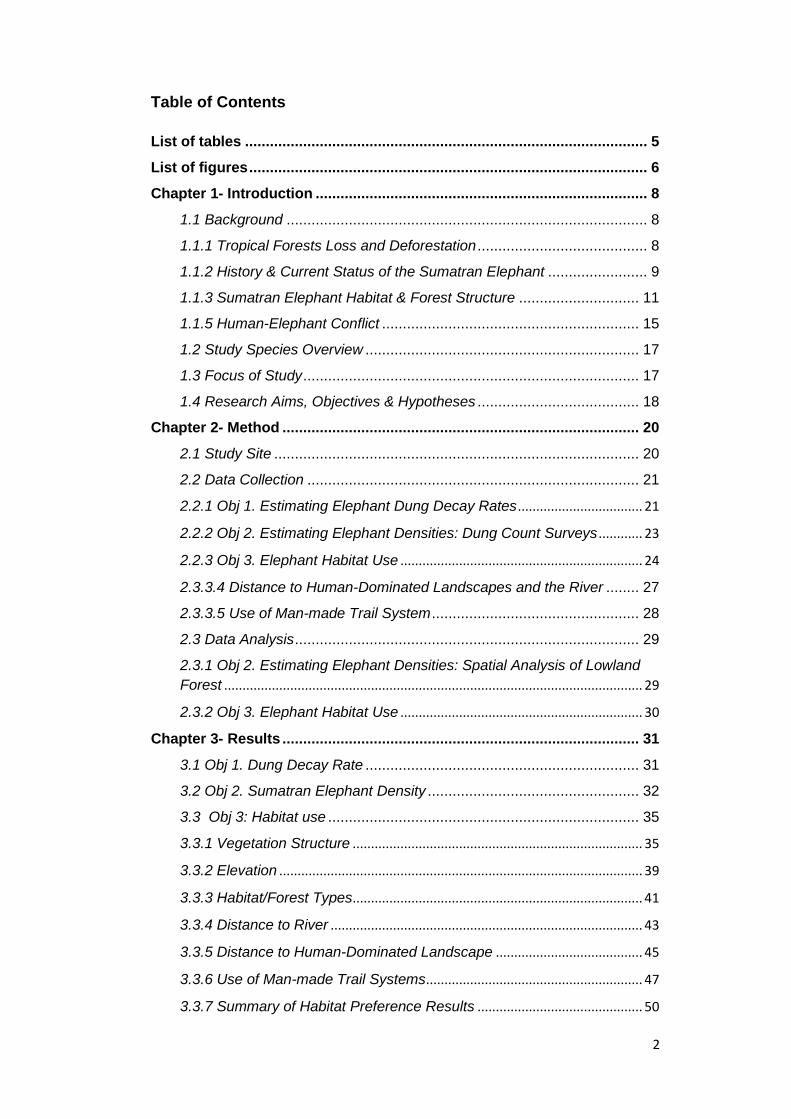
Table of Contents
List of tables ................................................................................................. 5
List of figures ................................................................................................ 6
Chapter 1- Introduction ................................................................................ 8
1.1 Background ....................................................................................... 8
1.1.1 Tropical Forests Loss and Deforestation ......................................... 8
1.1.2 History & Current Status of the Sumatran Elephant ........................ 9
1.1.3 Sumatran Elephant Habitat & Forest Structure ............................. 11
1.1.5 Human-Elephant Conflict .............................................................. 15
1.2 Study Species Overview .................................................................. 17
1.3 Focus of Study ................................................................................. 17
1.4 Research Aims, Objectives & Hypotheses ....................................... 18
Chapter 2- Method ...................................................................................... 20
2.1 Study Site ........................................................................................ 20
2.2 Data Collection ................................................................................ 21
2.2.1 Obj 1. Estimating Elephant Dung Decay Rates .................................. 21
2.2.2 Obj 2. Estimating Elephant Densities: Dung Count Surveys ............ 23
2.2.3 Obj 3. Elephant Habitat Use .................................................................. 24
2.3.3.4 Distance to Human-Dominated Landscapes and the River ........ 27
2.3.3.5 Use of Man-made Trail System .................................................. 28
2.3 Data Analysis ................................................................................... 29
2.3.1 Obj 2. Estimating Elephant Densities: Spatial Analysis of Lowland
Forest .................................................................................................................. 29
2.3.2 Obj 3. Elephant Habitat Use .................................................................. 30
Chapter 3- Results ...................................................................................... 31
3.1 Obj 1. Dung Decay Rate .................................................................. 31
3.2 Obj 2. Sumatran Elephant Density ................................................... 32
3.3 Obj 3: Habitat use ........................................................................... 35
3.3.1 Vegetation Structure ............................................................................... 35
3.3.2 Elevation ................................................................................................... 39
3.3.3 Habitat/Forest Types............................................................................... 41
3.3.4 Distance to River ..................................................................................... 43
3.3.5 Distance to Human-Dominated Landscape ........................................ 45
3.3.6 Use of Man-made Trail Systems ........................................................... 47
3.3.7 Summary of Habitat Preference Results ............................................. 50

3
Chapter 4- Discussion ................................................................................ 51
4.1 Sumatran Elephant Density Estimate ............................................... 51
4.2 Sumatran Elephant Habitat .............................................................. 53
4.2.1 Habitat/Forest Structure ......................................................................... 53
4.2.2 Elevation ................................................................................................... 54
4.2.3 Habitat Types & Distance to River ........................................................ 55
4.2.4 Distance to Human-Dominated Landscapes ...................................... 56
4.2.5 Use of Man-made Trail Systems ........................................................... 58
4.3 Implications for Forest & Sumatran Elephant Conservation ............. 59
4.4 Recommendations for Future Research........................................... 61
Chapter 5- Conclusion ................................................................................ 63
Chapter 6- Bibliography ............................................................................. 65
4
Acknowledgements
I would first like to acknowledge my supervisors Amanda Korstjens and Ross
Hill, not only for providing me with the opportunity to undertake this project, but
for the guidance and support throughout the entire process. I am incredibly
thankful for their patience and encouragement throughout all stages of the
project, both in Indonesia and in producing the thesis, and it does not go under
appreciated. I would like to extend my thanks to those who provided me the
opportunity to conduct research in Indonesia, including all Indonesian
authorities (RISTEKDIKTI, BKSDA, TNGL) and for granting the necessary
research permits. I appreciate the support provided by Dr. Abdullah, not only
for his role as counterpart for my research in Indonesia, but for the guidance
and support during the permit process and my research stay in Indonesia. I
would also like to thank the Universitas Syiah Kuala, Professor Nazamuddin
and the support provided by Dini and everyone at the international offices of
UnSyiah. Without their help this project would have been impossible. I‘d like
to thank the Sumatran Orangutan Conservation Programme of the Yayasan
Ecosistem Lestaria and PanEco for all their logistical support, friendship and
for allowing us to work at the Sikundur monitoring station. I‘d especially like to
thank SOCP‘s Matthew Nowak, for always being on hand to provide advice
and guidance throughout the whole process.
I‘d like to say a huge ‗terima kasih banyak‘ to all the field assistants in the
Sikundur field station, not only for their help but their friendship during my time
in Indonesia. I‘d particularly like to thank Supri and Suprayudi for their help in
beginning my elephant research, and Supri for continuing the dung monitoring
after I left Indonesia. Terima kasih Rikki, Ben, Whinn, Uchok, Yangsa, Dian
and Logga for their always being there to provide help when needed, and for
always making me laugh and feel at home in Sikundur. Special thanks go to
Chris Marsh and Meryl Thomas whom I started the Indonesian permit process
with, not only for their company and support during the entire process, but for
the laughs even in the most stressful moments. I would also like to extend my
thanks to my friend and co-worker Emma Hankinson, whose friendship and
overseas advice during my time in Indonesia was invaluable. I want to also
thank the LEAP team; Helen Slater, Kelly van Leeuwen, and Cici Alexander
for their discussions and help.
I would like to thank my close friends and family for their continued patience
and valuable support during the whole process. Lastly, I would like to say the
biggest thank you to my parents for always believing in me and supporting me
throughout all my endeavors. Which, without your constant love and support I
would never have been able to pursue and be where I am today.
5
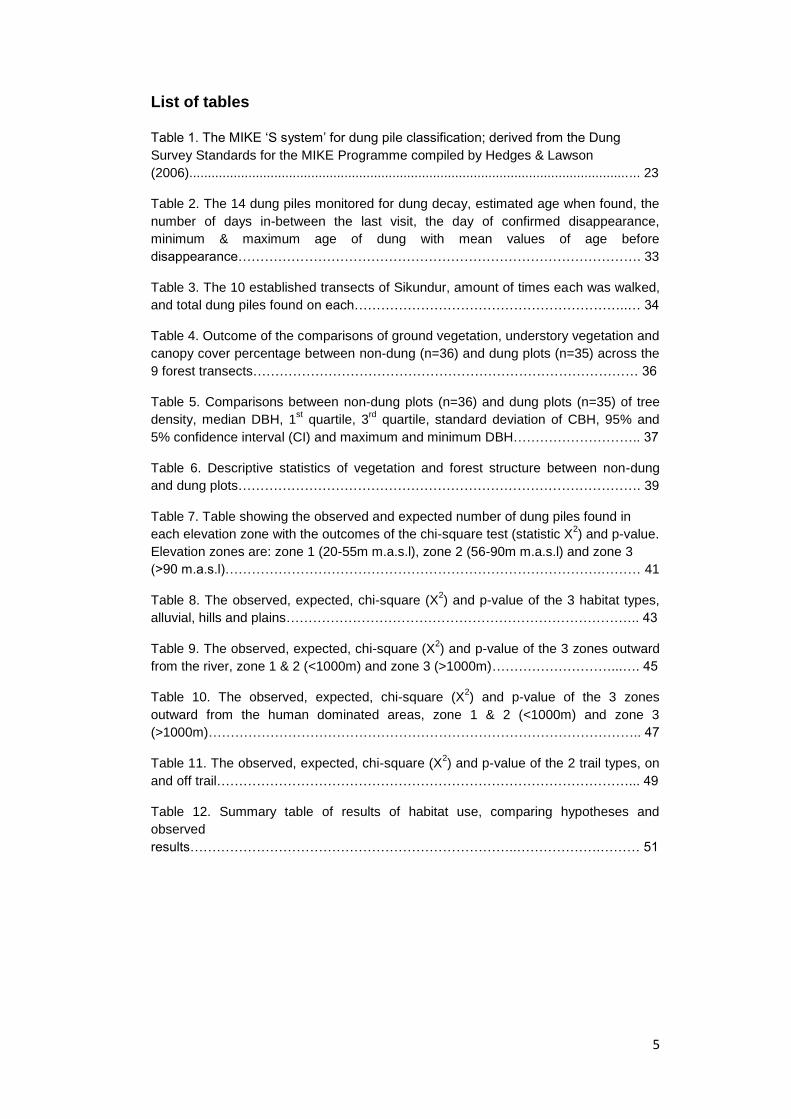
List of tables
Table 1. The MIKE ‗S system‘ for dung pile classification; derived from the Dung
Survey Standards for the MIKE Programme compiled by Hedges & Lawson
(2006).......................................................................................................................... 23
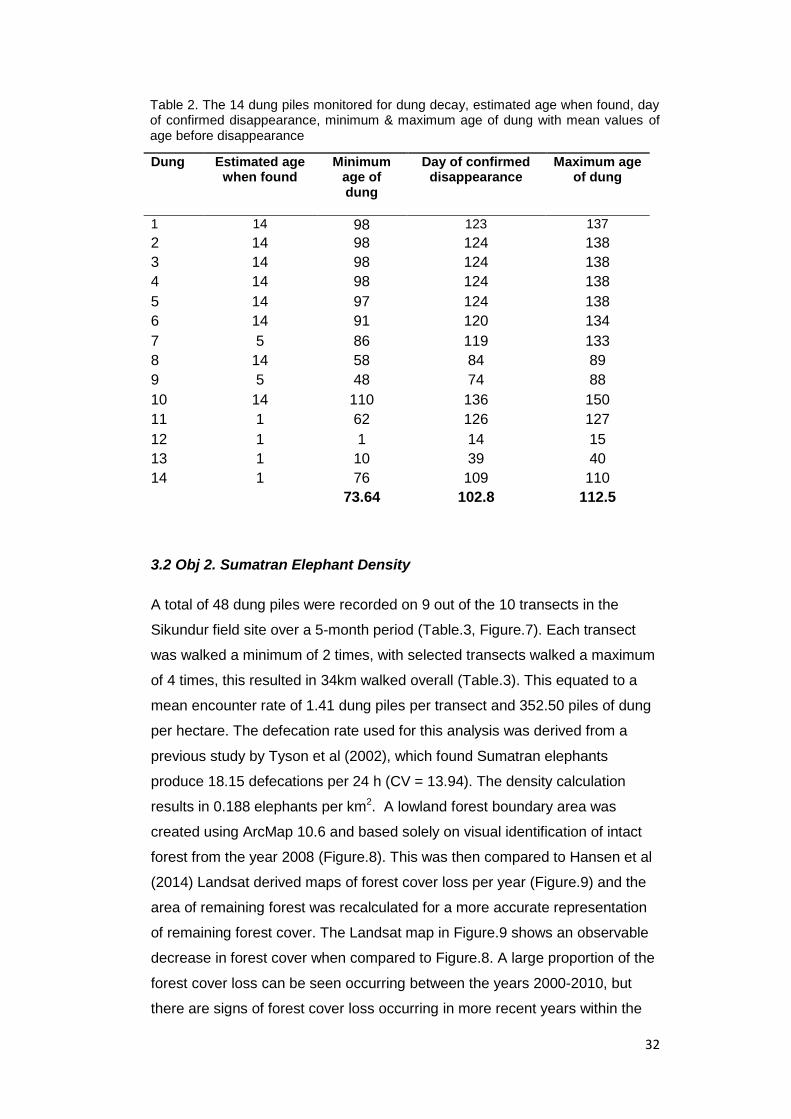
Table 2. The 14 dung piles monitored for dung decay, estimated age when found, the
number of days in-between the last visit, the day of confirmed disappearance,
minimum & maximum age of dung with mean values of age before
disappearance………………………………………………………………………………. 33
Table 3. The 10 established transects of Sikundur, amount of times each was walked,
and total dung piles found on each……………………………………………………..… 34
Table 4. Outcome of the comparisons of ground vegetation, understory vegetation and
canopy cover percentage between non-dung (n=36) and dung plots (n=35) across the
9 forest transects…………………………………………………………………………… 36
Table 5. Comparisons between non-dung plots (n=36) and dung plots (n=35) of tree
density, median DBH, 1st quartile, 3
rd quartile, standard deviation of CBH, 95% and
5% confidence interval (CI) and maximum and minimum DBH……………………….. 37
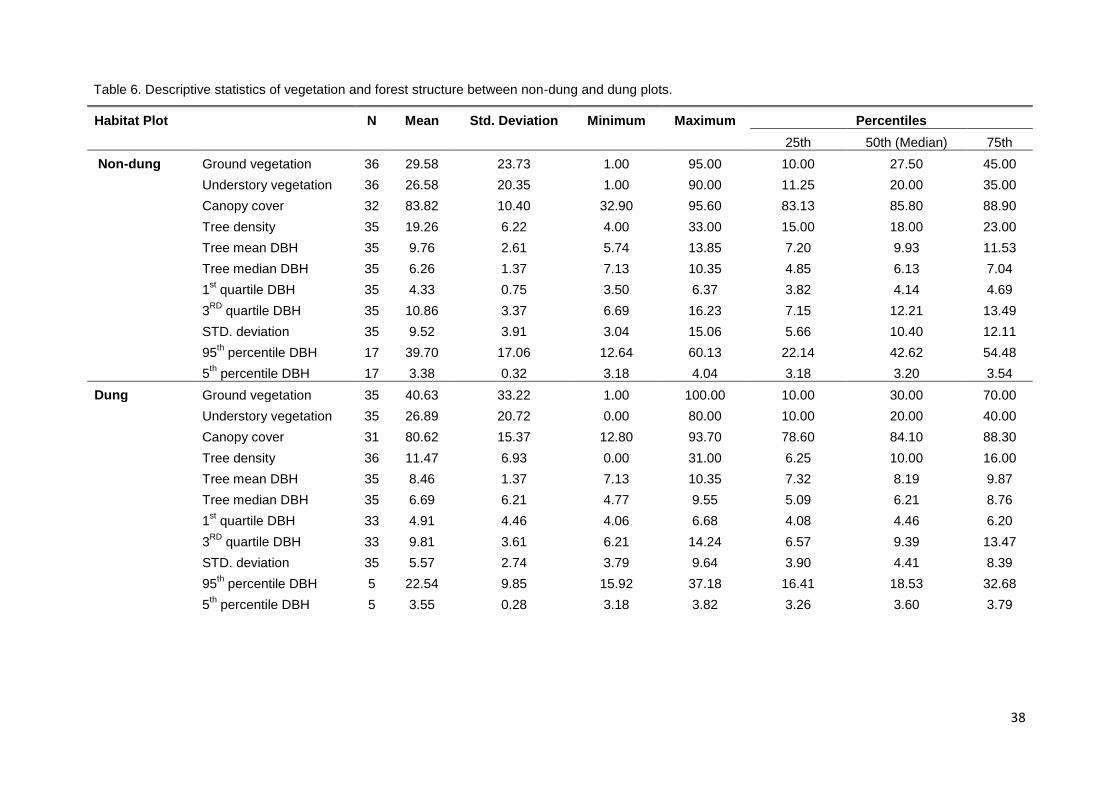
Table 6. Descriptive statistics of vegetation and forest structure between non-dung
and dung plots………………………………………………………………………………. 39
Table 7. Table showing the observed and expected number of dung piles found in
each elevation zone with the outcomes of the chi-square test (statistic X2) and p-value.
Elevation zones are: zone 1 (20-55m m.a.s.l), zone 2 (56-90m m.a.s.l) and zone 3
(>90 m.a.s.l)………………………………………………………………………….……… 41
Table 8. The observed, expected, chi-square (X2) and p-value of the 3 habitat types,
alluvial, hills and plains…………………………………………………………………….. 43
Table 9. The observed, expected, chi-square (X2) and p-value of the 3 zones outward
from the river, zone 1 & 2 (<1000m) and zone 3 (>1000m)………………………...…. 45
Table 10. The observed, expected, chi-square (X2) and p-value of the 3 zones
outward from the human dominated areas, zone 1 & 2 (<1000m) and zone 3
(>1000m)…………………………………………………………………………………….. 47
Table 11. The observed, expected, chi-square (X2) and p-value of the 2 trail types, on
and off trail…………………………………………………………………………………... 49
Table 12. Summary table of results of habitat use, comparing hypotheses and
observed
results………………………………………………………………..……………….……… 51
6
List of figures
Figure 1. The location of the Sikundur Monitoring post in relationship to the Gunung
Leuser National Park and the Leuser Ecosystem (SOCP 2015) ………………...…… 21
Figure 2. The habitat types of Sikundur, including Alluvial, Hills and Plains (personal
communication, Nowak, M., 2017). ……………………………………………………… 25
Figure 3. Elevation zones of Sikundur, including Zone 1 (20-55m a.s.l), Zone 2 (56-90
m.a.s.l) & Zone 3 Zone 3 (>90 m.a.s.l) derived from SRTM data (NASA 2017) …… 26
Figure 4. The 3 Zones outward from the human dominated landscapes, including
villages and plantations, Zone 1 & 2 (<1000m) and Zone 3 (>1000m)………………. 27
Figure 5. The 3 Zones outward from the river, Zone 1 & 2 (<1000m) and Zone 3
(>1000m) …………………………………………………………………………….……… 28
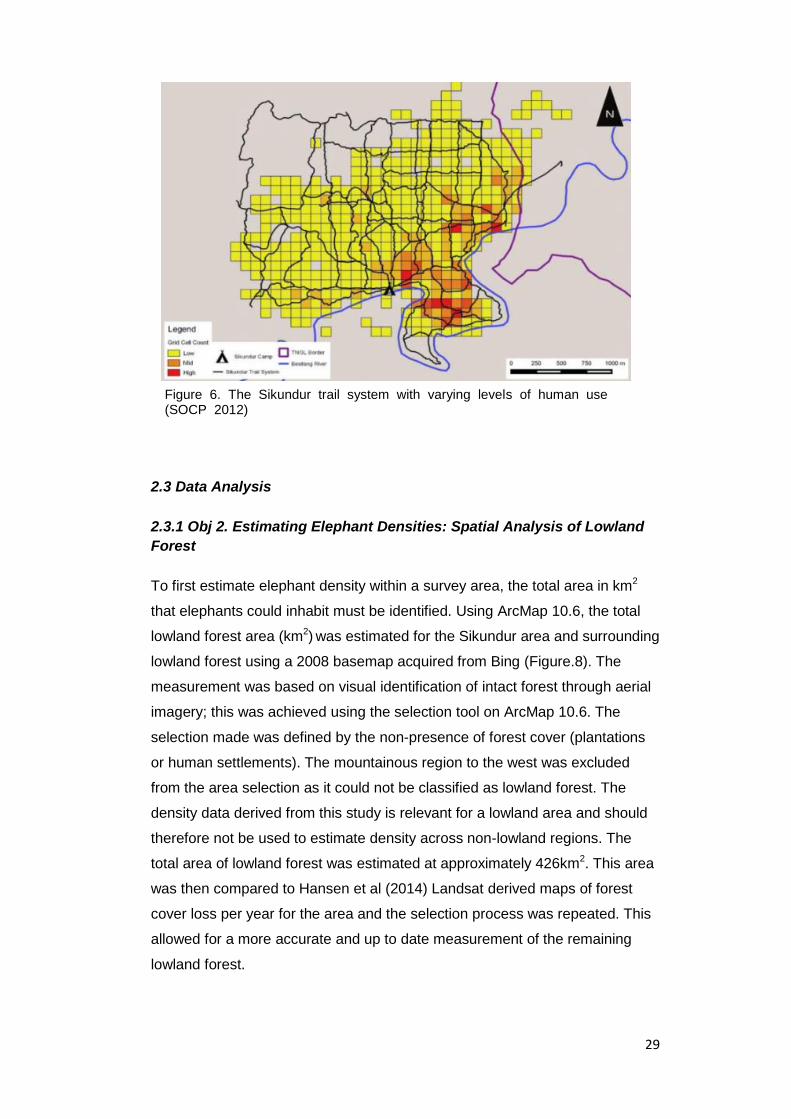
Figure 6. The Sikundur trail system with varying levels of human use (SOCP
2012)……………………………………………………………………………………….… 29
Figure 7. 10 established elephant transects and dung piles encountered in
Sikundur……………………………………………………………………………………... 34
Figure 8. Lowland forest area (426km2) surrounding the Sikundur field site derived in
2008………………………………………………………………………………………….. 34
Figure 9. Lowland forest area (379km2)
and Levels of forest cover loss from 2000-2016
(Hansen et al 2014)……………………………………………………………………..…. 34
Figure 10. Boxplot showing the percentage of ground vegetation, understory
vegetation and canopy cover between non-dung and dung plots of across the 9 forest
transects…………………………………………………………………………………….. 36
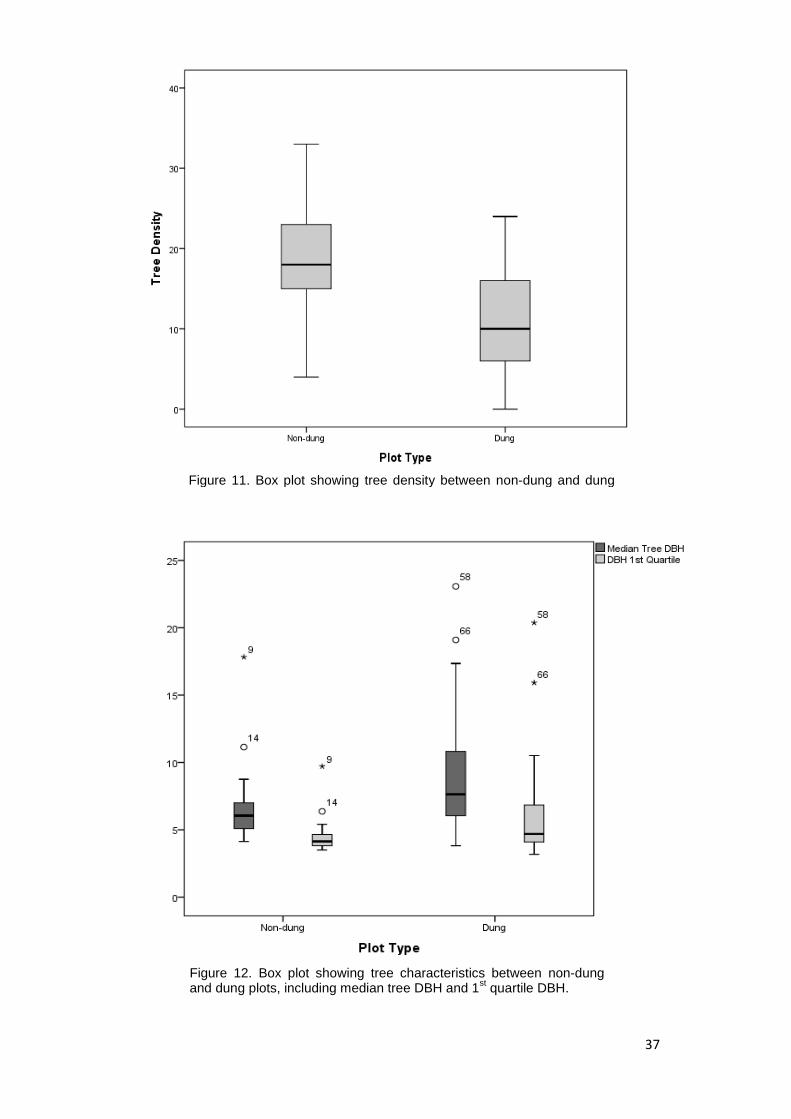
Figure 11. Box plot showing tree density between non-dung and dung plots
………………………………………………………………………………….…………..… 37
Figure 12. Box plot showing tree characteristics between non-dung and dung plots,
including median tree DBH and 1st quartile DBH.………………………………………. 37
Figure 13. Elevation (m a.s.l) values for dung versus non-dung plots and dung
plots..............................................................................................................................39
Figure 14. Map showing the 3 elevation zones of survey site, 3 elevation zones, zone
1 (20-55 m.a.s.l), zone 2 (56-90 m.a.s.l) and zone 3 (>90m m.a.s.l), transects (black
circles) and encountered dung (white circles)…………………………………………... 40
Figure 15. The total number of dung piles observed with expected values in each
elevation zones of survey site, zone 1 (20-55 m.a.s.l), zone 2 (56-90 m.a.s.l) and zone
3 (>90 m.a.s.l)…………………………………………………………………………….… 41
Figure 16. Map showing the 3 main habitat types of Sikundur, alluvial (middle band),
hills (left upper area) and plains (upper right area) ……………………….………….... 42
Figure 17. The total number of dung piles observed with expected values in each
habitat type, alluvial, hills and plains……………………………………………………... 43
7
Figure 18. Transects and encountered dung piles in all 3 zones outward from the river
(zone 1 & 2 (<1000m) and zone 3 (>1000m)………………………………………….… 44
Figure 19. The total number of dung piles encountered in all 3 zones outward from the
river with observed and expected
values………………………………………………......................................................... 45
Figure 20. Transects and encountered dung piles in all 3 zones outward from the
human dominated areas such as villages and plantations (zone 1 & 2 (<1000m) and
zone 3 (>1000m)……………………………………………………………………………. 46
Figure 21. The total number of dung piles encountered in all 3 zones outward from
human dominated zones with observed and expected values……………………….…47
Figure 22. The trail system of Sikundur and dung piles encountered on and off the
trail………………………………………………………………………………………….... 48
Figure 23. The total number of dung piles encountered on and off trail with observed
and expected values……………………………………………………………….………. 49
8
Chapter 1- Introduction
1.1 Background
1.1.1 Tropical Forests Loss and Deforestation
Tropical forests are renowned for being the richest and most biodiverse
ecosystems on the planet. These ecosystems are home to a multitude of
endemic species and are frequently referred to as ‗biodiversity hot spots‘
(Gentry 1992).A large percentage of the world‘s tropical forests can be found
in South-east Asia. These forests contain an abundance of highly biodiverse
ecosystems and contain an array of endemic flora and fauna (FAO 1995,
Gentry 1992). At present however, these forests are at most risk to
anthropogenic impacts such as large-scale deforestation and biodiversity loss
(Kinnaird et al 2003). South-east Asia is at risk of losing more than half of its
original forest cover and 13-85% of its biodiversity by 2100 due to dramatically
reduced and fragmented forest throughout the region (Achard et al 2002,
Sodhi et al 2004). Urbanization and human expansion are the main causes for
forest loss, but concessions such as legal and illegal logging, agriculture and
monoculture plantations are believed to be the driving force of the rapid
widespread deforestation that is occurring today (Sodhi et al 2004).
From 1950, the commercial logging industry was prevalent throughout South-
east Asia and as the demand for dipterocarp tree species in Asia increased,
many forests were intensely logged (Flint 1994). Although commercial logging
has since reduced, legal and illegal logging still occurs in protected areas and
elsewhere. Selective logging has been found to alter forest dynamics through
the recurrent removal of a specific species (Chapman & Chapman 1997). This
modifies forest canopies and can impact the natural mechanisms of tropical
forests, negatively affecting species and species diversity (Foody & Cutler
2003, Whitmore 1998, Wilcove et al 2013). Although forest regeneration is
possible and has occurred previously in forests that were once logged,
successful regeneration depends largely on the degree of logging and can
take between 30 and 40 years to show signs of recovery (Okuda et al 2002,
Rutten et al 2015). Within the last 30 years, the palm oil industry has become
one of the most widespread and destructive concessions within South-east
Asia, far exceeding the damage caused by legal and illegal logging. The oil
palm (Elaeis guineensis) industry has spread rapidly across South-east Asia,
9
growing from only 3.6 million ha in 1961 to 13.2 million ha in 2006 (FAO
2007). Two of the world‘s largest palm oil countries are currently comprised of
Malaysia with 3.6 million ha and Indonesia which holds 4.1 million ha of palm
oil plantations (FAO 2007, Margona 2012).
More than half of the expansion of the palm oil industry in Indonesia and
Malaysia from the years 1990-2005 is now believed to have occurred to the
detriment of biologically rich primary and secondary forests (Koh & Wilcove
2008). Indonesia has experienced the greatest rates of deforestation globally,
undergoing a 70% reduction in primary forest cover within the last 60 years
and 4.1 million ha of the country has been converted to plantations, far
exceeding that of Brazil‘s deforestation rates (Henders et al 2015, Margona et
al 2014, Vijay et al 2016). Land-use change for agricultural or plantation
purposes is by far the most intense form of disturbance as often plots of land
will be cut down and cleared. The conversion of forests for mono-culture
concessions, such as palm oil, are detrimental to biodiversity. This detriment
occurs not only through the removal of entire sections of forest, but palm oil
has also been found to deplete soil nutrients entirely. This consequently
leaves areas of land totally unrecoverable, reducing any hope of restoring it to
its original state (Grubb et al 1994, Sodhi et al 2010a). In addition to the
potential loss of highly biodiverse and rich ecosystems, South-east Asia‘s
tropical forests also play a key role in the global carbon cycle as they store
over half of the world‘s terrestrial carbon (Sodhi et al 2004). Therefore, as
deforestation and forest cover loss continue in the tropics, carbon emissions
stored within these forests are quickly being released into the atmosphere,
contributing to greenhouse gas emissions and increasing the possibility of
serious regional and global consequences (Miettinen et al 2011, van der Werf
et al 2009).
1.1.2 History & Current Status of the Sumatran Elephant
As the demand for such concessions continues to rise, the demand for land
needed to produce it consequently increases and important habitat for many
species is lost (Doyle et al 2010, Koh & Wilcove 2008, Sitompul et al 2013a).
Rapid deforestation and growing pressures from human-wildlife conflict are
severely affecting wildlife on the Indonesian island of Sumatra, where some of
the fastest rates of tropical forest conversion are on-going. As a
consequence, many of Sumatra‘s endemic and endangered species, such as
10
the Sumatran elephant Elephas maximus sumatranus, are at risk (Ling 2016,
Margona et al 2014, Miettinen et al 2011).
The Sumatran elephant is one of three recognised sub-species of the Asian
elephant, endemic to the Indonesian island of Sumatra (Shoshani & Eisenberg
1982, Corbet & Hill 1992). Before the 1900s, the Sumatran elephant was
documented as being widespread across Sumatra (Reid 2005). During the
16th and 17th century in the province of Aceh, Sumatran elephants were often
used in palace traditions and revered as cultural and ceremonial symbols of
status by the sultans, by which a tradition of elephant taming for court and
ceremony was undertaken (Lair 1997, van Heurn 1929). When the Dutch
colonisation began in 1600, Sumatran elephants were used mainly as draft
animals or were captured or killed as development for palm oil, rubber, sugar
and tobacco plantations took place (Azmi & Gunaryadi 2011). By 1900, much
of Sumatra‘s primary forest had begun to decrease with the widespread
expansion of agricultural settlement and growth in human populations,
resulting in the considerable loss of Sumatran forest (Sukumar & Santiapillai
1996). Populations of Sumatran elephants had already decreased significantly
by 1931 and the populations continued to decline along with over half of their
habitat over the following 60 years, leading to the species being officially listed
in Appendix I of the Convention on International Trade in Endangered Species
of Wild Flora and Fauna (CITES) (Santiapillai & Jackson 1990, Soehartono et
al 2007a). In the early 1980s, legal captures of Sumatran elephants occurred
in conjunction with government policies to mitigate the rising human- elephant
conflict in Sumatra; this resulted in numerous elephant training camps and
extraction of wild elephants from their native populations (Azmi & Gunaryadi
2011). In 1985, the first Sumatran elephant survey was undertaken, with the
total population estimated at 2800-4800 individuals within 44 populations
across Sumatra (Blouch & Haryanto 1984, Blouch & Simbolon 1985). Two
decades onwards in 2007, population estimates had reduced by
approximately 50%, with 2400-2800 individuals in 25 fragmented populations.
However, there is speculation that the populations numbers are much lower at
present, with only 1180 individuals thought left to be remaining in the wild
(Blake & Hedges 2004, Soehartono et al 2007b, Santiapillai & Sukumar 2006,
Sukumar 2006).
Presently, 10% of Sumatra‘s total area is protected by 11 national parks and
reserves, offering moderate protection against illegal activities such as
11
poaching, illegal logging and creation of illegal plantations. Outside of these
protected areas an estimated 85% optimal elephant habitat remains, but is left
unprotected and at risk (Santiapillai & Jackson 1990). Habitat that does fall
under this protection has also been found lacking in enforcement and
prosecution (Santiapillai & Jackson 1990, Jepson et al 2001 & Robertson &
van Schaik 2001). Populations now remain in very scattered herds across the
8 provinces of Sumatra, but out of all 8 provinces, the distribution of elephants
in North Sumatra remains the least understood and most under-studied (Azmi
& Gunaryadi 2011, Blouch & Haryanto 1984, Blouch & Simbolon 1985). As a
consequence of the human expansion and colonisation in Sumatra over the
course of several hundred years, the Sumatran elephant is now classified as
critically endangered and declining by the International Union for the
Conservation of Nature (IUCN) (Azmi & Gunaryadi 2011, Gopala et al 2011,
CITES 2017). The Sumatran elephant continues to remain vulnerable to
further declines, which may even result in the potential loss of the sub-species
in the future if no action is taken to better understand and protect both the
elephants and their habitat.
1.1.3 Sumatran Elephant Habitat & Forest Structure
Despite an increase in the research and conservation efforts of the Sumatran
elephant in the last three decades, there is still large gaps in our overall
knowledge of the sub-species. Difficulties in observing forest elephants
directly are often encountered due to dense forest environments and their
elusive nature, therefore dung count surveys are a common method used for
data collection in relation to density estimates and habitat studies (Mwambola
et al 2016). The recce or reconnaissance transect method of Walsh & White
(1999) is now a widely adopted approach used when conducting transects.
The recce transect method allows for flexibility regarding the compass bearing
as the bearing is followed only marginally, dissimilar to the line transect
method where a straight line is required throughout. The recce transect
method states that the bearing is followed but the path of least resistance
should be taken when possible, by means of trails or natural features such as
waterways or forest openings (Walsh & White 1999). To estimate elephant
density effectively from dung count surveys, data on the rates of elephant
defecation and dung-pile decay is required (Hedges & Lawson 2006,
Vanleeuwe & Probert 2014). Dung-pile decay rate will vary depending on
numerous environmental factors, including rainfall, sunlight exposure, canopy
12
cover and temperature, all of which can greatly vary per season and site
(Barnes & Dunn 2002, White 1995). Rates of decay are also dependent on
biological factors such as diet composition, which can have overall resulting
effects on the composition of dung and how quickly it deteriorates; it is
therefore important to conduct individual dung decay studies for per site when
undertaking density studies (Hedges & Lawson 2006, White 1995).
As there was previously less data on the diet, ecology and habitat
requirements of the Sumatran elephant, the sub-species was often associated
with other Asian elephant species due to the lack of specific data, and studies
conducted on the sub-species specifically often focused primarily on density
estimates, population structure and human elephant conflict and within
intensely studied sites in Sumatra. Fortunately, within the last decade, there
has been an increase in Sumatran elephant research occurring in the lesser
studied areas of Sumatra, focusing on habitat use, suitability and dung decay
(Hedges & Lawson 2006, Moßbrucker 2016b, Rizwar et al 2014, Rood et al
2010, Sitompul et al 2013a, Sitompul et al 2013b, Zahrah et al 2014,
Sulistyawan et al 2017).
Sumatran elephants have been found to traverse their environment based on
the availability of food, water, canopy cover, local climate, seasonality,
topography and habitat connectivity (Kumar et al 2010, Sukumar 2006).
Previous research has shown that Sumatran elephants will utilise both natural
primary forest and disturbed secondary forest, but often prefer secondary
forest, despite being exposed to human disturbance such as logging.
Secondary forests have been found to contain an abundance of fast growing
elephant food and a diversity of mosaic habitats, including edge habitats
(Olivier 1978, Hedges et al 2005, Zahrah et al 2014, Rood et al 2010,
Seidensticker, 1984, Santiapillai & Suprahman 1995). Elephants are generalist
feeders and possess wide-ranging diets, consuming many grass and woody
plant species depending on seasonality (Owen-Smith, 1988). Previous studies
have shown that Sumatran elephants prefer to consume young and quick
growing woody vegetation, between 1-32cm diameter at breast height (DBH),
but favour saplings between 2-4cm DBH (Santiapillai & Suprahman 1995,
Owen-Smith, 1988). As elephants require large amounts of water to drink,
they will often show a preference for alluvial areas such as rivers or streams
(Santiapillai 1984, Sukumar 1989 & Chong 2005). The influence of altitude
and slope on elephant distribution is frequently debated; in the past elephants
13
were believed to solely favour lowland forests, and have their movements
constrained by high slopes and elevation (Hedges et al 2005, Pradhan &
Wegge 2007). Studies have shown that elephants occur most frequently
between altitudes of 300-500 metres above sea level (m.a.s.l) and below 300
m.a.s.l (Zahrah et al 2014). Sumatran elephants have however been observed
occurring in highland and mountainous forests of up to 1600 m.a.s.l (Rood et
al 2010). These areas have been found to contain valleys which encompass
high productivity forests and natural waterways that elephants utilise (Rood et
al 2010, Pan et al 2009). It is therefore likely that, although elephants prefer
flat lowland forests, they are not constrained by high elevations such as
mountainous areas. Rood et al (2010) did find that the terrain ruggedness of
an area will impact general distribution of elephants; therefore areas with
steep slopes may be less favourable than areas without.
During the day Sumatran elephants have been observed undertaking most of
their activities beneath canopy cover compared to open areas (Sitompul et al
2013). When elephants do venture from underneath canopy cover, it is often
to pasture within grassland or scrub areas and occurs predominantly when the
weather is cloudier (Sitompul 2011, Zahrah et al 2014). Ideal canopy cover is
expected to range between 20%-60% and not above 80% as ground flora and
potential elephant food will be greater in areas with a sparser canopy (Zahrah
et al 2014). Sumatran elephants have been observed inhabiting forest edges
more often than the interior of the forest (Sitompul et al 2013, Rood et al
2010), however, this is contrasted by previous research conducted by Kinnaird
et al (2003) which observed elephants avoiding forest edges of up to 3km,
suggesting that elephants favour undisturbed forest. Nonetheless, as forest
edges are typically rich in new growth of ground flora, they provide elephants
with an abundance of food (Sukumar, 1989, 1990; Zhang & Wang, 2003). This
abundance of elephant food located around forest edges may explain why
elephants are often observed near human-dominated landscapes, however it
is unclear whether it is also influenced by lack of food or space within the
forest that causes this behaviour. Although elephants are believed to avoid
areas with increased human population numbers (Graham et al 2009, Rood et
al 2011, Songhurst et al 2015), deforestation and habitat loss may cause an
increase in the occurrence of elephants near human landscapes in the search
for resources (Granados et al 2012)
14
1.1.4 Response and Consequences of Habitat Loss
The large-scale conversion of forests to monoculture plantations, farmland
and urban areas has drastically reduced the available habitat for many
species in Sumatra. As a consequence of habitat and forest reduction, the
distribution of many large bodied and wide-ranging species, such as the
Sumatran elephant, have been compressed within human dominated
landscapes. Elephants require large home ranges, and the Sumatran elephant
home range is estimated to be between 275km2 and 1352km2 (Moβbrucker et
al 2016a). However, the increase in human expansion through concession
activities such as monoculture plantations is reducing the viable habitat for
Sumatran elephants and their contact with humans is increasing. Elephants
are known to suffer the costs of habitat loss much more rapidly compared with
other species, and therefore populations of the Sumatran elephant are now at
an increased risk of becoming fragmented and pushed into ‗pocketed herds‘
as viable habitat continues to decrease (Olivier 1978, Santiapillai and Jackson
1990). If population numbers continue to decrease and Sumatran elephants
are pushed into small isolated populations, genetic diversity will become an
important factor in the survivability of the species (Frankham et al 2002). In
previous studies, the minimum viable population of Asian elephants with a
high probability of survival was believed to be between 100-200 individuals,
but this depends largely on demography, sex ratio and local ecological
pressures (Moβbrucker et al 2016b, Sukumar 1993). As numbers of Sumatran
elephants decrease, the possibility for skewed sex ratios and inbreeding
becomes more prevalent and extinction of the species becomes much more
likely in the future (Moβbrucker et al 2016, Vidya et al 2007).
If elephant habitat continues to decline, not only will population numbers drop
significantly, resulting in the possible extinction of the species, but resulting
effects on their ecosystems could occur. Elephants are firmly recognised as
‗ecosystem engineers‘, undertaking important maintenance roles in forest
ecosystems and influencing forest dynamics through the modification of the
physical environment (Jones et al 1994, Wright & Jones 2006). Elephants
have been shown to indirectly influence microhabitat selection of other species
through direct and indirect modifications. For example, through the up-rooting
or damaging of trees and vegetation, elephants can provide natural trails
through the forest that are used by other species, create micro-habitats for
smaller species, and can cause an increase of heterogeneity of the forest

15
through creation of tree canopy gaps (Valeix et al 2011, Haynes 2012, Pringle
2008). Elephants are also known to assist in seed dispersal and germination,
for example forest elephants in Africa have been widely studied to disperse a
high diversity of seeds over large distances, maintaining tree diversity and
assisting in ecosystem functioning (Blake et al 2009, Campos-Arceiz & Blake
2011). As elephants are also found to be food species selective, they can
greatly influence the overall composition of their environment (Sukumar, 2003,
Kitamura, Yumoto, Poonswad, & Wohandee 2007). Although less is known
regarding the role of Asian elephants in seed dispersal when compared to
their African counterparts, a high proportion of the seeds ingested by Asian
elephants are defecated intact, and in viable conditions for germination,
therefore they may play a larger role in seed dispersal and forest diversity than
is understood (Campos-Arceiz et al 2008). Due to their large home range size,
elephants are also appointed as umbrella species within ecosystems. An
umbrella species benefits other species through the process of their
conservation and the overall protection of their habitat (Entwistle & Dunstone
2000).
1.1.5 Human-Elephant Conflict
Human wildlife conflict (HWC) is defined as an interaction between humans
and wildlife that can have adverse negative effects upon one another, with the
overall capacity to impact human social, cultural and economic livelihoods and
compromise vulnerable species (Conover 2002, Parker 2007). The occurrence
of HWC is not perceived as a new phenomenon, interactions between humans
and wildlife have been known to occur for millennia, typically taking place
when humans live in close proximity to wildlife (Woodroffe et al 2005).
However, within recent decades, interactions between humans and wildlife
have been observed increasing in frequency and severity due to increased
spread of humans, planting of crops and the reduction and fragmentation of
habitat for the native wildlife and thus proximity between wildlife and humans
is often increasing (Lamarque et al 2009, Perera 2009). Asian elephants are
particularly vulnerable to habitat loss and HWC as they possess large home
ranges and a preference for lowland forests, which at present are most at risk
to deforestation (Hedges et al 2005, Perera 2009, Rood 2010, Sitompul et al
2013). Negative interactions between humans and elephants are currently
prevalent on the island of Sumatra, where destruction of Sumatran elephant
16
habitat through conversion of land into agricultural or plantation areas has
vastly increased contact between humans and elephants, resulting in reports
of crop raiding, poaching and death/injury to both humans and elephants
(Doyle et al 2010, Hoare 1999a, Nyhus et al 2000).
Combined with extensive habitat loss, human elephant conflict (HEC) is
believed to be one of the major threats faced in the conservation of the
Sumatran elephant, reducing local support for the protection of the species by
increasing negative perceptions (Suba et al 2017). Negative perceptions have
been found primarily to be influenced by recurrent crop raiding incidents, lack
of effective mitigation strategies and frustration from lack of compensation
when incidents occur (Nyphus et al 2000, Suba et al 2017). The mitigation
strategies that have previously been attempted to lessen HEC in Indonesia,
and elsewhere, often only bring short term resolution, yielding varying results
in effectiveness (Nyphus et al 2000, Hoare 1999b). It is now believed that
certain mitigation strategies may even result in greater detriment to the local
reputation of the elephants and may contribute to the declining numbers;
these include capturing troublesome elephants, translocation, elephant drives
and restrictions of range (Fernando & Pastorini 2011).
As habitat for Sumatran elephants decreases due to the expansion of human
settlements and monoculture plantations (Achard et al 2002, Sodhi et al
2004), it is more likely that the proximity between humans and elephants will
intensify due to habitat loss, understanding how elephants respond are
distributed in relation to human-dominated landscapes is therefore crucial in
the conservation of the species. It is evident that human-elephant interactions
are occurring in Sumatra, but we need a further understanding of the presence
of elephants around human-dominated landscapes and what the influencing
factors are for this distribution. This understanding could be vital in reducing
human-elephant conflict, improving elephant conservation strategies and
improve the well-being and livelihoods of the local people that live beside them
(Child 1995). Improved enforcement in optimal areas of elephant habitat are
similarly in much need of improvement, ideally in both protected and
unprotected areas, to reduce poaching and illegal activities at these
boundaries. An overall aim to increase our knowledge of elephant distribution
around human-dominated areas could help reduce or mitigate the interactions
17
between local people and the elephants, ultimately helping to reduce conflicts
and improving the conservation of the Sumatran elephant as a whole.
1.2 Study Species Overview
The Sumatran elephant Elephas maximus sumatranus is one of three
recognised sub-species of the Asian elephant Elephas maximus, alongside
the Indian elephant (Elephas maximus indicus), Sri Lankan elephant (Elephas
maximus maximus), and the Bornean elephant (Elephas maximus borneensis)
(Shoshani and Eisenberg 1982). Together with their African counterparts,
these elephants comprise the few remaining mega-herbivores on Earth
(Galetti et al 2017). The Sumatran elephant is endemic to the Indonesian
island of Sumatra, defined as an Evolutionary Significant Unit (ESU), and
regarded as an evolutionary important sub-species (Flesicher et al 2001). The
Sumatran elephant is a generalist feeder that possesses wide-ranging diets,
consuming many grass, and woody plant species. They also require large
amounts of water to drink, often favouring areas close to water resources,
such as rivers or streams (Owen-Smith 1988, Santiapillai 1984, Sukumar 1989
& Chong 2005). Similar to other Asian elephants, Sumatran elephants live
within multi-tiered social systems and are comprised of individuals living in
matriarchal groups. Family units are often comprised of 4-8 individuals at a
time but will often congregate in groups of up to 45 individuals ((Sukumar &
Santiapillai 1996). The range of the species is believed to be constrained by
the overall availability of viable habitat, which will depend largely on factors
including the availability of food and water, canopy cover, climate, human
activity and topography (Kumar et al 2010, Sukumar 2006). Only a limited
number of studies have been conducted regarding the home range of the
Sumatran elephant, but this is likely to range from as low as 95km2 up to
1352km2 and will vary depending on the amount of habitat availability and
human encroachment (Moβrucker et al 2016a, Sitompul et al 2013 Olivier
1978, Sukumar 2006).
1.3 Focus of Study
The Sumatran elephant is currently classified as ‗critically endangered and
declining‘ by the IUCN (International Union for the Conservation of Nature),
having lost over half of their former habitat over the last 60 years (Corbet & Hill
1992, Gopala et al 2011, Santiapillai & Jackson 1990, Shoshani & Eisenberg
18
1982, Soehartono et al 2007a). Despite an increase in overall conservation
effort regarding the Sumatran elephant over the last few decades, there are
still large gaps in overall knowledge regarding their distribution, habitat
requirements and population numbers (Azmi & Gunaryadi 2011). National
population estimates of Sumatran elephants have been attempted in the past,
however these estimates are primarily derived from a handful of intensely
studied sites within national parks or are now outdated (Hedges et al 2005).
Fewer studies have occurred in the northern provinces of Sumatra, such as
Aceh and North Sumatra where the Leuser Ecosystem and Gunung Leuser
National Park (GLNP) are situated (HAkA 2017, McCarthy 2000). To
effectively conserve the Sumatran elephant, it is imperative that we achieve a
greater understanding of the current population size of elephants located
within lesser studied sites, such as North Sumatra and the Leuser Ecosystem
(IUCN/SSC Asian Elephant Specialist Group 2017). It is also crucial to better
understand the Sumatran elephant in terms of its habitat preferences,
distribution within forests and their distribution in relation to human dominated
landscapes as deforestation and human encroachment continues.
1.4 Research Aims, Objectives & Hypotheses
The aim of this study is to gain knowledge on the population status of the
Sumatran elephant in the Leuser Ecosystem and attain a greater scientific
understanding of the habitat requirements of these elephants to adequately
conserve the species. This knowledge will not only enhance our current
understanding of the distribution and habitat requirements of the Sumatran
elephant, but also provide local Indonesian conservation agencies with the
scientific understanding to support their conservation efforts of this critically
endangered species. This will be the first study on elephant population density
and habitat use of the population in Sikundur, North Sumatra. Habitat use is
studied considering the influence of forest characteristics on the overall
distribution of the species. These characteristics will not only include forest
features, but also proximity to human-dominated landscapes, including
villages and intensely used man-made trail systems. The study also aims to
classify the dung decay rate of Sumatran elephants for the area of Sikundur,
not just for this study but for future studies conducted in the area.

19
The specific objectives of this study are as follows:
Obj. 1. Identify dung decay rates in different environments to assist in
determining population size, such as under canopy/not under canopy,
using wild elephant samples and determine the overall dung
deterioration rate in Sikundur.
Obj. 2. Establish a first estimate of elephant density in Sikundur by
following 1km transects in which elephant dung is counted and its
geographic locations recorded via GPS.
Obj. 3. Determine the types of habitat that are associated with the
greatest elephant activity in Sikundur by recording various
characteristics (such as human activity and landscape modifications,
tree, vegetation, habitat type and elevation data) systematically along
transects and when signs of elephant presence are encountered.
Habitat is also described in view of the use of man-made trail systems
and proximity to human-dominated landscapes.
The proposed hypotheses for this research are therefore:
H1- Forest structure will vary between vegetation plots. As Sumatran
elephants are understood to prefer secondary forests, a higher density of trees
and a smaller DBH (1-32cm) is expected, along with a mid-range of canopy
cover. A preference to a sparser canopy is also expected to be seen.
H2- Elephants will be found in areas of high elevations, despite presence of
steep slopes, but show an overall preference to areas of lower elevations.
H3- A preference to alluvial habitats will be seen, and elephants will be found
more frequently in areas close to water.
H4- Elephants avoid human-dominated landscapes such as villages,
plantations or heavily trafficked human areas, such as trail systems.
20
Chapter 2- Method
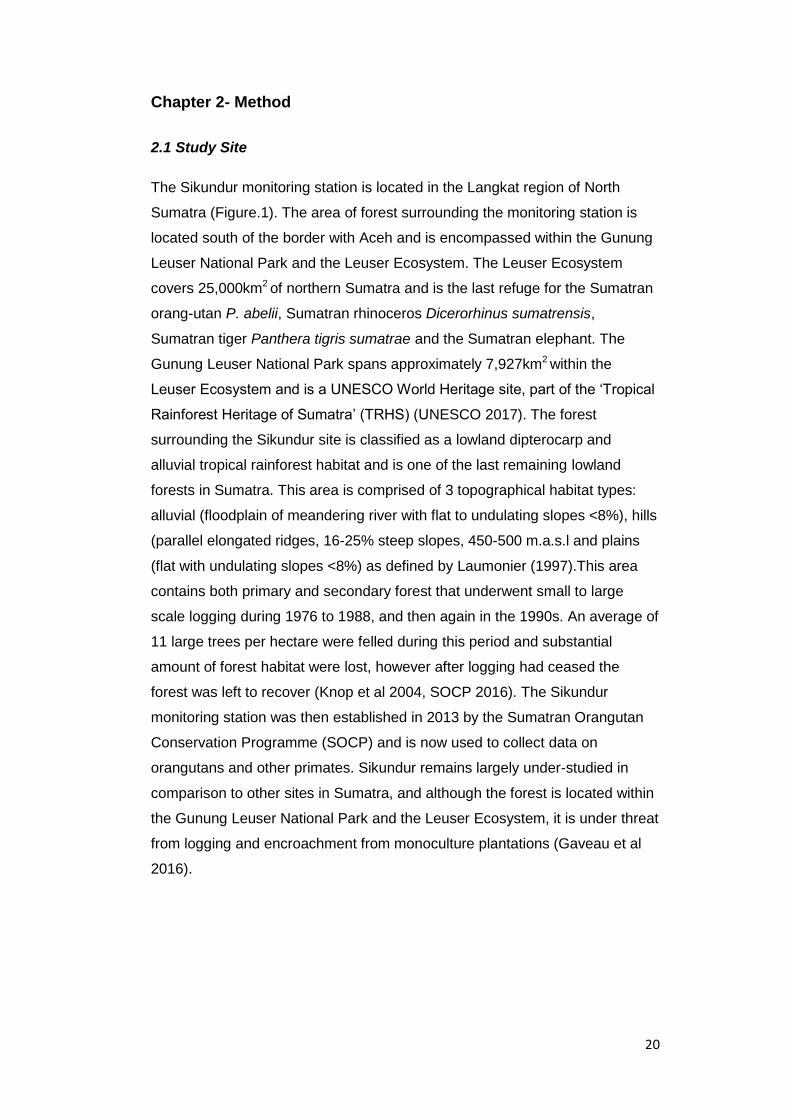
2.1 Study Site
The Sikundur monitoring station is located in the Langkat region of North
Sumatra (Figure.1). The area of forest surrounding the monitoring station is
located south of the border with Aceh and is encompassed within the Gunung
Leuser National Park and the Leuser Ecosystem. The Leuser Ecosystem
covers 25,000km2 of northern Sumatra and is the last refuge for the Sumatran
orang-utan P. abelii, Sumatran rhinoceros Dicerorhinus sumatrensis,
Sumatran tiger Panthera tigris sumatrae and the Sumatran elephant. The
Gunung Leuser National Park spans approximately 7,927km2 within the
Leuser Ecosystem and is a UNESCO World Heritage site, part of the ‗Tropical
Rainforest Heritage of Sumatra‘ (TRHS) (UNESCO 2017). The forest
surrounding the Sikundur site is classified as a lowland dipterocarp and
alluvial tropical rainforest habitat and is one of the last remaining lowland
forests in Sumatra. This area is comprised of 3 topographical habitat types:
alluvial (floodplain of meandering river with flat to undulating slopes <8%), hills
(parallel elongated ridges, 16-25% steep slopes, 450-500 m.a.s.l and plains
(flat with undulating slopes <8%) as defined by Laumonier (1997).This area
contains both primary and secondary forest that underwent small to large
scale logging during 1976 to 1988, and then again in the 1990s. An average of
11 large trees per hectare were felled during this period and substantial
amount of forest habitat were lost, however after logging had ceased the
forest was left to recover (Knop et al 2004, SOCP 2016). The Sikundur
monitoring station was then established in 2013 by the Sumatran Orangutan
Conservation Programme (SOCP) and is now used to collect data on
orangutans and other primates. Sikundur remains largely under-studied in
comparison to other sites in Sumatra, and although the forest is located within
the Gunung Leuser National Park and the Leuser Ecosystem, it is under threat
from logging and encroachment from monoculture plantations (Gaveau et al
2016).
21
2.2 Data Collection
2.2.1 Obj 1. Estimating Elephant Dung Decay Rates
With an aim to gather information of the dung decay rate of elephants in
Sikundur, dung decay monitoring was undertaken from the start of the project.
Previous dung decay publications suggest conducting preliminary dung decay
monitoring prior to the dung count surveys, however time restrictions and the
lack of previous elephant research at the site meant that only the ‗prospective‘
method, termed by Laing et al (2003), was used. As a result, dung decay
monitoring was initiated at the same time as the dung count surveys but was
conducted in different areas of the forest and 14 dung piles were monitored in-
situ. Hedges & Lawson (2006) recommend using only fresh dung piles (<48
hours old) for monitoring purposes, however as no fresh dung was found at
the start of the research and was found only towards the end of the data
collection, this could not be replicated. Due to time restrictions, the dung
monitored from the start of the survey was chosen using the ‗S system‘ for
dung pile classification with defined stages of decay (Table.1) (Hedges &
Lawson 2006). Any dung that could be classified as S1-S3 (Table.1), that
contained coherent fragments and could be handled without crumbling, were
monitored. Although the ‗S system‘ does not provide an estimation of the age
Figure 1. The location of the Sikundur Monitoring post in relationship to the Gunung Leuser National Park and the Leuser Ecosystem (SOCP 2015).

22
of the dung, all monitored dung piles that were not considered to be fresh (<48
hours old) were later compared to data collected when fresh dung piles were
found, and a more accurate estimation of age when monitoring of each dung
began was possible, and estimated age when found could be added to the
data set.
In an aim to monitor dung decay rates within various environments, sites
containing dung in various environments (under canopy/not under
canopy/swamp) were chosen to gain accurate representation dung decay in
all areas of the forest. When found, dung piles were typically left in-situ and
not moved, however if it was found upon a logging road or trail path where it is
likely to be damaged by human interference (motorcycles), it was moved to
the side of the path. Once dung was found, it was marked clearly using tape to
ensure it could be found upon every visit. Dung was re-visited a minimum of
every 2 weeks, with one month being the largest time frame between visits.
Upon each visit, classification of dung was carried out following the ‗S system‘
(Table.1) (Hedges & Lawson 2006). Dung was monitored until it had degraded
entirely and could be defined as S5 (Table.1)
The MIKE ‘S system’ for dung pile classification
Stage Definition Notes
S1 All boli are intact - A bolus is ‗intact‘ if its shape and volume is plausibly the original shape and volume; and it is coherent and can be handled without crumbling. - A coherent fragment is defined as a fragment (consisting of plant fibres embedded in a matrix of other fecal material) that does not crumble/break-up when handled. - Plant fibres held together by mud do not count as coherent fragments.
S2 One of more boli (but not all) are intact
S3 No boli are intact; but coherent fragments remain (fibres held together by fecal material)
S4 No boli are intact; only traces (e.g. plant fibres) remain; no coherent fragments are present (but fibres may be held together by mud)
S5 (gone) No fecal material (including plant fibres) is present
Table 1. The MIKE ‗S system‘ for dung pile classification from the Dung Survey Standards for the MIKE Programme compiled by Hedges & Lawson (2006).
23
2.2.2 Obj 2. Estimating Elephant Densities: Dung Count Surveys
Due to the difficulty in conducting transects and encountering elephant dung in
dense tropical forest, the recce or reconnaissance transect method is now a
widely adopted approach and was used in this study (Walsh & White 1998).
The recce sampling method involves following the path of least resistance
along trails and natural features, such as waterways and river banks, and
cutting of vegetation is kept to a minimum. The compass bearing is followed
only marginally and perpendicular distances to dung piles are not measured
as a straight line is not followed throughout. Although the recce method
requires less effort than transect sampling, it is recommended to undertake
both recce and line transect methods to detect major differences in encounter
rate as undertaking recce transects alone may result in increased dung
detection and an over-estimate due to following ‗elephant paths‘ and non-
random sampling (Walsh & White 1998).
Ten transects were established in the Sikundur field site over a 5-month
period (May- September), nine of which were located directly within the forest
and one which was located within a plantation adjacent to both the forest and
a local village (Figure.7). Due to time constraints, only the recce transect was
used and the transect start points were allocated in an aim to ensure
maximum coverage of the study site, habitat types (plains, alluvial and hills)
and to achieve equal distribution in trail/non-trail areas. If a transect fell too
close to another transect or within an impassable area (such as directly within
a river/plantation/village), the start points were moved to more ideal locations
within a maximum distance of 200m around the initial start point. GPS
locations were recorded at the start and end of every transect, and then every
125m metres along the transect. Every fresh elephant dung pile encountered
(<1 month old) within 2 metres perpendicular of the transect line was counted.
Various habitat variables were recorded on the discovery of dung, (see details
in section 2.3.1). An estimation of the decay stage of the dung encountered on
the transect was attempted for each dung found using the ‗S system‘ by
Hedges & Lawson (2006) (see Table.1, section 2.3.1). Once recorded, the
dung piles were then removed from the transect to prevent recounting of dung
when repeating transects.
24
An estimation of the density of Sumatran elephants was attained according to
the formula of McClanahan (1986) and Barnes and Jensen (1987):
E= (Y x r/ D) (eq1)
Where E=elephant density was calculated using Y= dung density (obtained
through dung count survey methods), D= defecation rate (The defecation rate
used for this analysis was derived from a previous study by Tyson et al (2002),
which found Sumatran elephants produce 18.15 defecations per 24 h) and
lastly r= Dung decay rate (The reciprocal value of mean survival time of all
decayed samples).
2.2.3 Obj 3. Elephant Habitat Use
2.2.3.1 Measuring Habitat & Forest Structure
To measure forest structure across the 10 transects of Sikundur, vegetation
plots were conducted at every 125m (non-dung plots) and when dung was
encountered (dung plots). Although vegetation plots were originally conducted
along every interval along the transect (n=80), only non-dung plots that were
located 125m away from dung plots were used in the final analysis. Vegetation
plots were comprised of 5x5m circular plots in which various forest structure
data was collected. Firstly, the number of trees with a circumference at breast
height (taken at 1.5m above ground), CBH >10cm were recorded. Percentage
of vegetation ground cover (ferns, shrubs, grasses) was then measured; this
was accomplished by estimating all ground vegetation (<1m from the forest
floor) in relation to bare ground (areas containing no vegetation) as a
percentage estimate. The percentage of all understory vegetation
(saplings/palm) within the plot was then estimated; this was achieved by
estimating the percentage cover by of non-tree vegetation >1m off the forest
floor (including saplings, CBH <10cm, large ferns, herbaceous vegetation) in
relation to the overall area of the plot and bare ground. Circumference at
breast height (CBH) was later converted to DBH using the pie formula (π). To
record canopy cover in the vegetation plots, a photograph of the canopy was
taken from the centre of the plot a digital camera. To quantify canopy cover
percentage, the photographs were subsequently analysed individually using
photo editing software Photoshop CC (version 19.0.1). This was achieved by
transforming the photographs into black and white monochrome images and
25
editing each individually using the histogram tool to ensure consistency with
the original photo of the canopy, and the observed foliage. Then by using the
histogram tool, a pixel count was taken, where black pixels represented
canopy cover such as foliage, and white pixels were non-canopy. The pixel
count allowed for a determination of canopy cover percentage (black pixels) in
comparison to non-canopy cover (white pixels). A description of the habitat
and surroundings of each plot were recorded when applicable, including
presence of a water source (stream/river) or whether the plot was located on a
logging road or a slope.
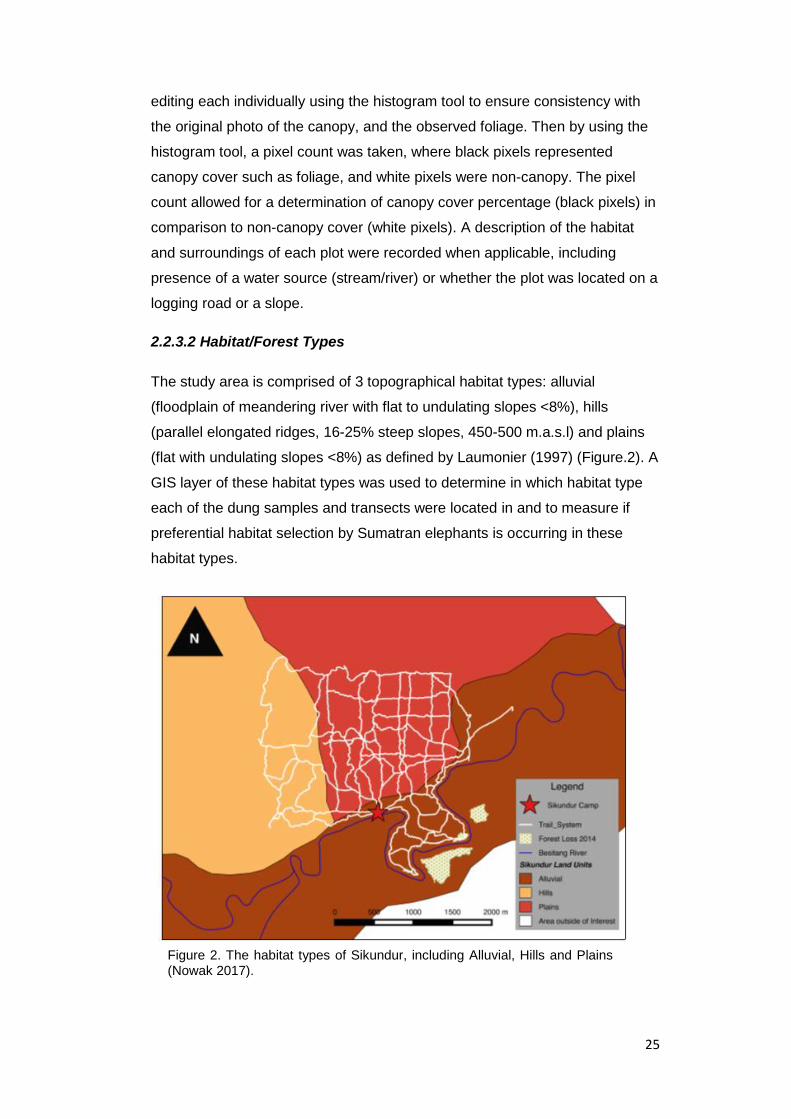
2.2.3.2 Habitat/Forest Types
The study area is comprised of 3 topographical habitat types: alluvial
(floodplain of meandering river with flat to undulating slopes <8%), hills
(parallel elongated ridges, 16-25% steep slopes, 450-500 m.a.s.l) and plains
(flat with undulating slopes <8%) as defined by Laumonier (1997) (Figure.2). A
GIS layer of these habitat types was used to determine in which habitat type
each of the dung samples and transects were located in and to measure if
preferential habitat selection by Sumatran elephants is occurring in these
habitat types.
Figure 2. The habitat types of Sikundur, including Alluvial, Hills and Plains (Nowak 2017).
26
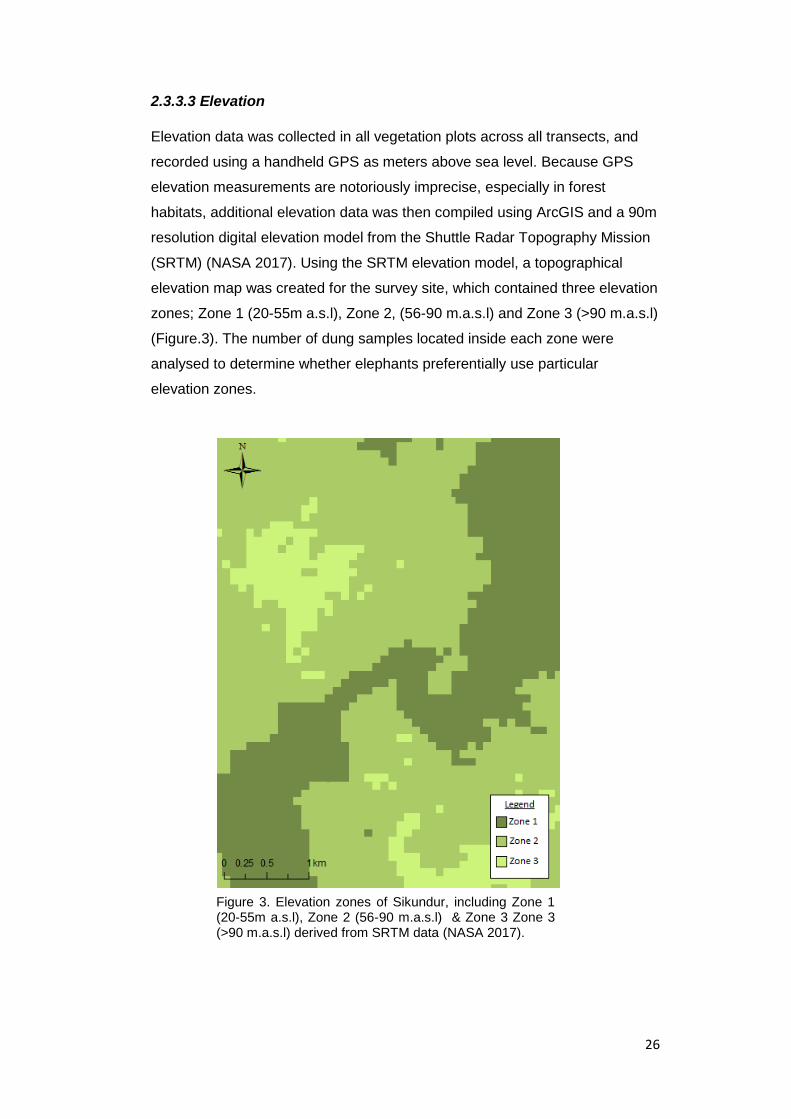
2.3.3.3 Elevation
Elevation data was collected in all vegetation plots across all transects, and
recorded using a handheld GPS as meters above sea level. Because GPS
elevation measurements are notoriously imprecise, especially in forest
habitats, additional elevation data was then compiled using ArcGIS and a 90m
resolution digital elevation model from the Shuttle Radar Topography Mission
(SRTM) (NASA 2017). Using the SRTM elevation model, a topographical
elevation map was created for the survey site, which contained three elevation
zones; Zone 1 (20-55m a.s.l), Zone 2, (56-90 m.a.s.l) and Zone 3 (>90 m.a.s.l)
(Figure.3). The number of dung samples located inside each zone were
analysed to determine whether elephants preferentially use particular
elevation zones.
Figure 3. Elevation zones of Sikundur, including Zone 1 (20-55m a.s.l), Zone 2 (56-90 m.a.s.l) & Zone 3 Zone 3 (>90 m.a.s.l) derived from SRTM data (NASA 2017).
27
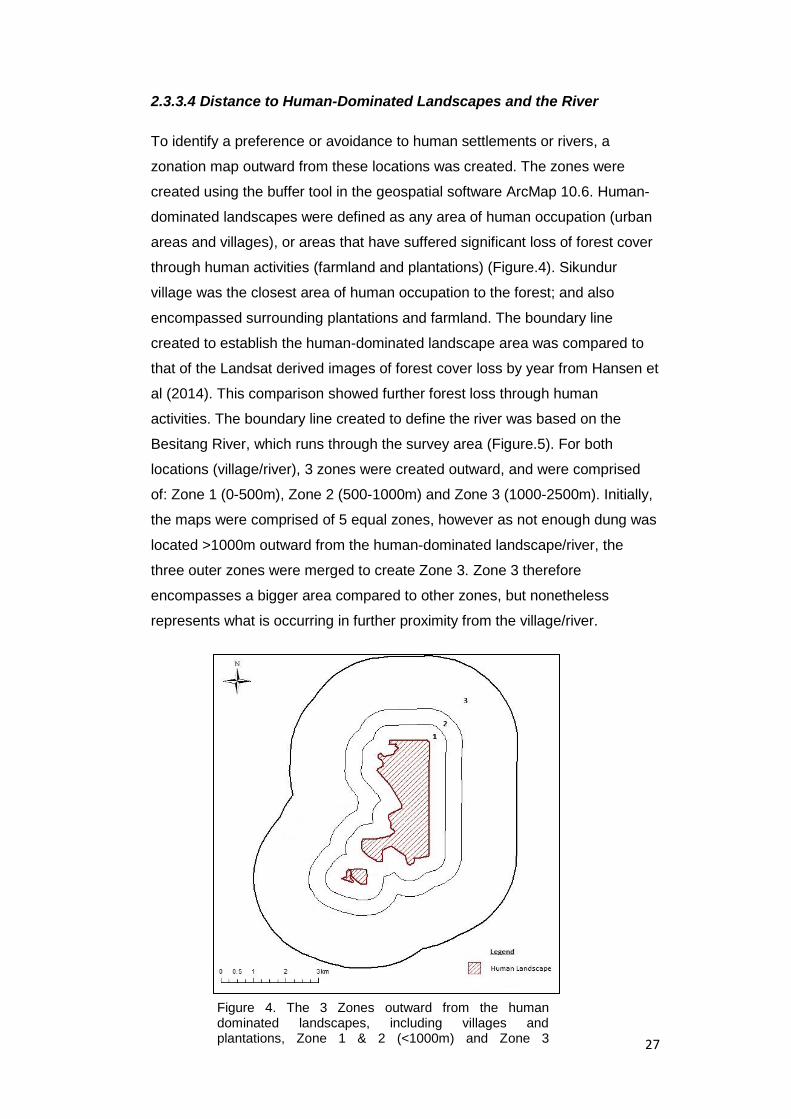
2.3.3.4 Distance to Human-Dominated Landscapes and the River
To identify a preference or avoidance to human settlements or rivers, a
zonation map outward from these locations was created. The zones were
created using the buffer tool in the geospatial software ArcMap 10.6. Human-
dominated landscapes were defined as any area of human occupation (urban
areas and villages), or areas that have suffered significant loss of forest cover
through human activities (farmland and plantations) (Figure.4). Sikundur
village was the closest area of human occupation to the forest; and also
encompassed surrounding plantations and farmland. The boundary line
created to establish the human-dominated landscape area was compared to
that of the Landsat derived images of forest cover loss by year from Hansen et
al (2014). This comparison showed further forest loss through human
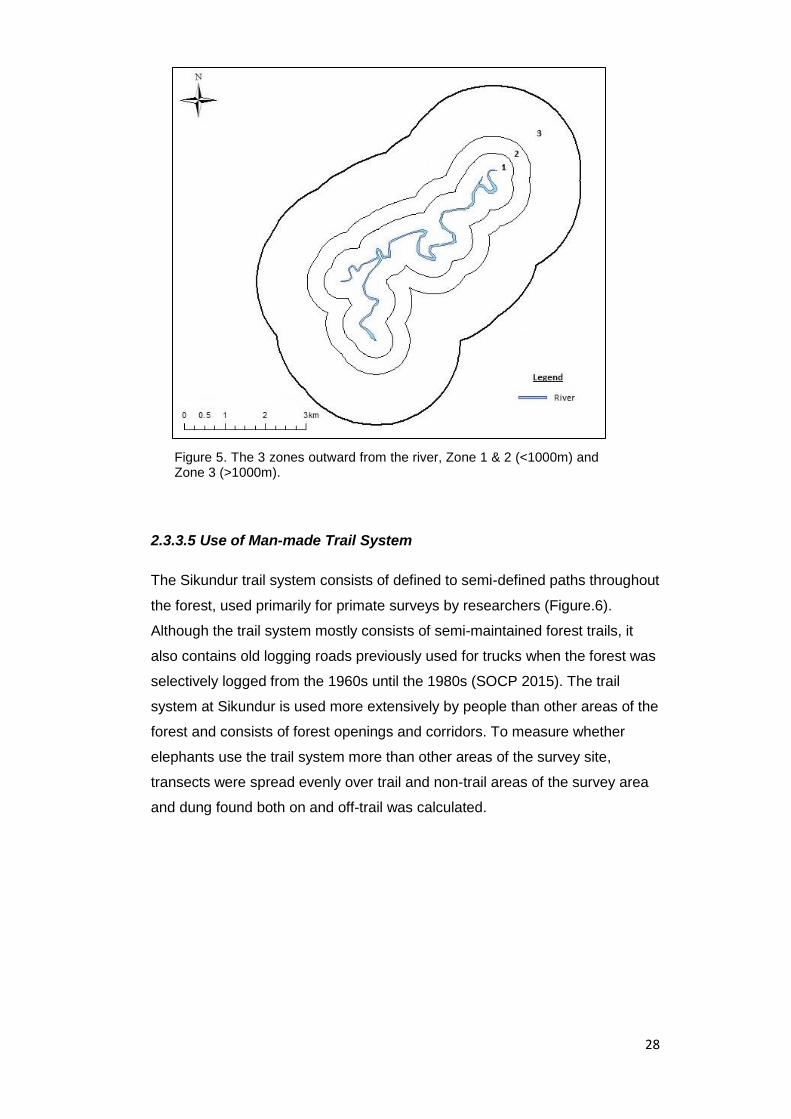
activities. The boundary line created to define the river was based on the
Besitang River, which runs through the survey area (Figure.5). For both
locations (village/river), 3 zones were created outward, and were comprised
of: Zone 1 (0-500m), Zone 2 (500-1000m) and Zone 3 (1000-2500m). Initially,
the maps were comprised of 5 equal zones, however as not enough dung was
located >1000m outward from the human-dominated landscape/river, the
three outer zones were merged to create Zone 3. Zone 3 therefore
encompasses a bigger area compared to other zones, but nonetheless
represents what is occurring in further proximity from the village/river.
Figure 4. The 3 Zones outward from the human dominated landscapes, including villages and plantations, Zone 1 & 2 (<1000m) and Zone 3 (>1000m).
28
2.3.3.5 Use of Man-made Trail System
The Sikundur trail system consists of defined to semi-defined paths throughout
the forest, used primarily for primate surveys by researchers (Figure.6).
Although the trail system mostly consists of semi-maintained forest trails, it
also contains old logging roads previously used for trucks when the forest was
selectively logged from the 1960s until the 1980s (SOCP 2015). The trail
system at Sikundur is used more extensively by people than other areas of the
forest and consists of forest openings and corridors. To measure whether
elephants use the trail system more than other areas of the survey site,
transects were spread evenly over trail and non-trail areas of the survey area
and dung found both on and off-trail was calculated.
Figure 5. The 3 zones outward from the river, Zone 1 & 2 (<1000m) and Zone 3 (>1000m).
29
2.3 Data Analysis
2.3.1 Obj 2. Estimating Elephant Densities: Spatial Analysis of Lowland
Forest
To first estimate elephant density within a survey area, the total area in km2
that elephants could inhabit must be identified. Using ArcMap 10.6, the total
lowland forest area (km2) was estimated for the Sikundur area and surrounding
lowland forest using a 2008 basemap acquired from Bing (Figure.8). The
measurement was based on visual identification of intact forest through aerial
imagery; this was achieved using the selection tool on ArcMap 10.6. The
selection made was defined by the non-presence of forest cover (plantations
or human settlements). The mountainous region to the west was excluded
from the area selection as it could not be classified as lowland forest. The
density data derived from this study is relevant for a lowland area and should
therefore not be used to estimate density across non-lowland regions. The
total area of lowland forest was estimated at approximately 426km2. This area
was then compared to Hansen et al (2014) Landsat derived maps of forest
cover loss per year for the area and the selection process was repeated. This
allowed for a more accurate and up to date measurement of the remaining
lowland forest.
Figure 6. The Sikundur trail system with varying levels of human use (SOCP 2012)
30
2.3.2 Obj 3. Elephant Habitat Use
All vegetation, habitat variables and GPS elevation data were first tested for
normality using Kolmogorov Smirnov test in SPSS 23.0. Due to the small
sample size and variables not having a normal distribution, non-parametric
tests were then used throughout the vegetation analyses. All tests of
significance were two-tailed and alpha was set to 0.05. Mann-Whitney U tests
were performed in SPSS 23.0 to test for significant differences in vegetation
structure collected between non-dung and dung plots, including ground
vegetation cover, understory vegetation cover and canopy cover percentages
between plots. The same method was then undertaken for tree characteristics,
including tree diameter at breast height (DBH) and density between dung and
non-dung plots, however the median value was used in analysis of tree DBH
due to the occurrence of large emergent trees within the data and an attempt
to reduce abnormalities in the data set. By undertaking this analysis we are
then able to compare the vegetation structure between plots that contained
dung and plots that were absent of dung and determine any significance
between them. The median value was used in analysis of tree DBH due to the
occurrence of large emergent trees within the data and an attempt to reduce
abnormalities in the data set.
To analyse any preference to certain habitat features, including habitat type,
elevation, distance from human landscapes and rivers and presence within the
trail system, GPS points of dung encountered were input into the geo-spatial
programme ArcGIS. A spatial layer was then created for the following zones:
habitat type, distance to human landscapes, and distance to river, elevation
from SRTM data and on/off trails. The number of dung that fell in to each
identified zone was then counted to gain an observed count of dung (O). To
generate an expected value of dung in each zone, the mean dung encounter
rate retrieved from the dung count surveys (1.41 dung/km) was multiplied by
the survey effort conducted within each zone (km walked) (E). Once the
observed and expected numbers of dung were calculated, the deviation
between observed and expected values could then be obtained by using chi-
square analysis:
31
(X2=Σ (O-E) 2/E) (eq2)
O=observed, E=expected (Siegel & Castellann Jr 1988).
By looking at any significant deviation between the observed and expected
value of dung found between these areas, we can determine if any preferential
habitat selection is occurring.
Chapter 3- Results
3.1 Obj 1. Dung Decay Rate
Fourteen dung piles were monitored over a 7-month period until all samples
had decayed entirely (Table.2). As some dung had not decayed by the end of
the field data collection, monitoring of samples was continued for an additional
2 months by on-site field researchers to ensure accurate dung decay data. A
majority of dung piles persisted for more than 30 days and disappeared
through decay, with the exception of dung 12 which was washed away by
rising river levels. By incorporating an estimation of the dung age when found
and the number of days that had passed from the last visit to the day it was
confirmed to have disappeared, minimum and maximum survival time was
also estimated with a minimum mean value of 73.64 days and a maximum of
112.5 days in total (Table.2). Mean survival time for all dung piles was found
to be 102.8 days in total, the reciprocal value of this was then calculated,
which resulted in the mean daily dung decay value of 0.0097.
32
3.2 Obj 2. Sumatran Elephant Density
A total of 48 dung piles were recorded on 9 out of the 10 transects in the
Sikundur field site over a 5-month period (Table.3, Figure.7). Each transect
was walked a minimum of 2 times, with selected transects walked a maximum
of 4 times, this resulted in 34km walked overall (Table.3). This equated to a
mean encounter rate of 1.41 dung piles per transect and 352.50 piles of dung
per hectare. The defecation rate used for this analysis was derived from a
previous study by Tyson et al (2002), which found Sumatran elephants
produce 18.15 defecations per 24 h (CV = 13.94). The density calculation
results in 0.188 elephants per km2. A lowland forest boundary area was
created using ArcMap 10.6 and based solely on visual identification of intact
forest from the year 2008 (Figure.8). This was then compared to Hansen et al
(2014) Landsat derived maps of forest cover loss per year (Figure.9) and the
area of remaining forest was recalculated for a more accurate representation
of remaining forest cover. The Landsat map in Figure.9 shows an observable
decrease in forest cover when compared to Figure.8. A large proportion of the
forest cover loss can be seen occurring between the years 2000-2010, but
there are signs of forest cover loss occurring in more recent years within the
Dung Estimated age when found
Minimum age of dung
Day of confirmed disappearance
Maximum age of dung
1 14 98 123 137
2 14 98 124 138
3 14 98 124 138
4 14 98 124 138
5 14 97 124 138
6 14 91 120 134
7 5 86 119 133
8 14 58 84 89
9 5 48 74 88
10 14 110 136 150
11 1 62 126 127
12 1 1 14 15
13 1 10 39 40
14 1 76 109 110
73.64 102.8
112.5
Table 2. The 14 dung piles monitored for dung decay, estimated age when found, day of confirmed disappearance, minimum & maximum age of dung with mean values of age before disappearance

33
interior of the forest and at the edges (Figure.9). By using the Landsat data
and incorporating significant losses of forest cover, the total lowland forest
area was re-estimated at 379km2. This signifies a forest loss of 47km2, which
cannot be easily identified in Figure.8. By multiplying the encounter rate of
elephants (0.188 per km2), a population estimate of 80 Sumatran elephants
could be estimated for the lowland survey area of Sikundur, and the
surrounding lowland forest seen in Figure.8. Using the updated lowland forest
area which incorporates recent forest loss (see Figure.8 & 9), population size
was then estimated at 71 Sumatran elephants.
Transect Times walked Dung found
1 4 6
2 4 13
3 4 6
4 3 3
5 4 2
6 4 0
7 3 5
8 3 2
9 3 5
10 2 6
Total 34 48
Table 3. The 10 established transects of Sikundur, amount of times each was walked, and total dung piles found on each.

34
Figure 7. 10 established elephant transects and dung piles encountered in Sikundur
Figure 8. Lowland forest area (426km2) surrounding the Sikundur field site derived in 2008.
Figure 9. Lowland forest area (379km2)
and Levels of forest cover loss from 2000-2016 (Hansen et al 2014).

35
3.3 Obj 3: Habitat use
3.3.1 Vegetation Structure
A total of 71 vegetation plots were measured over 9 forest transects, 36 of
these consisted of non-dung plots recorded at 125m intervals and the
remaining 35 plots were dung plots. The 8 vegetation plots conducted on
transect 10 were removed from the analyses due to it being located within a
plantation and not within the forest (Figure.7). During data collection, dung
would occasionally be located within the 125m interval vegetation plots,
causing an overlap of plot data. In order to attain a reliable comparison of
forest structure between plots that contain dung and plots with true absence of
dung, non-dung plots that occurred within a 125m radius of dung were
removed from the final analyses (see appendix).
Non-dung plots (n=36), and dung plots (n=35) did not differ significantly with
respect to ground percentage cover (U=534.500, n=71, p=0.271), understory
percentage cover (U=626.500, n=71, p=.968) and canopy cover percentage
(U=430, n=71, p=0.364) (Table.4, Figure.15). Tree density differed
significantly between habitat vegetation plots and dung vegetation plots
(U=239.500, n=71, p=<0.001, Table.5). A lower density of trees were seen in
vegetation plots where dung was present ( ̅ 11.47) to that where it was
absent ( ̅ 19.26) (Table.6, Figure.11). Due to the frequency of large
emergent trees in the data, the median value was used for this data set in an
attempt to reduce abnormalities in the data. The median DBH of trees were
found to significantly differ among plot types, trees with a larger DBH were
seen more often in areas where dung was present to plots where it was
absent (Table.5, Figure.12).
Ground Percentage
Cover (%) Understory
Percentage Cover (%) Canopy Cover (%)
Mann-Whitney U
534.500 626.500 430.000
Wilcoxon W 1200.500 1292.500 926.000
Z -1.101 -.040 -.907
Asymp. Sig. (2-tailed)
.271 .968 .364
Table 4. Outcome of the comparisons of ground vegetation, understory vegetation and canopy cover percentage between non-dung (n=36) and dung plots (n=35) across the 9 forest transects.

36
Tree Density Median
DBH
DBH Quartile
1
DBH Quartile
3
DBH
SD
Mann-Whitney U 239.50 401.50 391.00 447.00 365.00
Wilcoxon W 905.50 1028.50 1019.00 1067.50 995.00
Z -4.497 -2.517 -2.321 -1.718 -2.907
Asymp. Sig. (2-
tailed)
.000
.013 .009 .052 .004
Table 5. Comparisons between non-dung plots (n=36) and dung plots (n=35) of tree density, median DBH, 1
st quartile, 3
rd quartile, standard deviation of CBH, 95% and 5%
confidence interval (CI) and maximum and minimum DBH.
Figure 10. Boxplot showing the percentage of ground vegetation, understory vegetation and canopy cover between non-dung and dung plots of across the 9 forest transects.
37
Figure 11. Box plot showing tree density between non-dung and dung plots.
Figure 12. Box plot showing tree characteristics between non-dung and dung plots, including median tree DBH and 1
st quartile DBH.
38
Habitat Plot N Mean Std. Deviation Minimum Maximum Percentiles
25th 50th (Median) 75th
Non-dung Ground vegetation 36 29.58 23.73 1.00 95.00 10.00 27.50 45.00
Understory vegetation 36 26.58 20.35 1.00 90.00 11.25 20.00 35.00
Canopy cover 32 83.82 10.40 32.90 95.60 83.13 85.80 88.90
Tree density 35 19.26 6.22 4.00 33.00 15.00 18.00 23.00
Tree mean DBH 35 9.76 2.61 5.74 13.85 7.20 9.93 11.53
Tree median DBH 35 6.26 1.37 7.13 10.35 4.85 6.13 7.04
1st quartile DBH 35 4.33 0.75 3.50 6.37 3.82 4.14 4.69
3RD
quartile DBH 35 10.86 3.37 6.69 16.23 7.15 12.21 13.49
STD. deviation 35 9.52 3.91 3.04 15.06 5.66 10.40 12.11
95th percentile DBH 17 39.70 17.06 12.64 60.13 22.14 42.62 54.48
5th percentile DBH 17 3.38 0.32 3.18 4.04 3.18 3.20 3.54
Dung Ground vegetation 35 40.63 33.22 1.00 100.00 10.00 30.00 70.00
Understory vegetation 35 26.89 20.72 0.00 80.00 10.00 20.00 40.00
Canopy cover 31 80.62 15.37 12.80 93.70 78.60 84.10 88.30
Tree density 36 11.47 6.93 0.00 31.00 6.25 10.00 16.00
Tree mean DBH 35 8.46 1.37 7.13 10.35 7.32 8.19 9.87
Tree median DBH 35 6.69 6.21 4.77 9.55 5.09 6.21 8.76
1st quartile DBH 33 4.91 4.46 4.06 6.68 4.08 4.46 6.20
3RD
quartile DBH 33 9.81 3.61 6.21 14.24 6.57 9.39 13.47
STD. deviation 35 5.57 2.74 3.79 9.64 3.90 4.41 8.39
95th percentile DBH 5 22.54 9.85 15.92 37.18 16.41 18.53 32.68
5th percentile DBH 5 3.55 0.28 3.18 3.82 3.26 3.60 3.79
Table 6. Descriptive statistics of vegetation and forest structure between non-dung and dung plots.
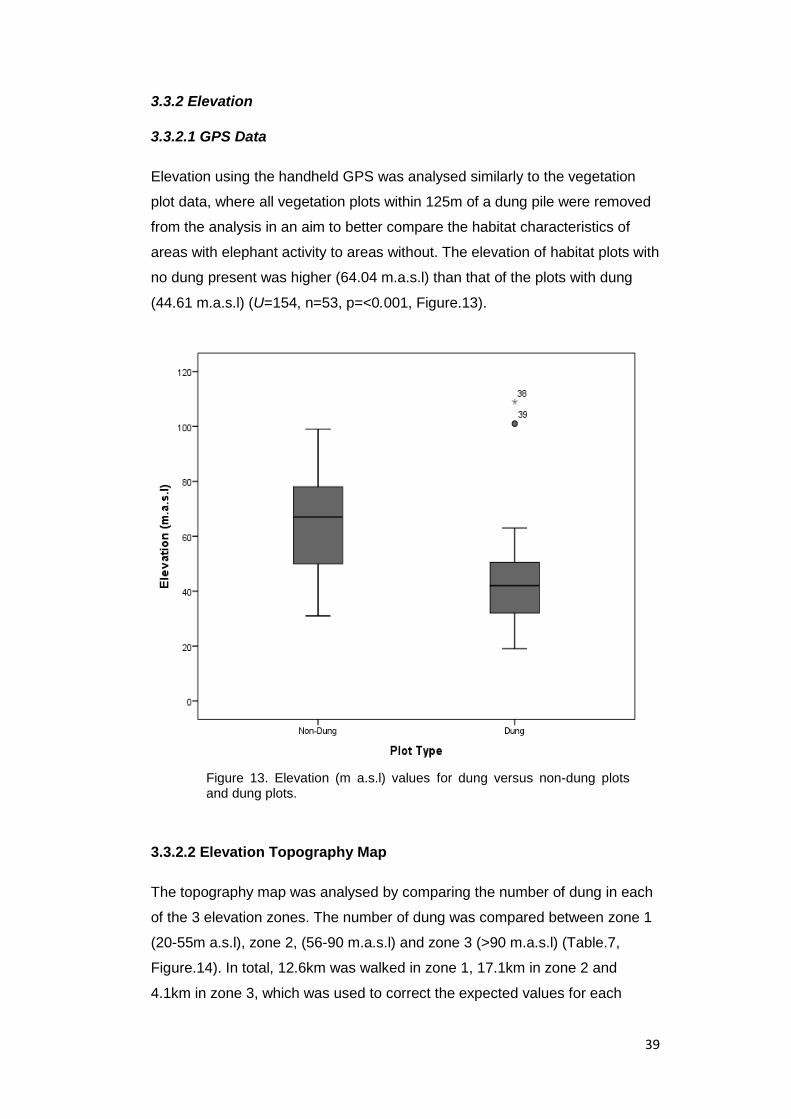
39
3.3.2 Elevation
3.3.2.1 GPS Data
Elevation using the handheld GPS was analysed similarly to the vegetation
plot data, where all vegetation plots within 125m of a dung pile were removed
from the analysis in an aim to better compare the habitat characteristics of
areas with elephant activity to areas without. The elevation of habitat plots with
no dung present was higher (64.04 m.a.s.l) than that of the plots with dung
(44.61 m.a.s.l) (U=154, n=53, p=<0.001, Figure.13).
3.3.2.2 Elevation Topography Map
The topography map was analysed by comparing the number of dung in each
of the 3 elevation zones. The number of dung was compared between zone 1
(20-55m a.s.l), zone 2, (56-90 m.a.s.l) and zone 3 (>90 m.a.s.l) (Table.7,
Figure.14). In total, 12.6km was walked in zone 1, 17.1km in zone 2 and
4.1km in zone 3, which was used to correct the expected values for each
Figure 13. Elevation (m a.s.l) values for dung versus non-dung plots and dung plots.

40
zone. There is a significant difference between the observed and expected
values of the number of dung found in the different elevation zones of the
transects (Table 7). Zone 1 (20-55 m.a.s.l), which was the lowest elevation of
all 3 zones, contained the highest amount of dung (O=36), surpassing the
number of dung expected (E=17). Zone 2 (56-90 m.a.s.l) contained a low
number of dung compared to the expected value (O=7, E=24). Zone 3 (>90
m.a.s.l) was the highest elevation zone and contained the lowest number of
observed dung piles, however the value observed largely coincides with the
expected number of dung (O=4, E=5) (Figure.15).
Zone Observed Expected Chi-square
(X2)
p-value
1 36 17.84 18.471
2 7 24.26 12.287
3 4 5.88 0.133
Total 48 48 30.892 <0.00
Figure 14. Map showing the 3 elevation zones of survey site, 3 elevation zones, zone 1 (20-55 m.a.s.l), zone 2 (56-90 m.a.s.l) and zone 3 (>90m m.a.s.l), transects (black circles) and encountered dung (white circles).
Table 7. Table showing the observed and expected number of dung piles found in each
elevation zone with the outcomes of the chi-square test (statistic X2) and p-value. Elevation
zones are: zone 1 (20-55m m.a.s.l), zone 2 (56-90m m.a.s.l) and zone 3 (>90 m.a.s.l).
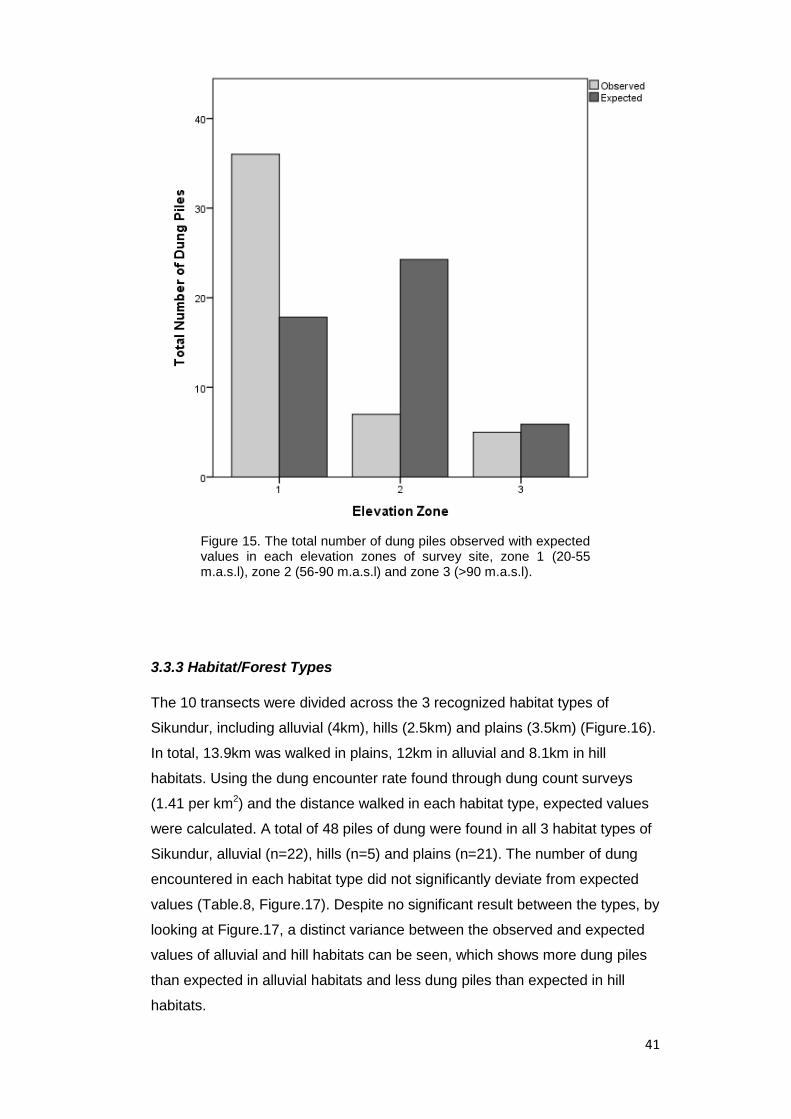
41
3.3.3 Habitat/Forest Types
The 10 transects were divided across the 3 recognized habitat types of
Sikundur, including alluvial (4km), hills (2.5km) and plains (3.5km) (Figure.16).
In total, 13.9km was walked in plains, 12km in alluvial and 8.1km in hill
habitats. Using the dung encounter rate found through dung count surveys
(1.41 per km2) and the distance walked in each habitat type, expected values
were calculated. A total of 48 piles of dung were found in all 3 habitat types of
Sikundur, alluvial (n=22), hills (n=5) and plains (n=21). The number of dung
encountered in each habitat type did not significantly deviate from expected
values (Table.8, Figure.17). Despite no significant result between the types, by
looking at Figure.17, a distinct variance between the observed and expected
values of alluvial and hill habitats can be seen, which shows more dung piles
than expected in alluvial habitats and less dung piles than expected in hill
habitats.
Figure 15. The total number of dung piles observed with expected values in each elevation zones of survey site, zone 1 (20-55 m.a.s.l), zone 2 (56-90 m.a.s.l) and zone 3 (>90 m.a.s.l).

42
Habitat Type Observed Expected Chi-square
(X2)
p
value
Alluvial 22 16.941 1.510
Hills 5 11.435 3.621
Plains 21 19.623 0.096
Total 48 48 5.228 0.073
Table 8. The observed, expected, chi-square (X2) and p-value of the 3
habitat types, alluvial, hills and plains
Figure 16. Map showing the 3 main habitat types of Sikundur, alluvial (middle/blue), hills (top left/red) and plains (top right/turquoise)
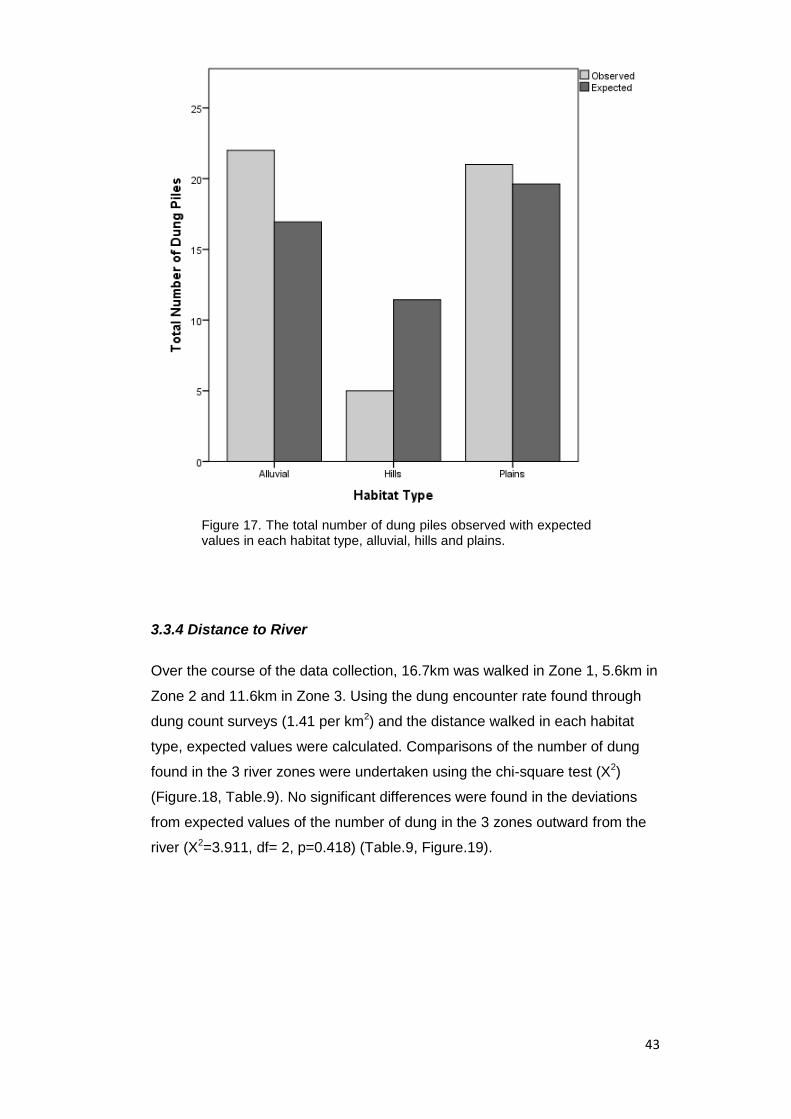
43
3.3.4 Distance to River
Over the course of the data collection, 16.7km was walked in Zone 1, 5.6km in
Zone 2 and 11.6km in Zone 3. Using the dung encounter rate found through
dung count surveys (1.41 per km2) and the distance walked in each habitat
type, expected values were calculated. Comparisons of the number of dung
found in the 3 river zones were undertaken using the chi-square test (X2)
(Figure.18, Table.9). No significant differences were found in the deviations
from expected values of the number of dung in the 3 zones outward from the
river (X2=3.911, df= 2, p=0.418) (Table.9, Figure.19).
Figure 17. The total number of dung piles observed with expected values in each habitat type, alluvial, hills and plains.
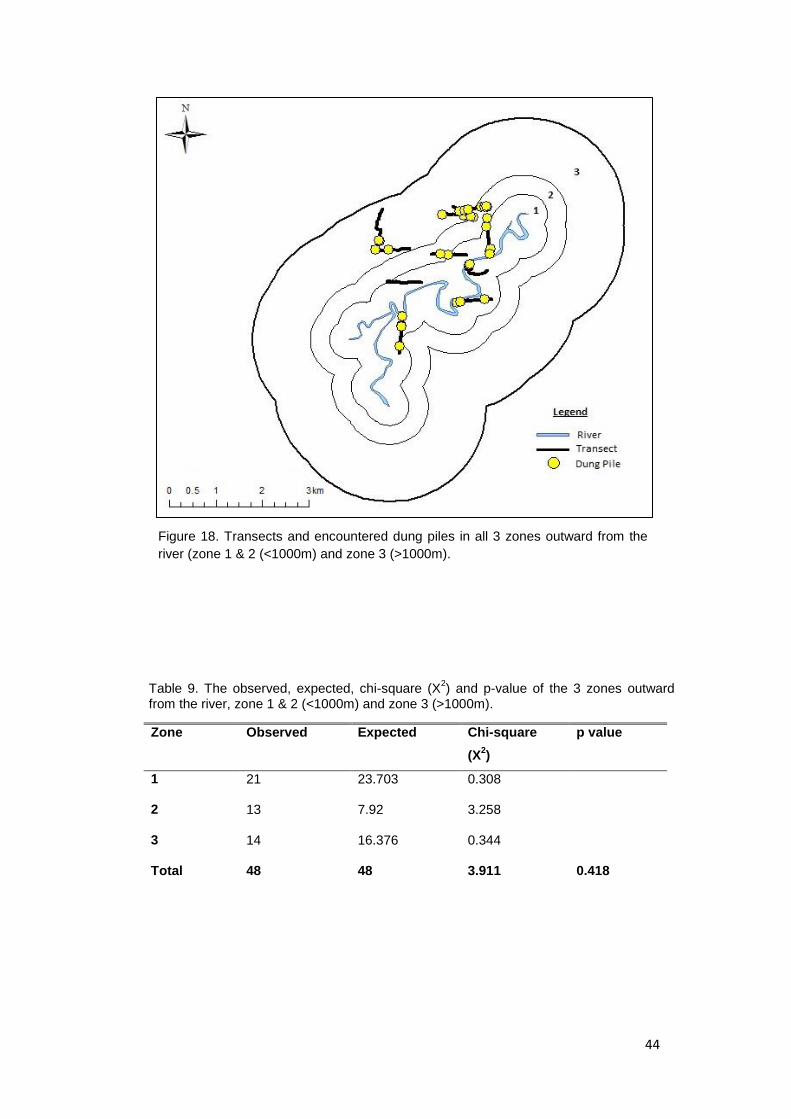
44
Zone Observed Expected Chi-square
(X2)
p value
1 21 23.703 0.308
2 13 7.92 3.258
3 14 16.376 0.344
Total 48 48 3.911 0.418
Figure 18. Transects and encountered dung piles in all 3 zones outward from the
river (zone 1 & 2 (<1000m) and zone 3 (>1000m).
Table 9. The observed, expected, chi-square (X2) and p-value of the 3 zones outward
from the river, zone 1 & 2 (<1000m) and zone 3 (>1000m).

45
3.3.5 Distance to Human-Dominated Landscape
In total, 11.3km was walked in Zone 1, 7.4km in Zone 2 and 15.1km in Zone 3.
Using the dung encounter rate found through dung count surveys (1.41 per
km2) and the distance walked in each habitat type, expected values were
calculated (Figure.20). Comparisons between the number of dung found in
from the 3 zones outward from the human-dominated landscapes were
undertaken using the chi-square test (X2) (Table.10). A significant difference
was found in the deviations from expected values of the number of dung in the
3 zones (X2=9.08, df= 2, p=0.05). A higher number of observed dung was
found in zone 1 (<500m) than expected (O=22, E=15), which was also
consistent with zone 2 (O=15, E=10). Zone 3 however, contained less
observed dung than expected (O=11, E=21) (Figure.21). Figure.21 shows that
Figure 19. The total number of dung piles encountered in all 3 zones outward from the river with observed and expected values.
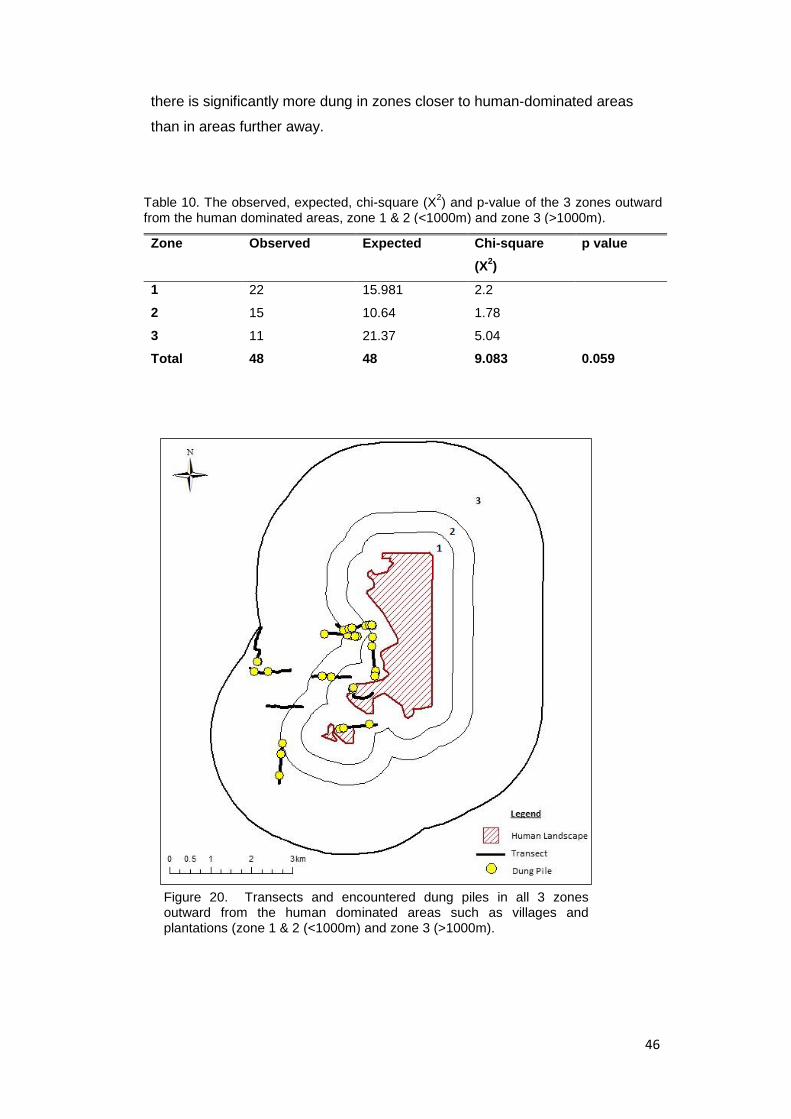
46
there is significantly more dung in zones closer to human-dominated areas
than in areas further away.
Zone Observed Expected Chi-square
(X2)
p value
1 22 15.981 2.2
2 15 10.64 1.78
3 11 21.37 5.04
Total 48 48 9.083 0.059
Figure 20. Transects and encountered dung piles in all 3 zones outward from the human dominated areas such as villages and plantations (zone 1 & 2 (<1000m) and zone 3 (>1000m).
Table 10. The observed, expected, chi-square (X2) and p-value of the 3 zones outward
from the human dominated areas, zone 1 & 2 (<1000m) and zone 3 (>1000m).

47
3.3.6 Use of Man-made Trail Systems
Over the course of the dung count surveys, a total of 10 dung piles were
observed on the trail and 29 off the trail system (Figure.22). Transect 10 was
excluded from the trail analysis as it passed within a plantation and so cannot
be classified as on or off trail, therefore 32km was walked in total both on and
off trail. Of the 32km walked, 16.9km was walked on the trail system and 15km
was walked off the trail-system. The results indicate a significant difference
between the number of dung piles found on and off the trail (X2=3.566738,
df=2, p=0.00) (Table.11). Fewer dung piles were observed on the trails than
the indicated in the expected value (O=10, E=20), and a greater number of
dung piles were observed off the trails than expected (O=29, E=18)
(Figure.23). This result indicates a higher density of dung piles on non-man-
made trails than on the trails.
Figure 21. The total number of dung piles encountered in all 3 zones outward from human dominated zones with observed and expected values.

48
Trail Type Observed Expected Chi-square
(X2)
p value
On 10 20.70656 0.308354
Off 29 18.29344 3.258384
Total 39 39 3.566738 0.000592
Table 11. The observed, expected, chi-square (X2) and p-value of the 2 trail types, on
and off trail.
Figure 22. The trail system of Sikundur and dung piles encountered on and off the trail.

49
Figure 23. The total number of dung piles encountered on and off trail with observed and expected values.
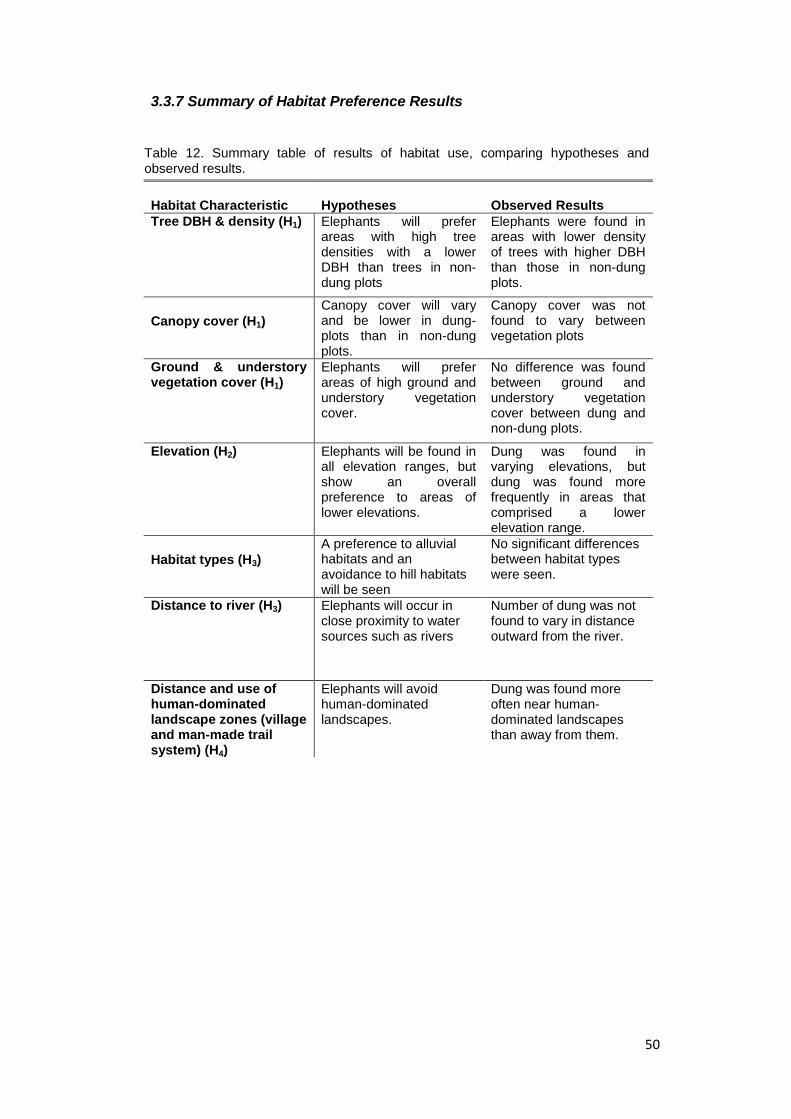
50
3.3.7 Summary of Habitat Preference Results
Habitat Characteristic Hypotheses Observed Results
Tree DBH & density (H1) Elephants will prefer areas with high tree densities with a lower DBH than trees in non-dung plots
Elephants were found in areas with lower density of trees with higher DBH than those in non-dung plots.
Canopy cover (H1)
Canopy cover will vary and be lower in dung-plots than in non-dung plots.
Canopy cover was not found to vary between vegetation plots
Ground & understory vegetation cover (H1)
Elephants will prefer areas of high ground and understory vegetation cover.
No difference was found between ground and understory vegetation cover between dung and non-dung plots.
Elevation (H2) Elephants will be found in all elevation ranges, but show an overall preference to areas of lower elevations.
Dung was found in varying elevations, but dung was found more frequently in areas that comprised a lower elevation range.
Habitat types (H3)
A preference to alluvial habitats and an avoidance to hill habitats will be seen
No significant differences between habitat types were seen.
Distance to river (H3) Elephants will occur in close proximity to water sources such as rivers
Number of dung was not found to vary in distance outward from the river.
Distance and use of human-dominated landscape zones (village and man-made trail system) (H4)
Elephants will avoid human-dominated landscapes.
Dung was found more often near human-dominated landscapes than away from them.
Table 12. Summary table of results of habitat use, comparing hypotheses and observed results.
51
Chapter 4- Discussion
4.1 Sumatran Elephant Density Estimate
Elephant population density was estimated to be 0.188 elephants per km2 in
the study area. This estimate was then extrapolated to the larger area of forest
around the study site to gain an overall general estimate of the possible
remaining Sumatran elephants in the surrounding lowland forest. The area of
lowland forest around the study site was found to be estimated at 426km2, and
when compared to the density calculation from the dung surveys in the
Sikundur site, gives an estimation of 80 Sumatran elephants in the region.
However, this size calculation did not take in to consideration recent forest
loss and thus the Hansen et al (2014) maps of forest cover loss per year were
used to better generate a more reliable estimate. By looking at the forest loss
maps, the initial boundary line roughly coincides with the areas of highest
forest loss from the Landsat derived images. A distinct line of forest loss can
be seen around the northern, eastern and southern areas, and can even be
seen in areas previously observed to be forest cover. The boundary line of
viable lowland forest is therefore likely to be smaller than previously estimated,
and may continue to decrease if no action is taken. The map of forest loss
suggests an overall loss of 47km2 with the remaining lowland forest of that
area estimated at 379km2. This area estimation allowed for a more realistic
calculation of 71 Sumatran elephants residing within the boundary area. This
loss signifies a probable reduction of 9 elephants from the original estimation,
occurring mostly between the years 2000-2010. This suggests that for every
transpired year, 1 predicted elephant was lost as forest cover diminished. The
worst time period of forest cover loss can be seen within this 10 year period,
however forest cover loss over the years 2010-2016 can still be seen
occurring with visible encroachment upon the forest edge.
As a population decreases in size, the risk of extinction increases.
Demographic stochasticity, inbreeding, and local catastrophes then become
influencing factors in the probability of population extinction, and can be even
more exacerbated if the population has slow life histories, growth rates and
gestation periods (Lande 1993, Purvis et al 2000). Elephants are renowned for
having long lifespans and slow life histories. Asian elephants are known to live
for >80 years, producing offspring every 3 to 6 years with a gestation period of
18-23 months (Lahdenperä et al 2014, Sukumar 2003). Elephants are
52
therefore at an increased risk of extinction due to slow life histories,
particularly Sumatran elephants which reside in small and fragmented
population across their range (Blake & Hedges 2004, Sukumar 2006). Using
population viability analysis, Sukumar (1993) states that a population of 100-
200 elephants would have a high probability (>99%) of survival for the next
100 years, despite demographic stochasticity and genetic depression. This
does not however take into account demography, sex ratio and environmental
pressures. Sukumar (1993) also theorises that genetic inbreeding may only
become problematic if the population drops to below 50 individuals. The
estimation of 71 Sumatran elephants produced in this study is therefore below
the minimum viable population of >100 elephants, but above the threshold
where genetic depression may become irreversible. This implies that while
these numbers are low, the population may have a chance of surviving
extinction, assuming environmental pressures such as habitat loss do not
worsen.
However, it is important to acknowledge that elephant distribution is
dependent on numerous and complex factors and using a density estimate
gained from the small sampling area against a much wider area may not result
in a precise estimate. It is used primarily to show how many elephants could
potentially be remaining in the lowland forest area as this has not been
undertaken before and to achieve a more accurate estimate of how many
elephants may be remaining in this forest. It is similarly worth acknowledging
that this study found variation within the habitat preferences of Sumatran
elephants, and therefore extrapolating the density calculation to the entirety of
the surrounding North Sumatran forest without habitat, topography or
elevation data may not be accurate, as elephants may occur in varied
numbers depending on the habitat variables. To correct this, further studies
should be undertaken on a larger scale to further asses‘ habitat viability for the
species and achieve an accurate calculation of viable elephant habitat. As this
study also only used the recce sampling method and sampling was not
entirely random due to time constraints, it is important to also acknowledge
that these results may not reflect true population numbers. Due to the non-
random sampling methods in regards to transect start points and solely using
the recce transect method (where the path of least resistance is followed), the
data may in fact overestimate the population size of Sumatran elephants in the
Sikundur area, and the population may be much lower than estimated here.
53
Furthermore, due to the small sampling size of dung monitored for decay and
uncertainty in exact survival times due to the lack of fresh dung and long
intervals between visits to dung, it must also be mentioned that the density
estimates may also vary and may in fact be higher or lower than estimated.
It is therefore vital to continue the data collection and surveys within Sikundur,
and continue to improve on these methods (dung decay monitoring and
survey methods), whilst also conducting new surveys further out in the forest
and habitat surveys to better estimate the population that is likely already
perilously low in numbers. If lowland habitat continues to decrease and no
action is taken, this population could eventually become more isolated,
resulting in potential extinction and an even further decrease in population
numbers.
4.2 Sumatran Elephant Habitat
4.2.1 Habitat/Forest Structure
The other main aim of this study was to gather information on the distribution
of Sumatran elephants within their environment. Contrary to expectation,
ground and understory vegetation were not found to vary between areas with
elephant presence and non-presence. A minor increase in both ground and
understory vegetation in areas with dung can be seen (Figure 6); however it is
not a significant difference and the variance is small. This result may be a
consequence of a mosaic of environments elephants traverse, where ground
vegetation and understory vegetation cover is likely to fluctuate (Rizwar 2013).
Canopy cover was also not found to differ between areas with dung or without
dung; this largely coincides with previous literature as canopy cover
preferences are expected to differ immensely, and is dependent on elephant
activity. Canopy cover preference has been found to depend on the time of
day and the weather due to thermoregulation requirements, with daytime
activities typically occurring under canopy cover compared to at night time,
especially on days with less cloud cover (Kumar et al 2010, Sitompul et al
2013, Valeix et al 2007). The lack of significant variance between forest
characteristics, such as canopy and vegetation cover, in areas containing
dung compared to areas without may be a result of the data encompassing all
elephant activity, as opposed to areas where the elephants will feed or rest. It
is therefore difficult to make assumptions based on these factors without direct
observations of elephants, and further data collection would be required.
54
However, other studies have found canopy and ground and understory
vegetation cover play a large part in the distribution of elephants within their
environment (Owen-Smith, 1988, Rizwar 2013). Nonetheless, the results of
this study indicate that elephants will not solely inhabit one type of forest area,
but inhabit forest types with varying levels of canopy cover and ground and
understory vegetation cover types.
Tree density was found to be significantly less in areas where dung was found
compared with where it was absent. Elephants favouring areas with lower
densities of trees may be a direct result of movement constraints. Moving
within environments with a lower density of trees may increase mobility for
travel and protection from predators through increased visibility of the herd
(Vanleeuwe & Gautier-Hion 1998). Lower tree density may also be a
consequence of food availability, as a greater number of exposed canopies
will promote higher levels of ground vegetation and young sapling growth,
therefore increasing the presence of elephant food (Denslow 1987). Median
DBH and 1st quartile DBH differed significantly between vegetation plots,
which indicate a larger DBH of trees in areas where dung was found, these
results largely coincide with previous literature which states elephants prefer
areas with trees with a DBH less than 32cm. However, larger trees also tend
to block out sunlight, which would typically result in less rich ground and
understory in such areas. This result may also correlate with increased
mobility in when elephants traverse their environment. To conclude, in relation
to hypotheses 1 (H1), forest structure was found only found to vary significantly
in relation to tree density and DBH, which showed elephants prefer areas with
a lower density of trees and a higher DBH than in plots that contained no
dung, but no preference was seen in relation to canopy cover or ground and
understory vegetation cover.
4.2.2 Elevation
Lowland forests are classified as having an approximate elevation range <500
m.a.s.l with varying elevations within this threshold, and often encompass
various habitat types (Laumonier 1997). Dung was found in all elevation
zones, but there was a significant difference of dung found between the 3
elevation zones, zone 1 (20-55m m.a.s.l), zone 2 (56-90 m.a.s.l) and zone 3
(>90 m.a.s.l). Zone 1, which was the area which comprised the lowest
55
elevation range, contained the highest amount of dung and greatly exceeded
that of the expected value. Zone 1 may also be compared to the alluvial
habitat type (Figure.14 & Figure.16), which also contained more dung than
expected. This may indicate that elephants prefer lower elevated areas, which
would also coincide with depressions in the landscapes that contain alluvial
habitats. Zone 2 contained a significantly low amount of dung and was much
lower than the expected value; Zone 3 contained the least amount of dung,
but did not majorly deviate from the expected values. Zone 3 may also be
compared to the result from the hill habitat type seen in Figure.14 & 16, and
may suggest elephants prefer lower elevation zones as it has been stated
previously that steep slopes may limit elephant mobility (Feng et al 2008). The
data shows dung was present in all zones and habitat types of elevations >90
m.a.s.l and in areas of 16-25% steep slopes, therefore supporting the
hypotheses (H2) that elephant movement is not constrained by elevation and
hill areas, but elephants may favour areas with fewer steep slopes and a lower
elevation range of 20-56 m.a.s.l, which also appears to coincide with alluvial
areas and depressions in the landscape such as rivers. Further research
investigating the impact of elevation on Sumatran elephant distribution would
be beneficial in further understanding elephant habitat preferences. As
Sumatran elephants have previously been observed occurring at high altitudes
and occurring in areas with steep slopes, there may be corresponding factors
that influence their distribution at different elevations, such as
thermoregulation and temperature.
4.2.3 Habitat Types & Distance to River
No significant difference between dung found in each habitat type were
identified from the analyses, however slight deviations from the observed and
expected values of alluvial and hill habitats can be seen. More dung piles than
expected were found within alluvial habitat types (floodplain of meandering
river with flat to undulating slopes <8%), but less dung piles than expected
were found within hill habitat types (parallel elongated ridges, 16-25% steep
slopes). This would support the hypotheses that elephants prefer areas with
fewer slopes and lower elevations (H2).This result may indicate that while
elephants may utilise all habitat types, there is a slight preference to alluvial
habitat types which would support the hypotheses (H3). A preference to
alluvial habitats would also coincide with previous literature that elephants
56
favour being close to water sources to drink and to bathe (Owen-Smith 1988,
Kumar et al 2010, Santiapillai 1984, Sukumar 1989 & Chong 2005, Rizwar et
al 2014). When comparing these results to the elevation analyses, the area of
alluvial habitat seems to directly coincide with the Zone 1 category of elevation
(20-55m m.a.s.l), which was the lowest elevation zone. Zone 1 contained
significantly more dung than other zones, which may further support this
preference to alluvial areas. Despite this, no significant results were found
when looking at the proximity of elephant presence 2500m outward from the
river, which rejects the hypotheses (H3). A lack of significant difference when
looking at the river zones may be a consequence of elephants being spread
out evenly within the 2500m zone or the proximity analysis not taking in to
account terrain, elevation or slopes. To further explore patterns of elephant
distribution in proximity to rivers, this would need to be attempted at a greater
scale. Despite this, by looking at both the elevation and habitat type analysis
and previous literature, Sumatran elephants likely do show an overall
preference to alluvial habitats.
4.2.4 Distance to Human-Dominated Landscapes
The human-dominated landscape used in this analysis was Sikundur village
and adjacent plantations, residing on the edge of Gunung Leuser National
Park. This area is one of the few that contains Sumatran elephants, but
human-wildlife conflict is occurring less drastically than other areas of Sumatra
(personal communication, Hankinson, E., 2018, Nyhus & Tilson 2000). The
villagers typically use noise methods to deter the elephants from entering
areas of human occupation and crop fields. Evidence of elephant
encroachment was observed whilst undertaking transects through plantations
(transect 10), and while some destruction to crops was evident, the local
people did not seem to be overwhelmed by elephant presence. The local
people are also provided with deterrent equipment such as head torches and
fire crackers by local conservation organizations (personal communication,
Hankinson, E., 2018). There may be multiple reasons why there is minimised
conflict between the local people of Sikundur and the elephants residing in the
adjacent forest compared to other areas of Sumatra, including crop types
used, effective conflict mitigation strategies or sufficient habitat and food for
elephants in the area.
57
In this study a significant difference was found in the deviations from expected
values of the number of dung in the three zones around the human-dominated
landscapes. The greatest number of observed dung was found in Zone 1,
which was greater than the expected values. This zone was closest to the
human-dominated landscape and within a 500m buffer radius from the village
and plantations. This was comparable to Zone 2 where more dung was
observed than expected. Zone 2 was above the buffer radius of 500m from the
human-dominated landscapes, but below 1000m of it. Zone 3 was >1000m
away from the human-dominated landscape and also contained dung, but less
observed dung than was expected. These results suggest that although
elephants were found in all zones around human-dominated landscapes, they
occur in significant densities at the closest to the core area of human
occupation. This allows a rejection of the hypotheses (H4), which states that
elephants will strictly avoid human-dominated landscapes.
The reasons for the frequent occurrence around human-dominated
landscapes may be due to various influencing factors. One factor may be that
Sumatran elephants, like their African counterparts, possess spatial memory
that allows them to remember the spatial locations of important areas, such as
water sources or areas of forage (Dale 2008, Polanksy et al 2015). Sumatran
elephants are often seen occupying areas near rivers and alluvial habitats
which is also seen in this study and may also be linked to low elevations.
These areas often coincide with human habituation, due to access to food,
river transport and water sources and it is possible that there is a preference
from both humans and elephants to reside within these areas (Kummu et al
2011). A large proportion of these areas have now become human-dominated
landscapes and it may be spatial memory driving elephants to return to these
parts of the forest, despite human occupation. Another factor that may drive
Sumatran elephant‘s preference to these landscapes is the presence of forest
edges (Sitompul et al 2013, Rood et al 2010). Forest edges often contain an
abundance of new growth of ground flora and therefore provide elephants with
an abundance of food (Sukumar, 1989, 1990; Zhang & Wang, 2003). Forest
edges may well contain larger quantities of available food for Sumatran
elephants, and by also residing in these areas they can also gain more food
opportunities by entering crop fields. Whether elephants reside in these areas
due to spatial memory, forage opportunities or a combination of both, this

58
study shows that elephants will undoubtedly inhabit areas in spite of human
habitation, but the reason for this needs to be investigated.
4.2.5 Use of Man-made Trail Systems
Human traffic and an insurgence of human activity are known to negatively
alter species‘ behaviour and the overall ecology of an area (Ciuti et al 2012,
Griffiths and Schaik 1993, Zhou et al 2012). The negative impacts of human
traffic are determined by the overall intensity and type of human presence in
an area (Blake et al 2017). However, when human traffic is taking place in low
quantities, such as at field research stations, fewer disturbances are expected
particularly in comparison to eco-tourism hotspot areas or human settlements.
However, impacts on the surrounding ecosystem still inadvertently take place,
and often arise in the form of man-made trail systems used by guides and
researchers (Blake et al 2017). Man-made trail systems are often created by
local people or researchers to navigate forest areas more easily, and although
these can have negative impacts, a selection of forest mammals have been
found to show a tendency towards using these trails (Harmsen 2006, Harmsen
et al 2010). Little is known in regards to elephant usage of man-made trails,
this may be as they themselves are known to create natural trails through the
forest (Blake 2002, Haynes 2012).The Sikundur field site and surrounding
forest consists of defined to semi-defined man-made trail systems that are
used daily by primate researchers. The trail system is based around trails that
have been cut more recently by researchers and the old logging roads used
previously when the forest was selectively logged from the 1960s until the
1980s (SOCP 2015). It is important to add that although the Sikundur trail
system is the most intensely used area today, small remnants of unused trails
and roads may remain further out from the trail system, however as these
remain largely unused they are likely indistinguishable from the surrounding
forest. Therefore, the comparison between plots on trails and those off trails is
primarily done to determine whether elephants use the well-defined and
intensely used Sikundur trail system, compared to other surrounding areas
that do not get walked as frequently.
The results showed that elephants were present on the man-made trails and
logging roads located within the trail system of Sikundur. There was however
a significant difference between the amounts of dung found on and off the
man-made trail system. More dung than expected was found off the trail

59
system with a total of 29 in total, and less dung then expected was found on
the trail system which was 10 in total. These results indicate that elephants did
in fact utilise the man-made trail systems, despite high activity by humans, but
in lesser quantities than they did non-man-made trails. This result may support
the hypotheses (H4), but it remains unclear whether elephants are actively
avoiding the trail system. These results suggest that elephants are not
impartial to the use of man-made trail systems and use them on an
opportunistic basis alongside the creation of their own natural trails, but the
presence of human traffic may have an impact on this usage. Man-made trails
may however provide movement opportunities and a greater perceptibility of
predators as elephants traverse their environment. Despite this, as elephants
were found more frequently off the trail system than upon it, it is unlikely that it
adds additional benefit from their own created trails, and the presence of
humans may even cause them to avoid it entirely.
4.3 Implications for Forest & Sumatran Elephant Conservation
Deforestation and habitat loss are at present the biggest threat to the
Sumatran elephant and Indonesian wildlife alike (Kinnaird et al 2003, Margono
et al 2014, Mariati et al 2014). Deforestation and forest cover loss is occurring
predominantly through human encroachment and concessions, such as
logging or monoculture plantations. Encroachment and deforestation of
tropical forests are causing highly bio-diverse areas to become reduced and
surrounded by a matrix of human-dominated landscapes (Cincotta et al 2000,
Janzen 1983, Nyhus & Tilson 2004). Despite this, moderate levels of
disturbance in a forest such as selective logging have shown regeneration
potential if left to recover (Edwards et al 2014, Knop et al 2004). This study
shows Sumatran elephants inhabiting a previously logged secondary forest
that was logged in the 1970s to the 1980s, but has been left to recover since
the 1990s. This also coincides with the literature, because Sumatran
elephants are known to inhabit secondary forests more than primary forests
(Sitompul et al 2013). Secondary forests should therefore be regarded as
important habitats for the Sumatran elephant, despite previous disturbance,
and should be thoroughly protected akin to primary forests. However, when
large patches of forest are removed, such as for the creation of urban areas or
for cropland such as palm oil, regeneration is problematic and almost
impossible (Grubb et al 1994, Sodhi et al 2010a). The on-going encroachment

60
by humans and forest loss is the biggest threat to the lowland forest in North
Sumatra and the population of Sumatran elephants that reside within it. If
encroachment and forest loss continue, the reduction of optimal elephant
habitat will likely cause interactions between humans and elephants to
intensify, and conflict may occur. This occurrence would not only accelerate
population decline through potential mortality of Sumatran elephants, but
make the overall conservation of the species much more challenging. Human-
elephant conflict has the capability to cause an upsurge in negative
perceptions of elephants by the local people, and as a consequence local
people will be less content with living alongside areas with elephant
habituation, or cooperating with their conservation (Dickman 2010, Thomas
2017).
If elephants and humans are to co-exist without conflict, sufficient habitat for
elephants and corridors to traverse between must be left available (Kinnaird et
al 2003). Necessary action must be taken to ensure the long-term survival of
Sumatran elephant habitat, and reduce the on-going encroachment to these
last remaining lowland forests. Fortunately, our knowledge of Sumatran
elephant habitat selection and distribution within forests is now growing. This
study supports the notion that Sumatran elephants inhabit lowland forests with
varying levels of canopy cover, ground and understory vegetation.
Conservation of elephant habitat should therefore aim to promote habitat
mosaics, which incorporate a diversity of habitat types, including primary
forests, secondary forests and forest edges. It should also be taken into
account that although elephants can traverse areas with the presence of steep
slopes and inhabit hill habitats as found in this study and the study by Rood et
al (2010), areas with a lower elevation range are frequently used (Kumar et al
2010). These are the areas that likewise tend to coincide with areas of human
habitation, which this study found elephants not averse to inhabiting in high
numbers. If sufficient habitat remains available to elephants, human-elephant
interactions may not get worse, however if this habitat continues to decline,
then it may well intensify with disastrous consequences for small populations
such as the ones located around Sikundur forest. Therefore, to ensure the
long-term persistence of the species, action must be taken to protect the
remaining lowland forest, both in the area of Sikundur, North Sumatra and
other sites in Sumatra. To better ensure longevity of these forests and their
endemic species, the Indonesian government and governmental organizations
61
must strictly monitor and aim to decrease the levels of on-going encroachment
and illegal activities, which continue to occur in the national park and at the
national park boundaries.
4.4 Recommendations for Future Research
Despite their large size and critically endangered status, Sumatran elephants
remain one of the least understood large mammals in regards to their ecology,
distribution and population numbers. This study attempted to gain a first
density estimate for the North Sumatran population residing within a lowland
forest in the Gunung Leuser National Park in the Leuser Ecosystem. However,
as this research was comprised of only 5 months of field work and was
focused within a small study area there was a limit on the quantity and quality
of dung decay monitoring, dung count surveys and behavioural observations
that could be conducted. Nonetheless, this study provides preliminary data on
the population of Sumatran elephants residing within the study site located in
North Sumatra, which before now were unstudied. The data collected can
hopefully be used to continue elephant monitoring and research in both
Sikundur and North Sumatra. Continuation of research would subsequently
allow for a better evaluation of the present population in North Sumatra,
through the monitoring of population, and provide insight into the overall health
of the population.
To better improve population density estimates, further studies on the decay
rate of dung in Sikundur and within tropical forests are needed. Within this
study, problems were encountered in truly defining a dung pile as ‗gone‘,
particularly within the interior of the forest. It was often found that roots from
the soil will grow in and around the dung, prolonging the structure of the dung
for long periods of time, encasing mud and plant fibres, despite no faecal
material remaining. This made the process of defining the dung as S5 (gone)
difficult, as a pseudo structure would often reside for months. Having a better
grasp on dung decay stages, primarily on the later stages such as S4 and S5
(and when to class a dung as gone) would be valuable when undertaking
dung related survey methods in tropical forests, and would allow for a more
accurate estimation of population density when undertaking dung survey
methods.
62
To improve density estimates of the population of Sumatran elephants in
Sikundur and the surrounding area, further sampling should be undertaken on
further out from the original survey site using additional methods such as line
transects. As this study used only a small study site to determine elephant
density on a larger scale and shows elephants will occur in higher numbers
dependent on habitat variables, undertaking further dung and habitat surveys
in various locations within the lowland forest would allow for a more accurate
density estimate of the remaining elephants. Recce transect methods have
become increasingly popular due low effort needed for sampling, however it is
important to acknowledge that it may also cause overestimation of density
estimates due to the non-random sampling methods. By only undertaking the
recce sampling method within this study, an overestimation of density
estimates due to non-random sampling may have occurred. To improve the
accuracy of density estimates, survey methods should including pairing line
transects with recce transect methods (Walsh & White 2008). This would not
only be beneficial in helping us understand the accuracy of the recce transect
method overall, but improve the accuracy of density estimates for the area and
allow a better understanding of the population in North Sumatra. In addition,
undertaking surveys along the established transects and the creation of
entirely new transects further out from the original survey site using random
survey methods would allow us a more detailed and accurate insight into how
many elephants are residing in Sikundur and North Sumatra as a whole.
In order to achieve a better understanding on the habitat preferences and
distributions within the forest, further habitat surveys in areas of elephant
presence would be beneficial. As this study was focused on a relatively small
area of forest, which was in close proximity to the forest edge and human-
dominated landscapes, surveys further afield from the original survey area
would be required to better improve our understanding of their distribution.
Data collected further out from the research station would also provide a
greater scope of information and would improve our understanding of elephant
movements deeper in the forest and whether elephants occur there in greater
numbers to what was seen in this study. It would also be beneficial to further
understand why elephants are seen occurring in high densities around human-
dominated landscapes and if there is a relationship between elephants
presence around human landscapes, elevation and presence of rivers. Further

63
studies investigating this would be crucial in improving or preventing
interactions between humans and elephants.
Additional studies looking more in depth on how terrain ruggedness and
presence of steep slopes influence elephant distribution would also be
beneficial, particularly in areas where elephants are at risk of being isolated.
Undertaking additional methods, such as DNA dung testing or radio tagging,
would dramatically increase our knowledge of the elephants residing in this
lowland forest of North Sumatra. The use of alternate methods would not only
enhance our current knowledge of species range and movement, but help
identify whether the population in this study is in fact isolated within the
lowland forest boundary, and if any possible corridors are available for them. If
this population of Sumatran elephants are indeed isolated within this lowland
forest, it is imperative that they do not get overlooked or disregarded,
particularly with the already low species population numbers and the on-going
threat of forest loss occurring around lowland forest boundaries and on a
country-wide scale.
Chapter 5- Conclusion
The Sumatran elephant is growing increasingly vulnerable to extinction
through wide-scale deforestation and habitat loss. This study gathered a first
density estimate of a Sumatran elephant population residing in a lowland
forest area of 379km2, which at present is at continued risk of encroachment
and deforestation, despite its protected status. To improve the conservation
efforts of the species, it is imperative we increase our existing knowledge of
the last remaining populations, such as the one within the study, and better
understand their habitat use and preferences. This study found variation in
forest characteristics between areas of elephant presence to absence, and a
preference to lower elevation zones within a range of 20-55 m.a.s.l. which
coincided with alluvial habitats. This indicates that although elephants can
traverse areas with high elevations, they will show a preference to lower
elevations. The results also found that elephants were found in close proximity
to human-dominated landscapes (villages and plantations), more often than in
areas further away. Elephants were similarly found using the man-made trail
system of the Sikundur field site, which is exposed daily to human traffic by
researchers; however they did not use it more than other areas of the forest. If
optimal elephant habitat is found in close proximity to these landscapes (such

64
as forest edges), this could cause major problems in the future, such as an
increase in human-elephant conflict, as encroachment is occurring most
predominately around the forest edge. In summary, although the population
density estimate in this study of 71 elephants falls below the minimum viable
population threshold, there may still be a chance of improving the outlook for
the Sumatran elephant and increasing their numbers, assuming environmental
pressures such as habitat loss do not worsen. However, if lowland habitat
continues to decrease and no action is taken, this population, alike others
could eventually become isolated, resulting in the loss of the sub-species as a
whole. By improving our overall knowledge on all remaining populations of
Sumatran elephants and their habitat preferences, we will have a better
chance of protecting this species from further declines and possible
extinctions in the future.
65
Chapter 6- Bibliography
Achard, F., 2002. Determination of Deforestation Rates of the World's Humid
Tropical Forests. Science, 297, (5583), 999-1002.
Azmi, W. & Gunaryadi, D., 2011. Current status of Asian Elephants in
Indonesia. Gajah, 55-61.
Barnes, R.F.W. & Dunn, A., 2002. Estimating forest elephant density in Sapo
National Park (Liberia) with a rainfall model. Afr. J. Ecol, 40, 159-163.
Barnes, R.F.W. & Jensen, K.L., 1987. How to count elephants in forests. IUCN
African Elephant and Rhino Specialist Group, 1, 1–6.
Blake, J., Mosquera, D., Loiselle, B., Romo, D. and Swing, K., 2017. Effects of
human traffic on use of trails by mammals in lowland forest of eastern
Ecuador. Neotropical Biodiversity, 3, (1), 57-64.
Blake, S. & Hedges, S., 2004. Sinking the Flagship: The Case of Forest
Elephants in Asia and Africa. Conservation Biology, 18, (5), 1191-1202.
Blake, S., 2002. The Ecology of Forest Elephant Distribution and its
Implications for Conservation. PhD thesis. University of Edinburgh.
Blouch, R.A & Haryanto., 1984. Elephants in Southern Sumatra. Unpublished
report, IUCN/ WWF Project 3033, Bogor, Indonesia.
Blouch, R.A & Simbolon, K., 1985. Elephants in Northern Sumatra.
Unpublished report, IUCN/ WWF Project 3033, Bogor, Indonesia.
Brooks, T.M., Pimm, S.L., Kapos, V., Ravilious, C., 1999. Threat from
deforestation to montane and lowland birds and mammals in insular Southeast
Asia, J. Anim. Ecol, 68, 1061-1078
CAMPOS-ARCEIZ, A & BLAKE, S, 2011. Megagardeners Of The Forest - The
Role Of Elephants In Seed Dispersal. Acta Oecologica-International Journal
Of Ecology, 37, (6), 542-553
Campos-Arceiz, A., Larrinaga, A., Weerasinghe, U., Takatsuki, S., Pastorini,
J., Leimgruber, P., Fernando, P. and Santamaría, L.., 2008.. BEHAVIOR
RATHER THAN DIET MEDIATES SEASONAL DIFFERENCES IN SEED
DISPERSAL BY ASIAN ELEPHANTS. Ecology, 89, (10), 2684-2691.
Chapman, C. and Chapman, L., 1997. Forest Regeneration in Logged and
Unlogged Forests of Kibale National Park, Uganda. Biotropica, 29, (4), 396-
412.
Child, G., 1995. Wildlife and People: The Zimbabwean Success. Wisdom
Foundation, Harare & New York
66
Cincotta, R., Wisnewski, J. and Engelman, R., 2000. Human population in the
biodiversity hotspots. Nature, 404, (6781), 990-992.
CITES., 2018. CITES. [online] Available at: https://www.cites.org/ [Accessed
17 Feb. 2017].
Ciuti, S., Northrup, J.M., Muhly, T.B., 2012. Effects of humans on behaviour of
wildlife exceed those of natural predators in a landscape of fear. PLoS One.
Conover, M., 2002. Resolving human-wildlife conflicts. Boca Raton, Fla.:
Lewis Publishers.
Conover, M.R., 2002. Resolving human–wildlife conflicts: the science of
wildlife damage management. Florida: Lewis Publishers.
Corbet, G.B. & Hill, J.E., 1992. THE MAMMALS OF THE INDOMALAYAN
REGION: A SYSTEMATIC REVIEW. Oxford University Press: Oxford,
United Kingdom.
Dale, R.H.I., 2008. The Spatial Memory of African Elephants (Loxodonta
africana): Durability, Interference, and Response Biases. In N.K. Innis (Ed.),
Reflections on Adaptive Behavior: Essays in Honor of J.E.R. Staddon, 143-
169.
Danielsen, F., Beukema, H., Burgess, N., Parish, F., Brühl, C., Donald, P.,
Murdiyarso, D., Phalan, B., Reijnders, L., Struebig, M., Fitzherbert, E., 2009.
Biofuel plantations on forested lands: Double jeopardy for biodiversity and
climate. IOP Conference Series: Earth and Environmental Science, 6, (24).
Denslow, J.S., 1987. Tropical rain-forest gaps and tree species
diversity. Annual Review of Ecology and Systematics, 18, 431–451.
Dickman, A.J., 2010. Complexities of conflict: the importance of considering
social factors for effectively resolving human–wildlife conflict. Animal
conservation, 13, (5), 458-46.
Doyle, S., Groo, M., Sampson, C., Songer, M., Jones, M., Leimgruber, P.,
2010. Human–elephant conflict—What can we learn from the
news. Gajah, 32, 14-20.
Edwards, D., Tobias, J., Sheil, D., Meijaard, E. and Laurance, W., 2014.
Maintaining ecosystem function and services in logged tropical forests. Trends
in Ecology & Evolution, 29,(9), 511-520.
Entwistle, A & Dunstone, N., 2000. Priorities for the conservation of
mammalian diversity: has the panda had its day? Cambridge: Cambridge
University Press.
FAO, 2007. http://faostat.fao.org, [accessed 2nd April 2017]
Fernando, P. & Jennifer Pastorini., 2011. Range Wide Status of Asian
Elephants. Gajah, 35, 15-20.

67
Fleischer, R., Perry, E., Muralidharan, K., Stevens, E. and Wemmer, C., 2001.
PHYLOGEOGRAPHY OF THE ASIAN ELEPHANT (ELEPHAS MAXIMUS)
BASED ON MITOCHONDRIAL DNA. Evolution, 55, (9), 1882.
Flint, E., 1994. Changes in land use in South and Southeast Asia from 1880 to
1980: A data base prepared as part of a coordinated research program on
carbon fluxes in the tropics. Chemosphere, 29, (5), 1015-1062.
Foody, G. & Cutler, M., 2003. Tree biodiversity in protected and logged
Bornean tropical rain forests and its measurement by satellite remote
sensing. Journal of Biogeography, 30, (7), 1053-1066.
Frankham, R., Briscoe, D., McInnes, K. and Ballou, J., 2003. Introduction to
conservation genetics. Cambridge: Cambridge University Press.
Galetti, M., Moleón, M., Jordano, P., Pires, M., Guimarães, P., Pape, T.,
Nichols, E., Hansen, D., Olesen, J., Munk, M., de Mattos, J., Schweiger, A.,
Owen-Smith, N., Johnson, C., Marquis, R. and Svenning, J., 2017. Ecological
and evolutionary legacy of megafauna extinctions. Biological Reviews.
Gaveau, D., Wich, S.A., Marshall, A.J., 2016. Are protected areas conserving
primate habitat in Indonesia? In: An Introduction to Primate Conservation.
Oxford: Oxford University Press.
Gentry, A.H., 1992. Tropical Forest Biodiversity: Distributional Patterns and
Their Conservational Significance. Oikos, 63, (1), 19-28
Gopala, A., Hadian, O., Sunarto., Sitompul, A., Williams, A., Leimgruber, P.,
Chambliss, S.E. & Gunaryadi, D., 2011. Elephas maximus ssp. sumatranus.
The IUCN Red List of Threatened Species 2011.
Graham, M., Douglas-Hamilton, I., Adams, W. and Lee, P., 2009. The
movement of African elephants in a human-dominated land-use mosaic.
Animal Conservation, 12, (5), 445-455.
Granados, A., Weladji, R. and Loomis, M., 2012. Movement and Occurrence
of Two Elephant Herds in a Human-Dominated Landscape, the Bénoué
Wildlife Conservation Area, Cameroon. Tropical Conservation Science, 5, (2),
150-162.
Griffiths, M. & Schaik, C., 1993. The Impact of Human Traffic on the
Abundance and Activity Periods of Sumatran Rain Forest Wildlife.
Conservation Biology, 7, (3), 623-626.
Grubb, P., Turner, I. and Burslem, D., 1994. Mineral nutrient status of coastal
hill dipterocarp forest and adinandra belukar in Singapore: analysis of soil,
leaves and litter. Journal of Tropical Ecology, 10, (04), 559-577.
HAkA Forest Nature & Enviroment of Aceh, 2017. HAkA [online], Banda Aceh,
Sumatra. Available from: http://www.haka.or.id/ [accessed 04/05/17].
68
Hansen, M. C., P. V. Potapov, R. Moore, M. Hancher, S. A. Turubanova, A.
Tyukavina, D. Thau, S. V. Stehman, S. J. Goetz, T. R. Loveland, A.
Kommareddy, A. Egorov, L. Chini, C. O. Justice, and J. R. G. Townshend.,
2013. ―High-Resolution Global Maps of 21st-Century Forest Cover Change.‖
Science, 342, 850–53.
Harmsen, B. J. 2006. The use of camera traps for estimating abundance and
studying the ecology of jaguars (Panthera onca). PhD Dissertation, University
of Southampton, Southampton, UK.
Harmsen, B. J., Foster, R. J., Silver, S., Ostro, L. and Doncaster, C. P., 2010.
Differential Use of Trails by Forest Mammals and the Implications for Camera-
Trap Studies: A Case Study from Belize. Biotropica, 42, 126–133.
Haynes, G., 2012. Elephants (and extinct relatives) as earth-movers and
ecosystem engineers. Geomorphology, 157-158, 99-107.
Hedges, S. & Lawson, D., 2006. Dung Survey Standards for the MIKE
Programme. CITES MIKE Programme, Central Coordinating Unit, Nairobi,
Kenya
Hedges, S., Tyson, M., Sitompul, A., Kinnaird, M., Gunaryadi, D. and Aslan.,
2005. Distribution, status, and conservation needs of Asian elephants
(Elephas maximus) in Lampung Province, Sumatra, Indonesia. Biological
Conservation, 124,(1), 35-48.
Henders S., Persson U.M., Kastner T., 2015. Trading forests: land-use change
and carbon emissions embodied in production and exports of forest-risk
commodities. Environmental Research Letters, 10, (12).
Hoare, R.E. 1999b. Data collection and analysis protocol for human–elephant
conflict situations in Africa. Document prepared for the IUCN African Elephant
Specialist Group‘s Human–Elephant Conflict Working Group, NairobJepson,
P., Jarvie, J.K., MacKinnon, K., Monk, K.A., 2001. The End for Indonesias
Lowland Forests? Science, 292, (5518), 859-861.
Hoare, R.E., 1999a. Determinants of human–elephant conflict in a land‐use
mosaic. Journal of applied ecology, 36(5), 689-700.
Janzen, D., 1983. No Park Is an Island: Increase in Interference from outside
as Park Size Decreases. Oikos, 41, (3), 402.
Jones, C. G., J. H. Lawton, and M. Shachak., 1994. Organisms as ecosystem
engineers. Oikos, 69, 373–386
Kinnaird, M.F., Sanderson, E.W., O'Brien, S.J., Wibisono, H.T. & Woolmer G.,
2003. Deforestation trends in a tropical landscape and implications for
endangered large mammals. Conservation Biology 17, (1), 245–257.
Kitamura, S., Yumoto, T., Poonswad, P., Suzuki, S. and Wohandee, P., 2007.
Rare seed-predating mammals determine seed fate of Canarium euphyllum, a
69
large-seeded tree species in a moist evergreen forest, Thailand. Ecological
Research, 23, (1), 169-177.
Knop, E., Ward, P. and Wich, S., 2004. A comparison of orang-utan density in
a logged and unlogged forest on Sumatra. Biological Conservation, 120,
(2),183-188.
Koh, L.P. & Wilcove, D.S., 2008. Is oil palm agriculture really destroying
tropical biodiversity? Conservation Letters, 1, 60-64.
Kumar, M., Mudappa, D. and Raman, T., 2010. Asian Elephant Elephas
Maximus Habitat Use and Ranging in Fragmented Rainforest and Plantations
in the Anamalai Hills, India. Tropical Conservation Science, 3,(2),143-158.
Kummu, M., de Moel, H., Ward, P. and Varis., 2011. How Close Do We Live to
Water? A Global Analysis of Population Distance to Freshwater Bodies. PLoS
ONE, 6, (6).
Lair, r., 1997. Gone Astray - The Care and Management of the Asian elephant
in Domesticity. Food and Agriculture Organisation of the United Nations (FAO)
Forestry Department, Rome, Italy and Forestry Department Group, Regional
Office for Asia and the Pacific (RAP).
Lamarque, F., Anderson, J., Fergusson, R., Lagrange, M., Osei-Owusu, Y.,
Bakker, L., 2009. Human-wildlife Conflict in Africa. Food and Agriculture
Organization of the United Nations FAO.
Lande, R., 1993. Risks of Population Extinction from Demographic and
Environmental Stochasticity and Random Catastrophes. The American
Naturalist, 142,(6), 911-927.
Laumonier, Y., 1997. The Vegetation and Physiography of Sumatra.
Dordrecht: Springer Netherlands.
Lindeque, M & Lindeque, P.M., 1991. Satellite tracking of elephants in north-
western Namibia. African Journal of Ecology, 29,196-206
Ling, L.E., 2016. Threats to the Conservation of Asian Elephants: A review
study. Journal of Governance & Development, 12, (1), 123-139.
Margona, B.A., Potapov, P.V., Turubanova, S., Stolle, F. & Hansen, M.C.,
2014. Primary forest cover loss in Indonesia over 2000-2012. Nature Climate
Change, 1-6
Margono, B., Turubanova, S., Zhuravleva, I., Potapov, P., Tyukavina, A.,
Baccini, A., Goetz, S. and Hansen, M., 2012. Mapping and monitoring
deforestation and forest degradation in Sumatra (Indonesia) using Landsat
time series data sets from 1990 to 2010. Environmental Research Letters, 7,
(3).
70
McCarthy, J.F., 2000. ‗Wild Logging‘ The Rise and Fall of Logging Networks
and Biodiversity Conservation Projects on Sumatra‘s Rainforest Frontier.
CIFOR Occasional Paper No. 31.
McClanahan, T.R., 1986. Quick population survey method using faecal
droppings and a steady state assumption. African Journal of Ecology, 24, 37–
39.
Mietttinen, J., Shi, C. and Liew, S.C., 2011. Deforestation rates in insular
Southeast Asia between 2000 and 2010. Global Change Biology, 17, 2261-
2270.
Ministry of Environment and Forestry, Government of Indonesia., 2017. ASIAN
ELEPHANT RANGE STATES MEETING. Final report. Jakarta.
Moßbrucker, A., Imron, M., Pudyatmoko, S. and Pratje, P., 2016b. Modelling
The Fate of Sumatran Elephants in Bukit Tigapuluh Indonesia: Research
Needs & Implications for Population Management. Jurnal Ilmu Kehutanan, 10,
(1).
Moßbrucker, A.M., Fleming, C.H., Imron, M.A., Pudyatmoko, S., 2016a.
AKDEC home range size and habitat selection of Sumatran elephants. Wildlife
Research, 43, (7), 566-575.
Mwambola, S., Ijumba, J., Kibasa, W., Masenga, E., Eblate, E. & Munishi, L.,
2016. Population size estimates and distribution of the African elephant using
the dung surveys method in Rubondo Island National Park, Tanzania.
International Journal of Biodiversity and Conservation, 8, (6), 113-119.
NASA., 2018. Shuttle Radar Topography Mission. [online] Available at:
https://www2.jpl.nasa.gov/srtm/index.html [Accessed 16 Dec. 2017].
Nyhus, P., & Tilson, R., 2004. Agroforestry, elephants, and tigers: balancing
conservation theory and practice in human-dominated landscapes of
Southeast Asia. Agriculture Ecosystems & Environment 104, 87-97.
Nyhus, P.J., Tilson, R. & Sumianto., 2000. Crop-raiding and conservation
implications at Way Kambas National Park, Sumatra, Indonesia. Oryx, 34, (4),
262-274.
Oelrichs, C.M.C., Lloyd, D.J., Christidis, L., 2016. Strategies for mitigating
forest arson and elephant conflict in Way Kambas National Park, Sumatra,
Indonesia. Tropical Conservation Science, 9, (2), 565-583.
Okuda, T., Suzuki, M., Adachi, N., Quah, E., Hussein, N. and Manokaran, N.,
2003. Effect of selective logging on canopy and stand structure and tree
species composition in a lowland dipterocarp forest in peninsular
Malaysia. Forest Ecology and Management, 175, (1-3), 297-320.
Olivier, R.C.D., 1978. On the ecology of the Asian elephant. Unpulished Ph.D
Dissertation. University of Cambridge, Cambridge, U.K.
71
Owen-Smith, N. 1988. Megaherbivores: The influence of very large body size
on ecology. Cambridge University Press, Cambridge. 368-369
PAN, W., LIN, L., LUO, A. and ZHANG, L., 2009. Corridor use by Asian
elephants. Integrative Zoology, 4, (2), 220-231.
Parker, G.E., Osborn, F.V., Hoare, R.E., Niskanen, L.S., 2007. Human–
Elephant Conflict Mitigation: A Training Source for Community-Based
Approaches in Africa. IUCN Species Survival Commission, African Elephant
Specialist Group, Human–Elephant Conflict Task Force. Nairobi.
Perera, O., 2009. The human-elephant conflict: A review of current status and
mitigation methods. Gajah, 30, 41-52.
Polansky, L., Kilian, W. and Wittemyer, G.., 2015. Elucidating the significance
of spatial memory on movement decisions by African savannah elephants
using state-space models. Proceedings of the Royal Society B: Biological
Sciences, 282, (1805).
Pradhan, N. & Wegge, P., 2007. Dry season habitat selection by a
recolonizing population of Asian elephants Elephas maximus in lowland
Nepal. Acta Theriologica, 52, (2), 205-214.
Pringle, R., 2008. ELEPHANTS AS AGENTS OF HABITAT CREATION FOR
SMALL VERTEBRATES AT THE PATCH SCALE. Ecology, 89, (1), 26-33.
Purvis, A., Gittleman, J., Cowlishaw, G. and Mace, G., 2000. Predicting
extinction risk in declining species. Proceedings of the Royal Society B:
Biological Sciences, 267,(1456),1947-1952.
Reid, A., 2005. An Indonesian Frontier: Acehnese and Other Histories of
Sumatra. Singapore: NUS Press, 114-115.
Rizwar., Dahlan, Z., Setyawan, D., Yustian, I., 2014. Selection of Sumatra
Elephants (Elephas maximus sumatranus Temminck, 1847) Toward Habitat
Types and Resources in Wildlife Sanctuary of Padang Sugihan, South
Sumatra Province. Advances in Environmental Biology, 8, (21), 403-410.
Robertson, J. and van Schaik, C., 2001. Causal factors underlying the
dramatic decline of the Sumatran orang-utan. Oryx, 35(1), 26-38.
Rood, E., Ganie, A.A., Nijman, V., 2010. Using presence-only modelling to
predict Asian elephant habitat use in a tropical forest landscape: implications
for conservation. Diversity & Distributions, 16, 975-984.
Rutten, G., Ensslin, A., Hemp, A. & Fischer, M., 2015. Forest structure and
composition of previously selectively logged and non-logged montane forests
at Mt. Kilimanjaro. Forest Ecology and Management, 337, 61-66.
Santiapillai, C & Sukumar, R., 2006. An overview of the status of the Asian
elephant. Gajah, 25, 3-8.
72
Santiapillai, C. & Jackson, P., 1990. The Asian Elephant: An Action Plan for its
Conservation. Gland, Switzerland: IUCN/SSC Asian Elephant Specialist
Group. Science, 297 (2002), 999-1002
Santiapillai, C. & Suprahman, H., 1995. The Sumatran elephant (Elephas
maximus sumatranus): Its population structure impact on woody vegetation in
the Way Kambas National Park, Sumatra, Indonesia. Gajah. 1, 10-27
Seidensticker, J., 1984. Managing elephant predation in agricultural and
forestry projects.The World Bank, Washingon DC
Shoshani, J., and Eisenberg, J.F., 1982. Elephas maximus. Mammalian
Species, 182, 1-8.
Siegel, S., & Castellan, N. J., 1988. Nonparametric statistics for the behavioral
sciences (2nd ed.) New York: McGraw-Hill.
Sitompul, A.F., Griffin, C.R., Fuller, T.K., 2013b. Sumatran elephant ranging
behavior in a fragmented rainforest landscape. International Journal of
Biodiversity & Conservation, 5, (2), 66-72.
Sitompul, A.F., Griffin, C.R., Rayl, N.D., Fuller, T.K., 2013a. Spatial and
Temporal Habitat Use of an Asian Elephant in Sumatra. Animals, 3, 670-679.
Sitompul, A.F., Linkie, M., Gunaryadi, D., Purastuti, E., Budiman, A., 2011.
Ecosystem Restoration Concessions: A New Strategy for Conserving
Elephant Habitat in Sumatra? Gajah, 34, 26-31.
Sodhi, N., Koh, L., Clements, R., Wanger, T., Hill, J., Hamer, K., Clough, Y.,
Tscharntke, T., Posa, M. and Lee, T., 2010b. Conserving Southeast Asian
forest biodiversity in human-modified landscapes. Biological Conservation,
143, (10), 2375-2384.
Sodhi, N.S., Koh, L.P., Brook, B.W., Ng, P.K., 2004a. Southeast Asian
Biodiversity: an impending disaster. Trends in Ecology and Evolution, 19, (12),
654-660.
Sodhi, N.S., Posa, M.R.C., Lee, T.M., Bickford, D., Koh, L.P., Brook, B.W.,
2010a. The state and conservation of Southeast Asian biodiversity.
Biodiversity & Conservation, 19, (2), 317-328.
Soehartono, T., Kusuma, A.K & Indonesia 2007a. Direktorat Jenderal PHKA
2007, Strategi dan rencana aksi konservasi gajah Sumatera dan gajah
Kalimantan, 2007-2017, Direktorat Jenderal Perlindungan Hutan dan
Konservasi Alam, Departemen Kehutanan R.I, [Jakarta]
Soehartono, T., Susilo HD, Sitompul AF, Gunaryadi D, Purastuti EM, Azmi W,
Fadhli N, Stremme, C., 2007b. The strategic and action plan for Sumatran and
Kalimantan elephant. Departemen Kehutanan (Ministry of Forestry), Jakarta.
Indonesia.

73
Songhurst, A., McCulloch, G. and Coulson, T., 2015. Finding pathways to
human–elephant coexistence: a risky business. Oryx, 50, (04), 713-720.
Suba, R.B., van der Ploeg, J., van‘t Zelfde, M., Lau, Y.W., Wissingh, T.F.,
Kustiawan, W., de Snoo, G.R., de longh, H.H., 2017. Rapid Expansion of
Palm Oil Is Leading to Human-Elephant Conflicts in North Kalimantan
Pronvice of Indonesia. Tropical Conservation Science, 10, 1-12.
Sukumar, R. & Santiapillai, C., 1993. Asian Elephant in Sumatra Population
and Habitat Viablity Anaylsis. Gajah, 11.
Sukumar, R. 2003. The living elephants. New York: Oxford University Press,
Sukumar, R., 1993. Minimum Viable Populations for elephant conservation.
Gajah, 11.
Sukumar, R., 2006. A brief review of the status, distribution and biology of wild
Asian elephants Elephas maximus. International Zoo Yearbook, 40, (1), 1-8.
Sulistyawan, B., Eichelberger, B., Verweij, P., Boot, R., Hardian, O., Adzan, G.
and Sukmantoro, W. 2017. Connecting the fragmented habitat of endangered
mammals in the landscape of Riau–Jambi–Sumatera Barat (RIMBA), central
Sumatra, Indonesia (connecting the fragmented habitat due to road
development). Global Ecology and Conservation, 9, 116-130.
Sumatran Orangutan Conservation Programme., 2015. Sikundur Monitoring
Post Annual Report for 2015. Sumatran Orangutan Conservation Programme.
Thomas, M. 2017 [unpublished]. Uncovering the hidden impacts and
underlying human conflicts of human-elephant interactions around the Leuser
Ecosystem, northern Sumatra. Master‘s Degree. University of London (UCL).
Tyson, M.J., Hedges, S., Sitompul, A.F., 2002. Elephant Defecation Rate
Study, Way Kambas National Park 2000/2001: Final Report to WWF, WCS,
and PHKA, 5 January 2002. Wildlife Conservation Society , Indonesia
Program, Bogor, Indonesia.
UNESCO., 2017. Tropical Rainforest Heritage of Sumatra. [online].Available
at: http://whc.unesco.org/en/list/1167 [Accessed 21 Dec. 2017].
Valeix, M., Fritz, H., Matsika, R., Matsvimbo, F., Madzikanda, H., 2007. The
role of water abundance, thermoregulation, perceived predation risk and
interference competition in water access by African herbivore. Afr. J. Ecol, 46,
402–410.
Valeix, M., Fritz, H., Sabatier, R., Murindagomo, F., gCumming, D. and
Duncan, P., 2011. Elephant-induced structural changes in the vegetation and
habitat selection by large herbivores in an African savanna. Biological
Conservation, 144, (2), 902-912.
74
van Beukering, P., Cesar, H. and Janssen, M., 2003. Economic valuation of
the Leuser National Park on Sumatra, Indonesia. Ecological Economics, 44,
(1), 43-62.
van der Werf, G., Morton, D., DeFries, R., Olivier, J., Kasibhatla, P., Jackson,
R., Collatz, G. and Randerson, J., 2009. CO2 emissions from forest loss.
Nature Geoscience, 2, (11), 737-738.
van Heurn, J. H. R. 1929. De olifantenvan Sumatra.
Vanleeuwe, H. & Probert, J., 2014. Decay rate of elephant dung in Conkouati-
Douli National Park, Republic of Congo. Pachyderm, 55, 89-91.
VANLEEUWé, H. and GAUTIER-HION, A., 1998. Forest elephant paths and
movements at the Odzala National Park, Congo: the role of clearings and
Marantaceae forests. African Journal of Ecology, 36, (2), 174-182.
Vidya, T., 2016. Evolutionary History and Population Genetic Structure of
Asian Elephants in India. Indian Journal of History of Science, 51, (2.2).
Vijay, V., Pimm, S.L., Jenkins, C.N., Smith, S.J., 2016. The Impacts of Oil
Palm on Recent Deforestation and Biodiversity Loss. PLoS ONE, 11, (7).
Walsh, P. and White, L., 1999. What It Will Take to Monitor Forest Elephant
Populations. Conservation Biology, 13, (5), pp.1194-1202.
White, L., 1995. Factors affecting the duration of elephant dung piles in rain
forest in the Lope Reserve, Gabon. African Journal of Ecology, 33, (2), 142-
150.
Whitmore, T., 1998. An introduction to tropical rain forests. Oxford: Oxford
University Press.
Woodroffe, R., Thirgood, S., Rabinowitz, A., 2005. People and Wildlife,
Conflict or Co-existence? Cambridge University Press. Volume 9.
Wright, J. P & C. G. Jones., 2006. The concept of organisms as ecosystem
engineers ten years on: progress, limitations, and challenges. BioScience, 56,
203–209.
Zahrah, M., Alikodra, H.S., Nasution, Z., 2014. Evaluation on Habitat
Suitability Index of Sumatran Elephant (Elephas maximus sumatranus) In
Jantho Pinus Nature Reserve, Aceh. The international Journal: Research
Journal of Science & IT Management, 3, (4).
Zhang, L. & Wang, N., 2003. An initial study on habitat conservation of Asian
elephant (Elephas maximus), with a focus on human elephant conflict in
Simao, China. Biological Conservation, 112, (3), 453-459.
Zhou, Y., Buesching, C., Newman, C., Kaneko, Y., Xie, Z. and Macdonald, D.,
2013. Balancing the benefits of ecotourism and development: The effects of

75
visitor trail-use on mammals in a Protected Area in rapidly developing
China. Biological Conservation, 165, 18-24.