suitability of north american regional reanalysis … · et al., 2013), but high-elevation...
TRANSCRIPT

HYDROLOGICAL PROCESSESHydrol. Process. 30, 2332–2347 (2016)Published online 6 March 2016 in Wiley Online Library(wileyonlinelibrary.com) DOI: 10.1002/hyp.10795
Suitability of North American Regional Reanalysis (NARR)output for hydrologic modelling and analysis in mountainous
terrain
Joel W. Trubilowicz,1* J. M. Shea,2 G. Jost3 and R. D. Moore1,41 Department of Geography, University of British Columbia, 1984 West Mall, Vancouver, BC, V6T 1Z2, Canada
2 International Centre for Integrated Mountain Development, GPO Box 3226, Kathmandu, Nepal3 Generation Resource Management, BC Hydro, 6911 Southpoint Dr., Burnaby, BC, V3N 4X8, Canada
4 Department of Forest Resource Management, University of British Columbia, 225-1984 West Mall, Vancouver, BC, V6T 1Z2, Canada
*CoUn1Z2E-m
Cop
Abstract:
Meteorological observations at high elevations in mountainous regions are often lacking. One opportunity to fill this data gap isthrough the use of downscaled output from weather reanalysis models. In this study, we tested the accuracy of downscaled outputfrom the North American Regional Reanalysis (NARR) against high-elevation surface observations at four ridgetop locations inthe southern Coast Mountains of British Columbia, Canada. NARR model output was downscaled to the surface observationlocations through three-dimensional interpolation for air temperature, vapour pressure and wind speed and two-dimensionalinterpolation for radiation variables. Accuracy was tested at both the 3-hourly and daily time scales. Air temperature displayed ahigh level of agreement, especially at the daily scale, with root mean square error (RMSE) values ranging from 0.98 to 1.21 °Cacross all sites. Vapour pressure downscaling accuracy was also quite high (RMSE of 0.06 to 0.11 hPa) but displayed some sitespecific bias. Although NARR overestimated wind speed, there were moderate to strong linear relations (r2 from 0.38 to 0.84 fordaily means), suggesting that the NARR output could be used as an index and bias-corrected. NARR output reproduced theseasonal cycle for incoming short-wave radiation, with Nash–Sutcliffe model efficiencies ranging from 0.78 to 0.87, but accuracysuffered on days with cloud cover, resulting in a positive bias and RMSE ranged from 42 to 46Wm� 2. Although fewer data wereavailable, incoming long-wave radiation from NARR had an RMSE of 19Wm� 2 and outperformed common methods forestimating incoming long-wave radiation. NARR air temperature showed potential to assist in hydrologic analysis andmodelling during an atmospheric river storm event, which are characterized by warm and wet air masses with atypical verticaltemperature gradients. The incorporation of a synthetic NARR air temperature station to better represent the higher freezinglevels resulted in increased predicted peak flows, which better match the observed run-off during the event. Copyright © 2016John Wiley & Sons, Ltd.
KEY WORDS mountain hydrology; reanalysis; downscaling; hydrologic modelling; hydrologic forecasting
Received 31 August 2015; Accepted 19 January 2016
INTRODUCTION
The predictions in ungauged basins decade of 2003–2013recognized a lack of observations as one of the primaryobstacles to increasing our understanding of hydrologicprocesses (Sivapalan et al., 2003). Great strides have beenmade in the realms of remote sensing and alternativeobservation networks over this time period (Hrachowitzet al., 2013), but high-elevation meteorological observa-tions remain one of the major needs for hydrologicmodelling and analysis in mountainous environments(Moore et al., 2013). Because of the logistical difficultiesand hazards of installation and maintenance, as well as the
rrespondence to: Joel W. Trubilowicz, Department of Geography,iversity of British Columbia, 1984 West Mall, Vancouver, BC V6T, Canada.ail: [email protected]
yright © 2016 John Wiley & Sons, Ltd.
volatile weather that can affect the ability to collectaccurate observations, environmental observation net-works are often missing high-elevation data.In situations in which high-elevation data are lacking,
observations from low-elevation stations are typicallyextrapolated to higher elevations, with orographic effectsaddressed by application of vertical gradients and othertopographic adjustments. Routines and software packageshave been developed to estimate weather variables atindividual points (e.g. Running et al., 1987) and ingridded spatial fields (e.g. Thornton et al., 1997; Listonand Elder, 2006); however, fundamental assumptionsabout the vertical gradient of variables must be made inthese situations.Numerous studies have focused on the interpolation/
extrapolation of air temperature (e.g. Bolstad et al., 1998;Jarvis and Stuart, 2001; Hasenauer et al., 2003; Garen and

2333SUITABILITY OF NARR OUTPUT FOR HYDROLOGY
Marks, 2005). In British Columbia (BC), for example,Stahl et al. (2006) found that knowledge of the verticaltemperature gradient was the dominant factor in estimat-ing high-elevation temperatures. A major challenge inestimating high-elevation air temperature is that thetemperature gradient can vary substantially in space andtime, and even within and between individual stormevents.In comparison with air temperature, less research has
addressed the extrapolation of other variables. Watervapour content is often assumed to be relatively spatiallyhomogeneous and closely related to the minimum dailyair temperature at a site (Running et al., 1987). Kimballet al. (1997) estimated water vapour content through anempirical method based on the daily air temperature,mean annual precipitation and potential evapotranspira-tion. Garen and Marks (2005) distributed vapourpressure by elevation through a combination of upperair soundings and limited surface measurements. Windspeed and direction are highly variable in space and timeand closely linked to local land cover and topography(Barry, 2008). Most work on interpolation/extrapolationof wind observations in mountainous areas has involvedmodelling the effects of the topography on wind speedfor the purposes of predicting snow deposition, redistri-bution and melt (e.g. Winstral and Marks, 2002; Mottand Lehning, 2010). Similar to their approach forvapour pressure, Garen and Marks (2005) used upperair soundings to create 3-hourly wind speed fields fordifferent elevations. Methods for estimating incomingshort-wave and long-wave radiation typically requireair temperature observations at the high-elevation site.Daily incoming short-wave radiation is often estimatedusing an approach based on that of Bristow andCampbell (1984), which uses daily air temperature rangeto estimate atmospheric transmissivity. Bristow andCampbell (1984) noted that the accuracy of this methodis dependent on site-specific parameter calibration.Clear-sky long-wave radiation is often estimated usingair temperature and vapour pressure at a site usingempirical formulae such as that presented by Prata(1996).An alternative to interpolation/extrapolation from
observational networks is to downscale output fromatmospheric models, either to infill missing data (Wayand Bonnaventure, 2015) or to drive hydrologicmodels (e.g. Wilby et al., 2000; Bastola and Misra,2014), but many atmospheric models are too coarsespatially to represent meteorological variation withinmountainous environments at the subregional scale.Regional reanalysis models offer a higher resolutionwith greater potential in mountainous environmentsand smaller scales. Fiddes and Gruber (2014) devel-oped the TopoSCALE application to downscale output
Copyright © 2016 John Wiley & Sons, Ltd.
from the ERA-Interim 0.75° resolution reanalysismodel (Dee et al., 2011) and noted that the sametechniques could likely be applied to other regionalreanalysis products.With a 32-km (∼0.3°) spatial resolution, the North
American Regional Reanalysis (NARR) model (Mesingeret al., 2006) is the highest-resolution reanalysis model forNorth America. NARR temperature output has beenfound to provide utility for accurately reproducing surfaceobservations in mountainous areas. Holden et al. (2015)created a 250-m resolution temperature data set for the USNorthern Rocky Mountains using a combination ofmodelled solar insolation and soil moisture, GIS-basedtopography and landcover and lapse rates derived fromNARR temperature output, and found mean absoluteerrors <1.4 °C when compared with surface observationsfor daily maximum and minimum temperature. NARRoutput has been used directly as input to macro-scalehydrologic models (e.g. Woo and Thorne, 2006; Choiet al., 2009), in regional water budget calculations (e.g.Luo et al., 2007; Ruane, 2010; Sheffield et al., 2012), andinterpolated and downscaled for use in a glaciation model(Jarosch et al., 2012). Choi et al. (2009) and Keshta andElshorbagy (2011) found that NARR output providedutility for hydrologic purposes, especially when otherobservations are unavailable. However, those two studiesfocused on the Canadian Prairies, where the topography isgenerally low relief. The utility of NARR output forhydrologic purposes in mountainous regions hasremained relatively unexplored.Although the horizontal resolution of NARR output
is likely not detailed enough to drive a hydrologic modelfor small-scale to medium-scale catchments (e.g. upto 1000 km2 in area) without ground-based supportingobservations in a mountainous region, it might haveutility as a supplement to data from observationnetworks, particularly for extrapolating to higher eleva-tions. Reanalysis output might be expected to performbest on high alpine ridges, where the influence of theboundary layer is at a minimum (Barry, 2008). However,the performance of NARR in replicating observationaldata at these locations has received little attentionbecause of the lack of high-elevation observations(Jarosch et al., 2012).In this study, our primary goal is to assess the utility
of NARR output for hydrologic analysis and modellingin a mountainous region. We do this by (1) comparingdownscaled NARR output to surface observations atautomated weather stations (AWS) located at ridgetoplocations (Shea and Moore, 2010) and (2) illustratingthe potential utility of NARR output as high-altitudeintelligence for modelling snow dynamics andstreamflow response to an atmospheric river (AR) event(Zhu and Newell, 1998), which are often poorly forecast
Hydrol. Process. 30, 2332–2347 (2016)

2334 J. W. TRUBILOWICZ ET AL.
because of incorrectly specified storm freezing levels(Moore, 1993; Rössler et al., 2014).
STUDY AREA
The study was conducted in the southern CoastMountains of BC, Canada, a rugged, mountainous regionwith elevations ranging from sea level to greater than2500m (Figure 1). Topography is dominated byU-shaped main valleys fed by steep tributary streams,which are typically headed by cirque basins. The regioncontains substantial ice cover in the form of cirqueglaciers, as well as high-elevation ice fields drained byvalley glaciers.The climate is generally moist maritime, with mild
temperatures, wet winters and relatively dry summers.Low-elevation areas near sea level generally receive mostprecipitation in the form of rain, whereas seasonallycontinuous snow cover with upwards of 2000mm ofsnow water equivalent commonly occurs above 1000m.There is a marked west-east climatic gradient, with strongmaritime conditions on the upwind slopes and the coastaldivide, grading to drier conditions east of the divide.Elevations near sea level are dominated by the Coastal
Western Hemlock biogeoclimatic zone, shifting first tothe Mountain Hemlock zone and then alpine vegetation athigher elevations (Klinka et al., 1991). In the drier,eastern portions of the Coast Mountains, the CoastalWestern Hemlock and Mountain Hemlock zones arereplaced by the Interior Douglas-fir and Montane Sprucezones, respectively.
Figure 1. Study region, showing locations of automated weather stations. TheNorth American Regional Reanalysis (NARR) grid poin
Copyright © 2016 John Wiley & Sons, Ltd.
METHODS
Weather observations
Meteorological data used in this study were collectedfrom ridgetop AWS to minimize boundary layer effects,particularly those associated with katabatic flow(Shea and Moore, 2010). Station locations are shownin Figure 1. Measured variables include air temperature(Ta, °C), relative humidity (RH, %), wind speed(w, m s� 1) and direction (θ, °), incoming short-waveradiation (K↓, Wm� 2) and incoming long-wave radia-tion (L↓, Wm� 2) (Table I). Sensors were scanned everysecond, and averaged values were recorded at 10-minintervals. Data were recorded year-round at the Bridge,Helm and Weart sites, but only during summer at Place.Further details on the instrumentation and collectionof surface observations can be found in Shea andMoore (2010).Vapour pressure (ea, hPa) was calculated as follows:
ea ¼ es� RH100 (1)
where RH is relative humidity (%) and es is the saturationvapour pressure (kPa), computed as in Buck (1981):
es ¼0:611� exp 17:37�Ta
Ta þ 238:9
� �: Ta≥0
0:611� exp 22:45�Ta
Ta þ 272:5
� �: Ta < 0
8>>><>>>: (2)
catchment area for BC Hydro’s Daisy Lake Reservoir is shown in orange.ts are shown in red. AWS, automated weather station
Hydrol. Process. 30, 2332–2347 (2016)

Table I. High-elevation site data
Site name Z (m) NARR Z (m) Date range Ta RH w θ K↓ L↓
Bridge 1640 1650 September 2006 to August 2008 ✓ ✓ ✓ ✓ ✓Helm 2192 1248 August 2006 to September 2008 ✓ ✓ ✓ ✓ ✓Place 2075 1519 May 2007 to September 2008 ✓ ✓ ✓Weart 2220 1456 July 2006 to September 2008 ✓ ✓ ✓ ✓ ✓
Z is the site elevation (m), and NARR Z is the elevation of the 32-km resolution NARR grid cell in which each site is located.NARR, North American Regional Reanalysis; RH, relative humidity.
1http://www.esrl.noaa.gov/psd/thredds/dodsC/Datasets/NARR/
2335SUITABILITY OF NARR OUTPUT FOR HYDROLOGY
NARR products
The NARR model (Mesinger et al., 2006) uses surface,radar and satellite observations as input. Output is griddedat a resolution of 32 km (approximately 0.3°), with a 3-htime step at multiple pressure levels for more than 400meteorological variables from 1979 to near present. Weextracted Ta, specific humidity (qa), wind velocity fromeast–west (U) and north–south components (V), K↓ andL↓ for comparison with surface observations.For Ta, qa and wind velocity (U and V components),
NARR output is given at multiple pressure levels, witheach pressure level having a corresponding dynamicgeopotential height. Thus, the interpolation was per-formed in three dimensions. For each time step, the twonearest heights to the elevation of a site were selected ateach of the four nearest NARR centroids (Figure 1), andthe desired variable was linearly interpolated to thereference elevation of the site. Following this verticalinterpolation, inverse distance weighting of the fournearest NARR centroids was used to interpolate horizon-tally to the station location. These multilevel variablesrepresent instantaneous measures at a 3-h time step.North American Regional Reanalysis short-wave and
long-wave radiation are only available as mono-leveloutput at the earth’s surface as represented in the NARRdigital elevation model. These variables were onlyinterpolated in two dimensions, using inverse distanceweighting interpolation from the four nearest points.These mono-level variables represent the mean irradianceover a 3-h time step, with the time stamp at the start of the3-h interval.The NARR-specific humidity and U (westerly) and
V (northerly) components of the wind vector were post-processed for direct comparison to surface observations.Wind speed was computed from the vector windswith the Pythagorean theorem, and qa was convertedto ea (kPa):
ea ¼ qaP
0:0378�qa þ 0:0622(3)
where P is the air pressure supplied directly from NARR(kPa) at the geopotential height of the station (m).
Copyright © 2016 John Wiley & Sons, Ltd.
North American Regional Reanalysis variables wereextracted using the ‘ncdf’ package (Pierce, 2014) in the Rcomputing language (R Development Core Team, 2015).Data were extracted from the National Oceanic andAtmospheric Administration data server,1 and all post-processing was performed using R.
Alternative methods for estimating incoming radiation
Some commonly used methods for estimating incom-ing short-wave and long-wave radiation at remote siteswere applied in order to assess whether the NARR outputprovided any additional skill relative to those methods.Potential direct incoming solar radiation (K↓ P) was
calculated at each site at both the 3-hourly and daily timesteps using standard solar geometry equations from Iqbal(1983) and the potential incoming short-wave solarradiation equation from Hock (1999), which wasmodified by Jost et al. (2012) as follows:
K↓P ¼ I0�E0�τp0
cos θsð Þ� cos θsð Þ (4)
p0 ¼ e�z
8434:5 (5)
where I0 is the solar constant, E0 is the earth orbiteccentricity factor (Iqbal, 1983), τ is the mean atmo-spheric clear sky transmissitivity (set at 0.75 as in Hock(1999)), z is the site elevation and θs is the solar zenithangle.In order to assess the potential benefits of using NARR
output over more common methods, incoming long-waveradiation was estimated by the Stefan–Boltzmann lawusing both an assumed emissivity (ε) of 0.85 and anemissivity calculated using the Prata (1996) equation:
ε ¼ 1� 1þ ξð Þe�1:2þ 3:0ξ0:5 (6)
ξ ¼ e0T 0
�46:5 (7)
where T0 is the surface temperature (K) and e0 is thevapour pressure (hPA).
Hydrol. Process. 30, 2332–2347 (2016)

2336 J. W. TRUBILOWICZ ET AL.
Performance measures
The NARR downscaling skill (and accuracy of alternativeestimation methods) was assessed using the mean bias error(MBE), root mean square error (RMSE), the Nash–Sutcliffemodel efficiency (Em) (Nash and Sutcliffe, 1970) and thecoefficient of determination for a linear regression of NARRversus observed (r2), as follows:
MBE ¼ 1n
Xyi � xið Þ (8)
RMSE ¼ffiffiffiffiffiffiffiffiffiffiffiffiffiffiffiffiffiffiffiffiffiffiffiffiffiffiffiffiffi1n
Xyi � xið Þ2
r(9)
Em ¼ 1�∑ yi � xið Þ2∑ xi � xð Þ2 (10)
r2 ¼ 1�∑ byi � yð Þ2∑ yi � yð Þ2 (11)
Figure 2. Observed and downscaled variables for 1 to 8 July 2008 at theBridge Glacier site at a 3-h interval. NARR, North American Regional
Reanalysis
Copyright © 2016 John Wiley & Sons, Ltd.
where yi is the value predicted by NARR and xi is theobserved value at time step i, x is the mean value of allobservations, n is the number of observations, y is the meanof all NARR output and ŷi is the value predicted by a linearmodel between NARR and observations. We calculatedperformance measures for both daily mean and instanta-neous (3-hourly) downscaled data.
RESULTS
Example time series
Subsets of the downscaled and observed meteorologicaldata at Bridge and Place Glacier sites illustrate the 3-hourlydata (Figures 2 and 3). NARR-predicted air temperaturefollows the observed diel and multi-day variations at bothsites. Vapour pressure follows well with observations at thePlace Glacier site (Figure 3), but NARR significantlyoverestimates ea at the Bridge Glacier site during the first3 days (Figure 2). Wind speeds from NARR are of similarmagnitude to observations at the Bridge Glacier site but donot appear to closely follow individual observations(Figure 2). Downscaled incoming solar radiation tracksobservations during most clear days at the Bridge Glaciersite, but not during periods with cloud cover (Figure 2).Downscaled incoming long-wave radiation is of similarmagnitude to observations at the Place Glacier site but doesnot appear to correlate well with observations (Figure 3)
Figure 3. Observed and downscaled variables for 1 to 8 July 2008 at the PlaceGlacier site at a 3-h interval. NARR, North American Regional Reanalysis
Hydrol. Process. 30, 2332–2347 (2016)

Figure 4. Comparison of North American Regional Reanalysis (NARR)-derived and observed mean daily air temperature. The straight line
indicates perfect agreementFigure 5. Monthly distribution of error between North American Regional
Reanalysis (NARR)-derived and observed mean daily air temperature
2337SUITABILITY OF NARR OUTPUT FOR HYDROLOGY
Air temperature
There were strong linear relations between observationsand NARR downscaled mean daily air temperature at allsites (Figure 4). An over-prediction of 1–2 °C at temperaturesbelow�10 °C can be seen at the Bridge andWeart sites. Theseasonality of error is shown in Figure 5. There is no strongseasonal component to the error, but NARR-estimatedtemperatures at Bridge and Weart tend to be greater thanobserved in winter. As Place data were only available duringsummer, an investigation of seasonality was not possible.
Copyright © 2016 John Wiley & Sons, Ltd.
The downscaled NARR output had a slight negative bias atthe Place site, whereas all other sites had a small, positiveMBE. RMSE, Em and r2 improved in all cases by integratingto daily resolution from 3-h values (Table II).
Vapour pressure
Downscaled values of mean daily ea are highly correlatedwith the observations (Figure 6), althoughmoreweakly thanfor Ta. Vapour pressure was over-predicted by NARR at theBridge site, but under-predicted at the Helm site, with low
Hydrol. Process. 30, 2332–2347 (2016)

Figure 6. Comparison of North American Regional Reanalysis (NARR)-derived and observed mean daily vapour pressure. The straight line
indicates perfect agreement
Table II. Performance measures for air temperature at each site
3-h Daily
Site MBE (°C) RMSE (°C) Em r2 RMSE (°C) Em r2
Bridge 0.17 1.58 0.96 0.96 1.21 0.97 0.98Helm 0.43 1.67 0.95 0.95 1.07 0.98 0.98Place �0.13 1.31 0.94 0.94 0.80 0.98 0.98Weart 0.47 1.61 0.96 0.96 0.98 0.98 0.99
MBE, mean bias error; RMSE, root mean square error.
Figure 7. Monthly variation of error between North American RegionalReanalysis (NARR)-derived and observed mean daily vapour pressure
2338 J. W. TRUBILOWICZ ET AL.
Copyright © 2016 John Wiley & Sons, Ltd. Hydrol. Process. 30, 2332–2347 (2016)

Table III. Performance measures for vapour pressure at each site
3-h Daily
Site MBE (hPa) RMSE (hPa) Em r2 RMSE (hPa) Em r2
Bridge 0.09 0.13 0.58 0.84 0.11 0.62 0.89Helm �0.05 0.12 0.69 0.75 0.10 0.77 0.84Place 0.02 0.11 0.55 0.60 0.08 0.66 0.70Weart 0.02 0.08 0.85 0.86 0.06 0.91 0.92
MBE, mean bias error; RMSE, root mean square error.
2339SUITABILITY OF NARR OUTPUT FOR HYDROLOGY
bias for the Place and Weart Glacier sites. Figure 7 revealsthis is mostly due to differences in error during summer.Performance measures for vapour pressure (Table III)indicate good downscaling skill, although slightly lessstrong than for Ta. MBEwas negative for Helm and positivefor all other sites. As with Ta, daily integration improvedRMSE, Em and r2 in all cases.
Figure 8. Comparison of North American Regional Reanalysis (NARR)-derived and observed mean daily wind speed. The straight line indicates
perfect agreement
Copyright © 2016 John Wiley & Sons, Ltd.
Wind speed
Downscaled NARR output consistently and stronglyover-predicted wind speed at Helm and Weart glaciers(Figure 8). The over-prediction is most prevalent inthe winter season, when the southern Coast Mountainsexperience frequent mid-latitude storms (Figure 9).The positive bias is most likely due to NARR being
Figure 9. Monthly distribution of error between North AmericanRegional Reanalysis (NARR)-derived and observed mean daily
wind speed
Hydrol. Process. 30, 2332–2347 (2016)

Figure 10. Comparison of North American Regional Reanalysis (NARR)-derived and observed mean daily K↓. The straight line indicates perfect
agreement
2340 J. W. TRUBILOWICZ ET AL.
designed to represent the free atmosphere, whilesurface friction acts to reduce wind speeds measuredon the ground.The bias in the NARR-derived wind speeds is reflected
in the performance indices (Table IV). In particular, thenegative model efficiencies indicate that the observedmean is a better predictor than the NARR values. RMSEwas improved in every case by resampling to dailyresolution; however, Em was decreased for the Weart site.As expected, MBE was positive in all cases. Althoughthere was a positive bias, there was a reasonable linearrelation between NARR output and observed windspeeds, particularly at the Weart Glacier site.
Incoming short-wave radiation
Observed and downscaled K↓ are correlated, althoughthe spread is greater than for Ta, ea or wind speed(Figure 10). Performance measures for K↓ indicate largeimprovements in RMSE when data are integrated to dailyresolution (Table V). Em decreased when integrated todaily values in all cases, likely because of the removal ofthe diurnal cycle of short-wave radiation, which iscaptured well by NARR (Figure 2). MBE was positivefor all sites.The downscaled NARR output outperformed the
modified Hock (1999) model, which yielded higherRMSE and lower Em and r2 (Table VI). The NARRoutput and the Hock (1999) model had similar patterns ofbias among the three sites.
Incoming long-wave radiation
Observed and interpolated long-wave radiation fromNARR are poorly correlated (Figure 11), although theperiod of record was more limited than for the othervariables. With only one site and only two summer’s data, itwas more difficult to assess the performance of NARR forpredicting L↓, or the seasonal variability in errors. Long-wave radiation interpolated from NARR performed betterthan the empirically estimated alternative (Table VII).Although the Stefan–Boltzmann law with an emissivity of0.85 yielded a slightly lower MBE than NARR, the NARRoutput outperformed the alternative approaches on all otherperformance measures (Table VII).
Table IV. Performance measure
3-h
Site MBE (m s�1) RMSE (m s�1) Em
Bridge 0.75 2.60 �0.52Helm 2.41 4.39 �1.87Weart 4.54 5.84 �5.51
MBE, mean bias error; RMSE, root mean square error.
Copyright © 2016 John Wiley & Sons, Ltd.
CASE STUDY: USE OF NARR PRODUCTS TOSUPPLEMENT AIR TEMPERATUREOBSERVATIONS FOR MODELLING
RAIN-ON-SNOW EVENTS IN MOUNTAINCATCHMENTS
Background
In many applications of operational hydrologicmodels, air temperatures from valley bottom stations
s for wind speed at each site
Daily
r2 RMSE (m s�1) Em r2
0.16 1.73 �0.19 0.380.34 4.33 �3.37 0.350.65 5.49 �7.18 0.84
Hydrol. Process. 30, 2332–2347 (2016)
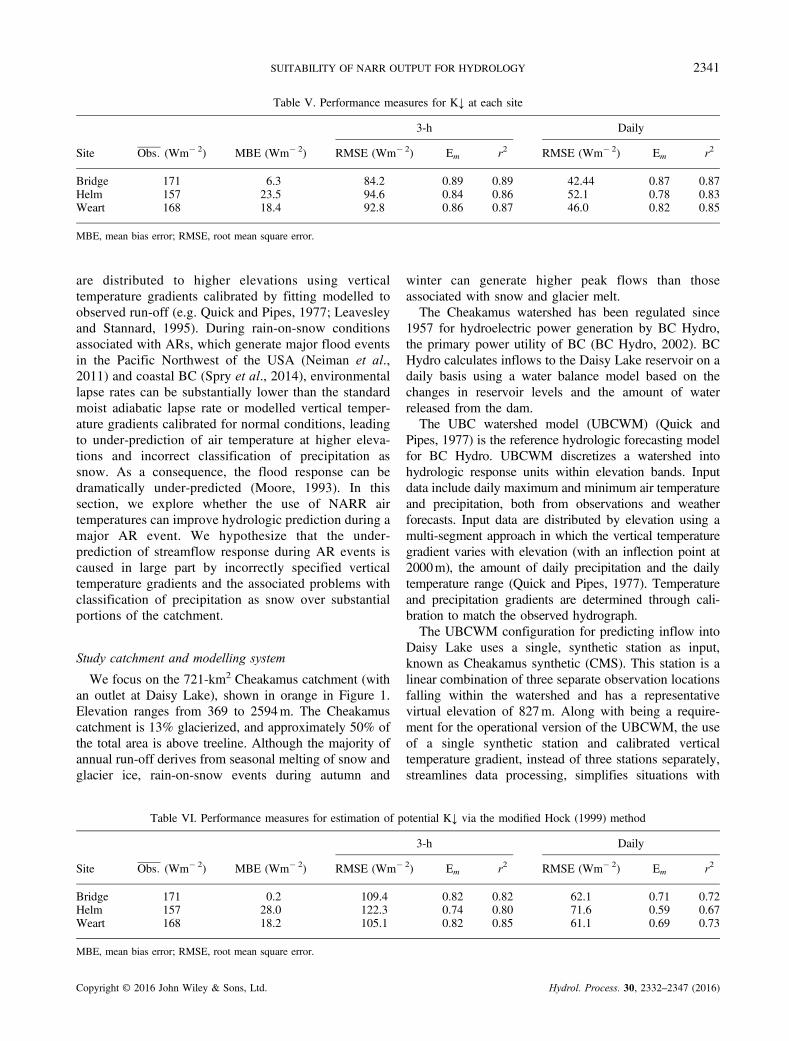
Table V. Performance measures for K↓ at each site
3-h Daily
Site Obs: (Wm� 2) MBE (Wm� 2) RMSE (Wm� 2) Em r2 RMSE (Wm� 2) Em r2
Bridge 171 6.3 84.2 0.89 0.89 42.44 0.87 0.87Helm 157 23.5 94.6 0.84 0.86 52.1 0.78 0.83Weart 168 18.4 92.8 0.86 0.87 46.0 0.82 0.85
MBE, mean bias error; RMSE, root mean square error.
2341SUITABILITY OF NARR OUTPUT FOR HYDROLOGY
are distributed to higher elevations using verticaltemperature gradients calibrated by fitting modelled toobserved run-off (e.g. Quick and Pipes, 1977; Leavesleyand Stannard, 1995). During rain-on-snow conditionsassociated with ARs, which generate major flood eventsin the Pacific Northwest of the USA (Neiman et al.,2011) and coastal BC (Spry et al., 2014), environmentallapse rates can be substantially lower than the standardmoist adiabatic lapse rate or modelled vertical temper-ature gradients calibrated for normal conditions, leadingto under-prediction of air temperature at higher eleva-tions and incorrect classification of precipitation assnow. As a consequence, the flood response can bedramatically under-predicted (Moore, 1993). In thissection, we explore whether the use of NARR airtemperatures can improve hydrologic prediction during amajor AR event. We hypothesize that the under-prediction of streamflow response during AR events iscaused in large part by incorrectly specified verticaltemperature gradients and the associated problems withclassification of precipitation as snow over substantialportions of the catchment.
Study catchment and modelling system
We focus on the 721-km2 Cheakamus catchment (withan outlet at Daisy Lake), shown in orange in Figure 1.Elevation ranges from 369 to 2594m. The Cheakamuscatchment is 13% glacierized, and approximately 50% ofthe total area is above treeline. Although the majority ofannual run-off derives from seasonal melting of snow andglacier ice, rain-on-snow events during autumn and
Table VI. Performance measures for estimation of p
Site Obs: (Wm� 2) MBE (Wm� 2) RMSE (Wm�
Bridge 171 0.2 109.4Helm 157 28.0 122.3Weart 168 18.2 105.1
MBE, mean bias error; RMSE, root mean square error.
Copyright © 2016 John Wiley & Sons, Ltd.
winter can generate higher peak flows than thoseassociated with snow and glacier melt.The Cheakamus watershed has been regulated since
1957 for hydroelectric power generation by BC Hydro,the primary power utility of BC (BC Hydro, 2002). BCHydro calculates inflows to the Daisy Lake reservoir on adaily basis using a water balance model based on thechanges in reservoir levels and the amount of waterreleased from the dam.The UBC watershed model (UBCWM) (Quick and
Pipes, 1977) is the reference hydrologic forecasting modelfor BC Hydro. UBCWM discretizes a watershed intohydrologic response units within elevation bands. Inputdata include daily maximum and minimum air temperatureand precipitation, both from observations and weatherforecasts. Input data are distributed by elevation using amulti-segment approach in which the vertical temperaturegradient varies with elevation (with an inflection point at2000m), the amount of daily precipitation and the dailytemperature range (Quick and Pipes, 1977). Temperatureand precipitation gradients are determined through cali-bration to match the observed hydrograph.The UBCWM configuration for predicting inflow into
Daisy Lake uses a single, synthetic station as input,known as Cheakamus synthetic (CMS). This station is alinear combination of three separate observation locationsfalling within the watershed and has a representativevirtual elevation of 827m. Along with being a require-ment for the operational version of the UBCWM, the useof a single synthetic station and calibrated verticaltemperature gradient, instead of three stations separately,streamlines data processing, simplifies situations with
otential K↓ via the modified Hock (1999) method
3-h Daily
2) Em r2 RMSE (Wm� 2) Em r2
0.82 0.82 62.1 0.71 0.720.74 0.80 71.6 0.59 0.670.82 0.85 61.1 0.69 0.73
Hydrol. Process. 30, 2332–2347 (2016)
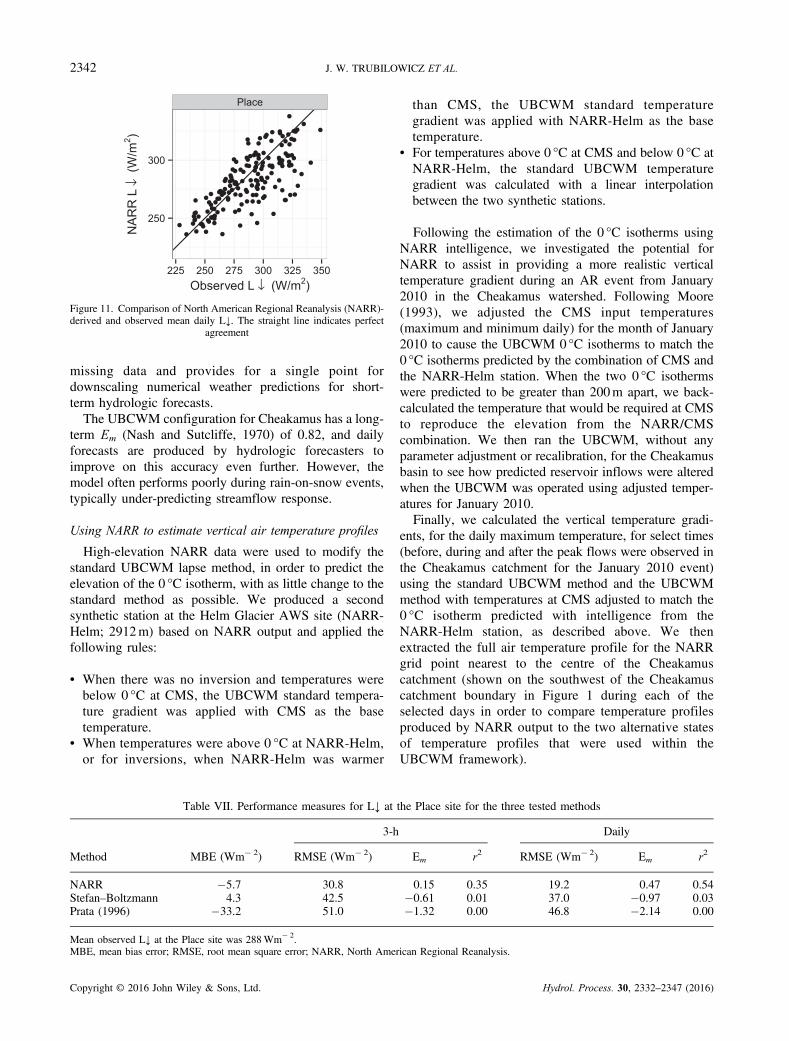
Figure 11. Comparison of North American Regional Reanalysis (NARR)-derived and observed mean daily L↓. The straight line indicates perfect
agreement
2342 J. W. TRUBILOWICZ ET AL.
missing data and provides for a single point fordownscaling numerical weather predictions for short-term hydrologic forecasts.The UBCWM configuration for Cheakamus has a long-
term Em (Nash and Sutcliffe, 1970) of 0.82, and dailyforecasts are produced by hydrologic forecasters toimprove on this accuracy even further. However, themodel often performs poorly during rain-on-snow events,typically under-predicting streamflow response.
Using NARR to estimate vertical air temperature profiles
High-elevation NARR data were used to modify thestandard UBCWM lapse method, in order to predict theelevation of the 0 °C isotherm, with as little change to thestandard method as possible. We produced a secondsynthetic station at the Helm Glacier AWS site (NARR-Helm; 2912m) based on NARR output and applied thefollowing rules:
• When there was no inversion and temperatures werebelow 0 °C at CMS, the UBCWM standard tempera-ture gradient was applied with CMS as the basetemperature.
• When temperatures were above 0 °C at NARR-Helm,or for inversions, when NARR-Helm was warmer
Table VII. Performance measures for L↓ at
3-h
Method MBE (Wm� 2) RMSE (Wm� 2)
NARR �5.7 30.8Stefan–Boltzmann 4.3 42.5Prata (1996) �33.2 51.0
Mean observed L↓ at the Place site was 288Wm� 2.MBE, mean bias error; RMSE, root mean square error; NARR, North Amer
Copyright © 2016 John Wiley & Sons, Ltd.
than CMS, the UBCWM standard temperaturegradient was applied with NARR-Helm as the basetemperature.
• For temperatures above 0 °C at CMS and below 0 °C atNARR-Helm, the standard UBCWM temperaturegradient was calculated with a linear interpolationbetween the two synthetic stations.
Following the estimation of the 0 °C isotherms usingNARR intelligence, we investigated the potential forNARR to assist in providing a more realistic verticaltemperature gradient during an AR event from January2010 in the Cheakamus watershed. Following Moore(1993), we adjusted the CMS input temperatures(maximum and minimum daily) for the month of January2010 to cause the UBCWM 0°C isotherms to match the0 °C isotherms predicted by the combination of CMS andthe NARR-Helm station. When the two 0 °C isothermswere predicted to be greater than 200m apart, we back-calculated the temperature that would be required at CMSto reproduce the elevation from the NARR/CMScombination. We then ran the UBCWM, without anyparameter adjustment or recalibration, for the Cheakamusbasin to see how predicted reservoir inflows were alteredwhen the UBCWM was operated using adjusted temper-atures for January 2010.Finally, we calculated the vertical temperature gradi-
ents, for the daily maximum temperature, for select times(before, during and after the peak flows were observed inthe Cheakamus catchment for the January 2010 event)using the standard UBCWM method and the UBCWMmethod with temperatures at CMS adjusted to match the0 °C isotherm predicted with intelligence from theNARR-Helm station, as described above. We thenextracted the full air temperature profile for the NARRgrid point nearest to the centre of the Cheakamuscatchment (shown on the southwest of the Cheakamuscatchment boundary in Figure 1 during each of theselected days in order to compare temperature profilesproduced by NARR output to the two alternative statesof temperature profiles that were used within theUBCWM framework).
the Place site for the three tested methods
Daily
Em r2 RMSE (Wm� 2) Em r2
0.15 0.35 19.2 0.47 0.54�0.61 0.01 37.0 �0.97 0.03�1.32 0.00 46.8 �2.14 0.00
ican Regional Reanalysis.
Hydrol. Process. 30, 2332–2347 (2016)

Figure 12. Summary of hydroclimatic conditions and inflow for BCHydro’s Cheakamus River catchment during an atmospheric river eventduring January 2010. From top to bottom: precipitation, reservoir inflow,range of daily maximum and minimum air temperature from both theCheakamus synthetic (CMS) and North American Regional Reanalysis(NARR)-Helm sites, and elevation of the 0 °C isotherm. UBCWM, UBC
watershed model
Figure 13. Vertical temperature profiles as predicted by the UBCwatershed model (UBCWM) for the standard Cheakamus synthetictemperatures and temperatures at Cheakamus synthetic adjusted to matchthe elevation of the 0 °C isotherm and temperature profile from NorthAmerican Regional Reanalysis (NARR) output at the grid point nearest
the centre of the Cheakamus catchment
2343SUITABILITY OF NARR OUTPUT FOR HYDROLOGY
Results
During the AR event that occurred in the south coast ofBC during early January 2010, approximately 235mm ofprecipitation fell over the snow-covered Cheakamus basinwith unseasonably high temperatures, producing run-offfrom both rainfall and snowmelt.The AR event from 7–15 January 2010 would have
been significantly under-forecasted if the watershedmodel had been run without intervention from BCHydro’s forecasting team (UBCWM unadjusted, panel 2,Figure 12). The standard UBCWM temperature gradientmethod produced a freezing level between 800 and1500m during this event. As a result, the modelpredicted snow to be falling at the higher elevations of
Copyright © 2016 John Wiley & Sons, Ltd.
the watershed, when, in reality, only heavy rains andrain-on-snow melt could cause the peak inflow rate ofgreater than 200m3 s� 1, based on past experience.Prior to the AR event, nearly 40mm of precipitation
was recorded on 1 January with little run-off response(Figure 12). At that time, the standard UBCWM andNARR-Helm freezing levels were in general agreement.When the AR event began a few days later, the calculatedfreezing levels began to diverge, and run-off wassignificantly under-predicted by the standard model.The elevation of the 0 °C isotherm predicted by
interpolation between the NARR-Helm and BC Hydro’sstandard CMS synthetic station data reached a maximumelevation of 2500m, but the UBCWM standard temper-ature gradient produced a maximum freezing level of1500m (Figure 12). The standard UBCWM methodwould never have more than 50% of the watershed abovefreezing, whereas incorporation of intelligence fromNARR showed that there may have been more than
Hydrol. Process. 30, 2332–2347 (2016)
2344 J. W. TRUBILOWICZ ET AL.
75% of the catchment receiving rainfall during the periodof heaviest precipitation.Early in the AR event (7 January), NARR output
indicates the presence of an elevated inversion above1600m, which is not well represented by the temperatureprofile assumed by UBCWM. Adjusting the UBCWMtemperature profile to match the NARR-predictedfreezing level resulted in temperatures in the lowerelevations of the catchment that were substantiallyhigher than both the UBCWM and NARR temperatures(Figure 13, upper panel), causing UBCWM to predictapparently excessive snow melt over a large fraction ofthe catchment and thus to over-predict reservoir inflowsin the earlier part of the event. For 11 January, thewettest day of the AR, the NARR-adjusted temperatureprofile provides a closer match to the temperature profilefrom the raw NARR elevation output (Figure 13, middlepanel), producing an improved simulation of peakstreamflow (Figure 12, panel 2). Later in the event,NARR output indicated a nonlinear temperature profilewith an overall warmer air column compared with theUBCWM profile (Figure 13, lower panel).
DISCUSSION
Potential for use of NARR output for hydrology
The NARR products are attractive for hydrologicanalysis and modelling because they include all thevariables required to drive physically based models ofsnow and ice melt, evapotranspiration and geocryology.Because of the reasonable precision and low bias, airtemperature output from NARR appears to have goodpotential utility for hydrologic applications at highelevations in mountainous regions. High-elevation airtemperature intelligence can provide information aboutprecipitation phase, snow melt and evapotranspiration inlocations where no surface observations are available.The use of NARR for air temperature can likely providemore useful information than extrapolation methodsthat assume static vertical temperature profiles, especiallyin situations with isothermal or inverted temperatureprofiles. The RMSE at the daily scale for NARR airtemperatures (ranging from 0.98 to 1.21 °C) comparefavourably with the results from Fiddes and Gruber(2014) who found a daily RMSE of 1.95 °C fordownscaled climate model output in the Swiss Alps.Vapour pressure from NARR also appears reasonably
accurate and could have potential for use in hydrologicapplications in mountainous regions. Vapour pressurewas relatively unbiased at Place and Weart glaciers butexhibited a positive bias at the Bridge Glacier site and anegative bias at the Helm Glacier site. This indicates thatNARR vapour pressure may exhibit a spatially variable
Copyright © 2016 John Wiley & Sons, Ltd.
bias within a catchment. Despite this, knowledge ofvapour pressure where no observations are availablecould be potentially useful for quantifying the directionand magnitude of latent heat exchange between thesurface and the atmosphere, which can be an importantsource of energy for snow melt during major rain-on-snow events (Marks et al., 1998).Downscaled wind speed from NARR has a positive
bias, consistent with the fact that observed wind speedsare influenced by surface friction and results from otherstudies (e.g. Stegall and Zhang, 2012; Abatzoglou, 2013).Fiddes and Gruber (2014) found similar RMSE(2.69ms�1) but lower bias after applying the topographiccorrections from Liston and Sturm (1998) to ERA-Interimreanalysis output. The linear relations between down-scaled and observed wind speeds, especially for WeartGlacier (Table IV), indicate that a bias correction couldpotentially be applied to more accurately downscale theNARR output to surface observations. Another possibilityis that a wind record from a temporary gauge could beextended by NARR through calibration.The Bridge Glacier site is located on a minor ridge
below the main ridge crest. Consequently, wind speedsand directions are modified by anabatic and katabaticflow, surface friction and steering of winds along thevalley axis. This likely explains the low r2 results at the3-h time step. Wind speed estimates from NARR arelikely only useful as an estimator at the highestelevations in this region.A mono-level 10-m surface wind output is also
available from the NARR model. We tested this outputas an alternative to the pressure-level winds. While therewas less positive bias, likely because of corrections forsurface friction, the r2 values were similar to the resultsfor the NARR pressure-level winds for the Bridge siteand worse for the Place and Weart sites. Hence, we arguethat, because both products would require bias correc-tion, the downscaled pressure-level winds should bepreferred because they yielded higher r2 with observedwind speeds.On most sunny days, incoming short-wave radiation
from NARR appears to be reasonably accurate (Figure 2);however, cloud cover often does not appear to becaptured well by NARR (e.g., 3, 4 and 7 July in Figure 2).The positive MBE in summer (Table V) may be due tosmall-scale convective cloud formation that is commonon warm days in the southern Coast Mountains, whichmay not be captured by the NARR model because of itsspatial and temporal resolution. NARR downscaled K↓outperforms an estimate of potential incoming solarradiation, but not by a wide margin. Considering thelimited accuracy of short-wave radiation from NARR,and particularly its bias, we recommend that cautionshould be exercised when using NARR short-wave
Hydrol. Process. 30, 2332–2347 (2016)
2345SUITABILITY OF NARR OUTPUT FOR HYDROLOGY
radiation as input to hydrologic analyses and models. Thepositive bias of incoming solar radiation is consistent withother studies that found positive biases in NARRincoming short-wave radiation (e.g. Schroeder et al.,2009; Kumar and Merwade, 2011).Accuracy may be further degraded by the fact that
incoming short-wave radiation is only available as mono-level output from NARR and hence may not berepresentative of the atmospheric transmissivity at ahigh-elevation site. The NARR mono-level surfaceelevations are more than 500m lower in elevation thanthe true site elevation at the Helm and Weart Glacier sites.At the Bridge Glacier site, the NARR mono-levelelevation is within 10m of the AWS elevation (Table I),and the Bridge Glacier site does display a lower MBEthan either Helm or Weart (Table V).Although fewer data were available to evaluate long-
wave radiation, it does appear that NARR downscaled L↓outperforms common techniques for estimating incominglong-wave radiation, including the use of the Stefan–Boltzman law using both a constant emissivity of 0.85and the Prata (1996) equation. Further evaluation isnecessary, especially during winter periods, to make amore definitive conclusion about the utility of NARRdownscaled L↓ for hydrology. NARR downscaled L↓also performed favourably compared with the results fromFiddes and Gruber (2014), who found an RMSE of29.4Wm� 2 using the Stefan–Boltzman law modifiedwith a cloud cover component.
Utility of NARR for hydrologic modelling
For the January 2010 AR event, using NARR output todefine vertical air temperature gradients resulted in ahigher snowline elevation and a substantially largeramount of the watershed experiencing rainfall than withthe standard temperature gradient. This increase in rainfallcaused an increase in predicted reservoir inflows duringthis event. The incorporation of input temperatures thatwere adjusted to match the NARR interpolated 0 °Cisotherm predicted peak reservoir inflows that bettermatched observed inflows, but the inability of the statictemperature gradient parameters of the UBCWM tocapture inversion or isothermal conditions (even whenthe CMS temperatures were adjusted) is still a limitationand will remain so unless dynamic temperature gradientscan be implemented within the operational modellingframework. The adjustment of temperatures to matchelevated freezing levels during inversion or isothermalconditions resulted in temperatures at lower elevationsthat were higher than in reality and likely resulted inunrealistic snow melt (panel 1, Figure 13)Given that operational hydrologic models are highly
tuned to produce the most accurate forecasts possible with
Copyright © 2016 John Wiley & Sons, Ltd.
minimal input data and we adjusted the inputs to theUBCWM without any recalibration, the results of thisadjustment do appear promising. The over-prediction ofreservoir inflows during the falling limb of the peak event(approximately 15 January in Figure 12) appears similarin shape to the original modelled falling limb buttransposed upwards. Hence, the results may be improvedwith calibration during AR events. The rapid onset ofmelt-generated runoff when temperatures rise abovefreezing is another issue known to forecasters using theUBCWM and is primarily due to the lack of cold contenttracking within UBCWM.Although NARR’s temporal latency limits its direct use
for near-real-time forecasting, NARR output could bevaluable for assisting in model calibration, particularly forthe parameters that control run-off generation during rain-on-snow events. Alternatively, switching to an ‘AR’ mode,in which temperature profiles are temporarily adjusted orperhaps set to isothermal, as suggested by Rössler et al.(2014), may assist operational forecasters in producingbetter run-off forecasts when these meteorologic conditionsare expected. In the case of UBCWM, some recodingwould be required to incorporate this functionality.Given the errors in prediction shown in this study, the
use of NARR output directly to drive energy balancesnow models (through the use of wind speed, vapourpressure and radiation) may not generate accuratepredictions, especially during rain-on-snow events. Con-sidering the errors associated with most of the NARRvariables, particularly short-wave and long-wave radia-tion, it is unclear whether their use as input to an energybalance snowmelt model would provide superior perfor-mance compared with a temperature index-based model.It would be a useful exercise to compare the relativeperformance of different complexities of snow modelsdriven by NARR output.
CONCLUSIONS
The comparison of NARR output with observations fromfour high-elevation sites in the southern Coast Mountains ofBC demonstrates that air temperature and vapour pressureare predicted with a high level of skill. The air temperaturefields, in particular, appear to be of sufficient accuracy toassist in predicting storm freezing levels and are likely to beof value in driving temperature index snowmelt models.Wind speeds at the ridge crest sites were consistently lowerthan predicted by NARR, as expected, but the reasonablecorrelation at some sites suggests that the NARR valueshave potential value as indices, subject to bias correction.Short-wave radiation was predicted more poorly by NARRand may not provide enough of an improvement overstandard models of potential incoming short-wave radiation
Hydrol. Process. 30, 2332–2347 (2016)

2346 J. W. TRUBILOWICZ ET AL.
to be of use in hydrologic applications. Long-wave radiationrequires further testing during winter months, although itdoes provide increased accuracy over commonly usedestimation methods.Because of a lack of observations, we were not able to
test the accuracy of NARR for estimating surfaceprecipitation. Future work should assess the accuracy ofNARR precipitation compared with surface observationsin mountainous areas. However, testing NARR precipi-tation output would be more challenging than forvariables such as air temperature because (1) precipitationcan exhibit greater sub-grid horizontal variability, posinggreater uncertainty in downscaling from gridded values topoints, and (2) measured precipitation at high-elevationsites can be subject to considerable undercatch because ofhigh wind speed, especially for snow.Future work should focus on optimal methods for
assimilating NARR air temperature into a forecast system.As operational hydrologic models are highly tuned towatersheds, the most effective method for assimilation ofNARRoutputwill likely require extensive testing in order toimprove run-off forecasts during nonstandard situationswhile maintaining stability during standard forecastingsituations. Although NARR’s temporal availability wouldnot allow it to be used in place of high-altitude observationsduring real-time forecasting, assimilation and use of NARRair temperature for hindcasting of historic rain-on-snowevents could provide guidance for model formulation andcalibration and be used to help determine the most usefullocations for new AWS installation.
ACKNOWLEDGEMENTS
This research was supported through funding from theNatural Sciences and Engineering Research Council(NSERC) through a discovery grant to R.D. Moore, aPGS-A scholarship to J.M. Shea and an IndustrialPostgraduate Scholarship to J.W. Trubilowicz, BCHydro, the Mitacs Accelerate internship programme andthe Canadian Foundation for Climate and AtmosphericScience through its support of the Western CanadianCryospheric Network. Natalie Stafl, Roger Hodson andEllen Morgan assisted in field data collection. We wouldlike to thank two anonymous reviewers for theirconstructive feedback.
REFERENCES
Abatzoglou JT. 2013. Development of gridded surface meteorologicaldata for ecological applications and modelling. International Journal ofClimatology 33(1): 121–131. DOI:10.1002/joc.3413
Barry RG. 2008.Mountain Weather and Climate. Cambridge University Press:Cambridge, UK.
Bastola S, Misra V. 2014. Evaluation of dynamically downscaledreanalysis precipitation data for hydrological application. HydrologicalProcesses 28(4): 1989–2002. DOI:10.1002/hyp.9734
Copyright © 2016 John Wiley & Sons, Ltd.
BC Hydro. 2002. Bridge-coastal fish and wildlife restoration program,strategic plan, volume 2. Technical report, BC Hydro. Burnaby, BC.
Bolstad PV, Swift L, Collins F, Régnière J. 1998. Measured and predictedair temperatures at basin to regional scales in the southern Appalachianmountains. Agricultural and Forest Meteorology 91(3): 161–176.
Bristow KL, Campbell GS. 1984. On the relationship between incomingsolar radiation and daily maximum and minimum temperature.Agricultural and Forest Meteorology 31(2): 159–166. DOI:10.1016/0168-1923(84)90017-0
Buck A. 1981. New equations for computing vapor pressure andenhancement factor. Journal of Applied Meteorology 20: 1527–1532.
Choi W, Kim SJ, Rasmussen PF, Moore AR. 2009. Use of the NorthAmerican Regional Reanalysis for hydrological modelling in Manitoba.Canadian Water Resources Journal 34(1): 17–36. DOI:10.4296/cwrj3401017
Dee DP, Uppala SM, Simmons a J, Berrisford P, Poli P, Kobayashi S,Andrae U, Balmaseda M a, Balsamo G, Bauer P, Bechtold P,Beljaars a C M, van de Berg L, Bidlot J, Bormann N, Delsol C,Dragani R, Fuentes M, Geer a J, Haimberger L, Healy SB, HersbachH, Hólm EV, Isaksen L, Kållberg P, Köhler M, Matricardi M,Mcnally a P, Monge-Sanz BM, Morcrette JJ, Park BK, Peubey C,de Rosnay P, Tavolato C, Thépaut JN, Vitart F. 2011. The ERA-interim reanalysis: configuration and performance of the dataassimilation system. Quarterly Journal of the Royal MeteorologicalSociety 137(656): 553–597. DOI:10.1002/qj.828
Fiddes J, Gruber S. 2014. TopoSCALE v.1.0: downscaling griddedclimate data in complex terrain. Geoscientific Model Development 7(1):387–405. DOI:10.5194/gmd-7-387-2014
Garen DC, Marks D. 2005. Spatially distributed energy balance snowmeltmodelling in a mountainous river basin: estimation of meteorologicalinputs and verification of model results. Journal of Hydrology 315(1-4):126–153. DOI:10.1016/j.jhydrol.2005.03.026
Hasenauer H, Merganicova K, Petritsch R, Pietsch SA, Thornton PE.2003. Validating daily climate interpolations over complex terrain inAustria. Agricultural and Forest Meteorology 119(1-2): 87–107.DOI:10.1016/S0168-1923(03)00114-X
Hock R. 1999. A distributed temperature-index ice- and snowmelt modelincluding potential direct solar radiation. Journal of Glaciology 45(149): 101–111.
Holden ZA, Swanson A, Klene AE, Abatzoglou JT, Dobrowski SZ,Cushman SA, Squires J, Moisen GG, Oyler JW. 2015. Development ofhigh-resolution (250m) historical daily gridded air temperature data usingreanalysis and distributed sensor networks for the US Northern RockyMountains. International Journal of Climatology DOI:10.1002/joc.4580
Hrachowitz M, Savenije HHG, Blöschl G, McDonnell JJ, Sivapalan M,Pomeroy JW, Arheimer B, Blume T, Clark MP, Ehret U, Fenicia F,Freer JE, Gelfan A, Gupta HV, Hughes DA, Hut RW, Montanari A,Pande S, Tetzlaff D, Troch PA, Uhlenbrook S, Wagener T, Winsemius HC,Woods RA, Zehe E, Cudennec C. 2013. A decade of predictions in ungaugedbasins (PUB) : a review. Hydrological Sciences Journal 58(6):1198–1255. DOI:10.1080/02626667.2013.803183
Iqbal M. 1983. An Introduction to Solar Radiation. Elsevier: Don Mills,Ontario.
Jarosch AH, Anslow FS, Clarke GKC. 2012. High-resolution precipitationand temperature downscaling for glacier models. Climate Dynamics 38(1-2): 391–409. DOI:10.1007/s00382-010-0949-1
Jarvis CH, Stuart N. 2001. A comparison among strategies forinterpolating maximum and minimum daily air temperatures. Part I:the selection of “guiding” topographic and land cover variables. Journalof Applied Meteorology 40: 1060–1074.
Jost G, Moore RD, Smith R, Gluns DR. 2012. Distributed temperature-index snowmelt modelling for forested catchments. Journal ofHydrology 420-421: 87–101. DOI:10.1016/j.jhydrol.2011.11.045
Keshta N, Elshorbagy A. 2011. Utilizing North American RegionalReanalysis for modeling soil moisture and evapotranspiration inreconstructed watersheds. Physics and Chemistry of the Earth, PartsA/B/C 36(1): 31–41.
Kimball J, Running S, Nemani R. 1997. An improved method forestimating surface humidity from daily minimum temperature.Agricultural and Forest Meteorology 85(1-2): 87–98. DOI:10.1016/S0168-1923(96)02366-0
Hydrol. Process. 30, 2332–2347 (2016)

2347SUITABILITY OF NARR OUTPUT FOR HYDROLOGY
Klinka K, Pojar J, Meidinger DV. 1991. Revision of biogeoclimatic unitsof coastal British Columbia. Northwest Science 65(1): 32–47.
Kumar S, Merwade V. 2011. Evaluation of NARR and CLM3.5 outputs forsurface water and energy budgets in theMississippi River Basin. Journal ofGeophysical Research 116(D8): D08115. DOI:10.1029/2010JD014909
Leavesley GH, Stannard LG. 1995. The precipitation-runoff modelingsystem-PRMS. In Computer Models of Watershed Hydrology, Singh VP(ed). Water Resources Publications Fort Collins, CO: Fort Collins, CO.;281–310.
Liston GE, Elder K. 2006. A meteorological distribution system forhigh-resolution terrestrial modeling (MicroMet). Journal of Hydrome-teorology 7(2): 217–234. DOI:10.1175/JHM486.1
Liston GE, Sturm M. 1998. A snow-transport model for complex terrain.Journal of Glaciology 44(148): 498–516.
Luo Y, Berbery EH, Mitchell KE, Betts AK. 2007. Relationships betweenland surface and near-surface atmospheric variables in the NCEP NorthAmerican Regional Reanalysis. Journal of Hydrometeorology 8(6):1184–1203. DOI:10.1175/2007JHM844.1
Marks D, Kimball J, Tingey D, Link T. 1998. The sensitivity of snowmeltprocesses to climate conditions and forest cover during rain on snow: acase study of the 1996 Pacific Northwest flood. Hydrological Processes12: 1569–1587.
Mesinger F, DiMego G, Kalnay E, Mitchell K, Shafran PC, Ebisuzaki W,Jovic D, Woollen J, Rogers E, Berbery EH, Ek MB. 2006.North American Regional Reanalysis. Bulletin of the AmericanMeteorological Society 87(3): 343–360.
Moore RD. 1993. Application of a conceptual streamflow model in aglacierized drainage basin. Journal of Hydrology 150(1): 151–168.DOI:10.1016/0022-1694(93)90159-7
Moore RD, Woods RW, Boyle DP. 2013. Putting PUB into practice inmountainous regions. Streamline Watershed Management Bulletin 15(2): 12–21.
Mott R, Lehning M. 2010. Meteorological modeling of very high-resolution wind fields and snow deposition for mountains. Journal ofHydrometeorology 11(4): 934–949. DOI:10.1175/2010JHM1216.1
Nash JE, Sutcliffe JV. 1970. River flow forecasting through conceptualmodels part 1 - a discussion of principals. Journal of Hydrology 10(3):282–290.
Neiman PJ, Schick LJ, Ralph FM, Hughes M, Wick G a. 2011. Floodingin western Washington: the connection to atmospheric rivers. Journal ofHydrometeorology 12(6): 1337–1358. DOI:10.1175/2011JHM1358.1
Pierce D. 2014. Ncdf: interface to unidata netCDF data files. Available: https://cran.r-project.org/web/packages/ncdf/index.html Accessed: (2015-04-01).
Prata AJ. 1996. A new long-wave formula for estimating downward clear-sky radiation at the surface. Quarterly Journal of the RoyalMeteorological Society 122(533): 1127–1151.
Quick MC, Pipes A. 1977. U.B.C. watershed model. HydrologicalSciences Journal 22(1): 153–162.
R Development Core Team. 2015. R: a language and environment forstatistical computing. Available: http://www.r-project.org.
Rössler O, Froidevaux P, Börst U, Rickli R, Martius O, Weingartner R.2014. Retrospective analysis of a nonforecasted rain-on-snow flood inthe Alps – a matter of model limitations or unpredictable nature?Hydrology and Earth System Sciences 18(6): 2265–2285. DOI:10.5194/hess-18-2265-2014
Ruane AC. 2010. NARR’s atmospheric water cycle components. Part I:20-year mean and annual interactions. Journal of Hydrometeorology 11(6): 1205–1219. DOI:10.1175/2010JHM1193.1
Copyright © 2016 John Wiley & Sons, Ltd.
Running SW, Nemani RR, Hungerford RD. 1987. Extrapolation ofsynoptic meteorological data in mountainous terrain and its usefor simulating forest evapotranspiration and photosynthesis.Canadian Journal of Forest Research 17(6): 472–483.DOI:10.1139/x87-081
Schroeder TA, Hember R, Coops NC, Liang S. 2009. Validation of solarradiation surfaces from MODIS and reanalysis data over topographi-cally complex terrain. Journal of Applied Meteorology and Climatology48(12): 2441–2458. DOI:10.1175/2009JAMC2152.1
Shea JM, Moore RD. 2010. Prediction of spatially distributed regional-scale fields of air temperature and vapor pressure over mountainglaciers. Journal of Geophysical Research 115(D23): 15.
Sheffield J, Livneh B, Wood EF. 2012. Representation of terrestrialhydrology and large-scale drought of the continental United States fromthe North American Regional Reanalysis. Journal of Hydrometeorology13(3): 856–876. DOI:10.1175/JHM-D-11-065.1
Sivapalan M, Takeuchi K, Franks SW, Gupta VK, Karambiri H,Lakshmi V, Liang X, McDonnell JJ, Mendiondo EM, O’ConnellPE, Oki T, Pomeroy JW, Schertzer D, Uhlenbrook S, Zehe E.2003. IAHS decade on predictions in ungauged basins (PUB),2003-2012: shaping an exciting future for the hydrological sciences.Hydrologic Sciences Journal 48(6): 857–880. DOI:10.1623/hysj.48.6.857.51421
Spry CM, Kohfeld KE, Allen DM, Dunkley D, Lertzman K. 2014.Characterizing pineapple express storms in the lower mainland ofBritish Columbia, Canada. Canadian Water Resources Journal / Revuecanadienne des ressources hydriques 39(3): 302–323. DOI:10.1080/07011784.2014.942574
Stahl K, Moore RD, Floyer JA, Asplin MG, McKendry IG. 2006.Comparison of approaches for spatial interpolation of daily airtemperature in a large region with complex topography and highlyvariable station density. Agricultural and Forest Meteorology 139(3-4):224–236. DOI:10.1016/j.agrformet.2006.07.004
Stegall ST, Zhang J. 2012. Wind field climatology, changes, andextremes in the Chukchi–Beaufort Seas and Alaska North Slopeduring 1979–2009. Journal of Climate 25(23): 8075–8089.DOI:10.1175/JCLI-D-11-00532.1
Thornton PE, Running SW, White MA. 1997. Generating surfaces ofdaily meteorological variables over large regions of complexterrain. Journal of Hydrology 190(3-4): 214–251. DOI:10.1016/S0022-1694(96)03128-9
Way RG, Bonnaventure PP. 2015. Testing a reanalysis-based infillingmethod for areas with sparse discontinuous air temperature data innortheastern Canada. Atmospheric Science Letters 16(3): 398–407.DOI:10.1002/asl2.574
Wilby RL, Hay LE, Gutowski WJ, Arritt RW, Takle ES, Pan Z, LeavesleyGH, Clark MP. 2000. Hydrological responses to dynamically andstatistically downscaled climate model output. Geophysical ResearchLetters 27(8): 1199–1202. DOI:10.1029/1999GL006078
Winstral A, Marks D. 2002. Simulating wind fields and snowredistribution using terrain-based parameters to model snow accumu-lation and melt over a semi-arid mountain catchment. HydrologicalProcesses 16(18): 3585–3603. DOI:10.1002/hyp.1238
Woo MK, Thorne R. 2006. Snowmelt contribution to discharge from alarge mountainous catchment in subarctic Canada. HydrologicalProcesses 20(10): 2129–2139.
Zhu Y, Newell RE. 1998. A proposed algorithm for moisture fluxes fromatmospheric rivers. Monthly Weather Review 126(3): 725–735.
Hydrol. Process. 30, 2332–2347 (2016)