sugar trade statistics - european commission2018/2019 - sugar production final sugar production -...
TRANSCRIPT

SugarTradestatistics
AGRI G 4
Committee for the
Common Organisation of Agricultural Markets
27 February 2020

EU Sugar Preferential Imports

1. Imports EPA / EBA in 2018/2019

1. Imports EPA / EBA in 2018/2019

1. Imports EPA / EBA in 2018/2019

1. Imports EPA / EBA in 2019/2020

1. Imports EPA / EBA in 2019/2020

DG AGRI TRQsWTO – Balkan

2. Sugar TRQs 2018-2019 (20/10/2019)

2. Sugar TRQs 2019-2020 (23/2/2020)

2. Sugar TRQs 2019 (19/2/2020)

2. Sugar TRQs 2020 (19/2/2020)

EU Sugar Imports

3. EU Total imports
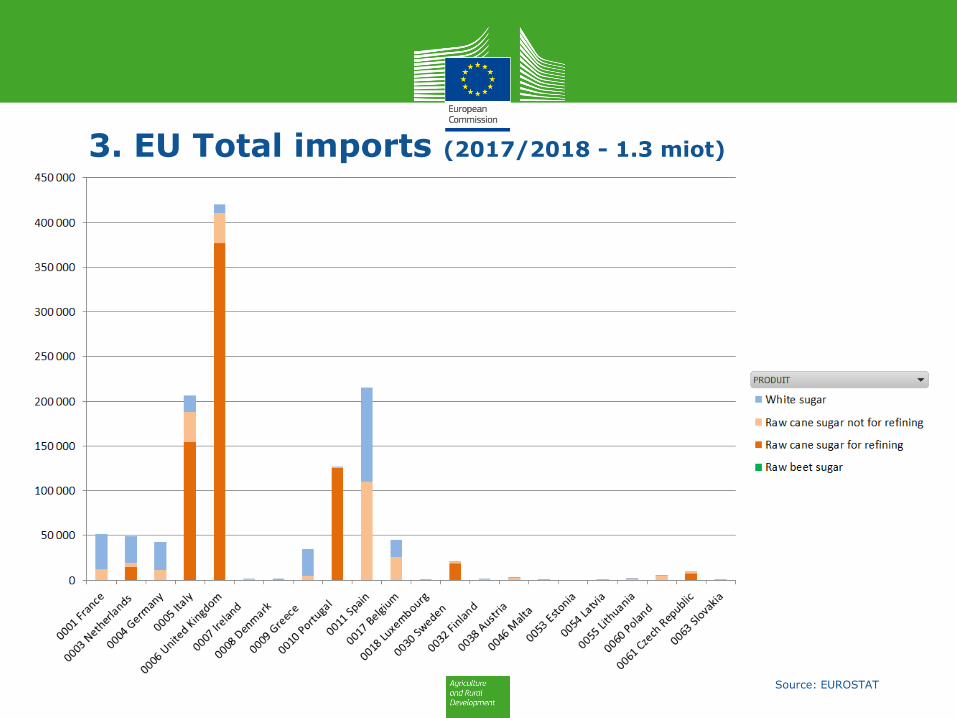
3. EU Total imports (2017/2018 - 1.3 miot)
Source: EUROSTAT

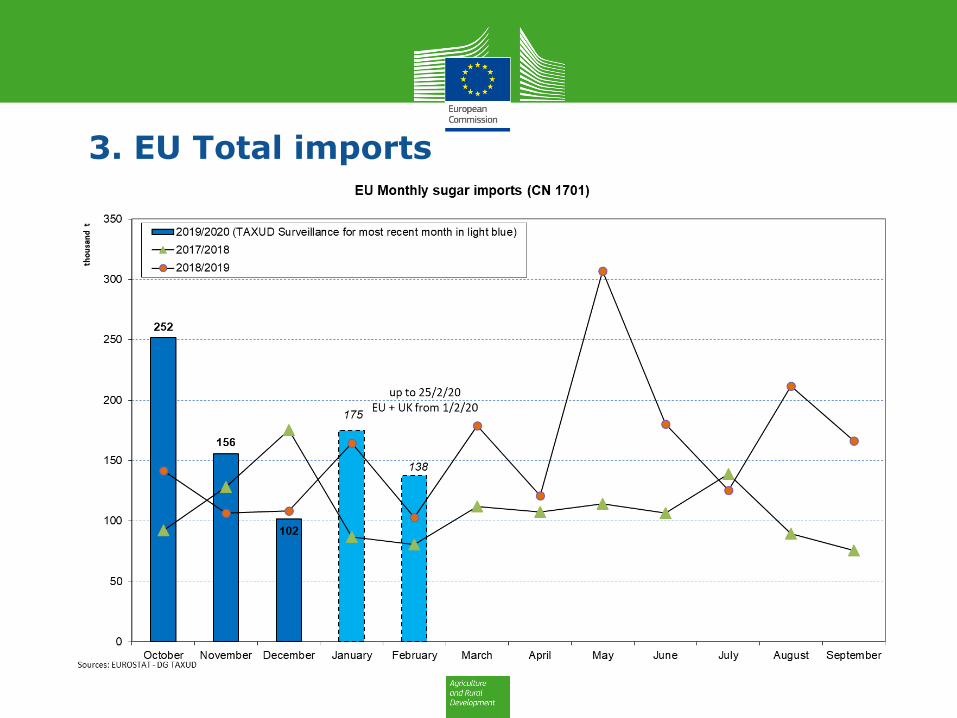
3. EU Total imports

3. EU Total imports

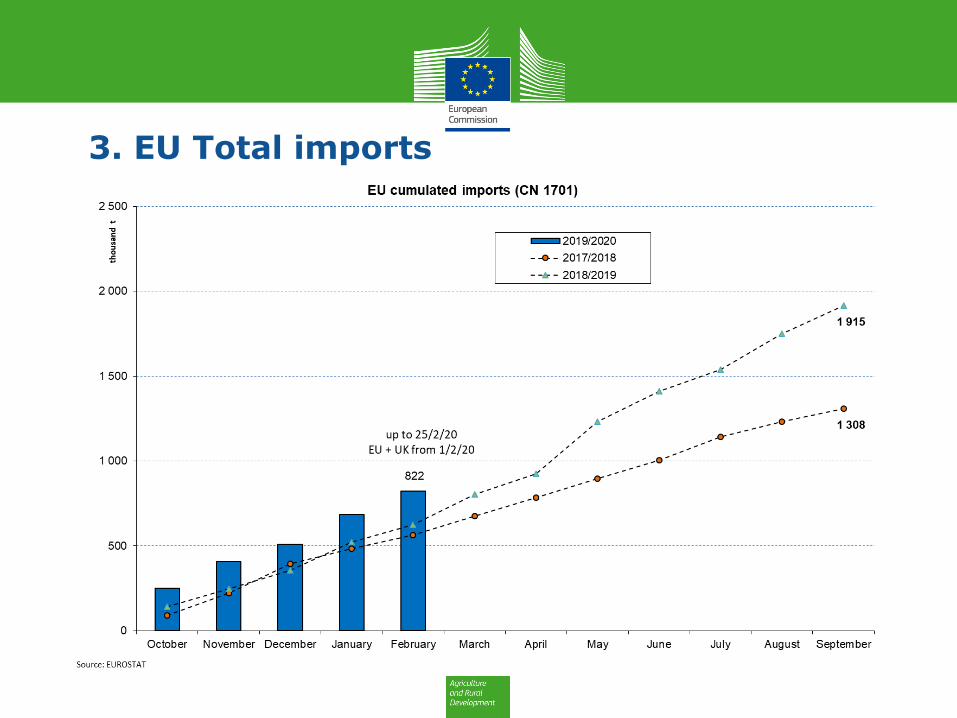
3. EU Total imports (2018/2019 – 1.915 m t)
Source: EUROSTAT
3. EU Total imports
3. EU Total imports

3. EU Total imports (2019/2020 – 3 m. - 0.509 m t)
Source: EUROSTAT

EU Sugar Exports

4. EU Total exports

4. EU Total exports (Destinations Top 25 - 2017/18 MY (12 m. 2.81 mio t)

4. EU Total exports (2017/2018 - 3.35 miot)
Source: EUROSTAT

4. EU Total exports

4. EU Total exports

4. EU Total exports (Destinations Top 10 - 2018/19 MY (12 m. 1.05 m t)

4. EU Total exports (2018/2019 – 1.610 m t)
Source: EUROSTAT

4. EU Total exports

4. EU Total exports

4. EU Total exports (2019/2020 – 3 m. - 0.304 m t)
Source: EUROSTAT

4. EU Total exports

EU Sugar Trade

Thank you
for your attention

EU Isoglucose

Isoglucose production in 2018/19

Isoglucose production in 2019/20

EU Sugar Stocks

5. Sugar stocks


5. Sugar stocks

EU Sugar Beet Area

2018/2019 2019/2020
AreasSeptember 2019
Communication to the
Commission - 2019/2020
Areas: 1533 Ha (provisional)
R 2017/1185 Art 12(b) - Annex III 2. A.
Agri G 4
areas areas
(thousand ha) (thousand ha) Difference
2019/20 2018/19
BE 58.8 63.7 -7.6%
BG
CZ 56.2 60.2 -6.6%
DK 29.3 34.2
DE 375.4 391.7 -4.2%
EL 1.3 1.3
ES 27.6 27.6
FR (Met.) 388.4 421.9 -7.9%
FR (Dom.)
HR 14.5 16.6 -12.6%
IT 30.2 34.4 -12.2%
LT 15.5 16.2 -4.5%
HU 13.5 14.0 -3.9%
NL 80.7 86.2 -6.4%
AT 28.0 31.1 -9.9%
PL 240.9 238.9 0.8%
PT (Continent)
PT (Açores)
RO 23.1 24.6 -6.3%
SK 22.7 21.9 3.2%
FI 10.7 10.3 4.4%
SE 26.6 30.7 -13.3%
UK 90.2 97.2 -7.2%
TOTAL 1 533 1 623 -5.5%
EL ES: Commission estimates
Communication to the Commission
Areas - June 2019
Commission Regulation - R 2017/1185 Art. 12(b) - Annex III.2.A

EU Sugar Production
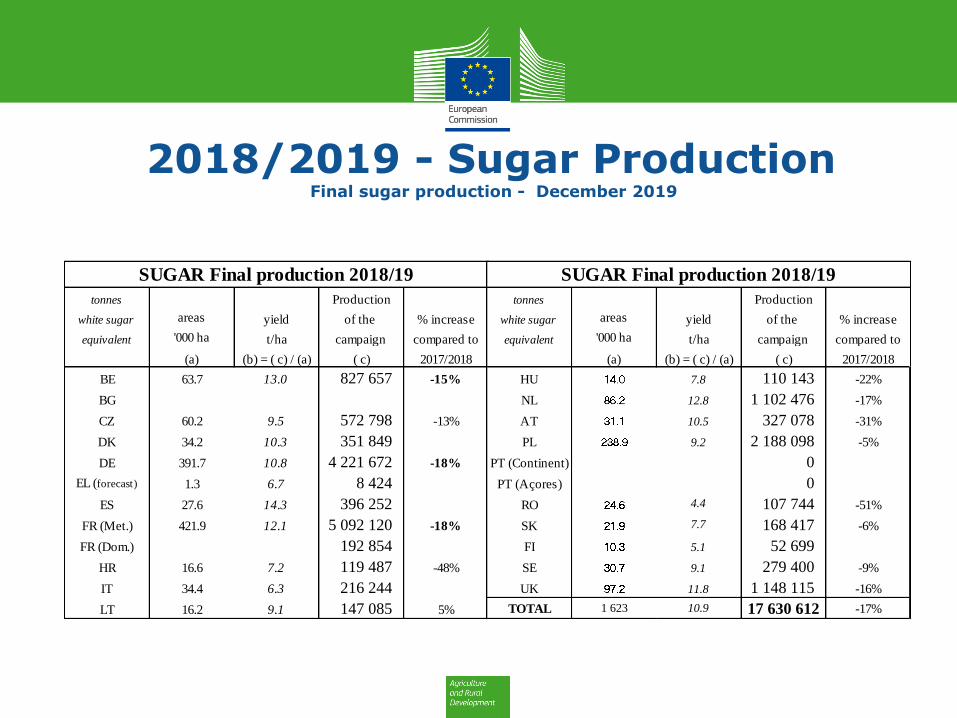
2018/2019 - Sugar ProductionFinal sugar production - December 2019
tonnes Production
white sugar areas yield of the % increase
equivalent '000 ha t/ha campaign compared to
(a) (b) = ( c) / (a) ( c) 2017/2018
BE 63.7 13.0 827 657 -15%
BG
CZ 60.2 9.5 572 798 -13%
DK 34.2 10.3 351 849
DE 391.7 10.8 4 221 672 -18%
EL (forecast) 1.3 6.7 8 424
ES 27.6 14.3 396 252
FR (Met.) 421.9 12.1 5 092 120 -18%
FR (Dom.) 192 854
HR 16.6 7.2 119 487 -48%
IT 34.4 6.3 216 244
LT 16.2 9.1 147 085 5%
SUGAR Final production 2018/19
tonnes Production
white sugar areas yield of the % increase
equivalent '000 ha t/ha campaign compared to
(a) (b) = ( c) / (a) ( c) 2017/2018
HU 7.8 110 143 -22%
NL 12.8 1 102 476 -17%
AT 10.5 327 078 -31%
PL 9.2 2 188 098 -5%
PT (Continent) 0
PT (Açores) 0
RO 4.4 107 744 -51%
SK 7.7 168 417 -6%
FI 5.1 52 699
SE 9.1 279 400 -9%
UK 11.8 1 148 115 -16%
TOTAL 1 623 10.9 17 630 612 -17%
SUGAR Final production 2018/19

2019/2020 - Sugar ProductionSugar production forecast - December 2019
tonnes Production
white sugar areas yield of the % increase
equivalent '000 ha t/ha campaign compared to
(a) (b) ( c) = (a) * (b) 2018/2019
BE 58.8 12.8 751 000 -9%
BG
CZ 56.2 10.3 576 569
DK 29.3 12.0 351 516
DE 375.6 11.2 4 201 995 0%
EL 1.3 6.2 7 737
ES 27.6 16.3 450 000
FR (Met.) 388.4 12.4 4 818 272 -5%
FR (Dom.) 180 000
HR 14.5 7.9 115 000 -4%
IT 30.2 7.7 222 109
LT 15.5 9.2 142 366
SUGAR production forecast 2019/20
tonnes Production
white sugar areas yield of the % increase
equivalent '000 ha t/ha campaign compared to
(a) (b) ( c) = (a) * (b) 2018/2019
HU 13.5 7.8 105 000 -5%
NL 80.7 13.6 1 097 520 0%
AT 28.0 11.4 319 000 -2%
PL 240.9 8.7 2 100 000 -4%
PT (Continent)
PT (Açores)
RO 23.1 6.5 149 773
SK 22.7 8.6 195 000
FI 10.7 7.0 75 000
SE 26.6 11.4 303 240 9%
UK 90.2 13.0 1 170 000 2%
TOTAL 1 534 11.3 17 331 098 -2%
SUGAR production forecast 2019/20
Production forecast based on areas and long term average yield per MS
for CZ, DK, EL, ES, IT, LT, RO;
MS estimates for others


Thank you
for your attention
Disclaimer:
“The United Kingdom is no longer a Member State of the European Union, however where it is deemed relevant (e.g. for comparison purposes) an EU+UK aggregate may still be displayed.”