break-even point in sugar-beet production
TRANSCRIPT
111God. XXVIII, BR. 1/2015. str. 111-127
Ilija Nedić: Break-even point in sugar-beet production
Abstract
World sugar consumption has been recording a steady growth in the past 70 years and, according to all relevant estimates, it will continue to grow also in the next decade, which puts sugar in the category of the most significant foods and commodities in the world.
Of the total world sugar production, around 77% is derived from sugar cane and 23% from sugar beet. Brazil has been the world leader in sugar production for a long period of time, producing white sugar from sugar cane only, whereas the leader in the production of sugar derived from sugar beet is the EU-28.
When the Republic of Croatia joined the EU, the Croatian sugar industry became part of the single Euro-pean sugar market, so the break-even point was used in the research to determine the competitiveness level of the Croatian sugar beet production.
Based on the expected selling price of sugar beet amounting to EUR 34 per ton of standard quality sugar beet, and using the break-even method, it was determined that the quantity required to cover total costs in sugar beet production in the Republic of Croatia amounts to 55.26 tons per hectare of payable sugar beet, standard quality, i.e. 8.84 tons of polarized sugar per hectare. As the average sugar beet production in the Republic of Croatia, expressed in the equivalent of polarized sugar, amounts to 7.8 tons per hectare, it is obvious that an average Croatian producer of sugar beet, without income from subsidies, operates at a loss.
Keywords: Break-even point, sugar, beet, cane
UDK: 657.4:664.1(497.5)Preliminary communication
Received: February 25, 2015accepted for publishing: May 20, 2015
Ilija NedićTena d.o.o. OsijekM. a. Reljkovića 7,31000 Osijek, [email protected]: +38598372005
BREAK-EVEN POINT IN SUGAR-BEET PRODUCTION
1. Introduction
The irrefutable truth is that in the modern world there is no developed society or developed economy without a developed agriculture. Therefore, it may well be concluded that the situation in agriculture is the best indicator of the overall situation in a socie-ty, particularly its abilities to efficiently utilise avail-able resources and competitive advantages.
By observing Croatian agriculture and key indica-tors of production, import, export, and the develop-
ment level of rural areas, unfortunately, a conclu-sion can be drawn that in the past twenty years the Republic of Croatia was unable to provide even the basic prerequisites (for example, formulating the agricultural strategy, establishing long-term land policy, irrigation, zoning, financing scheme, etc.) to use available resources. Despite huge resources invested in agricultural subsidies and preferential trade status with the European Union in the period 2005-2013, today we have mostly unorganised, non-competitive production and devastated rural areas. Such a situation in agriculture, of course, cannot

112 God. XXVIII, BR. 1/2015. str. 111-127
Ilija Nedić: Break-even point in sugar-beet production
and must not be observed separately from the situ-ation in the society as a whole, and certainly one should take into account war events (a great part of population left rural areas; direct war damages), as well as an overall lack of adequate monetary and fis-cal policy.
The recent accession of the Republic of Croatia to the European Union resulted in the obligation of adapting the Croatian agricultural policy according to the Common Agricultural Policy of the European Union1, so it will be extremely difficult to compen-sate for everything that we have failed to do in the past twenty years, particularly in the conditions of the open EU market. One of the more important CAP segments at the EU level is certainly the sugar market order2 that represents a continuation of the sugar market order in the EU, in force since 1968.
A developed sugar industry has been present in the Republic of Croatia for more than a century. Hav-ing been through the transition and privatisation process and owing to special trade agreements with the European Union3, in the period from 2006 to the present the Croatian sugar industry has record-ed good business results and provided the leading position in the export balance of the Croatian food industry4. However, the decision to lift the produc-tion restrictions in the sugar sector, adopted at the EU-28 level and coming into effect in 2017, makes one wonder how this decision will affect Croatian sugar factories, what is the future of this industry and, consequently, of sugar beet production in the Republic of Croatia.
To answer these questions, the break-even point was applied to determine the required level of sugar beet production per hectare, at which revenue is equal to costs, i.e. the break-even point in sugar beet production in the Republic of Croatia. In addition, competitiveness of the Croatian sugar industry was compared with other EU-28 states. The data used as the default values were historical data on the achieved level of yield measured in tons of polarized sugar per hectare, projections of expected future prices of sugar beet in the EU-285, as well as real costs of sugar production of selected, representa-tive sugar beet producers in the Republic of Croatia, who are successful sugar beet producers in terms of cost effectiveness.
2. Definition of the break-even model
Any business venture can produce a profit only when its total revenue exceeds its total costs. In the event that costs exceed revenue, the venture will generate a loss. A whole array of economic models is available for determining whether a venture or a product generates gain or loss. One of the simplest tools for assessment of economic feasibility of a venture or a product is the break-even analysis.
Although it is a fairly straightforward indicator, the break-even point is relatively underused in the available literature and research papers. The inten-tion of this paper was to demonstrate the simplicity of use of this tool and to motivate other authors to employ this type of analysis in their research more frequently.
The break-even point is the level of business at which total revenues are equal to total costs. The term “break-event point” arises from the graphic interpretation of this model, because the break-event point is at the intersection of total revenues and total costs, thus reflecting the level of revenue and quantity of products required to reach the break-even point. Understandably, at this point, where total revenues and total costs become equal and intersect, a company or a product for which the break-even point is being determined generates nei-ther loss nor gain.
The break-even point may be expressed in units of products (quantity) or revenue. Simply put, for a particular product it can be determined that the break-even point will be reached by selling, for ex-ample, 600 units of this product at an annual level. It can also be determined that, for example, total reve-nue amounting to 300,000 will provide the rentabil-ity threshold, i.e. at this revenue level the company’s revenues and costs will be equal, thus the company will be operating at no profit or loss (Graph 1).
It is clear that any sale of the product above the quantity defined by the break-even point (in our example more than 600 units) will generate profit, whereas any sale below the break-even point will generate loss. The same applies to revenue: if rev-enue is higher than the amount determined by the break-even analysis (in our example more than 300,000), profit is generated, and if revenue is below the amount determined by the break-even point, loss is generated.

113God. XXVIII, BR. 1/2015. str. 111-127
UDK: 657.4:664.1(497.5) / Preliminary communication
Graph 1 Break-even point
Source: author
The method used to calculate the break-even point is quite simple, which is the key advantage of this model. However, the key disadvantage of this model is that it presumes a linear revenue growth, mean-ing that the company sells products at the same price and that it has the same sales structure and the product mix regardless of the sales volume and time dimension, as well as a linear change of total cost of the product regardless of the production volume.
3. Sugar production and consumption
Observed at the global level, sugar consumption has recorded significant growth in the past seventy years, from 24 million tons in 1940 to 163 million tons estimated for 2011. Asian countries, primarily India and China, account for the most significant part of the world sugar consumption, although in terms of per capita consumption, these are still the areas with the lowest sugar consumption.
According to current estimates, sugar production and consumption in the world is expected to grow by 1.9% per year in the period until 20236.
Consumption growth will be most pronounced in the areas where sugar consumption is below the global average, primarily in China and India, but also in Indonesia and Africa.
Regarding sugar production, today’s sources are sugar cane and sugar beet. Depending primarily on climate conditions, 9 countries of the world pro-duce sugar from both sugar cane and sugar beet, whereas sugar derived from sugar cane only is pro-duced in 71 countries, and sugar derived from sugar beet only is produced in 43 countries of the world.
Observed at the global level, sugar cane is used as raw material for production of 77.1% of the total produced sugar (data for marketing year 2011/2012), and the remaining 22.9% of sugar is produced from sugar beet.
The world sugar production is dominated by Brazil, China, India, the EU and Thailand. In the marketing year 2013/2014 together they produced around 102 million tons of sugar, or 58.5% of the world sugar production.
It is interesting to look at the sugar production and consumption balance by countries and regions (Ta-ble 1).

114
Source: author
Source: author
Graph 2 World sugar consumption in million tons – 2011
Graph 3 World sugar production 1972 – 2011
God. XXVIII, BR. 1/2015. str. 111-127
Ilija Nedić: Break-even point in sugar-beet production

115
Source: United States department of agriculture, Economic Research Service, World production, supply, and distribution, centrifugal sugar, according to: http://www.ers.usda.gov/data-products/sugar-and-swee-teners-yearbook-tables.aspx#25440/ (accessed on: February 24, 2015)
Table 1 Sugar production and consumption by country/region (000t) - 2013/2014
Country/Region Production Consumption Importer (-)/ Exporter
Argentina 1,780 1,850 -70
Australia 4,400 1,218 3,182
Brazil 37,800 11,260 26,540
Canada 100 1,131 -1,031
China 14,263 16,500 -2,237
Colombia 2,300 1,565 735
Cuba 1,600 740 860
Dominican Republic 561 390 171
Egypt 2,013 2,870 -857
European Union-28 16,010 18,300 -2,290
Guatemala 2,852 764 2,088
India 26,605 26,000 605
Japan 750 2,154 -1,404
Mexico 6,383 4,543 1,840
Other Caribbean 190 425 -235
Other Central America 2,700 1,330 1,370
Other East Asia 65 2,382 -2,317
Other Europe 684 984 -300
Other Former Soviet Union 2,133 3,542 -1,409
Other Middle East 1,530 8,588 -7,058
Other North Africa 400 3,219 -2,819
Other Oceania 240 361 -121
Other South America 3,370 4,597 -1,227
Other South Asia 335 2,962 -2,627
Other Southeast Asia 4,165 10,439 -6,274
Other Sub-Saharan Africa 5,976 10,017 -4,041
Pakistan 5,215 4,450 765
Philippines 2,450 2,200 250
Russia 4,400 5,615 -1,215
Thailand 11,333 2,600 8,733
Turkey 2,300 2,320 -20
United States 7,672 11,084 -3,412
Others 2,435 1,895 540
World 175,010 168,295 6,715
God. XXVIII, BR. 1/2015. str. 111-127
UDK: 657.4:664.1(497.5) / Preliminary communication

116
According to Table 1, Brazil, Thailand, Australia, Guatemala and Mexico are major suppliers of sugar in the world market, as their sugar production ex-ceeds their sugar consumption.
3.1 Sugar production from sugar cane
The dominant role in production of sugar from sugar cane, but also in sugar production in general, is played by Brazil. This country currently produces around 40% of the world’s sugar cane, grown on the area of 9.5 million hectares, and it accounts for 21.6% of the total world sugar production7. Here, one should bear in mind that a significant share of sugar cane in Brazil is used for ethanol production. Depending on trends in ethanol price (i.e. oil prices) and sugar, the Brazilian sugar industry changes the proportion of sugar cane used for ethanol produc-tion or sugar production.
Table 2 Key production figures – Brazil
BrazilMarketing year
2012/2013 2013/2014
Sugar cane production (mil. tons) 532 597
Sugar cane used for production of:
Sugar 49.54% 45.22%
Ethanol 50.46% 54.78%
Produced sugar (mil. tons) 34.10 34.30
Produced ethanol (billi-on litres) 21.36 25.58
Yield (litre of ethanol/ ton of sugar cane) 79.57 78.18
Yield (kilo of sugar/ton of sugar cane) 129.38 94.72
Source: Unica, Final report of 2013/2014 harvest season8
Hypothetically speaking, if the total quantity of sug-ar cane had been processed into sugar, sugar pro-duction in Brazil in the marketing year 2013/2014
would have amounted to 56.55 million tons.
It should be kept in mind that only 70 million hec-tares of the total 850 million hectares in Brazil, or less than 9% of the total available area, is used for production purposes. In its projections of trends in sugar cane production, UNICA9 envisages growth by the marketing year 2020/2021 to 1,200 million tons (double the current production level). Taking into account the usual ratio between sugar cane used for ethanol production (55%) and sugar cane used for sugar production (45%), this means that sugar production in Brazil, depending on trends in sugar cane yield and digestion (sugar content), should reach the level between 50 and 60 million tons per year. As it is expected in the same pe-riod that the world sugar consumption will grow by a total of 30 million tons, i.e. from the current 170 million tons to around 200 million tons, it is obvious that a good part of the expected produc-tion increase will be covered by Brazil. Depending on oil price trends, but also on investments in new processing capacities, the ratio of ethanol and sugar production in Brazil may vary to a significant extent and it will certainly have a key impact on the future situation in the global sugar market.
3.2 Sugar production from sugar beet
Sugar beet is grown in the northern hemisphere, on the area of around 5 million hectares, in areas with mild and moderate climate conditions. World sugar beet production is dominated by Europe, which ac-counts for more than 75% of the world production of sugar derived from sugar beet, and, observed by countries, by Russia, Ukraine, the USA, Germany, France, Turkey, China and Poland. In 2011 these eight countries accounted for 94% of the world sug-ar beet production.
To fully understand the market potential of the countries producing sugar from sugar beet, it should be pointed out that, except France, none of the countries have a significant sugar surplus in the market, which by no means reduces the importance of sugar quantities produced from sugar beet, be-cause it is used to substitute import of sugar pro-duced from sugar cane.
God. XXVIII, BR. 1/2015. str. 111-127
Ilija Nedić: Break-even point in sugar-beet production

117
Source: Food and agriculture Organization of the United Nations (2012), according to: http://faostat.fao.org/site/339/default.aspx/ (accessed on: Febru-ary 24, 2015)
Information about sugar quantity produced per hectare from Table 3 also shows the competitive-ness level in sugar production derived from sugar beet at the national level. The presented data indi-cate full domination of sugar beet producers from the EU-28 member states.
3.3 The sugar sector in the EU
As the Republic of Croatia became a full member of the European Union in July 2013, the Croatian sugar market also became part of the single Euro-pean sugar market.
The production of sugar beet and sugar in the EU is regulated by sugar market orders10, existing in vari-ous regulation forms and degrees since 196811. Sig-nificant reforms have taken place on several occa-sions during that period. Among more recent ones is the reform adopted on 24 November 2005, refer-ring to the period from 1 July 2006 to 30 Septem-ber 2015. After negotiations with the World Trade Organisation (WTO) in Doha12, the reform had the following results at the EU level:
• Removal of the intervention price of EUR 631.9 per ton of white sugar and introduction of the reference price, which had to be reduced by the
marketing year 2009/2010 to the level of EUR 404 per ton of white sugar.
• Reduction of the minimum price for sugar beet from EUR 43.63 per ton to EUR 26.3 per ton by the marketing year 2009/2010.
• The current “A”, “B” and “C” sugar production quotas were united in a single production quota, which initially amounted to 18.5 million tons of white sugar.
• As the sugar price in the European market was then significantly higher than the price of sugar which had preferential access to the EU market since 1 July 2009 as a result of Doha negotiations (mostly raw sugar from Least Developed Coun-tries (LDC) and African, Caribbean and Pacific Group of States (ACP)), a new production com-pensation for white sugar was introduced, used for funding the programme for reduction of sug-ar production in the EU. The Commission’s esti-mates were that the annual sugar surplus at the EU level would amount to around 6 million tons and for this reason a stimulation programme was launched to reduce sugar production in the EU. The programme encompassed the period from the marketing year 2006/2007 to the marketing year 2009/2010. Its financial value was EUR 5.7 billion and it envisaged a compensation in the amount of EUR 750 per ton of white sugar in 2006/2007, gradually decreasing until 2009/2010, when the compensation amounted to EUR 520 per ton of white sugar for all sugar factories that closed down (and physically destroyed, disman-tled) all their facilities. To compensate for the
Country/Region
Planted area of sugar-beet Sugar-beet sugar productionTons of sugar / ha of the sugar-
beetHa Share in the world area (%) Tons
Share in the world producti-
on (%)
EU - 27 1,540,000 30.4% 17,988,766 48.5% 11.80
Russia 1,210,000 23.9% 5,545,000 15.0% 4.58
Ukraine 532,000 10.5% 2,000,000 5.4% 3.76
Turkey 329,000 6.5% 2,300,000 6.2% 6.99
USA 450,000 8.9% 4,235,000 11.4% 9.41
Others 1,000,000 19.8% 5,000,000 13.5% 5.00
Total 5,061,000 100.0% 37,068,766 100.0% 7.32
Table 3 World sugar-beet sugar production - 2011/2012
God. XXVIII, BR. 1/2015. str. 111-127
UDK: 657.4:664.1(497.5) / Preliminary communication

118
negative impact on sugar beet producers, in May 2007 the Commission also introduced additional stimulation payments for sugar beet producers through the Single Payment Scheme.
In the end, the entire reform resulted in the reduc-tion of processing capacities by 60%, achieved by closing down 83 sugar factories in the EU, reducing production quotas by 30% or 6 million tons of sugar per year, and establishing a production quota for white sugar derived from sugar beet in the EU-28 at the level of 13.5 million tons per year.
3.3.1 Sugar consumption in the EU-28
According to the official data provided by the rel-evant body of the European Commission13, as of 30 September 2014, sugar consumption in the EU-28 in the past four years ranged between 18 and 19 million tons per year.Of the total sugar consumption in the EU, industrial consumers account for 70%, whereas household consumers account for 30% of production.
Graph 4 Sugar consumption in EU-28 (mil. t)
Source: author
Observed by the origin of sweeteners, about 5% of the EU-28 needs are covered by isoglucose, 17% is sugar derived from sugar cane (through import of raw sugar) and the remaining 78% is sugar from sugar beet. According to FAO, sugar consump-tion in the EU is at the level of 39.13 kg per capita, which, taking into account imports and exports of products containing sugar, corresponds to the pro-jections shown in Graph 4.
3.3.2 Sugar market supply in the EU-28
After the 2006 sugar market reform, in a very short period of time the EU-28 has gone from the second largest world exporter of sugar (after Brazil) to the second largest importer of sugar in the world (af-ter Russia). The annual sugar import in the EU-28 is between 3-4 million tons per year, 90% of which is sugar, and 10% is sugar in processed products.
The structure of imported sugar in the marketing year 2013/2014 is dominated by sugar originating from ACP and LDC countries (over 70% of import-ed sugar), which is imported without any quantity or customs restrictions. The remaining raw sugar (from Brazil, Columbia, Peru) within so-called CXL quota is imported with import duty of EUR 98 per ton of raw sugar.
God. XXVIII, BR. 1/2015. str. 111-127
Ilija Nedić: Break-even point in sugar-beet production

119
Source: aGRI c5, European commission, Sugar tra-de statistics, 10/2014
Any additional sugar quantity outside the TRQ system14 can be imported to the single EU-28 mar-ket only with customs duties, which are EUR 339 per ton of raw sugar and EUR 419 per ton of white sugar, making sugar imported in this way entirely uncompetitive in the EU-28 market.
Table 4 shows that total sugar production from sugar beet at the EU-27 level in 2012/2013 amount-ed to 18,903,000 tons of sugar from sugar beet (13,995,000 tons/quota sugar + 4,908,000 tons/out-of-quota sugar). Total consumption was 18,877,000 tons of white sugar (16,575,000 tons + 2,302,000 tons) and it was covered by the beginning stocks of 1.6 million tons of sugar produced from sugar beet and the remaining 2.68 million tons were covered from processed raw sugar.
3.3.3 Production of sugar from sugar beet in the EU-28
As we have seen so far, the single EU-28 sugar mar-ket is predominantly (78%) covered by sugar pro-duced from sugar beet in one of the nineteen EU-28 member states where sugar is produced from sugar beet. As the EU-28 was the second largest exporter of sugar in the world until the latest sugar market reform in 2006 and today it is the largest sugar im-porter in the world, along with Russia, the European Commission and the European Parliament decided to completely abolish production quotas for sugar produced from sugar beet within the EU-28, start-ing on 1 October 2017, and gradually allow liber-alisation of sugar import and export. This fact is of particular importance for the Croatian sugar indus-try, which, after having entered the single EU-28 sugar market recently, will again face great market challenges in a few years. Its readiness for the chal-lenges ahead will depend on a variety of circum-stances, but in the end mostly on the competitive-ness of the local sugar beet production.
Description Quota sugar Out-of- quota sugar
Beginning stocks 1,595
Production 14,597
Sugar produced from sugar-beet 13,995 4,908
Transfer of out-of-quota sugar into quota sugar 602 (602)
Total import 4,158
Sugar 3,635
Processed goods 523
Total available 20,350 4,306
Consumption 16,575
Consumption - industry 2,302
Total Export 1,281 1,335
Sugar 63
Processed goods 1,218
Ending stocks 2,494 669
Total exit 20,350 4,306
Table 4 Balance of sugar in EU-27 - 2012/2013 (000 t)
God. XXVIII, BR. 1/2015. str. 111-127
UDK: 657.4:664.1(497.5) / Preliminary communication

120
Source: author
Within the EU-28, sugar derived from sugar beet is produced in nineteen member states according to the current production quotas, which, after Croa-tian accession to the EU, amount to 13,529,618 tons of white sugar from sugar beet15 and 720,441 tons of isoglucose per year. Sugar beet is grown on about 1.5 million hectares, which combined with the aver-age production of 11-12 tons of sugar per hectare gives 17 million tons (the average in the past eight marketing years).
Graph 5 Sugar yield (tons/ha of sugar beet) in Croatia and EU-28
Source: author
Therefore, although there are production restric-tions, Table 5 shows that production of sugar from sugar beet in the EU-28 exceeded the production quota in each marketing year following the 2006 re-form by an average of 3.6 million tons.
More detailed insight in the production of sugar from sugar beet is provided in Table 6, according to which the production of sugar from sugar beet in the EU-27 in the marketing year 2012/2013 was dominated (12 million tons) by five member states, namely France, Germany, Poland, Netherlands and the UK.
Marketing year Planted area of sugar-beet (ha)
Polarisation sugar (t/ha)
Quota pro-duction (tons of sugar-beet
sugar)
Total production (tons of sugar-
beet sugar/year)
Out-of-quota sugar-beet
sugar (t/year)
2007/2008 1,722,000 10.3 13,336,741 15,836,930 2,500,189
2008/2009 1,474,000 10.8 13,336,741 15,236,909 1,900,168
2009/2010 1,535,000 11.7 13,336,741 17,505,338 4,168,597
2010/2011 1,519,000 10.3 13,336,741 15,429,140 2,092,399
2011/2012 1,524,000 11.8 13,336,741 18,743,490 5,406,749
2012/2013 1,497,000 11.3 13,336,741 17,366,485 4,029744
2013/2014 1,512,000 11.1 13,529,618 16,818,855 3,289,237
2014/2015 (F) 1,560,000 12.2 13,529,618 19,070,194 5,540,576
Table 5 Sugar-beet sugar production in EU-28
God. XXVIII, BR. 1/2015. str. 111-127
Ilija Nedić: Break-even point in sugar-beet production

121
Source: author
The average sugar production per hectare in these five countries amounts to 11.6 tons, which is above the average level of the EU-27.
These five leading countries in the production of sugar from sugar beet are situated in the northern or north-western part of Europe, with favourable climate conditions for this crop. This primarily refers to extreme temperatures that are typical of the south-eastern Europe in July and August, when night temperatures often exceed 20 Cº, causing sugar beet to stop growing and to start producing new leaves16, resulting in the end in low sugar beet yield per hectare and low sugar content (digestion).
If sugar yields per hectare in the Republic of Croatia and the EU-28 are compared in the past eight years, significant deviations may be observed, which are extremely unfavourable for Croatian sugar beet producers in terms of their competitiveness.
The calculated eight-year average of sugar yield per hectare in the Republic of Croatia in the observed period is 7.80 tons per hectare, whereas in the EU-27 it is significantly higher, amounting to 11.19 tons per hectare, i.e. 43% higher than in the Republic of Croatia.
Consequently, the difference in sugar beet yield per hectare implies the difference in (lower) revenue per hectare between sugar beet producers in
Member state
Quota for sugar-beet
sugar produc-tion (tons/
year)
Planted area of sugar-beet
(000 ha)
Yield of sugar (tons/ha)
Total sugar-beet sugar production
(tons)
Out-of-quota sugar
produced (tons/year)
Belgium 676,235 63 12.1 761,533 85,298
Czech Republic 372,459 52 10.9 565,462 193,003
Denmark 372,383 41 11.7 480,366 107,983
Germany 2,898,256 350 11.4 4,006,872 1,108,616
Greece 158,702 9 5.9 158,126 -
Spain 498,480 36 14.8 531,845 33,365
France (Metropolitan) 3,004,811 341 12.4 4,222,847 1,218,036
France (DOM-Overseas) 432,220 - - 412,164 -
Italy 508,379 52 10.5 546,362 37,983
Lithuania 90,252 19 7.6 190,253 100,001
Hungary 105,420 18 6.4 111,959 6,539
Netherlands 804,888 73 13.3 968,459 163,571
Austria 351,027 49 9.6 469,024 117,997
Poland 1,405,608 192 9.4 1,803,332 397,724
Portugal (Acores) 9,953 - - 358 -
Romania 104,689 28 9.2 258,621 153,932
Slovakia 112,320 19 11.8 228,698 116,378
Finland 80,999 12 6.2 140,460 59,461
Sweden 293,186 38 9.6 365,869 72,683
United Kingdom 1,056,474 104 11.0 1,143,875 87,401
Total EU-27 13,336,741 1.496 11.3 17.366.485 4.059.971
Table 6 Production of sugar-beet sugar in EU-27 - 2012/2013
God. XXVIII, BR. 1/2015. str. 111-127
UDK: 657.4:664.1(497.5) / Preliminary communication
122
Source: author
the Republic of Croatia and the EU-27. To gener-ate the same revenue per hectare, the sugar beet price for sugar beet producers in the Republic of Croatia should be 43% higher than the price for pro-ducers in the EU-27 or they should receive higher
subsidies (additional payment for sugar beet). It is clear that the higher price of sugar beet for produc-ers in the Republic of Croatia means higher price per ton of sugar produced by the Croatian sugar factories, which would deteriorate the sustainability
Number Cost Unit cost -HRK/hectare of sugar-beet
1 Seed 1,456.75
2 Plant protection means 2,062.03
3 Fertiliser 2,457.30
4 Manure 1,291.79
5 Other materials 140.39
I=(1+2+3+4+5) Cost of materials 7,408.25
6 Heavy tractor costs 709.24
7 Heavy tractor connected machine costs 97.45
8 Medium heavy tractor costs 586.75
9 Medium heavy tractor connected machine costs 154.86
10 Harvester costs 707.38
11 (6+7+8+9+10) Company machines costs 2,255.68
12 External machine services 394.57
II = (11+12) Total machine costs 2,650.25
13 Department overheads 1,201.40
14 Company overheads 1,218.82
III=(13+14) Total overheads 2,420.22
15 Transport services 19.76
16 Samples control services 66.94
17 Land rent costs 541.95
18 Other costs 61.46
IV=(15+16+17+18) Total other costs 690.10
19 Cost of permanent employees 533.12
20 Cost of temporary employees 694.55
V=(19+20) Total cost of workforce 1,227.66
I+II+III+IV+V Total production costs 14,396.48
Average yield of payable sugar-beet in Croatia, standard quality (16% sucrose content) in tons/ha 48.74
Total cost in HRK per ton of sugar-beet standard quality 295.37
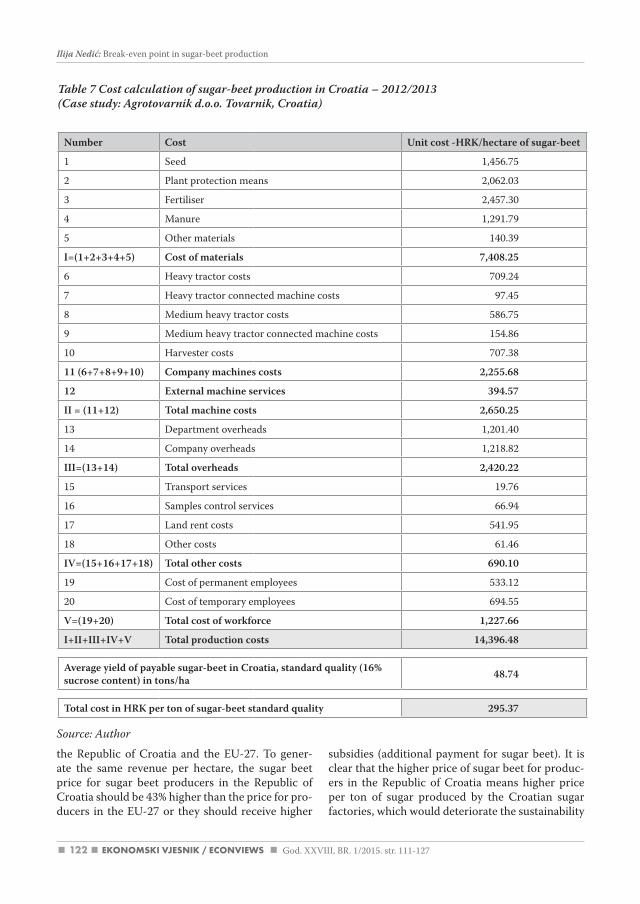
Table 7 Cost calculation of sugar-beet production in Croatia – 2012/2013(Case study: Agrotovarnik d.o.o. Tovarnik, Croatia)
God. XXVIII, BR. 1/2015. str. 111-127
Ilija Nedić: Break-even point in sugar-beet production

123
of this industry in the long run. Related to subsidies, additional payment for sugar beet will amount to EUR 6.5 million starting in 2015, which, based on the average area planted with 23,000 hectares of sugar beet in Croatia, presents additional payment in the amount of EUR 283 per hectare. Ten of the EU-28 states have additional payments for sugar beet and Croatia is in the eighth position by the amount of ad-ditional payments. A lower level of additional pay-ments can only be found in the Czech Republic (EUR 267 per hectare) and Finland (EUR 70 per hectare).
The previously determined eight-year average yield per hectare of 7.80 tons in the Republic of Croatia, based on standard digestion of 16%, means the yield of (7.8t/16%=) 48.75 tons of payable sugar beet per hectare.
3.4 The break-even point in sugar beet production in the Republic of Croatia
In order to determine the competitiveness of the Croatian sugar beet production, costs of producing a ton of standard quality sugar beet should be de-termined first.
Although as a rule, costs of material or machine work are in direct correlation with the production volume and variable in their nature, in our exam-ple they are expressed as unit costs, because for the needs of this research they are observed at the level of one hectare, which is used as a basic production area.
In the above mentioned report17, the reference price of sugar beet in 2020, i.e. after the new market or-der in the EU-28 becomes fully operational, is esti-mated at EUR 34 per ton of standard quality sugar beet (16% digestion) in the post quota sugar sector, starting from 1 October 2017.
By applying the midpoint exchange rate of the Croa-tian National Bank on 25 December 2014, the fol-lowing result is obtained: EUR 34.00 x 7.661973= HRK 260.51, which would be the selling price of sugar beet.
To achieve a production cost coverage presented in Table 7, the required yield would be 55.26 tons of payable sugar beet of standard quality per hectare:
To obtain comparable data, it is presumed that there are no revenues from subsidies (regional pay-ment and additional payment) and that production costs per hectare of sugar beet are the same as at the EU-28 level18. As shown in Graph 7, an average producer in the EU-28, with equal production costs, generates a profit amounting to HRK 3,787 per hec-tare of sugar beet. At the same time and under same conditions, an average sugar beet producer in the Republic of Croatia generates a loss of HRK 1,700 per hectare of sugar beet. The reason for such a big difference lies solely in the yield per hectare of sugar beet. Both producers implement all the required agrotechnical measures, they have similar labour and machinery costs, but in the end, due to differ-ent yields, they have completely different business results.
To assess the competitiveness of the Croatian sug-ar industry, we should certainly bear in mind the technological level of the Croatian sugar factories, but even more importantly their capacity, given that fixed costs (amortisation, full-time workers, CAPEX) account for about 50% of total costs. The average daily processing capacity of the Croatian sugar factories is around 6,330 tons per day per factory (Osijek 7,000 tons; Županja 6,000 tons; and Virovitica 6,000 tons), with average campaign du-ration being 90 days, which means that in a usual average 90-day campaign the Croatian sugar facto-ries process around 1.7 million tons of sugar beet per year.
The average capacity in the remaining EU-28 states (106 sugar factories) is 9,143 tons of sugar beet per day per factory, or overall 941,697 tons of sugar beet per day, with average campaign duration being 120 days. The total quantity of sugar beet bought by sugar factories in the EU-27 was around 100 mil-lion tons in the past few years, whereas the average quantity of sugar beet in the EU-25 before the last sugar market reform in 2006 amounted to 127 mil-lion tons per year.
God. XXVIII, BR. 1/2015. str. 111-127
UDK: 657.4:664.1(497.5) / Preliminary communication

124
Source: author
4. Conclusion
Sugar beet has a dominant role in the cost price of a ton of white sugar. Available calculations of the major sugar producers in the EU-28 (Table 6) show that the cost of sugar beet processing amounts to EUR 150 per ton of white sugar, and the share of sugar beet in a ton of sugar is calculated based on 86% utilisation, which means that a ton of white sugar requires (1,000kg/(16% digestion x 86% utili-sation) = 7.267 tons of standard quality sugar beet. If the forecasted price of sugar beet is EUR 34 per ton, this means that the participation of sugar beet in a ton of white sugar is (7.267 tons of sugar beet x EUR 34 per ton) EUR 247, i.e. around 62% of to-tal costs (EUR 150+EUR 247=EUR 397 per ton) of white sugar production.
According to the conducted research, it can be concluded that sugar production per hectare in the Republic of Croatia is lower (-43%) in comparison to the remaining members of the EU-28, as are the installed daily processing capacities per sugar fac-tory per day (-44%). With the average yield being 7.8 sugar per hectare and without subsidies, Croatian sugar beet producers generate loss in this produc-tion segment (the break-even point expressed as the quantity of products is at the level of 55.26 tons
of sugar beet of standard quality per hectare) and, consequently, they produce only 1.12 million tons of sugar beet, which is sufficient for all Croatian sugar factories to work only 59 days in a year. All this greatly increases the costs of sugar production and makes the Croatian industry in its current form vulnerable and even unsustainable in the long run, particularly after 1 October 2017.
Additional payment per hectare based on the enve-lope amounting to EUR 6.5 million per year, which comes into force with the marketing year 2015/2016, will not influence the competitiveness of the Croa-tian sugar beet production to a more significant level by itself. On the contrary, as the current price of white sugar in the single EU-28 market is below EUR 400 per ton, and with this year’s expected pro-duction in the EU-28 amounting to extremely high 19 million tons of sugar derived from sugar beet, the price of sugar beet in the following few years will probably have to be lower than the forecasted EUR 34 per ton. Given that the current additional pay-ment per hectare of sugar beet is around EUR 180, and the average area under sugar beet in Croatia in the past few years has been 23,000 hectares, at the price of EUR 40 per ton of payable sugar beet, standard quality, it is quite realistic to assume that the decrease in the price of sugar beet will result in a reduction of areas planted with sugar beet in the Republic of Croatia, which are insufficient as it is.
Graph 6 Break-even point measured in volume (tons) of sugar-beet per hectare in Croatia
God. XXVIII, BR. 1/2015. str. 111-127
Ilija Nedić: Break-even point in sugar-beet production

125
References
1. Brigham, E. F., Houston, J. F. (2011). Fundamentals of Financial Management. Concise 7th Edition. Mason- Ohio: South-Western Cengage Learning.
2. EU Commission, Joint Research Centre, Institute for Prospective Technological Studies (2014). EU sugar policy: A sweet transition after 2015? . Luxembourg: Publications Office of the European Union.
3. Karić, M. (2005). Ekonomika poduzetnika. II. Izdanje. Osijek: Ekonomski fakultet u Osijeku.
4. Karić, M. (2008). Upravljanje troškovima. I. izdanje. Osijek: Ekonomski fakultet u Osijeku.
5. Karić, M., Štefanić, I. (1999). Troškovi i kalkulacije u poljoprivrednoj proizvodnji. Osijek: Poljoprivred-ni fakultet u Osijeku.
6. Laate, E. A. (2011). The economics of sugar beet production in Alberta 2011. Canada: Alberta Agricul-ture and Rural Development.
7. Majcan, Ž. (1976). Troškovi u teoriji i praksi. II. Izdanje. Zagreb: Informator.
8. OECD-FAO Agricultural Outlook 2014-2023, 20th edition, (2014), OECD Publishing.
9. Polimeni, R. S., Handy, S. A., Cashin, J. A. (1999). Troškovno računovodstvo. Zagreb: Faber & Zgombić Plus.
10. Sugar Economy Europe 2013, (2013), Berlin: Bartens.
11. CEFS Sugar statistics 2013, Available at: http://www.comitesucre.org/ (Accessed on: January 12, 2015).
12. Over the edge? A first look at the 2014/2015 season, Available at: http://www.czarnikow.com/ (Accessed on: January 19, 2015)
13. AGRI C 4, Committee for the common organisation of agricultural markets, Sugar trade statistics, 29 January 2015, Available at: http://www.ec.europe.eu/ (Accessed on: February 24, 2015)
14. States Department of Agriculture, Economic Research Service, World production, supply, and distri-bution, centrifugal sugar, Available at: http://www.ers.usda.gov/data-products/sugar-and-sweeteners-yearbook-tables.aspx#25440/ (Accessed on: February 24, 2015)
God. XXVIII, BR. 1/2015. str. 111-127
UDK: 657.4:664.1(497.5) / Preliminary communication

126
(Endnotes)
1 Common Agricultural Policy – CAP.
2 Single Common Market Organisation for Sugar (CMO Sugar).
3 Stabilisation and Association Agreement, Official Gazette – International Treaties No. 14, 27 December 2001, which came into force on 1 February 2005.
4 According to the Croatian Chamber of Economy, Sector for Agriculture, Food Industry and Forestry, exports of the sugar industry in 2011 amounted to 185 million USD, or nearly 20% of total exports in this sector.
5 Joint Research Centre Institute for Prospective Technological Studies; EU sugar policy: A sweet transition after 2015?
6 OECD and FAO Secretariats; http://www.oecd.org/site/oecd-faoagriculturaloutlook/sugar.htm/(January, 2015).
7 According to: http://www.unicadata.com.br/ (January, 2015).
8 Ibid.
9 Brazilian sugarcane industry association.
10 Common Market Organization for Sugar.
11 European Sugar Sector, 2005., Mariann Fischer Boel, Commissioner for Agriculture and Rural Development.
12 9th Round of multilateral trade negotiations, launched in November 2001, in Doha, Quatar, at the WTO’s Fourth WTO Ministerial Conference.
13 Committee for the common organisation of agricultural markets.
14 During the WTO’s Uruguay Round, members agreed to a tariff rate quota (TRQ) system as the most appropriate method to ensure market access during the transition from an agricultural trading system of complex tariffs and nontariff barriers to a tariffonly regime.
15 The annual production quota for Croatia of 192,877 tons of white sugar derived from sugar beet should be added to the quotas shown in Table 6.
16 According to: http//www.kws.de/aw/KWS/serbia-montenegro/_e_erna_rfb/Bolesti_secerne_repe/~dcvn/ Cercospora_ Beticola/un-defined/ (January, 2015).
17 See endnote 1.
18 The cost structure in sugar beet production is such (a large proportion of the costs is incurred by plant protection materials, fertili-zers and machinery) that given the single economic area, there is not much variation in the prices of these inputs, and thus also not in sugar beet production costs at the EU-28 level.
God. XXVIII, BR. 1/2015. str. 111-127
Ilija Nedić: Break-even point in sugar-beet production

127
Ilija Nedić
Točka pokrića u proizvodnji šećerne repe
Sažetak
Potrošnja šećera u svijetu u zadnjih 70-ak godina bilježi stabilan rast koji će se po svim relevantnim procjenama nastaviti i u sljedećem desetljeću, a što svrstava šećer u kategoriju najznačajnijih prehrambenih i burzovnih roba na svijetu.
Od ukupne svjetske proizvodnje šećera oko 77% čini šećer proizveden iz šećerne trske, a 23% šećer proizve-den iz šećerne repe. Vodeće mjesto u svjetskoj proizvodnji šećera, već duže vrijeme drži Brazil s proizvod-njom bijeloga šećera proizvedenoga isključivo iz šećerne trske, dok među proizvođačima šećera iz šećerne repe, vodeće mjesto u svijetu drži EU-28.
Kako je domaća industrija šećera od ulaska Republike Hrvatske u EU dio jedinstvenoga europskoga tržišta šećera, u istraživanju se primjenom Metode točke pokrića utvrdila razina konkurentnosti domaće proiz-vodnje šećerne repe.
Na bazi očekivane prodajne cijene za šećernu repu od 34 EUR/t šećerne repe standardne kakvoće prim-jenom Metode točke pokrića, utvrđeno je da potrebna količina za pokriće ukupnih troškova u prozvodnji šećerne repe u Republici Hrvatskoj iznosi 55,26 tone/ha plative šećerne repe, standardne kakvoće, odnosno 8,84 tone polarizacijskog šećera po hektaru. S obzirom da prosječna proizvodnja šećerne repe u RH iska-zana u ekvivalentu polarizacijskoga šećera iznosi 7,8 t/ha jasno je da prosječni domaći proizvođač šećerne repe, bez prihoda od poticaja, ostvaruje gubitak u ovoj proizvodnji.
Ključne riječi: točka pokrića, šećer, repa, trska
God. XXVIII, BR. 1/2015. str. 111-127
UDK: 657.4:664.1(497.5) / Preliminary communication