substance abuse overview 2019 ocean county
TRANSCRIPT

New Jersey Drug and Alcohol Abuse Treatment
Substance Abuse Overview 2019
Ocean County
Department of Human Services Division of Mental Health and Addiction Services
Office of Planning, Research, Evaluation, Prevention and Olmstead Trenton, New Jersey
October 2020

DEPARTMENT OF HUMAN SERVICES
DIVISION OF MENTAL HEALTH AND ADDICTION SERVICES PO BOX 362
TRENTON, NJ 08625
October 2020
The statewide Substance Abuse Overview provides statistics on substance abuse treatment in
New Jersey for calendar year 2019. In 2019, there were 98,628 treatment admissions and
96,482 discharges reported to the New Jersey Department of Human Services, Division of
Mental Health and Addiction Services by substance abuse treatment providers. These data
were submitted through the web-based New Jersey Substance Abuse Monitoring System
(NJSAMS). This report is based on the information provided in the May 2020 NJSAMS
download data.
The Statewide Overview includes:
° State Totals for Substance Abuse Treatment Admissions
° Substance Abuse Admissions by County and Primary Drug
° Substance Abuse Admissions by Primary Drug within County
° Substance Abuse Admission Rates by County and Primary Drug
° Map for Number of Substance Abuse Admissions by County of Residence
° First Time Clients by County of Residence and Primary Drug
° Admissions by Age Group, Gender, and Primary Drug
° State Totals for Substance Abuse Treatment Discharges
° Length of Stay by Level of Care
° Waiting Time to Treatment Admission
° Detox Continuing Care Status Indicated at Discharge
° Detox Continuing Care by Actual Level of Care
° Time to First Readmission
° Substance Abuse Treatment Demand Estimate
Reports for individual counties can be found by clicking on the county names.
If you have any questions about this report, you may contact us by email at:
[email protected], Limei.Zhu@ dhs.nj.gov, Yohannes.Hailu@ dhs.nj.gov
Sincerely,
Suzanne Borys, Ed. D., Assistant Division Director
Office of Planning, Research, Evaluation, Prevention and Olmstead
Phil Murphy
Governor
Sheila Oliver
LT. Governor
Carole Johnson
Commissioner
Valerie L. Mielke
Assistant Commissioner

New Jersey Substance Abuse Monitoring System (NJ-SAMS)
CY2019 Substance Abuse Treatment Admissions Ocean County Residents Primary Drug** Highest School Grade Completed Alcohol 2,754 33% Completed High School 5,545 66% Heroin 3,679 44% Some College 1,484 18% Other Opiates 537 6% Cocaine 385 5% Employment Status Marijuana 702 8% Unemployed 1,631 19% Other Drugs 315 4% Student 110 1% Not in Labor Force 3,705 44% Intravenous Drug Users 3,342 40% Employed Full/Part Time 2,929 35% Smoke Tobacco (Yes)** 5,119 61% Living Arrangement Homeless 544 6% Level of Care Dependent Living/Institution 1,393 17% Outpatient Care (OP) 2,320 28% Independent Living 6,439 77% Intensive Outpatient (IOP) 1,982 24% Partial Hospitalization 203 2% Marital Status Opioid Maintenance OP 976 12% Single/Divorced 6,926 82% Opioid Maintenance IOP 56 1% Married/Civil Union 961 11% Extended Care 0 0% Widowed 161 2% Halfway House 147 2% Separated 348 4% Long-Term Residential 362 4% Short-Term Residential 1,063 13% Legal Problem* Hospital Based Residential 2 0% None 3,410 41% Detox Residential 1,101 13% Case Pending 1,282 15% Detox Hospital 3 0% Probation/Parole 1,886 22% Detox Outpatient Non-Methadone 167 2% DUI License Suspension 991 12% Detox Outpatient Methadone 0 0% Drug Court 557 7% Early Intervention 13 0% DCCP/Family Court 818 10% Interim Services*** 1 0% Other 209 2% Medication Assisted Therapy Planned in Treatment Arrest in the Last 30 Days (Yes) 545 6% Methadone 1,166 14% Suboxone 901 11% Special Population* Vivitrol 208 2% DCCP/CPSAI 1,036 12% DUI 2,035 24% Referral Source Developmental Disability 13 0% Self-referral 2,820 34% Blind and Visually Impaired 10 0% Family/Friend 201 2% Deaf and Hard of Hearing 14 0% Addiction Services Program 1,294 15% Workforce NJ SAI 141 2% Federal Poverty Level (0-133%)** 6,219 83% DCCP/CPSAI 564 7% Mental Health 303 4% Health Insurance* Criminal Justice 1,722 21% No Insurance 2,032 24% Interim Managing Entity (IME) 144 2% Medicaid 5,504 66% IDRC 703 8% Medicare 171 2% Other 648 8% Private Insurance 1,177 14% Other Insurance 84 1% Sex Male 5,275 63% Treated in County of Residence 5,066 60% Female 3,116 37% County Where Patient Was Treated Pregnant Women (Yes)** 107 1% Atlantic 755 9% Middlesex 81 1% Bergen 7 0% Monmouth 1,411 17% Age Burlington 214 3% Morris 17 0% Under 18 89 1% Camden 32 0% Ocean 5,066 60% 18-21 349 4% Cape May 0 0% Passaic 290 3% 22-24 498 6% Cumberland 34 0% Salem 15 0% 25-29 1,636 19% Essex 79 1% Somerset 46 1% 30-34 1,489 18% Gloucester 150 2% Sussex 20 0% 35-44 2,263 27% Hudson 111 1% Union 8 0% 45-54 1,304 16% Hunterdon 18 0% Warren 2 0% 55 and over 768 9% Mercer 40 0% Other 0 0% Race/Ethnicity Fee For Service Admissions 1,689 20% White (non-Hispanic) 7,271 87% Fee For Service Unique Clients 1,285 27% Black (non-Hispanic) 505 6% Hispanic Origin 565 7% Total Admissions = 8,396 Other 55 1% Unduplicated Clients Admitted = 4,821 *Totals may be greater than 100% because of multiple responses. **Percentage calculations excluded missing values. *** Interim Services started October 2019.

New Jersey Substance Abuse Monitoring System (NJ-SAMS)
CY2019 Substance Abuse Treatment Admissions Treatment Site in Ocean County Primary Drug** Highest School Grade Completed Alcohol 2,314 33% Completed High School 5,019 70% Heroin 3,119 44% Some College 1,189 17% Other Opiates 467 7% Cocaine 299 4% Employment Status Marijuana 673 9% Unemployed 1,281 18% Other Drugs 248 3% Student 86 1% Not in Labor Force 3,119 44% Intravenous Drug Users 2,602 36% Employed Full/Part Time 2,636 37% Smoke Tobacco (Yes)** 3,287 46% Living Arrangement Homeless 269 4% Level of Care Dependent Living/Institution 264 4% Outpatient Care (OP) 2,189 31% Independent Living 6,591 92% Intensive Outpatient (IOP) 2,426 34% Partial Hospitalization 215 3% Marital Status Opioid Maintenance OP 853 12% Single/Divorced 5,818 81% Opioid Maintenance IOP 49 1% Married/Civil Union 870 12% Extended Care 0 0% Widowed 141 2% Halfway House 0 0% Separated 317 4% Long-Term Residential 1 0% Short-Term Residential 577 8% Legal Problem* Hospital Based Residential 0 0% None 3,411 48% Detox Residential 3 0% Case Pending 731 10% Detox Hospital 4 0% Probation/Parole 1,457 20% Detox Outpatient Non-Methadone 815 11% DUI License Suspension 851 12% Detox Outpatient Methadone 1 0% Drug Court 384 5% Early Intervention 13 0% DCCP/Family Court 681 10% Interim Services*** 0 0% Other 139 2% Medication Assisted Therapy Planned in Treatment Arrest in the Last 30 Days (Yes) 378 5% Methadone 1,017 14% Suboxone 505 7% Special Population* Vivitrol 135 2% DCCP/CPSAI 821 11% DUI 1,447 20% Referral Source Developmental Disability 10 0% Self-referral 2,347 33% Blind and Visually Impaired 7 0% Family/Friend 142 2% Deaf and Hard of Hearing 12 0% Addiction Services Program 369 5% Workforce NJ SAI 108 2% Federal Poverty Level (0-133%)** 5,275 84% DCPP/CPSAI 553 8% Mental Health 278 4% Health Insurance* Criminal Justice 1,400 20% No Insurance 1,542 22% IDRC 668 9% Medicaid 4,716 66% Interim Managing Entity (IME) 8 0% Medicare 136 2% Other 1,281 18% Private Insurance 1,129 16% Other Insurance 69 1% Sex Male 4,574 64% Treated in County of Residence 5,066 71% Female 2,569 36% County of Residence Pregnant Women (Yes)** 85 1% Atlantic 390 5% Middlesex 174 2% Bergen 57 1% Monmouth 505 7% Age Burlington 121 2% Morris 32 0% Under 18 72 1% Camden 129 2% Ocean 5,066 71% 18-21 280 4% Cape May 41 1% Passaic 41 1% 22-24 425 6% Cumberland 43 1% Salem 12 0% 25-29 1,341 19% Essex 126 2% Somerset 59 1% 30-34 1,283 18% Gloucester 106 1% Sussex 4 0% 35-44 1,858 26% Hudson 58 1% Union 65 1% 45-54 1,190 17% Hunterdon 13 0% Warren 8 0% 55 and over 697 10% Mercer 73 1% Other 0 0% Race/Ethnicity Fee For Service Admissions 1,025 14% White (non-Hispanic) 5,761 81% Fee For Service Unique Client 859 18% Black (non-Hispanic) 729 10% Hispanic Origin 603 8% Total Admissions = 7,146 Other 53 1% Unduplicated Clients Admitted = 4,849 *Totals may be greater than 100% because of multiple responses. **Percentage calculation excluded missing values. *** Interim Services started October 2019.
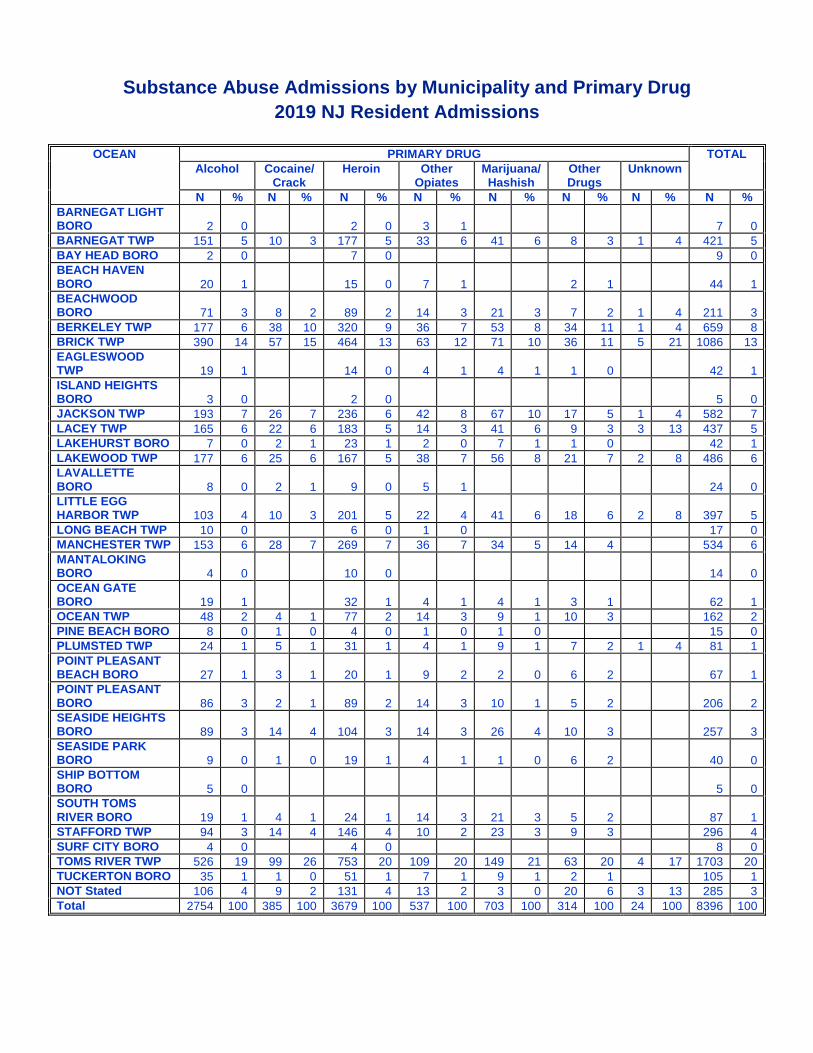
Substance Abuse Admissions by Municipality and Primary Drug 2019 NJ Resident Admissions
OCEAN PRIMARY DRUG TOTAL
Alcohol Cocaine/ Crack
Heroin Other Opiates
Marijuana/ Hashish
Other Drugs
Unknown
N % N % N % N % N % N % N % N % BARNEGAT LIGHT BORO 2 0 2 0 3 1 7 0 BARNEGAT TWP 151 5 10 3 177 5 33 6 41 6 8 3 1 4 421 5 BAY HEAD BORO 2 0 7 0 9 0 BEACH HAVEN BORO 20 1 15 0 7 1 2 1 44 1 BEACHWOOD BORO 71 3 8 2 89 2 14 3 21 3 7 2 1 4 211 3 BERKELEY TWP 177 6 38 10 320 9 36 7 53 8 34 11 1 4 659 8 BRICK TWP 390 14 57 15 464 13 63 12 71 10 36 11 5 21 1086 13 EAGLESWOOD TWP 19 1 14 0 4 1 4 1 1 0 42 1 ISLAND HEIGHTS BORO 3 0 2 0 5 0 JACKSON TWP 193 7 26 7 236 6 42 8 67 10 17 5 1 4 582 7 LACEY TWP 165 6 22 6 183 5 14 3 41 6 9 3 3 13 437 5 LAKEHURST BORO 7 0 2 1 23 1 2 0 7 1 1 0 42 1 LAKEWOOD TWP 177 6 25 6 167 5 38 7 56 8 21 7 2 8 486 6 LAVALLETTE BORO 8 0 2 1 9 0 5 1 24 0 LITTLE EGG HARBOR TWP 103 4 10 3 201 5 22 4 41 6 18 6 2 8 397 5 LONG BEACH TWP 10 0 6 0 1 0 17 0 MANCHESTER TWP 153 6 28 7 269 7 36 7 34 5 14 4 534 6 MANTALOKING BORO 4 0 10 0 14 0 OCEAN GATE BORO 19 1 32 1 4 1 4 1 3 1 62 1 OCEAN TWP 48 2 4 1 77 2 14 3 9 1 10 3 162 2 PINE BEACH BORO 8 0 1 0 4 0 1 0 1 0 15 0 PLUMSTED TWP 24 1 5 1 31 1 4 1 9 1 7 2 1 4 81 1 POINT PLEASANT BEACH BORO 27 1 3 1 20 1 9 2 2 0 6 2 67 1 POINT PLEASANT BORO 86 3 2 1 89 2 14 3 10 1 5 2 206 2 SEASIDE HEIGHTS BORO 89 3 14 4 104 3 14 3 26 4 10 3 257 3 SEASIDE PARK BORO 9 0 1 0 19 1 4 1 1 0 6 2 40 0 SHIP BOTTOM BORO 5 0 5 0 SOUTH TOMS RIVER BORO 19 1 4 1 24 1 14 3 21 3 5 2 87 1 STAFFORD TWP 94 3 14 4 146 4 10 2 23 3 9 3 296 4 SURF CITY BORO 4 0 4 0 8 0 TOMS RIVER TWP 526 19 99 26 753 20 109 20 149 21 63 20 4 17 1703 20 TUCKERTON BORO 35 1 1 0 51 1 7 1 9 1 2 1 105 1 NOT Stated 106 4 9 2 131 4 13 2 3 0 20 6 3 13 285 3 Total 2754 100 385 100 3679 100 537 100 703 100 314 100 24 100 8396 100

Substance Abuse Admissions by Primary Drug within Municipality 2018 NJ Resident Admissions
OCEAN PRIMARY DRUG TOTAL
Alcohol Cocaine/ Crack
Heroin Other Opiates
Marijuana/ Hashish
Other Drugs
Unknown
N % N % N % N % N % N % N % N % BARNEGAT LIGHT BORO
3 75 1 25 4 100
BARNEGAT TWP 127 31 16 4 175 43 36 9 41 10 12 3 407 100 BAY HEAD BORO 2 40 3 60 5 100 BEACH HAVEN BORO
7 41 4 24 4 24 2 12 17 100
BEACHWOOD BORO
48 24 18 9 105 51 6 3 18 9 9 4 204 100
BERKELEY TWP 140 24 33 6 310 54 42 7 38 7 9 2 1 0 573 100 BRICK TWP 294 31 49 5 442 46 89 9 65 7 19 2 1 0 959 100 EAGLESWOOD TWP 9 24 1 3 19 51 3 8 3 8 2 5 37 100 ISLAND HEIGHTS BORO
9 53 2 12 5 29 1 6 17 100
JACKSON TWP 147 28 22 4 213 41 45 9 68 13 20 4 2 0 517 100 LACEY TWP 116 27 18 4 211 49 32 7 39 9 16 4 2 0 434 100 LAKEHURST BORO 6 12 4 8 32 62 4 8 3 6 3 6 52 100 LAKEWOOD TWP 139 32 21 5 157 37 21 5 83 19 7 2 1 0 429 100 LAVALLETTE BORO 5 23 2 9 10 45 1 5 3 14 1 5 22 100 LITTLE EGG HARBOR TWP
101 26 6 2 204 52 23 6 48 12 11 3 1 0 394 100
LONG BEACH TWP 6 40 1 7 6 40 1 7 1 7 15 100 MANCHESTER TWP 126 26 28 6 244 51 32 7 40 8 9 2 1 0 480 100 MANTALOKING BORO
1 100 1 100
OCEAN GATE BORO
12 23 31 58 5 9 3 6 2 4 53 100
OCEAN TWP 44 26 11 6 86 50 10 6 14 8 5 3 1 1 171 100 PINE BEACH BORO 10 48 9 43 2 10 21 100 PLUMSTED TWP 20 48 2 5 13 31 2 5 2 5 3 7 42 100 POINT PLEASANT BEACH BORO
29 37 7 9 32 41 7 9 2 3 1 1 78 100
POINT PLEASANT BORO
88 46 2 1 76 40 11 6 11 6 2 1 190 100
SEASIDE HEIGHTS BORO
46 24 12 6 90 46 14 7 31 16 1 1 194 100
SEASIDE PARK BORO
3 12 1 4 14 54 2 8 4 15 1 4 1 4 26 100
SHIP BOTTOM BORO
4 31 2 15 4 31 1 8 2 15 13 100
SOUTH TOMS RIVER BORO
13 15 7 8 40 47 7 8 15 18 2 2 1 1 85 100
STAFFORD TWP 68 22 19 6 157 51 23 8 27 9 10 3 2 1 306 100 SURF CITY BORO 4 44 3 33 1 11 1 11 9 100 TOMS RIVER TWP 405 25 86 5 758 47 150 9 155 10 66 4 1620 100 TUCKERTON BORO 14 15 2 2 61 65 3 3 10 11 4 4 94 100 UNKNOWN 1 100 1 100 NOT Stated 74 36 1 0 106 52 13 6 6 3 5 2 205 100 Total 2120 28 373 5 3620 47 589 8 735 10 224 3 14 0 7675 100

Substance Abuse Admissions by Primary Drug within Municipality 2019 NJ Resident Admissions
OCEAN PRIMARY DRUG TOTAL
Alcohol Cocaine/ Crack
Heroin Other Opiates
Marijuana/ Hashish
Other Drugs
Unknown
N % N % N % N % N % N % N % N % BARNEGAT LIGHT BORO
2 29 2 29 3 43 7 100
BARNEGAT TWP 151 36 10 2 177 42 33 8 41 10 8 2 1 0 421 100 BAY HEAD BORO 2 22 7 78 9 100 BEACH HAVEN BORO
20 45 15 34 7 16 2 5 44 100
BEACHWOOD BORO
71 34 8 4 89 42 14 7 21 10 7 3 1 0 211 100
BERKELEY TWP 177 27 38 6 320 49 36 5 53 8 34 5 1 0 659 100 BRICK TWP 390 36 57 5 464 43 63 6 71 7 36 3 5 0 1086 100 EAGLESWOOD TWP 19 45 14 33 4 10 4 10 1 2 42 100 ISLAND HEIGHTS BORO
3 60 2 40 5 100
JACKSON TWP 193 33 26 4 236 41 42 7 67 12 17 3 1 0 582 100 LACEY TWP 165 38 22 5 183 42 14 3 41 9 9 2 3 1 437 100 LAKEHURST BORO 7 17 2 5 23 55 2 5 7 17 1 2 42 100 LAKEWOOD TWP 177 36 25 5 167 34 38 8 56 12 21 4 2 0 486 100 LAVALLETTE BORO 8 33 2 8 9 38 5 21 24 100 LITTLE EGG HARBOR TWP
103 26 10 3 201 51 22 6 41 10 18 5 2 1 397 100
LONG BEACH TWP 10 59 6 35 1 6 17 100 MANCHESTER TWP 153 29 28 5 269 50 36 7 34 6 14 3 534 100 MANTALOKING BORO
4 29 10 71 14 100
OCEAN GATE BORO
19 31 32 52 4 6 4 6 3 5 62 100
OCEAN TWP 48 30 4 2 77 48 14 9 9 6 10 6 162 100 PINE BEACH BORO 8 53 1 7 4 27 1 7 1 7 15 100 PLUMSTED TWP 24 30 5 6 31 38 4 5 9 11 7 9 1 1 81 100 POINT PLEASANT BEACH BORO
27 40 3 4 20 30 9 13 2 3 6 9 67 100
POINT PLEASANT BORO
86 42 2 1 89 43 14 7 10 5 5 2 206 100
SEASIDE HEIGHTS BORO
89 35 14 5 104 40 14 5 26 10 10 4 257 100
SEASIDE PARK BORO
9 23 1 3 19 48 4 10 1 3 6 15 40 100
SHIP BOTTOM BORO
5 100 5 100
SOUTH TOMS RIVER BORO
19 22 4 5 24 28 14 16 21 24 5 6 87 100
STAFFORD TWP 94 32 14 5 146 49 10 3 23 8 9 3 296 100 SURF CITY BORO 4 50 4 50 8 100 TOMS RIVER TWP 526 31 99 6 753 44 109 6 149 9 63 4 4 0 1703 100 TUCKERTON BORO 35 33 1 1 51 49 7 7 9 9 2 2 105 100 NOT Stated 106 37 9 3 131 46 13 5 3 1 20 7 3 1 285 100 Total 2754 33 385 5 3679 44 537 6 703 8 314 4 24 0 8396 100

Jackson Township
Manchester Township
Berkeley Township
Toms River Township
Brick Township
Lakewood Township
2019 Ocean County Substance Abuse Admissions by Municipality of Residence
Admission Counts0 - 105106 - 296297 - 659660 - 1703
Data: NJSAMS 2020 June DownloadReport Date: October 2020
NJ Department of Human Services Division of Mental Health and Addiction Services Planning,Research, Evaluation, Prevention and Olmstead Office¹
0 2 4 61Miles
1 Toms River Township 17032 Brick Township 10863 Berkeley Township 6594 Jackson Township 5825 Manchester Township 534
Top Five Municipalities

Admissions by Municipality of Residence, Age Group and Primary Drug 2019 NJ Resident Admissions
OCEAN ALCOHOL DRUGS TOTAL 18 & Over
Under 18
Total 18 & Over
Under 18
Total 18 & Over
Under 18
Total
N % N % N % N % N % N % N % N % N % BARNEGAT LIGHT BORO
2 100 2 100 5 100 5 100 7 100 7 100
BARNEGAT TWP 151 100 151 100 267 99 2 1 269 100 418 100 2 0 420 100 BAY HEAD BORO 2 100 2 100 7 100 7 100 9 100 9 100 BEACH HAVEN BORO
20 100 20 100 24 100 24 100 44 100 44 100
BEACHWOOD BORO 71 100 71 100 136 98 3 2 139 100 207 99 3 1 210 100 BERKELEY TWP 177 100 177 100 474 99 7 1 481 100 651 99 7 1 658 100 BRICK TWP 389 100 1 0 390 100 681 99 10 1 691 100 1070 99 11 1 1081 100 EAGLESWOOD TWP 19 100 19 100 23 100 23 100 42 100 42 100 ISLAND HEIGHTS BORO
3 100 3 100 2 100 2 100 5 100 5 100
JACKSON TWP 193 100 193 100 372 96 16 4 388 100 565 97 16 3 581 100 LACEY TWP 164 99 1 1 165 100 266 99 3 1 269 100 430 99 4 1 434 100 LAKEHURST BORO 7 100 7 100 35 100 35 100 42 100 42 100 LAKEWOOD TWP 177 100 177 100 302 98 5 2 307 100 479 99 5 1 484 100 LAVALLETTE BORO 8 100 8 100 16 100 16 100 24 100 24 100 LITTLE EGG HARBOR TWP
103 100 103 100 286 98 6 2 292 100 389 98 6 2 395 100
LONG BEACH TWP 10 100 10 100 7 100 7 100 17 100 17 100 MANCHESTER TWP 153 100 153 100 378 99 3 1 381 100 531 99 3 1 534 100 MANTALOKING BORO
4 100 4 100 10 100 10 100 14 100 14 100
OCEAN GATE BORO 19 100 19 100 43 100 43 100 62 100 62 100 OCEAN TWP 48 100 48 100 114 100 114 100 162 100 162 100 PINE BEACH BORO 8 100 8 100 7 100 7 100 15 100 15 100 PLUMSTED TWP 24 100 24 100 56 100 56 100 80 100 80 100 POINT PLEASANT BEACH BORO
27 100 27 100 40 100 40 100 67 100 67 100
POINT PLEASANT BORO
86 100 86 100 117 98 3 3 120 100 203 99 3 1 206 100
SEASIDE HEIGHTS BORO
89 100 89 100 168 100 168 100 257 100 257 100
SEASIDE PARK BORO
9 100 9 100 31 100 31 100 40 100 40 100
SHIP BOTTOM BORO 5 100 5 100 5 100 5 100 SOUTH TOMS RIVER BORO
19 100 19 100 65 96 3 4 68 100 84 97 3 3 87 100
STAFFORD TWP 93 99 1 1 94 100 197 98 5 2 202 100 290 98 6 2 296 100 SURF CITY BORO 4 100 4 100 4 100 4 100 8 100 8 100 TOMS RIVER TWP 526 100 526 100 1155 98 18 2 1173 100 1681 99 18 1 1699 100 TUCKERTON BORO 35 100 35 100 69 99 1 1 70 100 104 99 1 1 105 100 NOT Stated 106 100 106 100 176 100 176 100 282 100 282 100 Total* 2751 100 3 0 2754 100 5533 98 85 2 5618 100 8284 99 88 1 8372 100
* Missing primary drug or age admissions are not included.

Admissions by Age Group, Gender and Primary Drug 2019 NJ Resident Admissions
OCEAN GENDER TOTAL Female Male
N % N % N % 0-17 Alcohol 1 33 2 67 3 100
Heroin
1 100 1 100 Marijuana/Hashish 13 16 68 84 81 100 Other Drugs 1 33 2 67 3 100 Unknown
1 100 1 100
Total 15 17 74 83 89 100 18-24 Alcohol 61 34 117 66 178 100
Heroin 172 52 158 48 330 100 Other Opiates 19 40 29 60 48 100 Marijuana/Hashish 67 33 136 67 203 100 Other Drugs 33 39 51 61 84 100 Unknown 1 33 2 67 3 100 Total 353 42 493 58 846 100
25-59 Alcohol 855 36 1497 64 2352 100 Heroin 1209 37 2101 63 3310 100 Other Opiates 210 44 270 56 480 100 Marijuana/Hashish 138 33 274 67 412 100 Other Drugs 227 38 372 62 599 100 Unknown 2 13 14 88 16 100 Total 2641 37 4528 63 7169 100
60&Over Alcohol 87 40 132 60 219 100 Heroin 6 17 30 83 36 100 Other Opiates 3 33 6 67 9 100 Marijuana/Hashish 1 17 5 83 6 100 Other Drugs 8 62 5 38 13 100 Unknown 2 50 2 50 4 100 Total 107 37 180 63 287 100
Total* Alcohol 1004 36 1748 64 2752 100 Heroin 1387 38 2290 62 3677 100 Other Opiates 232 43 305 57 537 100 Marijuana/Hashish 219 31 483 69 702 100 Other Drugs 269 38 430 62 699 100 Unknown 5 21 19 79 24 100 Total 3116 37 5275 63 8391 100
* Unknown age or gender admissions are not included.


New Jersey Substance Abuse Monitoring System (NJ-SAMS)
CY2019 Substance Abuse Treatment Discharges Ocean County Resident Level of Care Living Arragements Outpatient Care (OP) 2,189 27% Homeless 185 2% Intensive Outpatient (IOP) 2,017 25% Dependent Living/Institution 1,459 18% Partial Hospitalization 235 3% Independent Living 6,278 77% Opioid Maintenance OP 825 10% Opioid Maintenance IOP 57 1% Employment Status Extended Care 0 0% Unemployed 1,515 19% Halfway House 133 2% Student 86 1% Long-Term Residential 374 5% Not in Labor Force 3,166 39% Short-Term Residential 1,019 13% Employed Full/Part Time 3,155 39% Hospital Based Residential 2 0% Detox Residential 1,114 14% Reasons for Discharge or Treatment not Completed Detox Hospital 3 0% Treatment Plan Completed 4,465 55% Detox Outpatient Non-Methadone 166 2% Quit or Dropped Out 2,053 25% Detox Outpatient Methadone 1 0% Needs Different Level of Care 496 6% Non-Traditional Program 1 0% Unable to Meet Client's Other Needs 19 0% Early Intervention 8 0% Administrative Discharge 207 3% Interim Services*** 0 0% Exhaustion of Payment Source 41 1% Incarcerated 124 2% Sex Medical Discharge/Deceased 78 1% Male 5,123 63% Other 327 4% Female 3,016 37% Continuing Care Age No Continuing Care Needed 1,701 21% Under 18 66 1% Refused or Unable to Continue 1,300 16% 18-21 351 4% Continue Care 2,587 32% 22-24 472 6% Not Assessed 2,556 31% 25-29 1,592 20% 30-34 1,502 18% Significant Problems or Conditions 35-44 2,165 27% Mental Health Problem 2,664 33% 45-54 1,256 15% Compulsive Gambling 17 0% 55 and over 740 9% Physical Disability or Handicap 80 1% Victim of Physical Abuse or Neglect 358 4% Victim of Sexual Abuse 258 3% Race/Ethnicity Pregnancy 65 1% White 7,090 87% Suicide Attempt 200 2% Black 474 6% Runaway Behavior 77 1% Hispanic 526 6% Neglect or Abuse of Own Children 208 3% Other 54 1% Child of Substance Abuser 280 3% Batterer 13 0% Criminal Activity 1,235 15% Mental Illness/Co-Occurring Disorder Other 248 3% 5,956 73% Arrested in the Last 30 days (Yes) 318 4% Client Goal Achieved/Partially Achieved * Alcohol or Drug Problem 5,039 65% County Where Patient Was Treated Educational 2,044 68% Atlantic 757 9% Middlesex 84 1% Employment or Vocational 2,441 64% Bergen 6 0% Monmouth 1,378 17% Family Situation 3,411 67% Burlington 217 3% Morris 17 0% Psychological or Mental Health 3,625 67% Camden 36 0% Ocean 4,815 59% Physical Health 3,101 70% Cape May 0 0% Passaic 288 4% Legal 2,757 62% Cumberland 35 0% Salem 9 0% Essex 90 1% Somerset 44 1% Drug and Alcohol Use Gloucester 147 2% Sussex 20 0% Not Using Alcohol or Drugs 5,134 63% Hudson 115 1% Union 7 0% Using Alcohol 263 3% Hunterdon 15 0% Warren 3 0% Using Drugs 1,037 13% Mercer 52 1% Other 0 0% Unknown 1,606 20% Total Discharges = 8,144 Smoke Tobacco (Yes)** 4,567 58% Unduplicated Clients Discharged = 4,698 * Totals may be greater than 100% because of multiple responses. Percentage for goal achievement based on total clients for whom goal was applicable. All other percentages are based on total discharges. **Percentage calculation excluded missing values. ***Interim Services started October 2019.
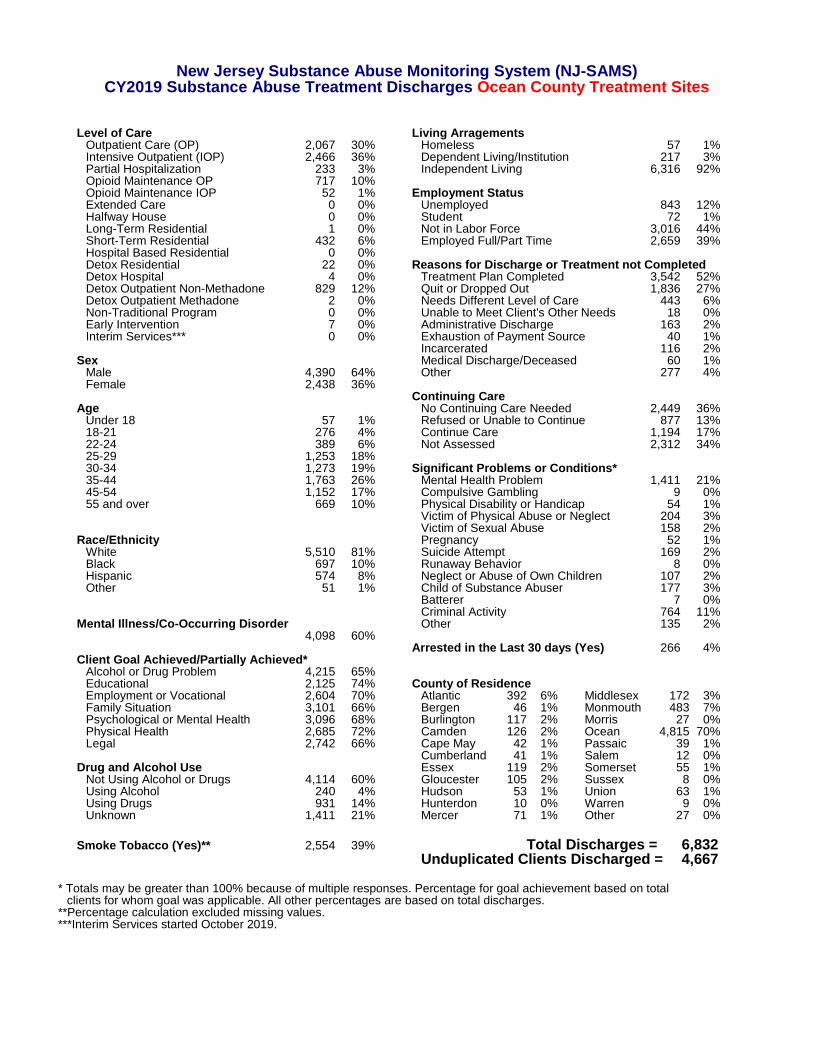
New Jersey Substance Abuse Monitoring System (NJ-SAMS)
CY2019 Substance Abuse Treatment Discharges Ocean County Treatment Sites Level of Care Living Arragements Outpatient Care (OP) 2,067 30% Homeless 57 1% Intensive Outpatient (IOP) 2,466 36% Dependent Living/Institution 217 3% Partial Hospitalization 233 3% Independent Living 6,316 92% Opioid Maintenance OP 717 10% Opioid Maintenance IOP 52 1% Employment Status Extended Care 0 0% Unemployed 843 12% Halfway House 0 0% Student 72 1% Long-Term Residential 1 0% Not in Labor Force 3,016 44% Short-Term Residential 432 6% Employed Full/Part Time 2,659 39% Hospital Based Residential 0 0% Detox Residential 22 0% Reasons for Discharge or Treatment not Completed Detox Hospital 4 0% Treatment Plan Completed 3,542 52% Detox Outpatient Non-Methadone 829 12% Quit or Dropped Out 1,836 27% Detox Outpatient Methadone 2 0% Needs Different Level of Care 443 6% Non-Traditional Program 0 0% Unable to Meet Client's Other Needs 18 0% Early Intervention 7 0% Administrative Discharge 163 2% Interim Services*** 0 0% Exhaustion of Payment Source 40 1% Incarcerated 116 2% Sex Medical Discharge/Deceased 60 1% Male 4,390 64% Other 277 4% Female 2,438 36% Continuing Care Age No Continuing Care Needed 2,449 36% Under 18 57 1% Refused or Unable to Continue 877 13% 18-21 276 4% Continue Care 1,194 17% 22-24 389 6% Not Assessed 2,312 34% 25-29 1,253 18% 30-34 1,273 19% Significant Problems or Conditions* 35-44 1,763 26% Mental Health Problem 1,411 21% 45-54 1,152 17% Compulsive Gambling 9 0% 55 and over 669 10% Physical Disability or Handicap 54 1% Victim of Physical Abuse or Neglect 204 3% Victim of Sexual Abuse 158 2% Race/Ethnicity Pregnancy 52 1% White 5,510 81% Suicide Attempt 169 2% Black 697 10% Runaway Behavior 8 0% Hispanic 574 8% Neglect or Abuse of Own Children 107 2% Other 51 1% Child of Substance Abuser 177 3% Batterer 7 0% Criminal Activity 764 11% Mental Illness/Co-Occurring Disorder Other 135 2% 4,098 60% Arrested in the Last 30 days (Yes) 266 4% Client Goal Achieved/Partially Achieved* Alcohol or Drug Problem 4,215 65% Educational 2,125 74% County of Residence Employment or Vocational 2,604 70% Atlantic 392 6% Middlesex 172 3% Family Situation 3,101 66% Bergen 46 1% Monmouth 483 7% Psychological or Mental Health 3,096 68% Burlington 117 2% Morris 27 0% Physical Health 2,685 72% Camden 126 2% Ocean 4,815 70% Legal 2,742 66% Cape May 42 1% Passaic 39 1% Cumberland 41 1% Salem 12 0% Drug and Alcohol Use Essex 119 2% Somerset 55 1% Not Using Alcohol or Drugs 4,114 60% Gloucester 105 2% Sussex 8 0% Using Alcohol 240 4% Hudson 53 1% Union 63 1% Using Drugs 931 14% Hunterdon 10 0% Warren 9 0% Unknown 1,411 21% Mercer 71 1% Other 27 0% Smoke Tobacco (Yes)** 2,554 39% Total Discharges = 6,832 Unduplicated Clients Discharged = 4,667 * Totals may be greater than 100% because of multiple responses. Percentage for goal achievement based on total clients for whom goal was applicable. All other percentages are based on total discharges. **Percentage calculation excluded missing values. ***Interim Services started October 2019.