submitted by vishwa vignan reddy beesam b. tech., …
TRANSCRIPT

RELATIONSHIP BETWEEN COLLAPSE PROBABILITY AND COLLAPSE RISK OF NEW
BUILDINGS
SUBMITTED BY
VISHWA VIGNAN REDDY BEESAM
B. Tech., SASTRA University, 2012
A thesis submitted to the Faculty of the Graduate School of University of Colorado in partial
fulfillment of the requirement for the degree of Master of Science
Department of Civil, Environmental and Architectural Engineering
2014
This thesis entitled:
Relationship Between Collapse Probability and Collapse Risk of New Buildings
written by Vishwa Vignan Reddy Beesam
has been approved for the Department of Civil, Environmental and Architectural Engineering
______________________
Professor Keith Porter
______________________
Professor Abbie Liel
______________________
Professor Ross Corotis
Date: / /2014
The final copy of this thesis has been examined by the signatories and we find that both the
content and the form meet acceptable presentation standards of scholarly work in the above
mentioned discipline
III
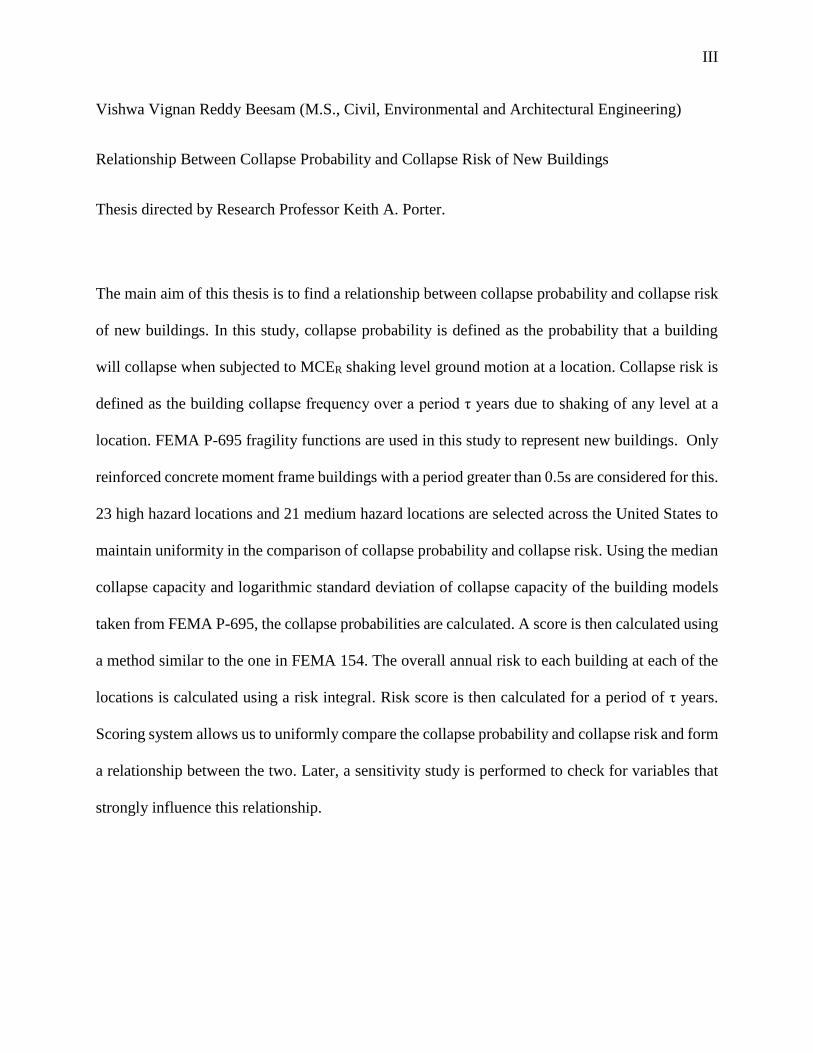
Vishwa Vignan Reddy Beesam (M.S., Civil, Environmental and Architectural Engineering)
Relationship Between Collapse Probability and Collapse Risk of New Buildings
Thesis directed by Research Professor Keith A. Porter.
The main aim of this thesis is to find a relationship between collapse probability and collapse risk
of new buildings. In this study, collapse probability is defined as the probability that a building
will collapse when subjected to MCER shaking level ground motion at a location. Collapse risk is
defined as the building collapse frequency over a period τ years due to shaking of any level at a
location. FEMA P-695 fragility functions are used in this study to represent new buildings. Only
reinforced concrete moment frame buildings with a period greater than 0.5s are considered for this.
23 high hazard locations and 21 medium hazard locations are selected across the United States to
maintain uniformity in the comparison of collapse probability and collapse risk. Using the median
collapse capacity and logarithmic standard deviation of collapse capacity of the building models
taken from FEMA P-695, the collapse probabilities are calculated. A score is then calculated using
a method similar to the one in FEMA 154. The overall annual risk to each building at each of the
locations is calculated using a risk integral. Risk score is then calculated for a period of τ years.
Scoring system allows us to uniformly compare the collapse probability and collapse risk and form
a relationship between the two. Later, a sensitivity study is performed to check for variables that
strongly influence this relationship.
IV
CONTENTS
1. Introduction ............................................................................................................................. 1
Purpose of this Study................................................................................................................... 1
ASCE 7-05: Minimum Design Loads for Buildings and Other Structures ................................. 3
ASCE 7-10: Minimum Design Loads for Buildings and Other Structures ................................. 4
2. Literature Review........................................................................................................................ 6
Luco, N. et al. (2007) - Risk-Targeted versus Current Seismic Design Maps for the
Conterminous United States ........................................................................................................ 6
Bretl (2014) - Relationship Between the Collapse Fragility and Collapse Risk in Existing
Buildings in Regions of High and Moderate Seismicity ............................................................. 7
FEMA P-695 - Quantification of Building Seismic Performance Factors ................................. 7
FEMA 154 – Rapid Visual Screening of Buildings for Potential Seismic Hazards ................... 8
United States Geological Survey (USGS) Hazard Curves (2008) .............................................. 9
3. Data collection .......................................................................................................................... 11
Locations ................................................................................................................................... 11
Building Fragility Functions ..................................................................................................... 14
4. Procedure .................................................................................................................................. 18
Calculation of Collapse Probability .......................................................................................... 18
Calculation of Score .................................................................................................................. 19
Where, ....................................................................................................................................... 19
Hazard Curves ........................................................................................................................... 19
Calculation of Collapse Risk ..................................................................................................... 21
Calculation of Risk Score .......................................................................................................... 22
Comparison of Score and Risk Score ........................................................................................ 23
5. Results & Discussion ................................................................................................................ 24
Vs30 and Site Soil Classification ................................................................................................ 24
Risk-Targeted Spectral Response Acceleration ........................................................................ 25
PMFR Values of High Hazard Locations .................................................................................. 36
PMFR Values of Medium Hazard Locations ............................................................................. 45
6. Deterministic Sensitivity Study ................................................................................................ 46

V
7. Conclusions ............................................................................................................................... 51
References ..................................................................................................................................... 53

VI
TABLES
Table
Table 1: Classification of locations as high or medium hazard (taken from FEMA P155).......... 11
Table 2 : High hazard locations .................................................................................................... 12
Table 3 : Medium hazard locations ............................................................................................... 13
Table 4 : Calculation of βTOT given βRTR = 0.4 and βMDL = (A) Superior ..................................... 16
Table 5 : Fragility functions of buildings from FEMA P-695 ...................................................... 17
Table 7 : Vs30 and site soil classes for high hazard locations ........................................................ 24
Table 8 : Vs30 and site soil classes for medium hazard locations .................................................. 25
Table 9 : SM1 values at MCER intensity level for high hazard locations ...................................... 26
Table 10 : SM1 values at MCER intensity level for medium hazard locations .............................. 27
Table 11 : Collapse probabilities conditioned on MCER SMT shaking at high hazard locations .. 29
Table 12 : Score calculated using collapse probabilities at high hazard locations ....................... 30
Table 13 : Annual collapse risk calculated using hazard curves at high hazard locations ........... 31
Table 14 : Risk score calculated for 50 year period using collapse risk, at high hazard locations32
Table 15 : Risk score calculated for 150 year period using collapse risk, at high hazard locations
....................................................................................................................................................... 33
Table 16 : PMFR values (τ = 50 years) at high hazard locations .................................................. 34
Table 17 : PMFR values (τ = 150 years) at high hazard locations ................................................ 35
Table 18 : Collapse probabilities conditioned on MCER SMT shaking at medium hazard locations
....................................................................................................................................................... 38
Table 19 : Score calculated using collapse probabilities at medium hazard locations ................. 39
Table 20 : Annual collapse risk calculated using hazard curves at medium hazard locations ..... 40

VII
Table 21 : Risk score calculated for 50 year period using collapse risk, at medium hazard
locations ........................................................................................................................................ 41
Table 22 : Risk score calculated for 150 year period using collapse risk, at medium hazard
locations ........................................................................................................................................ 42
Table 23 : PMFR values (τ = 50 years) at medium hazard locations ........................................... 43
Table 24 : PMFR values (τ = 150 years) at medium hazard locations ......................................... 44
Table 25 : Deterministic sensitivity study for high hazard locations - PMFR and swing values .. 49

VIII
FIGURES
Figure
Figure 1: High hazard and medium hazard locations on a map (excluding locations in Alaska) . 14
Figure 3: Pictorial representation of a fragility function (Porter, K.A. (2014)) ............................ 18
Figure 4: Hazard curves for selected high hazard sites (1Hz) ...................................................... 20
Figure 5: Hazard curves for selected moderate hazard sites (1Hz) .............................................. 21
Figure 6: Linear approximation of hazard curve (sample representation) .................................... 47
Figure 7: Tornado diagram for high hazard locations .................................................................. 49

1
1. Introduction
Purpose of this Study
In the 2nd edition (current version) of FEMA 154, the probability that a building will
collapse at a location when subjected to the MCE shaking level ground motion at that location is
used to rapidly screen buildings for potential seismic hazard. For the next update of FEMA 154,
we plan to propose frequency of building collapse over a period τ years at a location due to shaking
of any level, here by referred to as collapse risk, also as a measure to rapidly evaluate the seismic
hazard to buildings. This would help the audience (building officials and inspectors, government
agencies, design professionals etc.) to quantify seismic hazard in terms of both collapse probability
and collapse risk where collapse probability is defined as the probability that a building will
collapse when subjected to MCE (or) MCER shaking level ground motion. Luco et al. (2007), in
their study titled “Risk-Targeted versus Current Seismic Design Maps for the Conterminous
United States”, calculated risk-targeted mapped MCE ground motions (mapped MCER ground
motions) for code-compliant buildings by adjusting the mapped MCE ground motions such that
the collapse risk at a location is 1% in 50 years. FEMA P-695 is a code which recommends a
methodology to reliably quantify building seismic performance and response parameters for use
in seismic design. For this methodology, FEMA P-695 used code-compliant buildings such that
the average probability of collapse due to MCE shaking level ground motions is less than 10%.
Hence from Luco et. al.(2007) and FEMA P-695 study, we can see that collapse risk (for a 50 year
period) is 0.1 times the collapse probability (due to MCE shaking level ground motions) for code-
compliant buildings. Bretl (2014), in his study titled “Relationship Between the Collapse Fragility
and Collapse Risk in Existing Buildings in Regions of High and Moderate Seismicity”, checked if

2
there is a similar relation for existing buildings. He arrived at a different relationship between
collapse probability (due to MCE and MCER shaking level ground motions) and collapse risk (for
a 150 year period) for existing buildings in high hazard regions. The main purpose of this study is
to see if a similar relationship as developed by Bretl (2014) or seen in case of Luco et. al. (2007)
and FEMA P-695 exists for new buildings at the same locations as picked by Bretl (2014). If a
relationship does exist, then it is compared to the relation seen in Luco et.al. (2007) and FEMA P-
695, and Bretl (2014) to check for uniformity of the results. The uncertainty in the collapse capacity
is different in case of Luco et al. (2007) in contrast to Bretl (2014) and this study. Hence, this study
also aims to see how strongly input variables influence the relationship between collapse
probability and collapse risk. Bretl (2014) used fragility data from HAZUS-MH code for his study,
which represents existing buildings. In this study, fragility functions from FEMA P-695 are
considered which represent the new buildings. In this study collapse risk is calculated for both 50
year period (as used by Luco et. al. (2007)) and 150 year period (as used by Bretl (2014)).
Since there is a lot of terminology used in describing the calculation of collapse probability
and collapse risk, a brief introduction of this terminology is provided in the following sections. In
the first section several terms used in this study are defined. The second section addresses the
updated version (latest as of this writing) of ASCE 7-05, the ASCE 7-10, in which an overview of
the changes relating to this study is mentioned and other terms are defined. All the other terms
used in this study which are not defined in these sections will be defined later in the study as and
when they are introduced.

3
ASCE 7-05: Minimum Design Loads for Buildings and Other Structures
ASCE 7-05 provides minimum design requirements for buildings and other structures
which are subject to code requirements. In ASCE 7-05, the mapped MCE spectral acceleration
parameters at short period and 1 second period are defined as SS and S1 respectively. (Here and
from here on, MCE is the abbreviation for maximum considered earthquake.) MCE ground
motions values are defined as the ground motions which have 2% probability of exceedance in a
50 year period at a gridded location. ASCE 7-05 provides maps (Figures 22-1 through 22-14)
which are used to determine the S1 values for the following conditions – 5% damping and site class
B. Section 11.4.2 and Chapter 20 of ASCE 7-05 classify a site, based on soil conditions, as site
class A, B, C, D, E or F. S1 values are adjusted to these site classes using site coefficients as
follows-
𝑆𝑀1 = 𝐹𝑣𝑆1
Where,
Fv = long period site coefficient
SM1 = site class adjusted, 5% damped, MCE spectral response acceleration at 1 second period.
The design earthquake spectral response acceleration values, SDS and SD1, are calculated in
accordance with section 11.4.4 as,
𝑆𝐷1 =2
3𝑆𝑀1
Where,

4
SD1 = design earthquake spectral response acceleration at 1 second period.
In this study, we do not consider any buildings with a period less than 0.5 seconds because Charles
Kircher, Project Technical Director of FEMA P-695 told in a private communication that he does
not believe in the building models in FEMA P-695 with a period less than 0.5 seconds. Hence, we
are only concerned with 1-second period spectral response acceleration values in this study.
ASCE 7-10: Minimum Design Loads for Buildings and Other Structures
ASCE 7-10 is the updated and latest version of ASCE 7 as of this writing. The significant
change in ASCE 7-10 relating to this study is the definition of MCE. Here MCER is used rather
than the previously used MCE. (Here and here on, MCER is the abbreviation for risk-targeted
maximum considered earthquake.) At any location in the United States, mapped MCER ground
motion values are the adjusted mapped MCE ground motions which result in a 1% probability of
collapse in a 50 year period for code-compliant buildings. The updated S1 values are determined
using section 11.4.1 and Figures 22-2, 22-4, 22-5 and 22-6 of the ASCE 7-10. The procedure to
determine SM1 is similar to the procedure mentioned in ASCE 7-05.
The SM1 values are obtained using a USGS tool. This tool however requires that we specify
a site class of a location along with its coordinates. Bretl (2014), in his study, has determined the
site class for all the locations. Site class is determined using the shear wave velocity in the upper
30 meters of the soil, denoted by Vs30. A Vs30 mapping tool is used to determine the velocities at
each of the locations picked. Thus, after using these values in the USGS tool, we get the required
SM1 values.

5
To calculate the SMT values, which are building-specific SM1 values, the following equation is
used-
𝑆𝑀𝑇 = 𝑆𝑀1
𝑇
Where,
SMT = Building adjusted, 5 % damped, MCER spectral response acceleration value at building
period T
In this study, we use building adjusted SM1 values to calculate the collapse probability of
buildings. This is because the FEMA 154 also uses building adjusted SM1 values to calculate
collapse probability of buildings. Hence, in this study, ‘MCER shaking level ground motion’ refers
to the SMT values at MCER shaking level.
6
2. Literature Review
Several parameters and methodologies like scoring system, hazard curves, risk-targeted maximum
considered earthquake ground motions, fragility functions etc. are used in this study. The following
literature review gives a brief idea about selection of these methodologies and parameters.
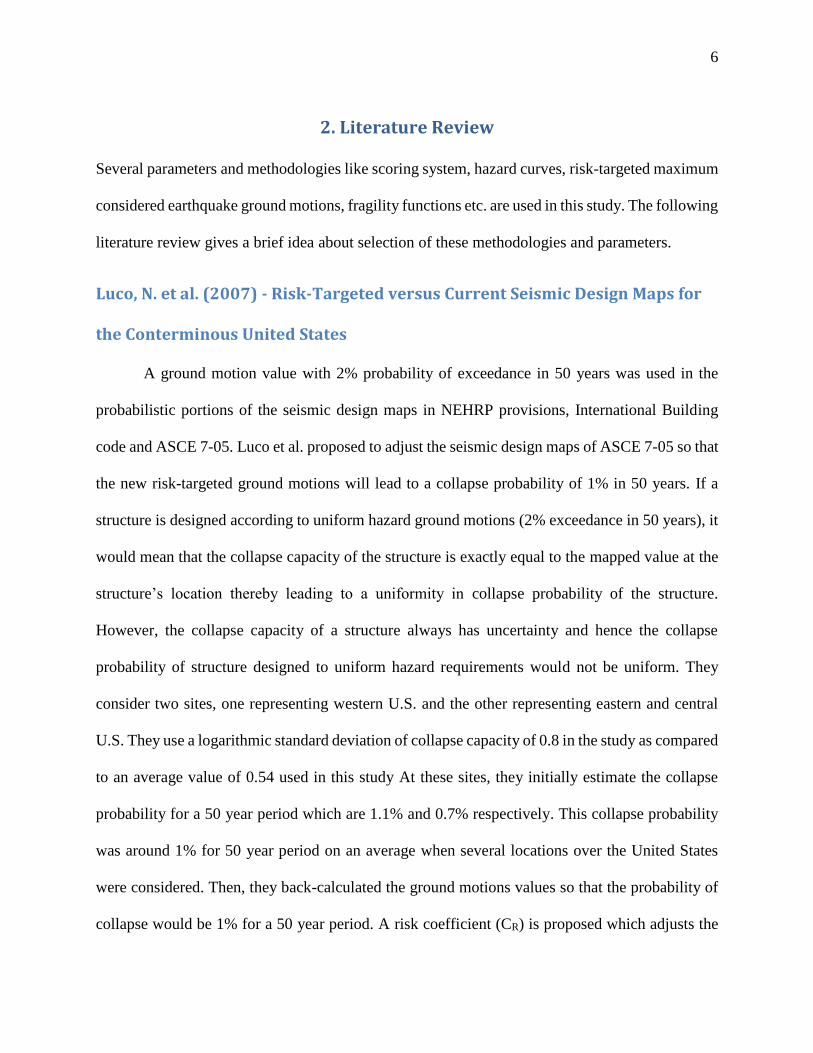
Luco, N. et al. (2007) - Risk-Targeted versus Current Seismic Design Maps for
the Conterminous United States
A ground motion value with 2% probability of exceedance in 50 years was used in the
probabilistic portions of the seismic design maps in NEHRP provisions, International Building
code and ASCE 7-05. Luco et al. proposed to adjust the seismic design maps of ASCE 7-05 so that
the new risk-targeted ground motions will lead to a collapse probability of 1% in 50 years. If a
structure is designed according to uniform hazard ground motions (2% exceedance in 50 years), it
would mean that the collapse capacity of the structure is exactly equal to the mapped value at the
structure’s location thereby leading to a uniformity in collapse probability of the structure.
However, the collapse capacity of a structure always has uncertainty and hence the collapse
probability of structure designed to uniform hazard requirements would not be uniform. They
consider two sites, one representing western U.S. and the other representing eastern and central
U.S. They use a logarithmic standard deviation of collapse capacity of 0.8 in the study as compared
to an average value of 0.54 used in this study At these sites, they initially estimate the collapse
probability for a 50 year period which are 1.1% and 0.7% respectively. This collapse probability
was around 1% for 50 year period on an average when several locations over the United States
were considered. Then, they back-calculated the ground motions values so that the probability of
collapse would be 1% for a 50 year period. A risk coefficient (CR) is proposed which adjusts the

7
current mapped MCE values to obtain the mapped risk-targeted MCE values. This risk coefficient
varies from 0.8 to 1.17 over the entire United States.
Bretl (2014) - Relationship Between the Collapse Fragility and Collapse Risk in
Existing Buildings in Regions of High and Moderate Seismicity
Bretl performed a study to establish a relationship between collapse fragility (collapse
probability) and collapse risk for existing buildings. He proposed that the collapse probability of
an existing building subjected to design-level MCE shaking is nearly equal to its 150 year collapse
frequency value, in case of high seismicity locations. When medium seismicity locations are
considered, this relationship was not seen for the existing buildings. For his study, he picked 44
locations from across the United States of which 23 were from high seismicity regions and 21 from
medium seismicity regions to maintain consistency in the results. He used Porter’s (2009)
HAZUS-MH based fragility functions for this study. HAZUS-MH is a Federal Emergency
Management Agency’s (FEMA) methodology for estimating potential losses from disasters. The
logarithmic standard deviation of collapse capacity was 0.521 on average in his study as compared
to an average of 0.8 in Luco’s study and 0.54 used in this study. He considered both MCE and
MCER shaking levels in his study.
Both Bretl (2014) and Luco et al. (2007) assumed that collapse capacity can be modeled by
assuming a lognormal cumulative distribution function i.e. they calculated collapse probability
using a lognormal cumulative distribution function.
FEMA P-695 - Quantification of Building Seismic Performance Factors
ATC (2009) provides a methodology to reliably quantify the building system performance
and response parameters for use in seismic design. This methodology is used to establish the global

8
seismic performance factors (SPFs), which includes the response modification factor (R factor),
the system over strength factor (Ωo) and deflection amplification factor (Cd). This methodology is
used to determine the seismic response factors for design of seismic force resisting systems in new
buildings. This methodology requires that the seismic force resisting system comply with all the
applicable requirements in ASCE 7-05. Chapter 9 of FEMA P-695 introduces concrete special and
ordinary building frame models that comply with requirements of ACI 318-05: Building code
requirements for structural concrete. These building models are designed so that their probability
of collapse is 10% on an average when subjected to MCE shaking level ground motion.
In this study, we intend to compare collapse risk and collapse probability values for new
buildings. Hence, the fragility functions from Chapter 9 of FEMA P-695 are used in this study.
Wood frame building models and building models with a period less than 0.5 seconds are not
considered in this study. This is because, Charles Kircher, Project Technical Director of FEMA P-
695 told in a private communication that he does not believe in the wood frame building models
and other building frame models with a period less than 0.5 seconds, in FEMA P-695.
FEMA 154 – Rapid Visual Screening of Buildings for Potential Seismic Hazards
FEMA 154, as the name suggests, is a code used for rapid visual screening of buildings to evaluate
for potential seismic hazards. This code follows a sidewalk approach for evaluating the seismic
hazard of buildings. Data collection forms are provided for high, low and seismic hazard locations.
Each of these forms have a basic structural hazard score and score modifiers. Basic structural
hazard score depends on the building type. Hence one needs to have an experienced eye to
correctly judge the building type. Then the score modifiers are noted down depending on the height
of building, site class of building location, occupancy of building, vertical irregularities etc. A final

9
score is calculated by adding the basic structural hazard score and the score modifiers. This final
score has a range of 0-7 where a higher score indicates lower collapse probability due to MCE
ground motion and vice-versa. Final score of value 2 is used as a cut-off to evaluate the seismic
hazard. Any building with a final score less than 2 needs to be evaluated in further detail for
potential seismic hazards. All the above mentioned scores represent the collapse probability of the
building should a design-level ground shaking occur. The relation between score and collapse
probability is given as,
𝑆 = −𝑙𝑜𝑔10(𝐶. 𝑃)
S is the score and C.P is the Collapse probability of the building should an MCE level
shaking occur. This scoring methodology is used in this study in an effort to uniformly compare
collapse probability and collapse risk. All the logarithms used in this study are to the base 10 except
for the logarithmic standard deviation of collapse capacity of buildings. FEMA P-695 calculates
the logarithmic standard deviation of collapse capacity using a natural logarithm.
United States Geological Survey (USGS) Hazard Curves (2008)
In order to calculate the collapse risk, we need the hazard curves at each of the locations
picked. The United States Geological Survey (USGS) website has the hazard curves calculated on
a grid of sites all over the United States. The 2008 USGS national seismic hazard maps show the
ground motions for all probability levels across the United States. These maps are developed using
the hazard curves. In this study, the 2008 hazard curves are used for the conterminous 48 states
and 2007 hazard curves are used for locations in Alaska. The hazard curves are provided in the
form of rectangular gridded data in 0.05° increments in latitude and longitude. The hazard curves
contain the all probable ground motion values at a location expressed in units of ‘g’ (acceleration

10
due to gravity) and their mean annual frequencies of exceedance. These hazard curves are available
for various periods of the buildings. In this study, hazard curves corresponding to the 1-second
period are used.
11
3. Data collection
Locations
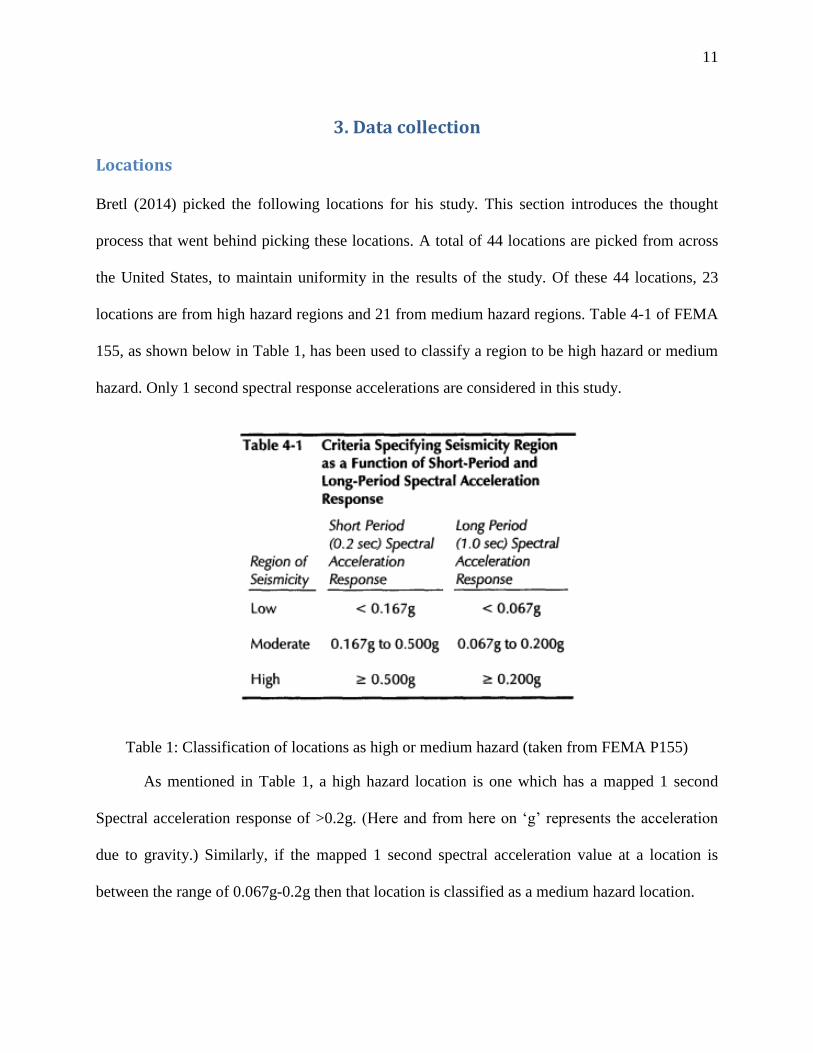
Bretl (2014) picked the following locations for his study. This section introduces the thought
process that went behind picking these locations. A total of 44 locations are picked from across
the United States, to maintain uniformity in the results of the study. Of these 44 locations, 23
locations are from high hazard regions and 21 from medium hazard regions. Table 4-1 of FEMA
155, as shown below in Table 1, has been used to classify a region to be high hazard or medium
hazard. Only 1 second spectral response accelerations are considered in this study.
Table 1: Classification of locations as high or medium hazard (taken from FEMA P155)
As mentioned in Table 1, a high hazard location is one which has a mapped 1 second
Spectral acceleration response of >0.2g. (Here and from here on ‘g’ represents the acceleration
due to gravity.) Similarly, if the mapped 1 second spectral acceleration value at a location is
between the range of 0.067g-0.2g then that location is classified as a medium hazard location.

12
All the locations picked were from densely populated areas and hence the main purpose of
NEHRP provisions, to avoid serious injury and life loss, is maintained. Tables 2 and 3 show the
place, state and the gridded information of the locations chosen. Figure 1 shows the locations
picked on a United States map. This Figure differentiates between high hazard and medium hazard
locations by using different colored pins wherein red colored pin indicates high hazard region and
yellow colored pin indicates a medium hazard location. Locations picked from Anchorage, Alaska
are not shown in this Figure.
High hazard locations
Location number
Location State Placemark
number Latitude Longitude
1 Seattle WA 1 47.55 -122.35
2 Seattle WA 2 47.00 -121.50
3 Portland OR 1 45.50 -122.70
4 Bay Area CA 1 38.05 -122.25
5 Bay Area CA 2 37.75 -122.05
6 Bay Area CA 3 37.40 -122.25
7 Fresno CA 1 36.80 -119.80
8 Los Angeles CA 1 34.60 -118.30
9 Los Angeles CA 2 34.50 -119.00
10 Los Angeles CA 3 34.15 -118.50
11 Los Angeles CA 4 33.80 -118.10
12 San Diego CA 1 33.50 -117.50
13 San Diego CA 2 32.80 -117.00
14 Salt Lake City UT 1 40.85 -111.90
15 Salt Lake City UT 2 40.65 -111.65
16 Evansville IN 1 38.00 -87.70
17 Memphis TN 1 36.50 -89.50
18 Memphis TN 2 35.40 -90.00
19 Charleston SC 1 33.20 -80.00
20 Charleston SC 2 32.75 -80.00
21 Malone NY 1 45.00 -74.20
22 San Juan PR 1 18.40 -66.05
23 Anchorage AK 1 61.20 -149.30
Table 2 : High hazard locations

13
Medium hazard locations
Location number
Location State Placemark
number Latitude Longitude
1 Portland OR 1 45.45 -121.55
2 Sacramento CA 1 38.45 -120.75
3 Spokane WA 1 47.65 -117.40
4 Boise ID 1 43.60 -116.25
5 Las Vegas NV 1 36.25 -115.25
6 Phoenix AZ 1 34.25 -112.10
7 Albuquerque NM 1 35.10 -106.65
8 El Paso TX 1 31.85 -106.45
9 Denver CO 1 38.75 -105.60
10 Oklahoma City OK 1 35.45 -97.50
11 Kansas City MO 1 39.15 -94.55
12 St. Louis MO 1 38.65 -90.80
13 Urbana IL 1 40.10 -88.20
14 Nashville TN 1 36.00 -86.45
15 Indianapolis IN 1 39.80 -86.15
16 Louisville KY 1 38.20 -85.60
17 Atlanta GA 1 33.75 -84.45
18 Charlotte NC 1 35.20 -80.85
19 Philadelphia PA 1 40.00 -75.15
20 New York NY 1 40.85 -73.95
21 Boston MA 1 42.50 -71.00
Table 3 : Medium hazard locations

14
Figure 1: High hazard and medium hazard locations on a map (excluding locations in Alaska)
Red pins – High hazard locations; Yellow pins– Medium hazard locations
Building Fragility Functions
To evaluate the collapse probability and collapse risk, we need to know the median collapse
capacities (θ) and logarithmic standard deviations of collapse capacity (β) of all the building types
chosen for this study. The θ and β values are taken directly from FEMA P-695 (see Table 5).
FEMA P-695 uses incremental dynamic analysis (IDA) to calculate the median collapse
capacities of the buildings. Incremental dynamic analysis is a concept in which the intensities of
ground motions are increased by scaling until the structure collapses. For calculating the median
collapse capacity, the Far-Field data set is set at MCE intensity level adjusted for the building
period. The intensities of these ground motions are then increased until one-half of the records

15
yield collapse of building. The lowest ground motion intensity level at which one-half of the scaled
records yield building collapse is the median collapse capacity.
Simulated and non-simulated collapse modes are considered by FEMA P-695 for
evaluating collapse capacities of building models. The reinforced concrete special moment frame
buildings are assumed to collapse in a sideway mechanism and simulations are performed. This
assumption is made because of the detailing, continuity and capacity design provisions prevent
other collapse modes. For reinforced concrete ordinary moment frames where the additional modes
of failure i.e. non-simulated collapse modes (like column shear failure, loss of gravity-load bearing
capacity etc.) should be accounted for, component limit state checks are used.
For calculating the logarithmic standard deviation of the collapse capacity of building
models, FEMA P-695 considers the following criteria – record to record uncertainty (βRTR),
uncertainty of non linear structural modeling (βMDL), the quality of data used to calibrate element
models (βTD) and the quality of structural system design requirements (βDR). Each of these criteria
has different levels of rating - (A) Superior, (B) Good, (C) Fair or (D) Poor. Depending on the
rating for each of the above mentioned criteria, a total system logarithmic standard deviation value
(βTOT) is calculated as,
𝛽𝑇𝑂𝑇 = √𝛽𝑅𝑇𝑅2 + 𝛽𝐷𝑅
2 + 𝛽𝑇𝐷2 + 𝛽𝑀𝐷𝐿
2
A sample calculation of βTOT is shown below for a better understanding. Record to record
uncertainty is calculated based on period based ductility (μT). If the μT value is greater than or
equal to 3, then βRTR is assumed to be 0.4. If not, it is calculated using the following expression-
𝛽𝑅𝑇𝑅 = 0.1 + 0.1𝜇𝑇 ≤ 0.4

16
where βRTR must be greater than or equal to 0.2
Based on this value of βRTR of 0.4 and for Model Quality βMDL = (A) Superior,
Table 4 taken from FEMA P-695 shows the calculation of βTOT. Hence for (B) Good quality of
test data and design requirements, βTOT = 0.5.
Table 4 : Calculation of βTOT given βRTR = 0.4 and βMDL = (A) Superior
Similarly, tables 7-2b, 7-2c and 7-2d of FEMA P-695 show the calculations of βTOT for
model quality (B) Good, (C) Fair and (D) Poor respectively.
The fundamental period of buildings (T) is necessary to calculate the SMT values for
buildings at each location. The fundamental periods of building are taken from FEMA P-695. It
calculates the fundamental period as,
𝑇𝑎 = 𝐶𝑡ℎ𝑛𝑥
𝑇 = 𝐶𝑢𝑇𝑎 ≥ 0.25𝑠
Where,

17
hn = height of the building in feet.
Cu = Coefficient for upper limit on calculated period (Table 12.8-1 of ASCE 7-05)
Ct and x = Approximate period parameters (Table 12.8-2 of ASCE 7-05)
Ta = Approximate period of the building.
Table 5 : Fragility functions of buildings from FEMA P-695
Model type Archetype IDNo. of
Stories
FEMA 154
height
category
T(s)Median Collapse
capacity-θ (SMT -g)
Logarithmic standard deviation of
collapse capacity-β (ln(g))
CSMF 1003 4 Mid-Rise 0.81 1.79 0.5
CSMF 1011 8 High-Rise 1.49 0.75 0.5
CSMF 5013 12 High-Rise 2.13 0.61 0.5
CSMF 5020 20 High-Rise 3.36 0.45 0.5
CSMF 1008 4 Mid-Rise 0.81 1.98 0.5
CSMF 1012 8 High-Rise 1.49 0.98 0.5
CSMF 5014 12 High-Rise 2.13 0.67 0.5
CSMF 5021 20 High-Rise 3.36 0.53 0.5
CSMF 6011 8 High-Rise 1.6 0.29 0.5
CSMF 6013 12 High-Rise 2.28 0.23 0.5
CSMF 6020 20 High-Rise 3.6 0.17 0.5
CSMF 6021 20 High-Rise 3.6 0.27 0.5
COMF 1009 4 Mid-Rise 1.03 2.06 0.5
COMF 1010 4 Mid-Rise 1.03 2.60 0.5
COMF 9101 2 Low Rise 0.55 0.89 0.575
COMF 9103 4 Mid-Rise 0.99 0.31 0.575
COMF 9105 8 High-Rise 1.81 0.15 0.575
COMF 9107 12 High-Rise 2.59 0.12 0.575
COMF 9102 2 Low Rise 0.55 0.72 0.575
COMF 9104 4 Mid-Rise 0.99 0.28 0.575
COMF 9106 8 High-Rise 1.81 0.26 0.575
COMF 9108 12 High-Rise 2.59 0.17 0.575
COMF 9201 2 Low Rise 0.51 0.80 0.575
COMF 9203 4 Mid-Rise 0.93 0.44 0.575
COMF 9205 8 High-Rise 1.7 0.20 0.575
COMF 9207 12 High-Rise 2.44 0.15 0.575
COMF 9202 2 Low Rise 0.51 0.70 0.575
COMF 9204 4 Mid-Rise 0.93 0.46 0.575
COMF 9206 8 High-Rise 1.7 0.30 0.575
COMF 9208 12 High-Rise 2.44 0.16 0.575
Building fragility data from FEMA P-695

18
4. Procedure This chapter describes the calculation of collapse probability, collapse risk, score, risk score and
PMFR.
Calculation of Collapse Probability
Collapse probability of a building at a location is calculated using a lognormal cumulative
distribution function. This calculates the probability that a building with a median collapse
capacity of θ and a logarithmic standard deviation of collapse capacity β will collapse when
subjected to the MCER SMT value at that particular location. Figure 3 shows a fragility function
which is formed by calculating collapse probabilities at various levels of shaking x (g). Figure 3
shows probability of collapse of building at various levels of shaking but we are only interested in
the collapse probability at MCER SMT shaking level ground motion,
Figure 2: Pictorial representation of a fragility function (Porter (2014))

19
For this study, the variables in the figure above can be explained as,
x = MCER SMT intensity value (g)
Fx(x) = Collapse probability conditioned on MCER shaking level
θ and β = median collapse capacity and logarithmic standard deviation of collapse capacity of
building models
In order to compare the collapse probability and collapse risk, a scoring system similar to
the one shown in FEMA 154, has been adopted in this study.
Calculation of Score
In this study, score (S) is defined as the negative logarithm of the collapse probability of
the building at a given location. The logarithms used while calculating score and risk score are all
to the base 10. To explain score, a score of 2 indicates a 1 in 100 chance for collapse of the building
while a score of 3 indicates a 1 in 1000 chance for the collapse of building.
𝑆 = −𝑙𝑜𝑔10(𝐶. 𝑃)
Where,
C.P = Collapse probability of the building conditioned on MCER SMT level shaking
Hazard Curves
In order to calculate the collapse risk at the locations, we need the hazard curves. Hazard
curves can be obtained directly from the USGS website. For the conterminous 48 states in which
we have most of the locations, 2008 hazard curves were used as it was the latest at the time.

20
Currently, latest version for the conterminous 48 states is 2014 hazard curves. For locations in
Alaska and Puerto Rico, 2007 hazard curves were used since they are the latest version.
The location details are mentioned in terms of latitudes and longitudes. USGS website
gives us the hazard curves in terms of intensity levels (units of ‘g’-acceleration due to gravity) and
their mean annual frequencies of exceedance for each location. The hazard curves are available
for short period and 1- second period spectral response acceleration and in this study the 1 second
period spectral response acceleration values are considered.
This hazard curves are for a boundary B/C site class condition i.e at a Vs30 value of 760
m/s. Hence, the hazard curves are adjusted for all the site classes depending on the Fv value
calculated at each of these locations. The Fv value for a B/C boundary site class is 1.0. The fragility
curves for high and medium hazard locations are shown in Figures 4 and 5.
Figure 3: Hazard curves for selected high hazard sites (1Hz)
0.000
0.001
0.010
0.100
1.000
0.0050 0.0500 0.5000 5.0000
Ann
ual f
requ
ency
of
exce
edan
ce
Spectral Acceleration, g (1.0-sec. period)
Hazard curves for selected high hazard sites (1 Hz)
Seattle
Seattle 2
Portland
Bay Area 1
Bay Area 2
Bay Area 3
Fresno
Los Angeles 1
Los Angeles 2
Los Angeles 3
Los Angeles 4
San Diego 1

21
Figure 4: Hazard curves for selected moderate hazard sites (1Hz)
Calculation of Collapse Risk
Hazard curves give us several ground motion shaking levels and their mean annual
frequencies of exceedance. Frequency of collapse of a building due to a particular value of ground
motion intensity indicates the risk to the building from that ground motion intensity. Collapse risk
to a building at a location is annual frequency of collapse of the building from all such ground
motion intensities considered in this study (hazard curves). The risk integral to calculate the
collapse risk is given as,
dxdx
xdGxF
x
0
This integral is solved numerically using an equation from Porter et al. (2006) stated as follows,
0.00
0.00
0.01
0.10
1.00
0.005 0.05 0.5 5
An
nu
al e
xce
ed
ance
fre
qu
en
cy
Spectral Acceleration, g (1.0-sec. period)
Hazard curves for selected moderate hazard sites (1 Hz)
Portland
Sacramento
Spokane
Boise
Las Vegas
Phoenix
Albuquerque
El Paso
Denver
Oklahoma City
Kansas City
St. Louis
Urbana
Nashville

22
Where,
F(x) = Fragility function solved at a ground motion intensity level x (refer to Collapse
probability section for more information on fragility functions)
G(x) = Annual exceedance frequency at a shaking level
λ = Overall annual collapse risk (frequency of building collapse in an year)
x = Ground motion intensity (g)
Calculation of Risk Score
Similar to score, risk score is defined as the negative logarithm of multiplication of the
overall collapse risk to a building at a location and period of interest τ. This period τ indicates the
period over which the collapse risk to a building is desired. In this study, τ values of 50 years and
150 years are used. 50 years denotes the period in which earthquake of all possible ground motion
intensities may occur while 150 years is assumed to be the realistic life-span of the buildings.
Hence, the equation to calculate risk score is given as,
𝑆𝑅 = −𝑙𝑜𝑔10(λ. τ)
n
i ii
i
xm
i
i
ixm
iimm
xeGx
FeGy iiii
1
111
111
1 iii xxx 1 iii FFF iiii xGGm /)/ln( 1
23
To explain risk score, a risk score of 3 indicates 1/1000 collapses for a given period τ while
a risk score of 2 indicates 1/100 collapses for the same period τ.
Comparison of Score and Risk Score
Score and risk score, i.e. collapse probability and collapse risk are compared using a
parameter called PMFR. PMFR stands for risk-targeted performance modification factor. PMFR is
computed as,
𝑃𝑀𝐹𝑅 = 𝑆𝑅 − 𝑆
To define, a PMFR value of 1 indicates that, for a building model at a particular location,
the frequency of collapse over a period τ conditioned on hazard curves of a location is 1/10th of
its collapse probability conditioned on MCER SMT level shaking.

24
5. Results & Discussion
Vs30 and Site Soil Classification
Table 7 and Table 8 show the Vs30 values and the site classes for high hazard and
moderate hazard locations respectively.
High hazard locations
Location number
Location State Vs30
(m/s) Vs30 (ft/s)
Site class
1 Seattle WA 469 1539 C
2 Seattle WA 760 2493 B
3 Portland OR 546 1791 C
4 Bay Area CA 391 1283 C
5 Bay Area CA 437 1434 C
6 Bay Area CA 721 2365 C
7 Fresno CA 754 2474 C
8 Los Angeles CA 760 2493 B
9 Los Angeles CA 194 636 D
10 Los Angeles CA 466 1529 C
11 Los Angeles CA 206 676 D
12 San Diego CA 599 1965 C
13 San Diego CA 276 906 D
14 Salt Lake City UT 454 1490 C
15 Salt Lake City UT 718 2356 C
16 Evansville IN 297 974 D
17 Memphis TN 237 778 D
18 Memphis TN 212 696 D
19 Charleston SC 207 679 D
20 Charleston SC 250 820 D
21 Malone NY 322 1056 D
22 San Juan PR 272 892 D
23 Anchorage AK 760 2493 B
Table 6 : Vs30 and site soil classes for high hazard locations

25
Medium hazard locations
Location number
Location State Vs30
(m/s) Vs30 (ft/s)
Site class
1 Portland OR 760 2493 B
2 Sacramento CA 456 1496 C
3 Spokane WA 442 1450 C
4 Boise ID 258 846 D
5 Las Vegas NV 287 942 D
6 Phoenix AZ 380 1247 C
7 Albuquerque NM 186 610 D
8 El Paso TX 536 1759 C
9 Denver CO 549 1801 C
10 Oklahoma City OK 222 728 D
11 Kansas City MO 375 1230 C
12 St. Louis MO 306 1004 D
13 Urbana IL 248 814 D
14 Nashville TN 315 1033 D
15 Indianapolis IN 207 679 D
16 Louisville KY 302 991 D
17 Atlanta GA 285 935 D
18 Charlotte NC 281 922 D
19 Philadelphia PA 281 922 D
20 New York NY 506 1660 C
21 Boston MA 371 1217 C
Table 7 : Vs30 and site soil classes for medium hazard locations
Risk-Targeted Spectral Response Acceleration
The site class adjusted risk targeted spectral response acceleration values (SM1) are
computed using procedures shown in Chapter 4. Table 6 contains site class adjusted risk targeted
spectral response acceleration values for high hazard locations and Table 7 contains site class
adjusted risk targeted spectral response acceleration values for medium hazard locations.

26
SM1 - High hazard locations
Location number
Location State S1 (g) FV SM1
(g)
1 Seattle WA 0.589 1.30 0.765
2 Seattle WA 0.311 1.00 0.311
3 Portland OR 0.431 1.37 0.590
4 Bay Area CA 0.600 1.30 0.780
5 Bay Area CA 0.605 1.30 0.787
6 Bay Area CA 1.249 1.30 1.624
7 Fresno CA 1.164 1.30 1.513
8 Los Angeles CA 1.102 1.00 1.102
9 Los Angeles CA 0.256 1.89 0.484
10 Los Angeles CA 0.723 1.30 0.939
11 Los Angeles CA 0.567 1.50 0.851
12 San Diego CA 0.462 1.34 0.618
13 San Diego CA 0.336 1.73 0.581
14 Salt Lake City UT 0.661 1.30 0.859
15 Salt Lake City UT 0.265 1.00 0.265
16 Evansville IN 0.208 1.98 0.413
17 Memphis TN 1.113 1.50 1.670
18 Memphis TN 0.483 1.52 0.732
19 Charleston SC 0.669 1.50 1.004
20 Charleston SC 0.363 1.67 0.608
21 Malone NY 0.142 2.23 0.316
22 San Juan PR 0.382 1.64 0.625
23 Anchorage AK 0.698 1.30 0.907
Table 8 : SM1 values at MCER intensity level for high hazard locations

27
SM1 - Medium hazard locations
Location number
Location State S1 (g) FV SM1
(g)
1 Portland OR 0.258 1.54 0.398
2 Sacramento CA 0.238 1.93 0.457
3 Spokane WA 0.115 1.69 0.193
4 Boise ID 0.104 2.38 0.248
5 Las Vegas NV 0.164 2.14 0.352
6 Phoenix AZ 0.079 1.70 0.134
7 Albuquerque NM 0.137 2.25 0.308
8 El Paso TX 0.113 1.69 0.191
9 Denver CO 0.073 1.70 0.124
10 Oklahoma City OK 0.078 2.40 0.186
11 Kansas City MO 0.064 1.70 0.108
12 St. Louis MO 0.162 2.15 0.349
13 Urbana IL 0.096 2.40 0.230
14 Nashville TN 0.146 2.22 0.323
15 Indianapolis IN 0.085 2.40 0.204
16 Louisville KY 0.103 2.39 0.246
17 Atlanta GA 0.090 2.40 0.216
18 Charlotte NC 0.104 2.39 0.247
19 Philadelphia PA 0.061 2.40 0.146
20 New York NY 0.072 1.70 0.123
21 Boston MA 0.072 1.70 0.123
Table 9 : SM1 values at MCER intensity level for medium hazard locations
The following tables show the collapse probabilities, collapse risks, scores, risk scores and
PMFR values for the buildings at high hazard locations. Table 12 shows the score calculated using
collapse probabilities at high hazard locations. This table is color coded so that as the color varies
from red color for the lowest value of score in the table to green color which is the highest value
of score in the table. This representation is chosen to show that a lower value of score represents a
higher probability of collapse under MCER shaking level ground motion. In the table, we can see
that the collapse probabilities of COMF buildings are higher when compared with the collapse

28
probabilities of CSMF buildings. This is because CSMF building models are designed better to
withstand earthquakes.
Tables 14 and 15 show the risk score calculated for 50 year period and 150 year period
respectively using collapse risk, at high hazard locations. These tables are also color coded in a
similar way as Table 12. In this table, the color varies from red color for the lowest value of risk
score in the table to green color which is the highest value of risk score in the table. Low value of
risk score indicates a higher collapse frequency in τ years and vice-versa. As we can see from the
tables, CSMF frames have a lower collapse risk than the COMF frames. This is because CSMF
frames are designed better to resist earthquakes through ductile detailing.
Tables 16 and 17 show the PMFR values at high hazard locations for 50 year period and
150 year period respectively. These tables are color coded so the green color indicates that PMFR
is equal to 0 and yellow color indicates the negative and positive PMFR values farthest from zero.
A whole numbered PMFR of 0, 1, 2 etc. would give a physical meaning to PMFR in comparison of
collapse probability and collapse risk. In this study, a PMFR value varying ±0.25 from a whole
numbered value of PMFR is assumed to be acceptable.

29
Table 10 : Collapse probabilities conditioned on MCER SMT shaking at high hazard locations
1 2 3 4 5 6 7 8 9 10 11 12 13 14 15 16 17 18 19 20 21 22 23 Average
1003 CSMF 0.10 0.00 0.04 0.11 0.11 0.59 0.54 0.29 0.01 0.19 0.14 0.04 0.03 0.15 0.00 0.01 0.61 0.09 0.23 0.04 0.00 0.05 0.17 0.15
1011 CSMF 0.22 0.01 0.10 0.24 0.24 0.77 0.73 0.49 0.05 0.36 0.29 0.12 0.10 0.30 0.00 0.02 0.79 0.20 0.41 0.11 0.01 0.12 0.34 0.26
5013 CSMF 0.15 0.00 0.06 0.15 0.16 0.67 0.62 0.37 0.02 0.26 0.20 0.07 0.05 0.20 0.00 0.01 0.69 0.13 0.30 0.06 0.00 0.07 0.24 0.20
5020 CSMF 0.09 0.00 0.03 0.09 0.10 0.56 0.50 0.27 0.01 0.17 0.13 0.04 0.03 0.13 0.00 0.00 0.58 0.07 0.21 0.03 0.00 0.04 0.16 0.14
1008 CSMF 0.07 0.00 0.02 0.08 0.08 0.51 0.46 0.23 0.01 0.14 0.10 0.03 0.02 0.11 0.00 0.00 0.53 0.06 0.18 0.03 0.00 0.03 0.13 0.12
1012 CSMF 0.10 0.00 0.04 0.11 0.11 0.59 0.53 0.29 0.01 0.19 0.14 0.04 0.03 0.15 0.00 0.01 0.61 0.08 0.23 0.04 0.00 0.05 0.17 0.15
5014 CSMF 0.11 0.00 0.04 0.11 0.12 0.60 0.55 0.30 0.02 0.20 0.15 0.05 0.04 0.16 0.00 0.01 0.63 0.09 0.24 0.04 0.00 0.05 0.18 0.16
5021 CSMF 0.04 0.00 0.01 0.05 0.05 0.42 0.37 0.16 0.00 0.10 0.07 0.02 0.01 0.07 0.00 0.00 0.44 0.04 0.12 0.02 0.00 0.02 0.09 0.09
6011 CSMF 0.84 0.21 0.69 0.85 0.86 0.99 0.99 0.96 0.53 0.92 0.89 0.72 0.67 0.89 0.13 0.41 0.99 0.82 0.94 0.71 0.22 0.72 0.91 0.73
6013 CSMF 0.78 0.15 0.60 0.79 0.79 0.99 0.98 0.93 0.44 0.88 0.84 0.63 0.58 0.84 0.09 0.32 0.99 0.75 0.90 0.62 0.16 0.64 0.87 0.68
6020 CSMF 0.69 0.10 0.49 0.71 0.71 0.98 0.97 0.89 0.34 0.82 0.76 0.53 0.48 0.77 0.05 0.23 0.98 0.66 0.85 0.52 0.10 0.54 0.80 0.61
6021 CSMF 0.31 0.01 0.16 0.33 0.33 0.85 0.81 0.60 0.08 0.47 0.39 0.18 0.15 0.40 0.00 0.04 0.86 0.28 0.52 0.17 0.01 0.19 0.44 0.33
1009 CSMF 0.02 0.00 0.01 0.02 0.02 0.30 0.25 0.10 0.00 0.05 0.03 0.01 0.00 0.04 0.00 0.00 0.32 0.02 0.07 0.01 0.00 0.01 0.04 0.06
1010 CSMF 0.01 0.00 0.00 0.01 0.01 0.16 0.13 0.04 0.00 0.02 0.01 0.00 0.00 0.01 0.00 0.00 0.17 0.00 0.02 0.00 0.00 0.00 0.02 0.03
9101 COMF 0.78 0.21 0.58 0.79 0.79 0.98 0.95 0.92 0.44 0.87 0.83 0.66 0.58 0.83 0.14 0.38 0.98 0.76 0.89 0.64 0.22 0.63 0.82 0.68
9103 COMF 0.95 0.51 0.87 0.95 0.95 1.00 1.00 0.99 0.79 0.97 0.96 0.89 0.87 0.96 0.40 0.70 1.00 0.94 0.98 0.88 0.53 0.89 0.97 0.87
9105 COMF 0.96 0.58 0.90 0.96 0.96 1.00 1.00 0.99 0.83 0.98 0.97 0.92 0.90 0.97 0.47 0.75 1.00 0.95 0.99 0.91 0.59 0.92 0.98 0.89
9107 COMF 0.94 0.51 0.87 0.95 0.95 1.00 1.00 0.99 0.79 0.97 0.96 0.89 0.87 0.96 0.40 0.70 1.00 0.93 0.98 0.88 0.52 0.89 0.97 0.87
9102 COMF 0.88 0.34 0.72 0.88 0.89 0.99 0.98 0.96 0.59 0.93 0.91 0.78 0.72 0.91 0.25 0.53 0.99 0.86 0.95 0.77 0.35 0.76 0.90 0.78
9104 COMF 0.96 0.58 0.91 0.96 0.97 1.00 1.00 0.99 0.84 0.98 0.97 0.92 0.90 0.98 0.47 0.76 1.00 0.96 0.99 0.91 0.59 0.92 0.98 0.89
9106 COMF 0.80 0.23 0.65 0.81 0.81 0.98 0.98 0.93 0.51 0.88 0.85 0.68 0.64 0.85 0.16 0.41 0.99 0.78 0.90 0.67 0.24 0.68 0.87 0.71
9108 COMF 0.84 0.28 0.70 0.85 0.85 0.99 0.99 0.95 0.57 0.91 0.88 0.73 0.69 0.88 0.20 0.46 0.99 0.82 0.93 0.72 0.29 0.74 0.90 0.75
9201 COMF 0.87 0.32 0.65 0.86 0.88 0.99 0.97 0.96 0.52 0.93 0.88 0.77 0.65 0.90 0.23 0.50 0.99 0.83 0.93 0.76 0.33 0.70 0.86 0.75
9203 COMF 0.86 0.32 0.74 0.87 0.87 0.99 0.99 0.96 0.62 0.93 0.90 0.77 0.73 0.90 0.23 0.51 0.99 0.85 0.94 0.76 0.33 0.77 0.92 0.77
9205 COMF 0.92 0.43 0.83 0.92 0.93 1.00 1.00 0.98 0.73 0.96 0.94 0.85 0.82 0.94 0.33 0.63 1.00 0.91 0.97 0.84 0.44 0.85 0.95 0.83
9207 COMF 0.89 0.37 0.78 0.90 0.90 0.99 0.99 0.97 0.67 0.94 0.92 0.81 0.77 0.92 0.27 0.56 1.00 0.88 0.96 0.80 0.38 0.81 0.94 0.80
9202 COMF 0.91 0.41 0.73 0.91 0.92 1.00 0.98 0.98 0.61 0.95 0.92 0.83 0.73 0.94 0.30 0.59 0.99 0.88 0.96 0.82 0.42 0.78 0.91 0.80
9204 COMF 0.85 0.29 0.72 0.85 0.86 0.99 0.99 0.95 0.59 0.92 0.89 0.74 0.71 0.89 0.21 0.48 0.99 0.83 0.93 0.73 0.30 0.75 0.91 0.75
9206 COMF 0.76 0.20 0.61 0.77 0.78 0.98 0.97 0.91 0.47 0.86 0.82 0.64 0.59 0.82 0.13 0.36 0.98 0.74 0.88 0.62 0.21 0.64 0.85 0.68
9208 COMF 0.89 0.36 0.78 0.89 0.90 0.99 0.99 0.97 0.66 0.94 0.92 0.80 0.77 0.92 0.27 0.56 0.99 0.87 0.95 0.79 0.37 0.81 0.93 0.80
Average 0.59 0.22 0.48 0.59 0.60 0.83 0.81 0.71 0.39 0.66 0.62 0.50 0.47 0.63 0.16 0.33 0.84 0.57 0.68 0.50 0.22 0.50 0.64 0.54
High hazard location
Archetype Model Type
Collapse probability of buildings given MCER level shaking(high hazard)

30
Table 11 : Score calculated using collapse probabilities at high hazard locations
1 2 3 4 5 6 7 8 9 10 11 12 13 14 15 16 17 18 19 20 21 22 23 Average
1003 CSMF 0.99 2.98 1.44 0.97 0.95 0.23 0.27 0.53 1.85 0.71 0.84 1.35 1.47 0.83 3.46 2.22 0.21 1.06 0.63 1.38 2.93 1.33 0.76 1.28
1011 CSMF 0.65 2.28 1.00 0.63 0.62 0.11 0.14 0.31 1.33 0.44 0.53 0.93 1.02 0.52 2.69 1.64 0.10 0.70 0.38 0.95 2.24 0.91 0.47 0.90
5013 CSMF 0.84 2.67 1.24 0.81 0.80 0.17 0.21 0.43 1.62 0.59 0.70 1.16 1.27 0.69 3.12 1.96 0.16 0.90 0.52 1.19 2.62 1.14 0.62 1.11
5020 CSMF 1.06 3.09 1.52 1.03 1.01 0.25 0.30 0.58 1.94 0.76 0.90 1.43 1.55 0.88 3.59 2.32 0.24 1.13 0.68 1.46 3.05 1.41 0.81 1.35
1008 CSMF 1.15 3.28 1.64 1.12 1.11 0.29 0.34 0.64 2.08 0.84 0.99 1.54 1.67 0.97 3.79 2.47 0.27 1.23 0.76 1.58 3.23 1.52 0.89 1.45
1012 CSMF 1.00 2.99 1.45 0.98 0.96 0.23 0.28 0.54 1.86 0.72 0.85 1.36 1.48 0.84 3.48 2.24 0.22 1.07 0.64 1.40 2.95 1.35 0.77 1.29
5014 CSMF 0.97 2.92 1.41 0.94 0.93 0.22 0.26 0.52 1.81 0.69 0.82 1.32 1.44 0.81 3.41 2.18 0.20 1.04 0.61 1.35 2.88 1.30 0.73 1.25
5021 CSMF 1.36 3.64 1.89 1.32 1.31 0.38 0.44 0.78 2.36 1.01 1.17 1.78 1.92 1.15 4.18 2.79 0.35 1.44 0.91 1.82 3.59 1.76 1.07 1.67
6011 CSMF 0.07 0.67 0.16 0.07 0.07 0.00 0.00 0.02 0.27 0.04 0.05 0.14 0.17 0.05 0.88 0.39 0.00 0.09 0.03 0.15 0.65 0.14 0.04 0.18
6013 CSMF 0.11 0.82 0.22 0.10 0.10 0.01 0.01 0.03 0.36 0.06 0.08 0.20 0.23 0.08 1.06 0.50 0.00 0.12 0.04 0.21 0.80 0.19 0.06 0.23
6020 CSMF 0.16 1.01 0.31 0.15 0.15 0.01 0.01 0.05 0.47 0.09 0.12 0.28 0.32 0.11 1.27 0.63 0.01 0.18 0.07 0.29 0.99 0.27 0.10 0.31
6021 CSMF 0.50 1.95 0.80 0.48 0.48 0.07 0.09 0.22 1.09 0.33 0.41 0.74 0.82 0.40 2.34 1.37 0.07 0.55 0.28 0.76 1.92 0.73 0.35 0.73
1009 CSMF 1.68 4.21 2.28 1.64 1.63 0.53 0.60 1.02 2.81 1.29 1.47 2.17 2.32 1.45 4.79 3.28 0.50 1.78 1.17 2.21 4.15 2.14 1.35 2.02
1010 CSMF 2.21 5.08 2.91 2.17 2.15 0.80 0.90 1.42 3.51 1.74 1.96 2.77 2.95 1.94 5.72 4.04 0.76 2.32 1.60 2.82 5.01 2.75 1.82 2.58
9101 COMF 0.11 0.67 0.24 0.10 0.10 0.01 0.02 0.04 0.36 0.06 0.08 0.18 0.24 0.08 0.85 0.42 0.01 0.12 0.05 0.19 0.65 0.20 0.09 0.21
9103 COMF 0.02 0.29 0.06 0.02 0.02 0.00 0.00 0.01 0.10 0.01 0.02 0.05 0.06 0.02 0.39 0.15 0.00 0.03 0.01 0.05 0.28 0.05 0.01 0.07
9105 COMF 0.02 0.24 0.04 0.02 0.02 0.00 0.00 0.00 0.08 0.01 0.01 0.04 0.05 0.01 0.33 0.12 0.00 0.02 0.01 0.04 0.23 0.04 0.01 0.06
9107 COMF 0.02 0.29 0.06 0.02 0.02 0.00 0.00 0.01 0.10 0.01 0.02 0.05 0.06 0.02 0.40 0.16 0.00 0.03 0.01 0.05 0.28 0.05 0.01 0.07
9102 COMF 0.06 0.47 0.14 0.05 0.05 0.00 0.01 0.02 0.23 0.03 0.04 0.11 0.14 0.04 0.61 0.27 0.00 0.07 0.02 0.11 0.45 0.12 0.05 0.13
9104 COMF 0.02 0.23 0.04 0.02 0.02 0.00 0.00 0.00 0.08 0.01 0.01 0.04 0.04 0.01 0.33 0.12 0.00 0.02 0.01 0.04 0.23 0.04 0.01 0.06
9106 COMF 0.10 0.63 0.19 0.09 0.09 0.01 0.01 0.03 0.29 0.05 0.07 0.17 0.19 0.07 0.80 0.39 0.01 0.11 0.04 0.18 0.62 0.16 0.06 0.19
9108 COMF 0.08 0.55 0.15 0.07 0.07 0.00 0.01 0.02 0.24 0.04 0.06 0.14 0.16 0.05 0.71 0.33 0.00 0.09 0.03 0.14 0.54 0.13 0.05 0.16
9201 COMF 0.06 0.49 0.18 0.06 0.06 0.00 0.01 0.02 0.28 0.03 0.06 0.12 0.18 0.04 0.64 0.30 0.01 0.08 0.03 0.12 0.48 0.15 0.06 0.15
9203 COMF 0.06 0.49 0.13 0.06 0.06 0.00 0.00 0.02 0.21 0.03 0.05 0.12 0.14 0.04 0.64 0.29 0.00 0.07 0.03 0.12 0.48 0.11 0.04 0.14
9205 COMF 0.04 0.36 0.08 0.03 0.03 0.00 0.00 0.01 0.14 0.02 0.03 0.07 0.09 0.02 0.48 0.20 0.00 0.04 0.01 0.08 0.35 0.07 0.02 0.10
9207 COMF 0.05 0.43 0.11 0.05 0.05 0.00 0.00 0.01 0.18 0.03 0.04 0.09 0.11 0.03 0.57 0.25 0.00 0.06 0.02 0.10 0.42 0.09 0.03 0.12
9202 COMF 0.04 0.39 0.13 0.04 0.04 0.00 0.01 0.01 0.22 0.02 0.04 0.08 0.14 0.03 0.52 0.23 0.00 0.05 0.02 0.08 0.38 0.11 0.04 0.11
9204 COMF 0.07 0.53 0.15 0.07 0.07 0.00 0.01 0.02 0.23 0.04 0.05 0.13 0.15 0.05 0.69 0.32 0.00 0.08 0.03 0.14 0.52 0.13 0.04 0.15
9206 COMF 0.12 0.70 0.22 0.11 0.11 0.01 0.01 0.04 0.33 0.07 0.09 0.20 0.23 0.09 0.88 0.44 0.01 0.13 0.05 0.20 0.68 0.19 0.07 0.22
9208 COMF 0.05 0.44 0.11 0.05 0.05 0.00 0.00 0.01 0.18 0.03 0.04 0.10 0.11 0.04 0.58 0.26 0.00 0.06 0.02 0.10 0.43 0.09 0.03 0.12
Average 0.46 1.49 0.68 0.44 0.44 0.11 0.13 0.25 0.89 0.33 0.39 0.63 0.69 0.38 1.77 1.08 0.11 0.49 0.29 0.64 1.47 0.62 0.35 0.61
Archetype Model Type
High hazard locations
Score based on collapse probability

31
Table 12 : Annual collapse risk calculated using hazard curves at high hazard locations
1 2 3 4 5 6 7 8 9 10 11 12 13 14 15 16 17 18 19 20 21 22 23 Average
1003 CSMF 7E-05 3E-06 4E-05 6E-05 2E-04 6E-04 6E-04 2E-04 4E-04 8E-05 7E-05 1E-05 1E-05 1E-04 2E-06 1E-05 5E-04 1E-04 2E-04 7E-05 9E-06 2E-05 6E-06 1E-04
1011 CSMF 6E-04 5E-05 4E-04 1E-03 2E-03 3E-03 3E-03 1E-03 3E-03 1E-03 1E-03 4E-04 4E-04 6E-04 4E-05 1E-04 1E-03 6E-04 7E-04 4E-04 8E-05 5E-04 2E-04 1E-03
5013 CSMF 1E-03 9E-05 6E-04 2E-03 4E-03 4E-03 4E-03 2E-03 5E-03 2E-03 2E-03 8E-04 8E-04 8E-04 7E-05 2E-04 1E-03 8E-04 8E-04 5E-04 1E-04 1E-03 3E-04 1E-03
5020 CSMF 2E-03 2E-04 1E-03 5E-03 7E-03 5E-03 6E-03 3E-03 8E-03 4E-03 5E-03 2E-03 2E-03 1E-03 2E-04 5E-04 2E-03 1E-03 1E-03 8E-04 2E-04 2E-03 8E-04 3E-03
1008 CSMF 6E-05 2E-06 3E-05 4E-05 1E-04 4E-04 5E-04 2E-04 3E-04 6E-05 5E-05 9E-06 7E-06 1E-04 1E-06 8E-06 4E-04 8E-05 2E-04 6E-05 7E-06 1E-05 3E-06 1E-04
1012 CSMF 3E-04 2E-05 2E-04 6E-04 1E-03 2E-03 2E-03 8E-04 2E-03 6E-04 6E-04 2E-04 1E-04 4E-04 2E-05 7E-05 1E-03 3E-04 5E-04 2E-04 4E-05 2E-04 6E-05 6E-04
5014 CSMF 8E-04 7E-05 5E-04 2E-03 3E-03 3E-03 4E-03 2E-03 4E-03 2E-03 2E-03 6E-04 6E-04 7E-04 5E-05 2E-04 1E-03 7E-04 8E-04 4E-04 1E-04 7E-04 2E-04 1E-03
5021 CSMF 1E-03 1E-04 7E-04 3E-03 5E-03 4E-03 5E-03 2E-03 6E-03 3E-03 3E-03 1E-03 1E-03 1E-03 1E-04 3E-04 2E-03 9E-04 9E-04 6E-04 2E-04 1E-03 5E-04 2E-03
6011 CSMF 4E-03 6E-04 2E-03 1E-02 1E-02 1E-02 1E-02 6E-03 2E-02 1E-02 1E-02 5E-03 6E-03 2E-03 4E-04 1E-03 2E-03 2E-03 2E-03 1E-03 5E-04 6E-03 2E-03 6E-03
6013 CSMF 6E-03 1E-03 3E-03 2E-02 2E-02 1E-02 2E-02 9E-03 2E-02 1E-02 2E-02 9E-03 9E-03 3E-03 7E-04 1E-03 3E-03 2E-03 2E-03 2E-03 8E-04 9E-03 4E-03 8E-03
6020 CSMF 1E-02 2E-03 4E-03 3E-02 3E-02 2E-02 2E-02 1E-02 3E-02 2E-02 3E-02 2E-02 2E-02 4E-03 1E-03 2E-03 3E-03 3E-03 2E-03 2E-03 1E-03 2E-02 7E-03 1E-02
6021 CSMF 5E-03 7E-04 2E-03 1E-02 2E-02 1E-02 1E-02 7E-03 2E-02 1E-02 1E-02 6E-03 7E-03 2E-03 5E-04 1E-03 2E-03 2E-03 2E-03 1E-03 6E-04 7E-03 3E-03 6E-03
1009 CSMF 5E-05 2E-06 2E-05 4E-05 1E-04 4E-04 5E-04 1E-04 3E-04 5E-05 5E-05 7E-06 6E-06 1E-04 1E-06 7E-06 4E-04 7E-05 2E-04 5E-05 7E-06 1E-05 3E-06 1E-04
1010 CSMF 3E-05 7E-07 1E-05 1E-05 6E-05 2E-04 3E-04 8E-05 1E-04 2E-05 2E-05 3E-06 2E-06 6E-05 4E-07 3E-06 2E-04 4E-05 1E-04 3E-05 4E-06 3E-06 9E-07 6E-05
9101 COMF 5E-04 4E-05 3E-04 1E-03 2E-03 2E-03 3E-03 1E-03 2E-03 1E-03 1E-03 3E-04 3E-04 5E-04 3E-05 1E-04 1E-03 4E-04 6E-04 3E-04 6E-05 4E-04 1E-04 8E-04
9103 COMF 4E-03 6E-04 2E-03 1E-02 1E-02 1E-02 1E-02 6E-03 2E-02 1E-02 1E-02 5E-03 6E-03 2E-03 4E-04 1E-03 2E-03 2E-03 1E-03 1E-03 5E-04 6E-03 2E-03 6E-03
9105 COMF 1E-02 2E-03 5E-03 3E-02 3E-02 2E-02 3E-02 1E-02 4E-02 3E-02 4E-02 2E-02 2E-02 5E-03 2E-03 2E-03 3E-03 3E-03 2E-03 2E-03 2E-03 2E-02 8E-03 1E-02
9107 COMF 2E-02 4E-03 7E-03 4E-02 4E-02 3E-02 4E-02 2E-02 5E-02 4E-02 5E-02 3E-02 3E-02 6E-03 2E-03 3E-03 4E-03 4E-03 3E-03 3E-03 2E-03 3E-02 1E-02 2E-02
9102 COMF 8E-04 8E-05 5E-04 2E-03 3E-03 3E-03 4E-03 2E-03 4E-03 2E-03 2E-03 6E-04 6E-04 7E-04 6E-05 2E-04 1E-03 6E-04 7E-04 4E-04 1E-04 8E-04 3E-04 1E-03
9104 COMF 5E-03 7E-04 2E-03 1E-02 2E-02 1E-02 1E-02 7E-03 2E-02 1E-02 1E-02 7E-03 7E-03 2E-03 5E-04 1E-03 2E-03 2E-03 2E-03 1E-03 6E-04 7E-03 3E-03 6E-03
9106 COMF 6E-03 8E-04 3E-03 1E-02 2E-02 1E-02 1E-02 8E-03 2E-02 1E-02 2E-02 8E-03 8E-03 3E-03 6E-04 1E-03 3E-03 2E-03 2E-03 1E-03 7E-04 8E-03 3E-03 7E-03
9108 COMF 1E-02 2E-03 5E-03 3E-02 3E-02 2E-02 2E-02 1E-02 4E-02 2E-02 3E-02 2E-02 2E-02 4E-03 1E-03 2E-03 3E-03 3E-03 2E-03 2E-03 1E-03 2E-02 7E-03 1E-02
9201 COMF 7E-04 6E-05 4E-04 1E-03 2E-03 3E-03 3E-03 1E-03 3E-03 1E-03 1E-03 5E-04 5E-04 6E-04 4E-05 2E-04 1E-03 5E-04 6E-04 4E-04 8E-05 6E-04 2E-04 1E-03
9203 COMF 2E-03 3E-04 1E-03 6E-03 7E-03 6E-03 7E-03 4E-03 9E-03 5E-03 6E-03 2E-03 3E-03 1E-03 2E-04 6E-04 2E-03 1E-03 1E-03 8E-04 3E-04 3E-03 1E-03 3E-03
9205 COMF 8E-03 1E-03 4E-03 2E-02 2E-02 2E-02 2E-02 1E-02 3E-02 2E-02 3E-02 1E-02 1E-02 3E-03 1E-03 2E-03 3E-03 2E-03 2E-03 2E-03 1E-03 1E-02 5E-03 1E-02
9207 COMF 1E-02 2E-03 5E-03 3E-02 3E-02 2E-02 3E-02 1E-02 4E-02 3E-02 4E-02 2E-02 2E-02 5E-03 2E-03 2E-03 3E-03 3E-03 2E-03 2E-03 2E-03 2E-02 8E-03 1E-02
9202 COMF 9E-04 9E-05 5E-04 2E-03 3E-03 3E-03 4E-03 2E-03 4E-03 2E-03 2E-03 7E-04 7E-04 7E-04 6E-05 2E-04 1E-03 7E-04 7E-04 4E-04 1E-04 9E-04 3E-04 1E-03
9204 COMF 2E-03 2E-04 1E-03 5E-03 7E-03 6E-03 7E-03 3E-03 9E-03 5E-03 6E-03 2E-03 2E-03 1E-03 2E-04 5E-04 2E-03 1E-03 1E-03 8E-04 3E-04 2E-03 9E-04 3E-03
9206 COMF 4E-03 6E-04 2E-03 1E-02 1E-02 1E-02 1E-02 6E-03 2E-02 1E-02 1E-02 6E-03 6E-03 2E-03 5E-04 1E-03 2E-03 2E-03 2E-03 1E-03 6E-04 6E-03 2E-03 6E-03
9208 COMF 1E-02 2E-03 5E-03 3E-02 3E-02 2E-02 3E-02 1E-02 4E-02 3E-02 4E-02 2E-02 2E-02 5E-03 2E-03 2E-03 3E-03 3E-03 2E-03 2E-03 2E-03 2E-02 8E-03 1E-02
Average 4E-03 7E-04 2E-03 1E-02 1E-02 1E-02 1E-02 6E-03 2E-02 1E-02 1E-02 6E-03 7E-03 2E-03 5E-04 9E-04 2E-03 1E-03 1E-03 1E-03 6E-04 7E-03 3E-03 6E-03
Archetype Model Type
Collapse Risk (High Hazard)
Annual collapse risk to a building due to seismic hazard at a location
32
Table 13 : Risk score calculated for 50 year period using collapse risk, at high hazard locations
1 2 3 4 5 6 7 8 9 10 11 12 13 14 15 16 17 18 19 20 21 22 23 Average
1003 CSMF 2.44 3.81 2.75 2.49 2.01 1.55 1.49 1.97 1.71 2.38 2.43 3.16 3.27 2.16 4.05 3.28 1.64 2.31 1.99 2.46 3.33 3.03 3.56 2.58
1011 CSMF 1.49 2.58 1.76 1.17 0.96 0.89 0.81 1.16 0.82 1.22 1.20 1.70 1.73 1.51 2.73 2.14 1.20 1.56 1.48 1.75 2.40 1.59 2.08 1.56
5013 CSMF 1.29 2.33 1.56 0.92 0.76 0.75 0.67 1.00 0.63 0.99 0.94 1.41 1.42 1.38 2.47 1.91 1.13 1.41 1.38 1.61 2.20 1.32 1.80 1.36
5020 CSMF 1.01 1.98 1.29 0.60 0.49 0.56 0.49 0.78 0.38 0.67 0.60 1.03 1.02 1.20 2.12 1.61 1.04 1.24 1.26 1.42 1.92 0.96 1.42 1.09
1008 CSMF 2.56 3.98 2.88 2.68 2.15 1.65 1.59 2.09 1.82 2.53 2.58 3.36 3.47 2.25 4.23 3.42 1.71 2.41 2.07 2.56 3.44 3.23 3.76 2.71
1012 CSMF 1.77 2.93 2.04 1.53 1.25 1.07 0.99 1.38 1.08 1.56 1.55 2.11 2.16 1.69 3.09 2.47 1.31 1.76 1.62 1.95 2.68 1.98 2.49 1.85
5014 CSMF 1.38 2.44 1.64 1.03 0.84 0.81 0.73 1.07 0.72 1.09 1.05 1.54 1.56 1.43 2.58 2.01 1.16 1.48 1.42 1.67 2.29 1.43 1.92 1.45
5021 CSMF 1.17 2.17 1.44 0.78 0.64 0.67 0.59 0.90 0.52 0.85 0.79 1.25 1.25 1.30 2.31 1.78 1.09 1.33 1.33 1.52 2.08 1.16 1.63 1.24
6011 CSMF 0.67 1.54 0.98 0.24 0.17 0.30 0.24 0.51 0.08 0.30 0.20 0.57 0.55 0.97 1.68 1.28 0.93 1.05 1.11 1.21 1.57 0.54 0.96 0.77
6013 CSMF 0.50 1.32 0.83 0.08 0.02 0.16 0.11 0.37 -0.06 0.13 0.02 0.36 0.33 0.86 1.47 1.14 0.87 0.96 1.05 1.12 1.40 0.35 0.75 0.61
6020 CSMF 0.30 1.04 0.65 -0.11 -0.16 -0.02 -0.07 0.19 -0.24 -0.08 -0.20 0.09 0.05 0.69 1.21 0.97 0.79 0.86 0.96 1.01 1.19 0.10 0.48 0.42
6021 CSMF 0.62 1.47 0.94 0.19 0.12 0.26 0.21 0.47 0.03 0.25 0.15 0.51 0.48 0.94 1.62 1.24 0.91 1.02 1.09 1.19 1.52 0.48 0.90 0.72
1009 CSMF 2.60 4.04 2.93 2.75 2.20 1.69 1.63 2.13 1.86 2.59 2.64 3.44 3.55 2.29 4.30 3.47 1.74 2.46 2.10 2.59 3.48 3.31 3.84 2.77
1010 CSMF 2.88 4.44 3.25 3.20 2.55 1.92 1.87 2.42 2.13 2.94 2.99 3.90 4.02 2.52 4.74 3.78 1.92 2.71 2.28 2.82 3.73 3.77 4.33 3.09
9101 COMF 1.58 2.67 1.85 1.26 1.06 0.97 0.89 1.25 0.91 1.32 1.28 1.78 1.81 1.59 2.82 2.24 1.26 1.65 1.55 1.84 2.49 1.68 2.17 1.65
9103 COMF 0.67 1.52 0.99 0.25 0.18 0.31 0.25 0.52 0.09 0.31 0.20 0.56 0.53 0.98 1.67 1.30 0.94 1.07 1.13 1.23 1.57 0.54 0.95 0.77
9105 COMF 0.23 0.93 0.60 -0.17 -0.21 -0.09 -0.13 0.13 -0.29 -0.14 -0.27 0.00 -0.05 0.63 1.11 0.92 0.76 0.83 0.93 0.98 1.12 0.01 0.39 0.36
9107 COMF 0.08 0.74 0.47 -0.29 -0.33 -0.23 -0.26 -0.01 -0.41 -0.28 -0.42 -0.18 -0.23 0.50 0.92 0.80 0.68 0.75 0.86 0.89 0.96 -0.17 0.20 0.22
9102 COMF 1.37 2.40 1.64 1.01 0.84 0.82 0.74 1.08 0.72 1.07 1.02 1.49 1.50 1.45 2.55 2.00 1.18 1.50 1.45 1.69 2.28 1.40 1.88 1.44
9104 COMF 0.60 1.43 0.93 0.18 0.12 0.25 0.19 0.46 0.03 0.23 0.13 0.47 0.44 0.93 1.58 1.23 0.92 1.03 1.10 1.19 1.50 0.46 0.86 0.71
9106 COMF 0.56 1.37 0.89 0.14 0.08 0.21 0.16 0.42 -0.01 0.19 0.08 0.42 0.38 0.90 1.53 1.20 0.90 1.01 1.08 1.17 1.46 0.40 0.81 0.67
9108 COMF 0.28 1.00 0.64 -0.12 -0.17 -0.04 -0.08 0.17 -0.25 -0.09 -0.22 0.06 0.02 0.67 1.17 0.96 0.78 0.86 0.95 1.01 1.17 0.07 0.45 0.40
9201 COMF 1.47 2.53 1.74 1.13 0.94 0.89 0.81 1.16 0.81 1.19 1.14 1.63 1.64 1.52 2.67 2.11 1.22 1.57 1.50 1.76 2.38 1.53 2.01 1.54
9203 COMF 0.94 1.86 1.23 0.53 0.43 0.52 0.45 0.74 0.32 0.59 0.51 0.91 0.89 1.17 2.01 1.55 1.03 1.22 1.24 1.40 1.85 0.86 1.30 1.02
9205 COMF 0.39 1.15 0.74 -0.02 -0.07 0.06 0.02 0.27 -0.15 0.02 -0.10 0.20 0.16 0.77 1.31 1.05 0.83 0.92 1.01 1.07 1.28 0.20 0.59 0.51
9207 COMF 0.23 0.94 0.60 -0.16 -0.21 -0.09 -0.13 0.13 -0.29 -0.14 -0.27 0.00 -0.05 0.63 1.11 0.92 0.76 0.83 0.93 0.98 1.12 0.01 0.39 0.36
9202 COMF 1.35 2.37 1.62 0.98 0.82 0.81 0.73 1.06 0.69 1.04 0.99 1.46 1.46 1.44 2.51 1.97 1.17 1.48 1.43 1.67 2.25 1.37 1.84 1.41
9204 COMF 0.98 1.91 1.27 0.56 0.46 0.54 0.47 0.76 0.36 0.63 0.55 0.96 0.94 1.19 2.05 1.59 1.04 1.24 1.26 1.42 1.88 0.90 1.35 1.06
9206 COMF 0.65 1.49 0.97 0.23 0.16 0.29 0.23 0.50 0.07 0.28 0.18 0.53 0.50 0.97 1.64 1.28 0.93 1.05 1.12 1.22 1.55 0.51 0.92 0.75
9208 COMF 0.24 0.94 0.61 -0.16 -0.20 -0.08 -0.12 0.13 -0.28 -0.14 -0.26 0.01 -0.04 0.64 1.12 0.93 0.76 0.84 0.93 0.98 1.12 0.02 0.39 0.36
Average 1.08 2.04 1.39 0.76 0.60 0.58 0.52 0.84 0.46 0.78 0.72 1.16 1.16 1.24 2.21 1.75 1.09 1.35 1.32 1.51 1.97 1.10 1.55 1.18
Archetype Model Type
High hazard locations
Risk score based on collapse risk for 50 year period

33
Table 14 : Risk score calculated for 150 year period using collapse risk, at high hazard locations
1 2 3 4 5 6 7 8 9 10 11 12 13 14 15 16 17 18 19 20 21 22 23 Average
1003 CSMF 1.96 3.33 2.27 2.01 1.53 1.08 1.01 1.49 1.23 1.91 1.95 2.69 2.79 1.68 3.57 2.80 1.16 1.83 1.52 1.99 2.85 2.55 3.08 2.10
1011 CSMF 1.02 2.10 1.28 0.69 0.48 0.41 0.33 0.68 0.35 0.75 0.72 1.22 1.25 1.03 2.25 1.66 0.72 1.08 1.00 1.27 1.93 1.11 1.61 1.08
5013 CSMF 0.81 1.85 1.08 0.44 0.28 0.28 0.20 0.52 0.16 0.51 0.46 0.94 0.95 0.90 1.99 1.43 0.65 0.94 0.91 1.13 1.72 0.84 1.32 0.88
5020 CSMF 0.54 1.50 0.82 0.13 0.01 0.09 0.01 0.31 -0.10 0.20 0.12 0.56 0.55 0.73 1.64 1.14 0.56 0.76 0.78 0.95 1.44 0.48 0.95 0.62
1008 CSMF 2.08 3.50 2.41 2.20 1.67 1.17 1.11 1.61 1.34 2.05 2.11 2.88 2.99 1.77 3.75 2.94 1.23 1.94 1.59 2.08 2.96 2.75 3.28 2.24
1012 CSMF 1.29 2.45 1.56 1.05 0.78 0.60 0.51 0.90 0.60 1.08 1.08 1.63 1.68 1.21 2.62 1.99 0.83 1.29 1.14 1.47 2.20 1.51 2.01 1.37
5014 CSMF 0.90 1.96 1.17 0.55 0.37 0.33 0.25 0.59 0.24 0.61 0.57 1.06 1.08 0.96 2.10 1.53 0.68 1.00 0.95 1.19 1.81 0.96 1.45 0.97
5021 CSMF 0.69 1.70 0.96 0.30 0.16 0.19 0.12 0.43 0.05 0.37 0.31 0.77 0.77 0.83 1.84 1.30 0.61 0.86 0.85 1.05 1.60 0.68 1.16 0.76
6011 CSMF 0.19 1.06 0.50 -0.24 -0.31 -0.18 -0.23 0.03 -0.40 -0.18 -0.28 0.10 0.07 0.50 1.20 0.80 0.45 0.57 0.63 0.74 1.09 0.06 0.49 0.29
6013 CSMF 0.03 0.84 0.36 -0.40 -0.46 -0.31 -0.36 -0.11 -0.54 -0.35 -0.46 -0.12 -0.15 0.38 0.99 0.66 0.40 0.49 0.57 0.64 0.93 -0.13 0.27 0.14
6020 CSMF -0.18 0.56 0.18 -0.59 -0.64 -0.50 -0.54 -0.29 -0.71 -0.56 -0.68 -0.39 -0.43 0.21 0.73 0.49 0.31 0.38 0.48 0.53 0.71 -0.38 0.00 -0.06
6021 CSMF 0.14 1.00 0.46 -0.29 -0.35 -0.21 -0.27 -0.01 -0.44 -0.23 -0.33 0.03 0.00 0.46 1.14 0.76 0.44 0.54 0.62 0.71 1.04 0.01 0.42 0.25
1009 CSMF 2.12 3.56 2.46 2.27 1.73 1.21 1.15 1.66 1.38 2.11 2.17 2.96 3.07 1.81 3.83 2.99 1.26 1.98 1.62 2.12 3.00 2.83 3.36 2.29
1010 CSMF 2.41 3.96 2.77 2.72 2.07 1.45 1.40 1.95 1.65 2.46 2.52 3.42 3.54 2.04 4.26 3.31 1.44 2.23 1.80 2.34 3.26 3.29 3.85 2.61
9101 COMF 1.11 2.19 1.38 0.79 0.58 0.49 0.41 0.77 0.44 0.84 0.81 1.31 1.33 1.11 2.34 1.76 0.79 1.17 1.08 1.36 2.02 1.20 1.69 1.17
9103 COMF 0.20 1.05 0.51 -0.23 -0.30 -0.17 -0.23 0.04 -0.39 -0.17 -0.27 0.09 0.06 0.51 1.19 0.82 0.46 0.59 0.65 0.76 1.10 0.06 0.48 0.30
9105 COMF -0.25 0.46 0.12 -0.64 -0.69 -0.57 -0.60 -0.35 -0.76 -0.62 -0.75 -0.48 -0.52 0.15 0.63 0.44 0.28 0.35 0.45 0.50 0.64 -0.47 -0.09 -0.12
9107 COMF -0.40 0.26 -0.01 -0.77 -0.81 -0.71 -0.74 -0.49 -0.89 -0.76 -0.90 -0.66 -0.71 0.02 0.45 0.33 0.20 0.27 0.38 0.42 0.48 -0.65 -0.28 -0.26
9102 COMF 0.89 1.92 1.17 0.53 0.37 0.35 0.27 0.60 0.24 0.59 0.54 1.01 1.02 0.97 2.07 1.52 0.70 1.02 0.97 1.21 1.80 0.92 1.40 0.96
9104 COMF 0.13 0.95 0.45 -0.30 -0.36 -0.23 -0.28 -0.02 -0.45 -0.24 -0.35 0.00 -0.03 0.46 1.11 0.76 0.44 0.55 0.62 0.71 1.03 -0.02 0.39 0.23
9106 COMF 0.08 0.90 0.41 -0.34 -0.40 -0.27 -0.32 -0.06 -0.49 -0.29 -0.40 -0.06 -0.09 0.42 1.05 0.72 0.42 0.53 0.60 0.69 0.98 -0.07 0.33 0.19
9108 COMF -0.20 0.52 0.17 -0.60 -0.64 -0.52 -0.56 -0.31 -0.72 -0.57 -0.70 -0.42 -0.46 0.20 0.69 0.48 0.31 0.38 0.48 0.53 0.69 -0.41 -0.03 -0.07
9201 COMF 0.99 2.05 1.26 0.65 0.47 0.42 0.34 0.68 0.33 0.71 0.67 1.15 1.16 1.04 2.20 1.63 0.74 1.09 1.02 1.28 1.90 1.05 1.53 1.06
9203 COMF 0.46 1.39 0.76 0.05 -0.05 0.04 -0.03 0.26 -0.15 0.12 0.03 0.44 0.42 0.69 1.53 1.07 0.55 0.74 0.77 0.92 1.37 0.38 0.83 0.55
9205 COMF -0.09 0.67 0.26 -0.50 -0.55 -0.42 -0.46 -0.21 -0.63 -0.46 -0.58 -0.28 -0.32 0.29 0.84 0.58 0.36 0.44 0.53 0.59 0.81 -0.27 0.11 0.03
9207 COMF -0.25 0.46 0.12 -0.64 -0.69 -0.57 -0.60 -0.35 -0.76 -0.62 -0.75 -0.48 -0.52 0.15 0.63 0.44 0.28 0.35 0.45 0.50 0.64 -0.47 -0.09 -0.12
9202 COMF 0.87 1.89 1.14 0.50 0.34 0.33 0.25 0.58 0.22 0.57 0.51 0.98 0.98 0.96 2.04 1.50 0.69 1.00 0.96 1.19 1.78 0.89 1.37 0.94
9204 COMF 0.50 1.43 0.79 0.09 -0.02 0.07 0.00 0.29 -0.12 0.15 0.07 0.48 0.47 0.72 1.57 1.11 0.56 0.76 0.78 0.94 1.40 0.43 0.87 0.58
9206 COMF 0.17 1.01 0.49 -0.25 -0.32 -0.19 -0.25 0.02 -0.41 -0.20 -0.30 0.06 0.03 0.49 1.16 0.80 0.45 0.58 0.64 0.74 1.07 0.03 0.45 0.27
9208 COMF -0.24 0.47 0.13 -0.64 -0.68 -0.56 -0.60 -0.35 -0.76 -0.61 -0.74 -0.47 -0.51 0.16 0.64 0.45 0.29 0.36 0.46 0.51 0.65 -0.46 -0.08 -0.11
Average 0.60 1.57 0.91 0.29 0.12 0.10 0.04 0.36 -0.02 0.31 0.24 0.68 0.68 0.76 1.74 1.27 0.61 0.87 0.84 1.04 1.50 0.62 1.07 0.70
Archetype Model Type
High hazard locations
Risk score based on collapse risk for 150 year period

34
Table 15 : PMFR values (τ = 50 years) at high hazard locations
1 2 3 4 5 6 7 8 9 10 11 12 13 14 15 16 17 18 19 20 21 22 23 Average
1003 CSMF 1.44 0.83 1.31 1.53 1.05 1.33 1.22 1.44 -0.14 1.67 1.59 1.81 1.80 1.33 0.59 1.06 1.42 1.25 1.36 1.08 0.40 1.70 2.80 1.30
1011 CSMF 0.84 0.30 0.76 0.54 0.34 0.78 0.67 0.84 -0.51 0.79 0.66 0.77 0.71 0.98 0.03 0.50 1.10 0.85 1.10 0.80 0.17 0.68 1.61 0.67
5013 CSMF 0.45 -0.34 0.32 0.11 -0.04 0.58 0.47 0.57 -0.98 0.40 0.24 0.25 0.16 0.69 -0.66 -0.05 0.97 0.52 0.87 0.42 -0.43 0.17 1.17 0.25
5020 CSMF -0.04 -1.11 -0.22 -0.42 -0.53 0.31 0.19 0.21 -1.56 -0.09 -0.30 -0.39 -0.52 0.32 -1.47 -0.70 0.80 0.11 0.58 -0.04 -1.13 -0.45 0.61 -0.25
1008 CSMF 1.40 0.70 1.24 1.55 1.04 1.36 1.25 1.44 -0.26 1.69 1.60 1.82 1.80 1.28 0.44 0.94 1.43 1.18 1.31 0.98 0.21 1.70 2.87 1.26
1012 CSMF 0.77 -0.07 0.58 0.55 0.29 0.84 0.72 0.84 -0.78 0.83 0.70 0.74 0.68 0.85 -0.39 0.23 1.09 0.69 0.98 0.55 -0.27 0.64 1.72 0.56
5014 CSMF 0.41 -0.49 0.24 0.09 -0.08 0.59 0.47 0.55 -1.09 0.40 0.23 0.22 0.12 0.63 -0.83 -0.17 0.95 0.44 0.81 0.32 -0.59 0.13 1.19 0.20
5021 CSMF -0.19 -1.47 -0.45 -0.54 -0.67 0.29 0.16 0.12 -1.84 -0.16 -0.38 -0.54 -0.68 0.15 -1.87 -1.01 0.73 -0.10 0.41 -0.30 -1.51 -0.60 0.57 -0.43
6011 CSMF 0.59 0.87 0.81 0.17 0.10 0.30 0.24 0.49 -0.20 0.26 0.15 0.43 0.37 0.92 0.80 0.89 0.93 0.96 1.08 1.06 0.92 0.40 0.92 0.59
6013 CSMF 0.39 0.50 0.61 -0.03 -0.08 0.16 0.11 0.34 -0.42 0.07 -0.06 0.16 0.09 0.78 0.42 0.64 0.87 0.84 1.00 0.91 0.60 0.15 0.69 0.38
6020 CSMF 0.14 0.03 0.35 -0.27 -0.31 -0.03 -0.08 0.14 -0.71 -0.17 -0.32 -0.18 -0.27 0.58 -0.07 0.33 0.78 0.68 0.89 0.72 0.20 -0.17 0.38 0.12
6021 CSMF 0.12 -0.48 0.13 -0.30 -0.35 0.19 0.11 0.24 -1.06 -0.08 -0.26 -0.23 -0.34 0.54 -0.72 -0.13 0.85 0.47 0.81 0.42 -0.39 -0.25 0.55 -0.01
1009 CSMF 0.92 -0.17 0.65 1.11 0.58 1.16 1.02 1.11 -0.95 1.30 1.17 1.27 1.23 0.84 -0.49 0.19 1.24 0.68 0.92 0.39 -0.67 1.16 2.49 0.75
1010 CSMF 0.67 -0.64 0.35 1.03 0.40 1.12 0.98 1.00 -1.38 1.19 1.03 1.12 1.06 0.58 -0.98 -0.25 1.16 0.38 0.67 0.00 -1.28 1.03 2.51 0.51
9101 COMF 1.48 2.00 1.61 1.16 0.96 0.96 0.87 1.21 0.56 1.26 1.20 1.60 1.57 1.51 1.97 1.82 1.25 1.53 1.50 1.65 1.84 1.48 2.08 1.44
9103 COMF 0.65 1.23 0.93 0.23 0.16 0.31 0.25 0.51 -0.01 0.30 0.19 0.51 0.47 0.97 1.28 1.14 0.94 1.04 1.12 1.18 1.30 0.49 0.94 0.70
9105 COMF 0.21 0.69 0.56 -0.18 -0.22 -0.09 -0.13 0.12 -0.37 -0.15 -0.28 -0.04 -0.09 0.62 0.78 0.80 0.76 0.81 0.93 0.94 0.88 -0.03 0.38 0.30
9107 COMF 0.06 0.44 0.41 -0.31 -0.36 -0.23 -0.27 -0.02 -0.51 -0.30 -0.44 -0.23 -0.30 0.48 0.53 0.65 0.68 0.72 0.85 0.84 0.68 -0.22 0.19 0.14
9102 COMF 1.31 1.93 1.50 0.95 0.79 0.82 0.74 1.06 0.49 1.04 0.98 1.38 1.35 1.41 1.94 1.72 1.18 1.43 1.42 1.57 1.82 1.28 1.83 1.30
9104 COMF 0.59 1.20 0.89 0.17 0.10 0.25 0.19 0.45 -0.05 0.23 0.12 0.44 0.40 0.92 1.26 1.11 0.92 1.01 1.09 1.15 1.28 0.42 0.86 0.65
9106 COMF 0.46 0.74 0.70 0.05 -0.01 0.20 0.15 0.39 -0.30 0.14 0.01 0.25 0.19 0.83 0.72 0.80 0.89 0.90 1.03 0.99 0.84 0.24 0.75 0.48
9108 COMF 0.20 0.45 0.49 -0.20 -0.24 -0.05 -0.09 0.15 -0.49 -0.14 -0.28 -0.08 -0.14 0.62 0.46 0.63 0.78 0.77 0.92 0.86 0.63 -0.06 0.40 0.24
9201 COMF 1.41 2.03 1.56 1.06 0.89 0.89 0.80 1.14 0.52 1.15 1.09 1.51 1.45 1.47 2.03 1.81 1.21 1.49 1.47 1.64 1.90 1.38 1.95 1.38
9203 COMF 0.88 1.37 1.10 0.47 0.37 0.51 0.44 0.72 0.12 0.56 0.46 0.80 0.76 1.12 1.36 1.26 1.03 1.15 1.22 1.28 1.36 0.75 1.27 0.88
9205 COMF 0.35 0.79 0.66 -0.06 -0.10 0.06 0.01 0.26 -0.29 0.00 -0.13 0.13 0.08 0.74 0.83 0.85 0.83 0.87 0.99 0.99 0.93 0.13 0.57 0.41
9207 COMF 0.18 0.50 0.49 -0.21 -0.25 -0.09 -0.13 0.11 -0.46 -0.17 -0.30 -0.09 -0.16 0.60 0.54 0.67 0.76 0.77 0.91 0.88 0.70 -0.08 0.36 0.24
9202 COMF 1.31 1.98 1.48 0.94 0.78 0.81 0.72 1.05 0.48 1.02 0.95 1.37 1.33 1.41 2.00 1.74 1.17 1.43 1.42 1.58 1.88 1.26 1.80 1.30
9204 COMF 0.91 1.38 1.12 0.50 0.39 0.54 0.47 0.74 0.13 0.59 0.50 0.83 0.79 1.14 1.36 1.27 1.04 1.16 1.23 1.28 1.36 0.78 1.31 0.90
9206 COMF 0.53 0.79 0.75 0.11 0.05 0.28 0.22 0.46 -0.26 0.22 0.09 0.34 0.28 0.88 0.76 0.83 0.92 0.92 1.06 1.01 0.87 0.32 0.85 0.53
9208 COMF 0.18 0.50 0.50 -0.21 -0.25 -0.09 -0.12 0.12 -0.46 -0.16 -0.30 -0.09 -0.15 0.60 0.54 0.67 0.76 0.78 0.91 0.88 0.70 -0.08 0.37 0.24
Average 0.62 0.55 0.71 0.32 0.16 0.47 0.39 0.59 -0.43 0.46 0.33 0.53 0.47 0.86 0.44 0.68 0.98 0.86 1.03 0.87 0.51 0.48 1.20 0.57
Archetype Model Type
High Hazard Locations
PMFR

35
Table 16 : PMFR values (τ = 150 years) at high hazard locations
1 2 3 4 5 6 7 8 9 10 11 12 13 14 15 16 17 18 19 20 21 22 23 Average
1003 CSMF 0.96 0.36 0.83 1.05 0.58 0.85 0.74 0.96 -0.62 1.19 1.11 1.33 1.32 0.85 0.11 0.58 0.95 0.77 0.88 0.60 -0.08 1.22 2.32 0.82
1011 CSMF 0.37 -0.17 0.28 0.06 -0.13 0.30 0.19 0.37 -0.98 0.31 0.18 0.30 0.23 0.51 -0.44 0.03 0.62 0.38 0.62 0.32 -0.31 0.20 1.14 0.19
5013 CSMF -0.02 -0.82 -0.16 -0.37 -0.52 0.10 -0.01 0.09 -1.46 -0.08 -0.24 -0.22 -0.32 0.21 -1.13 -0.53 0.49 0.04 0.39 -0.06 -0.90 -0.30 0.70 -0.22
5020 CSMF -0.52 -1.59 -0.70 -0.90 -1.00 -0.17 -0.29 -0.27 -2.03 -0.57 -0.77 -0.87 -1.00 -0.16 -1.95 -1.18 0.32 -0.37 0.10 -0.51 -1.60 -0.92 0.14 -0.73
1008 CSMF 0.92 0.22 0.77 1.08 0.56 0.88 0.77 0.97 -0.74 1.21 1.12 1.34 1.32 0.80 -0.03 0.46 0.96 0.71 0.83 0.50 -0.27 1.23 2.39 0.78
1012 CSMF 0.29 -0.55 0.11 0.07 -0.19 0.36 0.24 0.36 -1.26 0.36 0.23 0.27 0.20 0.37 -0.87 -0.25 0.61 0.21 0.50 0.08 -0.75 0.16 1.25 0.08
5014 CSMF -0.07 -0.97 -0.24 -0.39 -0.56 0.12 -0.01 0.07 -1.57 -0.08 -0.25 -0.26 -0.36 0.15 -1.30 -0.64 0.48 -0.04 0.33 -0.16 -1.07 -0.35 0.71 -0.28
5021 CSMF -0.66 -1.94 -0.92 -1.02 -1.15 -0.18 -0.32 -0.36 -2.32 -0.64 -0.86 -1.02 -1.15 -0.33 -2.35 -1.49 0.25 -0.58 -0.06 -0.77 -1.99 -1.08 0.09 -0.91
6011 CSMF 0.12 0.39 0.34 -0.31 -0.38 -0.18 -0.24 0.01 -0.67 -0.21 -0.33 -0.05 -0.10 0.45 0.33 0.41 0.45 0.48 0.61 0.59 0.44 -0.08 0.45 0.11
6013 CSMF -0.08 0.02 0.13 -0.50 -0.56 -0.32 -0.37 -0.14 -0.90 -0.40 -0.54 -0.32 -0.39 0.30 -0.06 0.16 0.39 0.36 0.52 0.44 0.12 -0.32 0.21 -0.10
6020 CSMF -0.34 -0.45 -0.13 -0.74 -0.78 -0.51 -0.56 -0.34 -1.18 -0.64 -0.80 -0.66 -0.74 0.10 -0.55 -0.14 0.31 0.21 0.41 0.25 -0.27 -0.65 -0.09 -0.36
6021 CSMF -0.36 -0.95 -0.34 -0.77 -0.83 -0.29 -0.36 -0.23 -1.54 -0.56 -0.74 -0.71 -0.82 0.07 -1.19 -0.61 0.37 0.00 0.33 -0.06 -0.87 -0.72 0.07 -0.48
1009 CSMF 0.44 -0.64 0.18 0.63 0.10 0.68 0.55 0.63 -1.42 0.82 0.69 0.79 0.75 0.36 -0.97 -0.28 0.76 0.20 0.45 -0.09 -1.15 0.69 2.01 0.27
1010 CSMF 0.19 -1.12 -0.13 0.56 -0.08 0.65 0.50 0.52 -1.86 0.72 0.55 0.65 0.59 0.10 -1.46 -0.73 0.68 -0.09 0.20 -0.48 -1.76 0.55 2.03 0.03
9101 COMF 1.00 1.52 1.14 0.68 0.48 0.49 0.39 0.73 0.08 0.78 0.73 1.12 1.09 1.03 1.49 1.34 0.78 1.05 1.03 1.17 1.36 1.00 1.60 0.96
9103 COMF 0.17 0.76 0.46 -0.25 -0.32 -0.17 -0.23 0.03 -0.49 -0.18 -0.29 0.04 0.00 0.49 0.80 0.67 0.46 0.56 0.64 0.70 0.82 0.01 0.46 0.22
9105 COMF -0.27 0.22 0.08 -0.66 -0.70 -0.57 -0.60 -0.36 -0.84 -0.63 -0.76 -0.51 -0.57 0.14 0.30 0.32 0.28 0.33 0.45 0.46 0.41 -0.50 -0.10 -0.18
9107 COMF -0.42 -0.03 -0.07 -0.79 -0.83 -0.71 -0.74 -0.49 -0.99 -0.77 -0.91 -0.71 -0.77 0.00 0.05 0.17 0.20 0.24 0.37 0.36 0.20 -0.70 -0.29 -0.33
9102 COMF 0.84 1.46 1.02 0.48 0.31 0.34 0.26 0.58 0.01 0.57 0.50 0.91 0.87 0.93 1.46 1.25 0.70 0.95 0.95 1.10 1.35 0.80 1.35 0.83
9104 COMF 0.11 0.72 0.41 -0.31 -0.37 -0.23 -0.28 -0.02 -0.53 -0.25 -0.36 -0.04 -0.08 0.44 0.78 0.64 0.44 0.53 0.61 0.68 0.80 -0.06 0.38 0.17
9106 COMF -0.01 0.26 0.23 -0.43 -0.49 -0.27 -0.33 -0.09 -0.77 -0.34 -0.47 -0.23 -0.29 0.35 0.25 0.33 0.42 0.42 0.56 0.51 0.36 -0.24 0.27 0.00
9108 COMF -0.28 -0.03 0.01 -0.67 -0.72 -0.52 -0.57 -0.33 -0.96 -0.61 -0.75 -0.55 -0.62 0.14 -0.01 0.15 0.30 0.29 0.44 0.39 0.15 -0.54 -0.08 -0.23
9201 COMF 0.93 1.56 1.08 0.59 0.41 0.41 0.32 0.66 0.05 0.68 0.61 1.03 0.98 0.99 1.56 1.33 0.73 1.01 0.99 1.16 1.42 0.90 1.47 0.91
9203 COMF 0.40 0.89 0.63 -0.01 -0.11 0.04 -0.03 0.24 -0.36 0.08 -0.02 0.32 0.28 0.65 0.89 0.78 0.55 0.67 0.74 0.80 0.89 0.27 0.79 0.41
9205 COMF -0.12 0.31 0.18 -0.53 -0.58 -0.42 -0.46 -0.22 -0.77 -0.48 -0.60 -0.35 -0.40 0.27 0.35 0.37 0.36 0.40 0.51 0.52 0.46 -0.34 0.09 -0.06
9207 COMF -0.30 0.03 0.02 -0.69 -0.73 -0.57 -0.61 -0.36 -0.94 -0.64 -0.78 -0.57 -0.63 0.12 0.07 0.19 0.28 0.30 0.44 0.40 0.22 -0.56 -0.12 -0.24
9202 COMF 0.83 1.50 1.01 0.46 0.30 0.33 0.24 0.57 0.00 0.55 0.48 0.90 0.85 0.93 1.52 1.27 0.69 0.95 0.94 1.11 1.40 0.78 1.32 0.82
9204 COMF 0.43 0.90 0.64 0.02 -0.08 0.06 -0.01 0.27 -0.35 0.12 0.02 0.35 0.32 0.66 0.89 0.79 0.56 0.68 0.75 0.81 0.89 0.30 0.83 0.43
9206 COMF 0.06 0.31 0.27 -0.36 -0.43 -0.20 -0.26 -0.02 -0.74 -0.26 -0.39 -0.14 -0.20 0.40 0.28 0.36 0.45 0.44 0.59 0.54 0.39 -0.16 0.37 0.06
9208 COMF -0.29 0.03 0.02 -0.69 -0.73 -0.56 -0.60 -0.36 -0.94 -0.64 -0.78 -0.57 -0.63 0.12 0.06 0.19 0.28 0.30 0.44 0.40 0.22 -0.55 -0.11 -0.23
Average 0.14 0.07 0.24 -0.16 -0.32 -0.01 -0.09 0.12 -0.90 -0.02 -0.15 0.05 -0.01 0.38 -0.04 0.20 0.50 0.38 0.55 0.39 0.03 0.00 0.72 0.09
Archetype Model Type
High Hazard Locations
PMFR

36
PMFR Values of High Hazard Locations
For high hazard locations and with a τ value of 150 years, the PMFR value averaged over
all the building models and all the locations is 0.09 ≈ 0. This indicates that, the collapse
probabilities conditioned on MCER shaking level and the collapse risks for a 150 year period are
similar.
However, this is not the case for high hazard locations when τ = 50 years. Also, as we can
see from tables 16 and 17, several values are yellow colored. This indicates that for several
building-location combinations, the PMFR is not near zero. Hence, to address the variation in the
values, a deterministic sensitivity study is performed to check for the parameters to which the
PMFR value is most sensitive.
The following tables show the collapse probabilities, collapse risks, scores, risk scores and
PMFR values for the buildings at medium hazard locations. Table 19 shows the score calculated
using collapse probabilities at medium hazard locations. This table is color coded so that as the
color varies from red color for the lowest value of score in the table to green color which is the
highest value of score in the table. This representation is chosen to show that a lower value of score
represents a higher probability of collapse under MCER shaking level ground motion. In the table,
we can see that the collapse probabilities of COMF buildings are higher when compared with the
collapse probabilities of CSMF buildings. This is because CSMF building models are designed
better to withstand earthquakes.
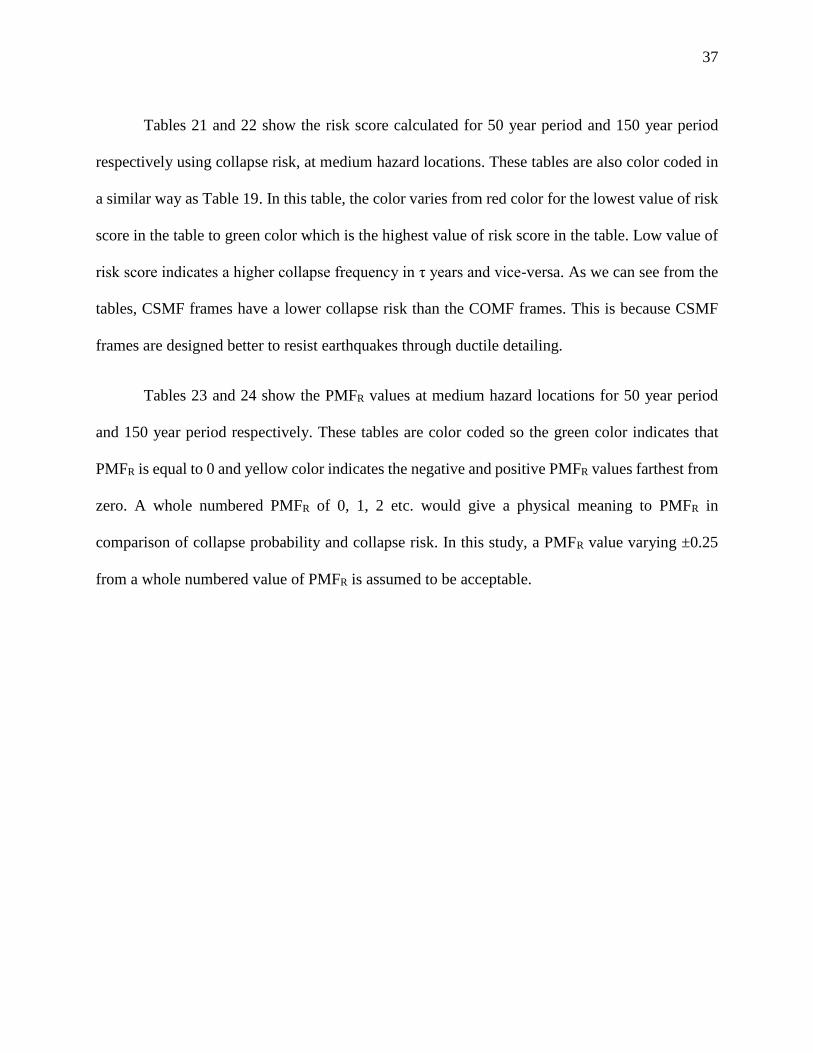
37
Tables 21 and 22 show the risk score calculated for 50 year period and 150 year period
respectively using collapse risk, at medium hazard locations. These tables are also color coded in
a similar way as Table 19. In this table, the color varies from red color for the lowest value of risk
score in the table to green color which is the highest value of risk score in the table. Low value of
risk score indicates a higher collapse frequency in τ years and vice-versa. As we can see from the
tables, CSMF frames have a lower collapse risk than the COMF frames. This is because CSMF
frames are designed better to resist earthquakes through ductile detailing.
Tables 23 and 24 show the PMFR values at medium hazard locations for 50 year period
and 150 year period respectively. These tables are color coded so the green color indicates that
PMFR is equal to 0 and yellow color indicates the negative and positive PMFR values farthest from
zero. A whole numbered PMFR of 0, 1, 2 etc. would give a physical meaning to PMFR in
comparison of collapse probability and collapse risk. In this study, a PMFR value varying ±0.25
from a whole numbered value of PMFR is assumed to be acceptable.

38
Table 17 : Collapse probabilities conditioned on MCER SMT shaking at medium hazard locations
1 2 3 4 5 6 7 8 9 10 11 12 13 14 15 16 17 18 19 20 21 Average
1003 CSMF 0.00 0.01 0.00 0.00 0.00 0.00 0.00 0.00 0.00 0.00 0.00 0.00 0.00 0.00 0.00 0.00 0.00 0.00 0.00 0.00 0.00 0.00
1011 CSMF 0.02 0.04 0.00 0.00 0.01 0.00 0.00 0.00 0.00 0.00 0.00 0.01 0.00 0.01 0.00 0.00 0.00 0.00 0.00 0.00 0.00 0.00
5013 CSMF 0.01 0.02 0.00 0.00 0.00 0.00 0.00 0.00 0.00 0.00 0.00 0.00 0.00 0.00 0.00 0.00 0.00 0.00 0.00 0.00 0.00 0.00
5020 CSMF 0.00 0.01 0.00 0.00 0.00 0.00 0.00 0.00 0.00 0.00 0.00 0.00 0.00 0.00 0.00 0.00 0.00 0.00 0.00 0.00 0.00 0.00
1008 CSMF 0.00 0.01 0.00 0.00 0.00 0.00 0.00 0.00 0.00 0.00 0.00 0.00 0.00 0.00 0.00 0.00 0.00 0.00 0.00 0.00 0.00 0.00
1012 CSMF 0.00 0.01 0.00 0.00 0.00 0.00 0.00 0.00 0.00 0.00 0.00 0.00 0.00 0.00 0.00 0.00 0.00 0.00 0.00 0.00 0.00 0.00
5014 CSMF 0.01 0.01 0.00 0.00 0.00 0.00 0.00 0.00 0.00 0.00 0.00 0.00 0.00 0.00 0.00 0.00 0.00 0.00 0.00 0.00 0.00 0.00
5021 CSMF 0.00 0.00 0.00 0.00 0.00 0.00 0.00 0.00 0.00 0.00 0.00 0.00 0.00 0.00 0.00 0.00 0.00 0.00 0.00 0.00 0.00 0.00
6011 CSMF 0.38 0.49 0.04 0.11 0.29 0.01 0.21 0.04 0.00 0.03 0.00 0.29 0.08 0.23 0.05 0.10 0.06 0.10 0.01 0.00 0.00 0.12
6013 CSMF 0.29 0.40 0.02 0.07 0.21 0.00 0.15 0.02 0.00 0.02 0.00 0.21 0.05 0.17 0.03 0.07 0.04 0.07 0.01 0.00 0.00 0.09
6020 CSMF 0.21 0.30 0.01 0.04 0.15 0.00 0.09 0.01 0.00 0.01 0.00 0.14 0.03 0.11 0.02 0.04 0.02 0.04 0.00 0.00 0.00 0.06
6021 CSMF 0.04 0.06 0.00 0.00 0.02 0.00 0.01 0.00 0.00 0.00 0.00 0.02 0.00 0.01 0.00 0.00 0.00 0.00 0.00 0.00 0.00 0.01
1009 CSMF 0.00 0.00 0.00 0.00 0.00 0.00 0.00 0.00 0.00 0.00 0.00 0.00 0.00 0.00 0.00 0.00 0.00 0.00 0.00 0.00 0.00 0.00
1010 CSMF 0.00 0.00 0.00 0.00 0.00 0.00 0.00 0.00 0.00 0.00 0.00 0.00 0.00 0.00 0.00 0.00 0.00 0.00 0.00 0.00 0.00 0.00
9101 COMF 0.31 0.31 0.05 0.12 0.28 0.01 0.21 0.05 0.01 0.05 0.00 0.26 0.03 0.13 0.01 0.04 0.03 0.07 0.02 0.01 0.01 0.10
9103 COMF 0.68 0.76 0.21 0.36 0.60 0.08 0.51 0.21 0.06 0.20 0.04 0.59 0.31 0.54 0.24 0.36 0.27 0.36 0.10 0.06 0.06 0.31
9105 COMF 0.73 0.80 0.26 0.42 0.66 0.10 0.57 0.26 0.08 0.24 0.05 0.65 0.37 0.60 0.29 0.41 0.33 0.42 0.13 0.08 0.08 0.36
9107 COMF 0.68 0.76 0.21 0.36 0.59 0.08 0.50 0.21 0.06 0.19 0.04 0.59 0.31 0.54 0.24 0.35 0.27 0.35 0.10 0.06 0.06 0.31
9102 COMF 0.46 0.45 0.11 0.21 0.42 0.03 0.33 0.10 0.02 0.10 0.00 0.39 0.06 0.23 0.03 0.08 0.06 0.14 0.04 0.02 0.02 0.16
9104 COMF 0.74 0.81 0.27 0.43 0.66 0.10 0.57 0.26 0.08 0.25 0.05 0.66 0.37 0.61 0.30 0.42 0.33 0.42 0.13 0.08 0.08 0.36
9106 COMF 0.38 0.48 0.06 0.13 0.30 0.01 0.23 0.06 0.01 0.05 0.01 0.30 0.10 0.25 0.07 0.13 0.09 0.13 0.02 0.01 0.01 0.13
9108 COMF 0.44 0.54 0.08 0.17 0.36 0.02 0.27 0.08 0.01 0.07 0.01 0.35 0.13 0.30 0.09 0.16 0.11 0.16 0.03 0.01 0.01 0.16
9201 COMF 0.39 0.38 0.10 0.18 0.38 0.03 0.32 0.10 0.02 0.09 0.00 0.33 0.04 0.18 0.02 0.05 0.04 0.10 0.04 0.02 0.02 0.13
9203 COMF 0.48 0.58 0.10 0.19 0.40 0.03 0.31 0.09 0.02 0.09 0.01 0.39 0.16 0.34 0.12 0.19 0.13 0.19 0.04 0.02 0.02 0.19
9205 COMF 0.60 0.69 0.16 0.29 0.52 0.05 0.43 0.16 0.04 0.14 0.02 0.51 0.24 0.46 0.18 0.28 0.21 0.28 0.07 0.04 0.04 0.26
9207 COMF 0.54 0.63 0.12 0.23 0.45 0.04 0.36 0.12 0.03 0.11 0.02 0.45 0.20 0.39 0.14 0.23 0.17 0.23 0.05 0.03 0.03 0.22
9202 COMF 0.48 0.47 0.14 0.25 0.47 0.04 0.40 0.14 0.03 0.13 0.00 0.41 0.07 0.25 0.04 0.08 0.07 0.15 0.06 0.03 0.03 0.18
9204 COMF 0.45 0.55 0.09 0.17 0.37 0.02 0.29 0.08 0.02 0.08 0.01 0.37 0.14 0.32 0.10 0.17 0.12 0.17 0.03 0.02 0.02 0.17
9206 COMF 0.34 0.43 0.05 0.11 0.26 0.01 0.19 0.05 0.01 0.04 0.00 0.26 0.09 0.22 0.06 0.11 0.07 0.11 0.02 0.01 0.01 0.12
9208 COMF 0.53 0.63 0.12 0.23 0.45 0.04 0.36 0.12 0.03 0.11 0.01 0.44 0.19 0.39 0.14 0.22 0.16 0.23 0.05 0.02 0.02 0.21
Average 0.31 0.35 0.07 0.14 0.26 0.02 0.21 0.07 0.02 0.07 0.01 0.25 0.10 0.21 0.07 0.12 0.09 0.12 0.03 0.02 0.02 0.12
Collapse probability of buildings given MCER level shaking(medium hazard)
Medium hazard location
Archetype Model type

39
Table 18 : Score calculated using collapse probabilities at medium hazard locations
1 2 3 4 5 6 7 8 9 10 11 12 13 14 15 16 17 18 19 20 21 Average
1003 CSMF 2.31 1.98 4.55 3.68 2.63 6.00 3.01 4.59 6.34 4.69 6.99 2.65 3.93 2.87 4.37 3.70 4.15 3.69 5.65 6.39 6.40 4.31
1011 CSMF 1.71 1.43 3.65 2.88 1.98 4.95 2.31 3.68 5.25 3.77 5.82 2.00 3.11 2.19 3.47 2.90 3.30 2.90 4.63 5.29 5.31 3.45
5013 CSMF 2.04 1.73 4.15 3.33 2.35 5.54 2.70 4.19 5.86 4.29 6.47 2.36 3.57 2.57 3.96 3.35 3.78 3.34 5.21 5.91 5.93 3.93
5020 CSMF 2.41 2.07 4.69 3.81 2.74 6.17 3.13 4.74 6.51 4.84 7.15 2.76 4.07 2.99 4.49 3.83 4.29 3.82 5.82 6.56 6.58 4.45
1008 CSMF 2.57 2.21 4.92 4.01 2.91 6.44 3.31 4.97 6.79 5.07 7.47 2.93 4.28 3.17 4.74 4.04 4.51 4.03 6.08 6.84 6.86 4.68
1012 CSMF 2.32 1.99 4.57 3.70 2.65 6.03 3.03 4.61 6.37 4.71 7.00 2.67 3.96 2.89 4.37 3.72 4.18 3.71 5.68 6.41 6.43 4.33
5014 CSMF 2.26 1.94 4.48 3.62 2.59 5.93 2.96 4.52 6.26 4.62 6.89 2.60 3.87 2.82 4.29 3.64 4.09 3.63 5.58 6.31 6.33 4.25
5021 CSMF 2.89 2.51 5.38 4.42 3.26 6.97 3.68 5.43 7.33 5.54 8.01 3.28 4.71 3.53 5.16 4.45 4.95 4.44 6.59 7.38 7.40 5.11
6011 CSMF 0.42 0.31 1.39 0.97 0.54 2.18 0.68 1.42 2.37 1.47 2.74 0.54 1.09 0.63 1.29 0.99 1.20 0.98 1.98 2.40 2.41 1.33
6013 CSMF 0.53 0.40 1.63 1.16 0.67 2.48 0.84 1.65 2.69 1.71 3.08 0.68 1.30 0.77 1.52 1.18 1.41 1.17 2.27 2.72 2.73 1.55
6020 CSMF 0.68 0.52 1.91 1.39 0.83 2.84 1.03 1.93 3.06 2.00 3.48 0.84 1.54 0.96 1.79 1.41 1.67 1.40 2.61 3.09 3.10 1.81
6021 CSMF 1.44 1.19 3.22 2.51 1.68 4.44 1.98 3.25 4.72 3.33 5.26 1.70 2.72 1.87 3.05 2.53 2.89 2.52 4.14 4.76 4.78 3.05
1009 CSMF 3.39 2.97 6.08 5.05 3.79 7.77 4.25 6.13 8.15 6.24 8.87 3.81 5.36 4.08 5.85 5.08 5.62 5.07 7.37 8.21 8.23 5.78
1010 CSMF 4.16 3.69 7.13 6.01 4.61 8.97 5.12 7.19 9.38 7.31 10.16 4.64 6.34 4.94 6.88 6.04 6.63 6.03 8.53 9.44 9.46 6.79
9101 COMF 0.50 0.51 1.28 0.93 0.55 1.92 0.68 1.30 2.07 1.34 3.33 0.59 1.54 0.87 1.87 1.45 1.55 1.14 1.76 2.09 2.10 1.40
9103 COMF 0.17 0.12 0.67 0.44 0.22 1.11 0.30 0.68 1.23 0.71 1.44 0.23 0.51 0.27 0.61 0.45 0.56 0.45 1.00 1.24 1.25 0.65
9105 COMF 0.14 0.09 0.58 0.38 0.18 0.99 0.25 0.59 1.10 0.62 1.30 0.19 0.43 0.22 0.53 0.38 0.49 0.38 0.89 1.11 1.12 0.57
9107 COMF 0.17 0.12 0.67 0.45 0.23 1.12 0.30 0.69 1.23 0.71 1.45 0.23 0.51 0.27 0.62 0.45 0.57 0.45 1.01 1.25 1.26 0.66
9102 COMF 0.34 0.35 0.97 0.68 0.38 1.51 0.48 0.98 1.65 1.02 2.77 0.40 1.19 0.63 1.47 1.12 1.20 0.85 1.38 1.67 1.67 1.08
9104 COMF 0.13 0.09 0.57 0.37 0.18 0.98 0.24 0.58 1.08 0.61 1.29 0.18 0.43 0.22 0.52 0.38 0.48 0.37 0.87 1.10 1.10 0.56
9106 COMF 0.42 0.32 1.22 0.88 0.52 1.85 0.64 1.24 2.00 1.28 2.29 0.53 0.98 0.60 1.14 0.89 1.07 0.89 1.69 2.02 2.03 1.17
9108 COMF 0.36 0.27 1.10 0.78 0.45 1.68 0.56 1.11 1.83 1.15 2.10 0.45 0.87 0.52 1.02 0.79 0.95 0.79 1.54 1.85 1.86 1.05
9201 COMF 0.41 0.42 1.01 0.74 0.42 1.56 0.50 1.02 1.70 1.06 3.03 0.49 1.35 0.74 1.65 1.27 1.36 0.98 1.42 1.72 1.73 1.17
9203 COMF 0.31 0.24 1.01 0.71 0.40 1.57 0.50 1.02 1.71 1.06 1.97 0.40 0.80 0.46 0.94 0.72 0.87 0.72 1.43 1.73 1.74 0.97
9205 COMF 0.22 0.16 0.80 0.54 0.29 1.29 0.37 0.81 1.41 0.84 1.65 0.29 0.61 0.34 0.74 0.55 0.68 0.55 1.16 1.43 1.43 0.77
9207 COMF 0.27 0.20 0.91 0.63 0.34 1.44 0.44 0.92 1.57 0.96 1.82 0.35 0.71 0.40 0.84 0.64 0.78 0.64 1.31 1.59 1.59 0.87
9202 COMF 0.32 0.33 0.84 0.61 0.33 1.35 0.40 0.85 1.47 0.89 2.71 0.39 1.15 0.60 1.43 1.08 1.16 0.82 1.22 1.49 1.50 1.00
9204 COMF 0.34 0.26 1.07 0.76 0.43 1.65 0.54 1.09 1.79 1.12 2.06 0.44 0.85 0.50 1.00 0.77 0.93 0.76 1.50 1.81 1.82 1.02
9206 COMF 0.47 0.37 1.33 0.97 0.58 1.98 0.71 1.34 2.13 1.39 2.44 0.59 1.07 0.66 1.24 0.98 1.16 0.97 1.82 2.16 2.16 1.26
9208 COMF 0.27 0.20 0.92 0.64 0.35 1.46 0.45 0.94 1.59 0.97 1.84 0.36 0.72 0.41 0.86 0.65 0.79 0.65 1.32 1.61 1.61 0.89
Average 1.13 0.97 2.42 1.90 1.30 3.34 1.51 2.45 3.55 2.51 4.10 1.32 2.12 1.47 2.39 1.98 2.24 1.94 3.11 3.59 3.60 2.33
Archetype Model type
Medium hazard location
Score based on collapse probability

40
Table 19 : Annual collapse risk calculated using hazard curves at medium hazard locations
1 2 3 4 5 6 7 8 9 10 11 12 13 14 15 16 17 18 19 20 21 Average
1003 CSMF 6E-06 2E-06 9E-07 8E-07 3E-06 5E-07 5E-06 1E-05 7E-07 2E-06 2E-07 4E-06 6E-07 2E-06 4E-07 7E-07 8E-07 1E-06 2E-06 2E-06 1E-06 2E-06
1011 CSMF 1E-04 1E-04 2E-05 2E-05 7E-05 8E-06 7E-05 6E-05 8E-06 2E-05 3E-06 9E-05 2E-05 6E-05 1E-05 2E-05 2E-05 3E-05 2E-05 2E-05 1E-05 4E-05
5013 CSMF 2E-04 3E-04 3E-05 4E-05 1E-04 1E-05 1E-04 8E-05 1E-05 4E-05 6E-06 2E-04 4E-05 1E-04 3E-05 5E-05 3E-05 5E-05 3E-05 3E-05 2E-05 7E-05
5020 CSMF 4E-04 8E-04 7E-05 1E-04 3E-04 3E-05 2E-04 1E-04 3E-05 8E-05 2E-05 3E-04 1E-04 3E-04 8E-05 1E-04 9E-05 1E-04 6E-05 5E-05 4E-05 2E-04
1008 CSMF 4E-06 1E-06 6E-07 5E-07 2E-06 3E-07 3E-06 9E-06 5E-07 1E-06 1E-07 3E-06 4E-07 1E-06 3E-07 5E-07 6E-07 9E-07 1E-06 2E-06 1E-06 2E-06
1012 CSMF 5E-05 4E-05 7E-06 8E-06 3E-05 3E-06 3E-05 4E-05 4E-06 1E-05 1E-06 4E-05 8E-06 3E-05 5E-06 9E-06 7E-06 1E-05 9E-06 9E-06 7E-06 2E-05
5014 CSMF 2E-04 2E-04 2E-05 3E-05 1E-04 1E-05 9E-05 7E-05 1E-05 3E-05 5E-06 1E-04 3E-05 9E-05 2E-05 4E-05 3E-05 4E-05 2E-05 2E-05 2E-05 5E-05
5021 CSMF 3E-04 5E-04 4E-05 6E-05 2E-04 2E-05 2E-04 9E-05 2E-05 5E-05 1E-05 2E-04 7E-05 2E-04 5E-05 8E-05 5E-05 8E-05 4E-05 3E-05 3E-05 1E-04
6011 CSMF 1E-03 3E-03 2E-04 3E-04 9E-04 9E-05 5E-04 2E-04 9E-05 2E-04 6E-05 8E-04 3E-04 6E-04 2E-04 4E-04 3E-04 3E-04 1E-04 1E-04 1E-04 5E-04
6013 CSMF 2E-03 5E-03 3E-04 6E-04 2E-03 2E-04 8E-04 3E-04 1E-04 3E-04 1E-04 1E-03 5E-04 1E-03 4E-04 6E-04 4E-04 6E-04 2E-04 2E-04 1E-04 8E-04
6020 CSMF 3E-03 1E-02 7E-04 1E-03 3E-03 3E-04 1E-03 5E-04 3E-04 6E-04 2E-04 2E-03 9E-04 2E-03 7E-04 1E-03 8E-04 1E-03 4E-04 3E-04 3E-04 1E-03
6021 CSMF 1E-03 4E-03 2E-04 4E-04 1E-03 1E-04 6E-04 2E-04 1E-04 2E-04 7E-05 8E-04 4E-04 7E-04 3E-04 4E-04 3E-04 4E-04 2E-04 1E-04 1E-04 5E-04
1009 CSMF 3E-06 1E-06 5E-07 5E-07 2E-06 3E-07 3E-06 8E-06 4E-07 1E-06 1E-07 2E-06 3E-07 1E-06 2E-07 4E-07 5E-07 8E-07 1E-06 2E-06 1E-06 1E-06
1010 CSMF 1E-06 4E-07 2E-07 2E-07 8E-07 1E-07 1E-06 5E-06 2E-07 6E-07 6E-08 1E-06 1E-07 4E-07 9E-08 1E-07 2E-07 4E-07 7E-07 9E-07 6E-07 7E-07
9101 COMF 9E-05 1E-04 1E-05 2E-05 6E-05 7E-06 5E-05 5E-05 7E-06 2E-05 3E-06 7E-05 2E-05 5E-05 1E-05 2E-05 1E-05 2E-05 1E-05 1E-05 1E-05 3E-05
9103 COMF 1E-03 3E-03 2E-04 4E-04 9E-04 1E-04 5E-04 2E-04 9E-05 2E-04 6E-05 7E-04 3E-04 6E-04 2E-04 4E-04 3E-04 4E-04 1E-04 1E-04 1E-04 5E-04
9105 COMF 3E-03 1E-02 9E-04 2E-03 4E-03 4E-04 2E-03 6E-04 4E-04 7E-04 3E-04 2E-03 1E-03 2E-03 9E-04 1E-03 1E-03 1E-03 4E-04 3E-04 3E-04 2E-03
9107 COMF 5E-03 2E-02 1E-03 3E-03 6E-03 7E-04 2E-03 9E-04 6E-04 1E-03 5E-04 2E-03 1E-03 2E-03 1E-03 2E-03 2E-03 2E-03 7E-04 5E-04 5E-04 3E-03
9102 COMF 2E-04 3E-04 3E-05 4E-05 1E-04 1E-05 9E-05 6E-05 1E-05 3E-05 6E-06 1E-04 4E-05 1E-04 3E-05 4E-05 3E-05 5E-05 2E-05 2E-05 2E-05 6E-05
9104 COMF 1E-03 4E-03 3E-04 4E-04 1E-03 1E-04 6E-04 2E-04 1E-04 2E-04 8E-05 8E-04 4E-04 7E-04 3E-04 4E-04 3E-04 4E-04 2E-04 1E-04 1E-04 6E-04
9106 COMF 1E-03 5E-03 3E-04 5E-04 1E-03 1E-04 7E-04 3E-04 1E-04 3E-04 9E-05 9E-04 4E-04 8E-04 3E-04 5E-04 4E-04 5E-04 2E-04 1E-04 1E-04 7E-04
9108 COMF 3E-03 1E-02 7E-04 1E-03 3E-03 3E-04 1E-03 5E-04 3E-04 6E-04 2E-04 2E-03 9E-04 2E-03 8E-04 1E-03 9E-04 1E-03 4E-04 3E-04 3E-04 2E-03
9201 COMF 1E-04 2E-04 2E-05 3E-05 8E-05 9E-06 7E-05 5E-05 9E-06 2E-05 4E-06 9E-05 3E-05 7E-05 2E-05 3E-05 2E-05 3E-05 2E-05 2E-05 1E-05 4E-05
9203 COMF 5E-04 1E-03 9E-05 1E-04 4E-04 4E-05 3E-04 1E-04 4E-05 1E-04 2E-05 4E-04 1E-04 3E-04 1E-04 2E-04 1E-04 2E-04 7E-05 6E-05 5E-05 2E-04
9205 COMF 2E-03 8E-03 5E-04 9E-04 2E-03 2E-04 1E-03 4E-04 2E-04 4E-04 2E-04 1E-03 7E-04 1E-03 6E-04 8E-04 6E-04 8E-04 3E-04 2E-04 2E-04 1E-03
9207 COMF 3E-03 1E-02 8E-04 2E-03 4E-03 4E-04 2E-03 6E-04 4E-04 7E-04 3E-04 2E-03 1E-03 2E-03 9E-04 1E-03 1E-03 1E-03 4E-04 3E-04 3E-04 2E-03
9202 COMF 2E-04 3E-04 3E-05 4E-05 1E-04 1E-05 1E-04 7E-05 1E-05 3E-05 6E-06 1E-04 4E-05 1E-04 3E-05 5E-05 3E-05 5E-05 2E-05 2E-05 2E-05 6E-05
9204 COMF 5E-04 1E-03 8E-05 1E-04 4E-04 4E-05 3E-04 1E-04 4E-05 9E-05 2E-05 4E-04 1E-04 3E-04 1E-04 1E-04 1E-04 1E-04 6E-05 5E-05 4E-05 2E-04
9206 COMF 1E-03 3E-03 2E-04 4E-04 1E-03 1E-04 6E-04 2E-04 1E-04 2E-04 7E-05 8E-04 3E-04 7E-04 3E-04 4E-04 3E-04 4E-04 1E-04 1E-04 1E-04 5E-04
9208 COMF 3E-03 1E-02 8E-04 2E-03 4E-03 4E-04 2E-03 6E-04 3E-04 7E-04 3E-04 2E-03 1E-03 2E-03 9E-04 1E-03 1E-03 1E-03 4E-04 3E-04 3E-04 2E-03
Average 1E-03 4E-03 3E-04 5E-04 1E-03 1E-04 6E-04 2E-04 1E-04 2E-04 9E-05 7E-04 3E-04 6E-04 3E-04 4E-04 3E-04 4E-04 2E-04 1E-04 1E-04 6E-04
Archetype Model type
Medium hazard locations
Annual collapse risk to a building due to seismic hazard at a location

41
Table 20 : Risk score calculated for 50 year period using collapse risk, at medium hazard locations
1 2 3 4 5 6 7 8 9 10 11 12 13 14 15 16 17 18 19 20 21 Average
1003 CSMF 3.54 3.94 4.36 4.40 3.79 4.64 3.64 3.26 4.47 4.08 5.05 3.68 4.50 3.95 4.67 4.44 4.38 4.18 4.04 3.94 4.13 4.15
1011 CSMF 2.25 2.20 3.09 2.99 2.48 3.40 2.49 2.56 3.40 2.97 3.80 2.37 2.96 2.50 3.13 2.90 3.06 2.84 3.07 3.07 3.20 2.89
5013 CSMF 2.00 1.85 2.82 2.69 2.20 3.14 2.25 2.42 3.16 2.73 3.50 2.12 2.66 2.22 2.81 2.60 2.76 2.56 2.85 2.88 2.99 2.63
5020 CSMF 1.68 1.38 2.46 2.28 1.82 2.79 1.95 2.23 2.82 2.40 3.09 1.79 2.27 1.88 2.40 2.21 2.37 2.19 2.55 2.61 2.70 2.28
1008 CSMF 3.71 4.16 4.52 4.58 3.95 4.80 3.79 3.36 4.60 4.21 5.19 3.85 4.70 4.15 4.85 4.63 4.53 4.34 4.16 4.05 4.24 4.30
1012 CSMF 2.61 2.69 3.46 3.40 2.86 3.76 2.81 2.75 3.73 3.30 4.19 2.74 3.40 2.89 3.57 3.34 3.46 3.23 3.36 3.33 3.48 3.26
5014 CSMF 2.11 2.00 2.94 2.82 2.32 3.25 2.35 2.48 3.27 2.83 3.63 2.23 2.79 2.34 2.95 2.73 2.89 2.68 2.95 2.96 3.09 2.74
5021 CSMF 1.86 1.64 2.66 2.51 2.03 2.99 2.12 2.34 3.01 2.58 3.32 1.97 2.48 2.07 2.63 2.43 2.59 2.40 2.72 2.76 2.87 2.48
6011 CSMF 1.28 0.83 1.99 1.78 1.34 2.33 1.57 1.97 2.37 1.99 2.55 1.43 1.81 1.49 1.92 1.75 1.89 1.76 2.17 2.27 2.32 1.85
6013 CSMF 1.10 0.57 1.77 1.54 1.11 2.10 1.39 1.82 2.15 1.80 2.29 1.27 1.61 1.32 1.70 1.55 1.66 1.56 1.99 2.10 2.13 1.64
6020 CSMF 0.87 0.26 1.48 1.23 0.83 1.81 1.16 1.62 1.86 1.56 1.97 1.09 1.36 1.12 1.44 1.30 1.39 1.32 1.75 1.87 1.87 1.39
6021 CSMF 1.23 0.75 1.93 1.71 1.28 2.26 1.52 1.93 2.31 1.94 2.47 1.38 1.75 1.44 1.86 1.69 1.82 1.70 2.12 2.22 2.26 1.79
1009 CSMF 3.78 4.25 4.58 4.65 4.02 4.86 3.85 3.40 4.65 4.26 5.24 3.91 4.77 4.23 4.92 4.70 4.59 4.40 4.20 4.09 4.29 4.36
1010 CSMF 4.21 4.74 4.95 5.05 4.39 5.24 4.21 3.65 4.94 4.56 5.55 4.30 5.20 4.70 5.33 5.13 4.91 4.74 4.47 4.35 4.55 4.72
9101 COMF 2.35 2.25 3.17 3.06 2.56 3.49 2.58 2.64 3.49 3.06 3.87 2.47 3.04 2.59 3.20 2.98 3.13 2.93 3.16 3.16 3.29 2.97
9103 COMF 1.28 0.80 1.98 1.76 1.33 2.31 1.57 1.97 2.35 1.99 2.52 1.44 1.81 1.50 1.91 1.75 1.87 1.76 2.17 2.27 2.31 1.84
9105 COMF 0.79 0.14 1.37 1.11 0.72 1.69 1.08 1.53 1.75 1.47 1.85 1.04 1.29 1.06 1.35 1.22 1.29 1.24 1.65 1.78 1.77 1.30
9107 COMF 0.63 -0.06 1.17 0.90 0.52 1.47 0.91 1.36 1.54 1.30 1.63 0.91 1.13 0.93 1.18 1.06 1.11 1.07 1.47 1.60 1.58 1.12
9102 COMF 2.09 1.90 2.90 2.75 2.27 3.22 2.34 2.49 3.23 2.81 3.56 2.20 2.73 2.31 2.88 2.68 2.83 2.64 2.93 2.96 3.07 2.70
9104 COMF 1.21 0.70 1.88 1.66 1.23 2.22 1.50 1.91 2.26 1.91 2.41 1.37 1.72 1.43 1.82 1.66 1.78 1.67 2.09 2.19 2.23 1.76
9106 COMF 1.16 0.63 1.82 1.59 1.17 2.16 1.45 1.87 2.20 1.86 2.34 1.33 1.67 1.38 1.77 1.61 1.72 1.62 2.04 2.15 2.18 1.70
9108 COMF 0.85 0.21 1.44 1.18 0.79 1.76 1.13 1.58 1.82 1.53 1.92 1.08 1.34 1.11 1.41 1.28 1.35 1.29 1.71 1.84 1.83 1.36
9201 COMF 2.21 2.06 3.03 2.90 2.41 3.34 2.45 2.56 3.35 2.93 3.70 2.33 2.88 2.44 3.03 2.82 2.97 2.77 3.04 3.05 3.17 2.83
9203 COMF 1.59 1.21 2.33 2.14 1.69 2.66 1.86 2.18 2.70 2.30 2.92 1.71 2.15 1.79 2.27 2.09 2.24 2.09 2.47 2.54 2.61 2.17
9205 COMF 0.97 0.38 1.59 1.35 0.94 1.92 1.26 1.70 1.97 1.66 2.09 1.18 1.47 1.22 1.55 1.41 1.50 1.42 1.85 1.96 1.97 1.49
9207 COMF 0.79 0.15 1.37 1.11 0.72 1.69 1.08 1.53 1.75 1.47 1.85 1.04 1.29 1.06 1.35 1.22 1.29 1.24 1.66 1.78 1.77 1.30
9202 COMF 2.06 1.86 2.87 2.72 2.24 3.18 2.31 2.48 3.20 2.78 3.52 2.17 2.70 2.28 2.85 2.64 2.80 2.61 2.90 2.93 3.05 2.67
9204 COMF 1.63 1.27 2.38 2.19 1.74 2.71 1.90 2.21 2.75 2.35 2.98 1.75 2.20 1.83 2.32 2.14 2.29 2.13 2.51 2.57 2.65 2.21
9206 COMF 1.26 0.76 1.94 1.72 1.29 2.28 1.54 1.95 2.32 1.96 2.48 1.42 1.78 1.48 1.88 1.72 1.84 1.73 2.14 2.24 2.28 1.81
9208 COMF 0.80 0.15 1.38 1.12 0.73 1.70 1.08 1.54 1.76 1.48 1.86 1.04 1.30 1.07 1.36 1.23 1.30 1.25 1.66 1.79 1.78 1.30
Average 1.80 1.52 2.52 2.36 1.89 2.84 2.04 2.24 2.84 2.47 3.11 1.95 2.43 2.06 2.54 2.36 2.45 2.31 2.60 2.64 2.72 2.37
Archetype Model type
SR (MH)
Risk Score based on collapse risk for a 50 year period
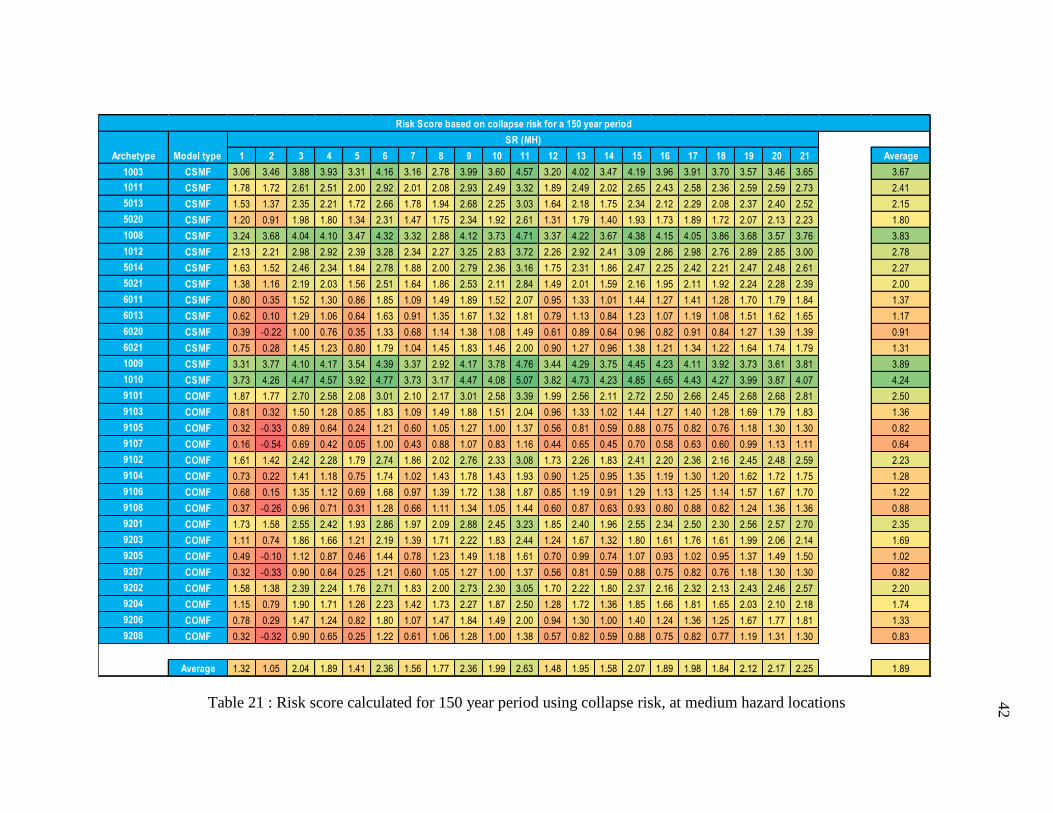
42
Table 21 : Risk score calculated for 150 year period using collapse risk, at medium hazard locations
1 2 3 4 5 6 7 8 9 10 11 12 13 14 15 16 17 18 19 20 21 Average
1003 CSMF 3.06 3.46 3.88 3.93 3.31 4.16 3.16 2.78 3.99 3.60 4.57 3.20 4.02 3.47 4.19 3.96 3.91 3.70 3.57 3.46 3.65 3.67
1011 CSMF 1.78 1.72 2.61 2.51 2.00 2.92 2.01 2.08 2.93 2.49 3.32 1.89 2.49 2.02 2.65 2.43 2.58 2.36 2.59 2.59 2.73 2.41
5013 CSMF 1.53 1.37 2.35 2.21 1.72 2.66 1.78 1.94 2.68 2.25 3.03 1.64 2.18 1.75 2.34 2.12 2.29 2.08 2.37 2.40 2.52 2.15
5020 CSMF 1.20 0.91 1.98 1.80 1.34 2.31 1.47 1.75 2.34 1.92 2.61 1.31 1.79 1.40 1.93 1.73 1.89 1.72 2.07 2.13 2.23 1.80
1008 CSMF 3.24 3.68 4.04 4.10 3.47 4.32 3.32 2.88 4.12 3.73 4.71 3.37 4.22 3.67 4.38 4.15 4.05 3.86 3.68 3.57 3.76 3.83
1012 CSMF 2.13 2.21 2.98 2.92 2.39 3.28 2.34 2.27 3.25 2.83 3.72 2.26 2.92 2.41 3.09 2.86 2.98 2.76 2.89 2.85 3.00 2.78
5014 CSMF 1.63 1.52 2.46 2.34 1.84 2.78 1.88 2.00 2.79 2.36 3.16 1.75 2.31 1.86 2.47 2.25 2.42 2.21 2.47 2.48 2.61 2.27
5021 CSMF 1.38 1.16 2.19 2.03 1.56 2.51 1.64 1.86 2.53 2.11 2.84 1.49 2.01 1.59 2.16 1.95 2.11 1.92 2.24 2.28 2.39 2.00
6011 CSMF 0.80 0.35 1.52 1.30 0.86 1.85 1.09 1.49 1.89 1.52 2.07 0.95 1.33 1.01 1.44 1.27 1.41 1.28 1.70 1.79 1.84 1.37
6013 CSMF 0.62 0.10 1.29 1.06 0.64 1.63 0.91 1.35 1.67 1.32 1.81 0.79 1.13 0.84 1.23 1.07 1.19 1.08 1.51 1.62 1.65 1.17
6020 CSMF 0.39 -0.22 1.00 0.76 0.35 1.33 0.68 1.14 1.38 1.08 1.49 0.61 0.89 0.64 0.96 0.82 0.91 0.84 1.27 1.39 1.39 0.91
6021 CSMF 0.75 0.28 1.45 1.23 0.80 1.79 1.04 1.45 1.83 1.46 2.00 0.90 1.27 0.96 1.38 1.21 1.34 1.22 1.64 1.74 1.79 1.31
1009 CSMF 3.31 3.77 4.10 4.17 3.54 4.39 3.37 2.92 4.17 3.78 4.76 3.44 4.29 3.75 4.45 4.23 4.11 3.92 3.73 3.61 3.81 3.89
1010 CSMF 3.73 4.26 4.47 4.57 3.92 4.77 3.73 3.17 4.47 4.08 5.07 3.82 4.73 4.23 4.85 4.65 4.43 4.27 3.99 3.87 4.07 4.24
9101 COMF 1.87 1.77 2.70 2.58 2.08 3.01 2.10 2.17 3.01 2.58 3.39 1.99 2.56 2.11 2.72 2.50 2.66 2.45 2.68 2.68 2.81 2.50
9103 COMF 0.81 0.32 1.50 1.28 0.85 1.83 1.09 1.49 1.88 1.51 2.04 0.96 1.33 1.02 1.44 1.27 1.40 1.28 1.69 1.79 1.83 1.36
9105 COMF 0.32 -0.33 0.89 0.64 0.24 1.21 0.60 1.05 1.27 1.00 1.37 0.56 0.81 0.59 0.88 0.75 0.82 0.76 1.18 1.30 1.30 0.82
9107 COMF 0.16 -0.54 0.69 0.42 0.05 1.00 0.43 0.88 1.07 0.83 1.16 0.44 0.65 0.45 0.70 0.58 0.63 0.60 0.99 1.13 1.11 0.64
9102 COMF 1.61 1.42 2.42 2.28 1.79 2.74 1.86 2.02 2.76 2.33 3.08 1.73 2.26 1.83 2.41 2.20 2.36 2.16 2.45 2.48 2.59 2.23
9104 COMF 0.73 0.22 1.41 1.18 0.75 1.74 1.02 1.43 1.78 1.43 1.93 0.90 1.25 0.95 1.35 1.19 1.30 1.20 1.62 1.72 1.75 1.28
9106 COMF 0.68 0.15 1.35 1.12 0.69 1.68 0.97 1.39 1.72 1.38 1.87 0.85 1.19 0.91 1.29 1.13 1.25 1.14 1.57 1.67 1.70 1.22
9108 COMF 0.37 -0.26 0.96 0.71 0.31 1.28 0.66 1.11 1.34 1.05 1.44 0.60 0.87 0.63 0.93 0.80 0.88 0.82 1.24 1.36 1.36 0.88
9201 COMF 1.73 1.58 2.55 2.42 1.93 2.86 1.97 2.09 2.88 2.45 3.23 1.85 2.40 1.96 2.55 2.34 2.50 2.30 2.56 2.57 2.70 2.35
9203 COMF 1.11 0.74 1.86 1.66 1.21 2.19 1.39 1.71 2.22 1.83 2.44 1.24 1.67 1.32 1.80 1.61 1.76 1.61 1.99 2.06 2.14 1.69
9205 COMF 0.49 -0.10 1.12 0.87 0.46 1.44 0.78 1.23 1.49 1.18 1.61 0.70 0.99 0.74 1.07 0.93 1.02 0.95 1.37 1.49 1.50 1.02
9207 COMF 0.32 -0.33 0.90 0.64 0.25 1.21 0.60 1.05 1.27 1.00 1.37 0.56 0.81 0.59 0.88 0.75 0.82 0.76 1.18 1.30 1.30 0.82
9202 COMF 1.58 1.38 2.39 2.24 1.76 2.71 1.83 2.00 2.73 2.30 3.05 1.70 2.22 1.80 2.37 2.16 2.32 2.13 2.43 2.46 2.57 2.20
9204 COMF 1.15 0.79 1.90 1.71 1.26 2.23 1.42 1.73 2.27 1.87 2.50 1.28 1.72 1.36 1.85 1.66 1.81 1.65 2.03 2.10 2.18 1.74
9206 COMF 0.78 0.29 1.47 1.24 0.82 1.80 1.07 1.47 1.84 1.49 2.00 0.94 1.30 1.00 1.40 1.24 1.36 1.25 1.67 1.77 1.81 1.33
9208 COMF 0.32 -0.32 0.90 0.65 0.25 1.22 0.61 1.06 1.28 1.00 1.38 0.57 0.82 0.59 0.88 0.75 0.82 0.77 1.19 1.31 1.30 0.83
Average 1.32 1.05 2.04 1.89 1.41 2.36 1.56 1.77 2.36 1.99 2.63 1.48 1.95 1.58 2.07 1.89 1.98 1.84 2.12 2.17 2.25 1.89
Archetype Model type
SR (MH)
Risk Score based on collapse risk for a 150 year period

43
Table 22 : PMFR values (τ = 50 years) at medium hazard locations
1 2 3 4 5 6 7 8 9 10 11 12 13 14 15 16 17 18 19 20 21 Average
1003 CSMF 1.23 1.96 -0.19 0.73 1.16 -1.36 0.63 -1.33 -1.86 -0.61 -1.94 1.03 0.57 1.08 0.29 0.73 0.23 0.49 -1.61 -2.45 -2.28 -0.17
1011 CSMF 0.54 0.76 -0.55 0.10 0.50 -1.55 0.18 -1.12 -1.84 -0.80 -2.02 0.37 -0.14 0.31 -0.34 0.00 -0.24 -0.05 -1.56 -2.22 -2.10 -0.56
5013 CSMF -0.04 0.11 -1.33 -0.64 -0.15 -2.40 -0.44 -1.77 -2.70 -1.56 -2.96 -0.25 -0.91 -0.34 -1.15 -0.75 -1.01 -0.78 -2.36 -3.03 -2.93 -1.30
5020 CSMF -0.73 -0.68 -2.23 -1.52 -0.92 -3.39 -1.18 -2.51 -3.70 -2.44 -4.07 -0.97 -1.80 -1.11 -2.09 -1.63 -1.92 -1.63 -3.27 -3.95 -3.88 -2.17
1008 CSMF 1.14 1.95 -0.41 0.57 1.04 -1.64 0.48 -1.61 -2.19 -0.86 -2.28 0.92 0.41 0.98 0.11 0.59 0.02 0.31 -1.92 -2.79 -2.62 -0.37
1012 CSMF 0.28 0.70 -1.11 -0.30 0.21 -2.27 -0.22 -1.86 -2.64 -1.41 -2.81 0.07 -0.56 0.00 -0.80 -0.39 -0.71 -0.48 -2.32 -3.09 -2.95 -1.08
5014 CSMF -0.15 0.06 -1.54 -0.80 -0.26 -2.68 -0.60 -2.04 -2.99 -1.79 -3.25 -0.38 -1.08 -0.48 -1.34 -0.91 -1.20 -0.95 -2.63 -3.35 -3.24 -1.51
5021 CSMF -1.03 -0.87 -2.72 -1.91 -1.22 -3.98 -1.56 -3.09 -4.32 -2.95 -4.69 -1.31 -2.22 -1.46 -2.53 -2.03 -2.36 -2.04 -3.87 -4.62 -4.54 -2.63
6011 CSMF 0.86 0.52 0.60 0.81 0.81 0.15 0.89 0.55 0.00 0.53 -0.19 0.88 0.72 0.86 0.63 0.76 0.69 0.78 0.19 -0.13 -0.09 0.51
6013 CSMF 0.57 0.17 0.14 0.38 0.45 -0.38 0.55 0.17 -0.54 0.09 -0.79 0.59 0.31 0.55 0.18 0.37 0.25 0.39 -0.28 -0.62 -0.60 0.09
6020 CSMF 0.19 -0.26 -0.43 -0.16 -0.01 -1.03 0.13 -0.32 -1.20 -0.44 -1.52 0.24 -0.18 0.17 -0.35 -0.11 -0.29 -0.09 -0.86 -1.22 -1.23 -0.43
6021 CSMF -0.21 -0.43 -1.29 -0.80 -0.41 -2.17 -0.46 -1.32 -2.41 -1.40 -2.79 -0.32 -0.97 -0.43 -1.20 -0.84 -1.07 -0.82 -2.02 -2.54 -2.51 -1.26
1009 CSMF 0.40 1.28 -1.50 -0.40 0.23 -2.91 -0.40 -2.73 -3.50 -1.99 -3.63 0.10 -0.59 0.15 -0.92 -0.38 -1.03 -0.67 -3.16 -4.12 -3.94 -1.42
1010 CSMF 0.04 1.04 -2.18 -0.96 -0.22 -3.72 -0.91 -3.54 -4.43 -2.75 -4.61 -0.34 -1.14 -0.23 -1.55 -0.91 -1.72 -1.28 -4.06 -5.09 -4.91 -2.07
9101 COMF 1.84 1.74 1.90 2.13 2.01 1.57 1.90 1.35 1.42 1.72 0.53 1.88 1.50 1.72 1.33 1.53 1.58 1.79 1.40 1.06 1.19 1.57
9103 COMF 1.12 0.68 1.31 1.31 1.10 1.20 1.28 1.29 1.13 1.28 1.07 1.21 1.30 1.23 1.30 1.30 1.31 1.31 1.17 1.03 1.06 1.19
9105 COMF 0.66 0.05 0.79 0.74 0.54 0.70 0.83 0.94 0.65 0.86 0.54 0.85 0.86 0.84 0.82 0.84 0.81 0.86 0.77 0.67 0.65 0.73
9107 COMF 0.46 -0.18 0.49 0.45 0.30 0.35 0.61 0.67 0.31 0.59 0.18 0.68 0.62 0.66 0.56 0.61 0.54 0.62 0.46 0.35 0.33 0.46
9102 COMF 1.75 1.55 1.93 2.08 1.89 1.70 1.86 1.51 1.58 1.79 0.79 1.80 1.55 1.68 1.41 1.56 1.64 1.79 1.55 1.29 1.40 1.62
9104 COMF 1.07 0.60 1.31 1.29 1.05 1.24 1.25 1.32 1.18 1.30 1.12 1.19 1.30 1.21 1.30 1.29 1.30 1.30 1.22 1.10 1.13 1.19
9106 COMF 0.74 0.31 0.60 0.71 0.65 0.31 0.80 0.63 0.20 0.58 0.05 0.81 0.69 0.79 0.62 0.72 0.66 0.73 0.35 0.13 0.15 0.53
9108 COMF 0.49 -0.06 0.34 0.40 0.34 0.07 0.57 0.47 -0.01 0.38 -0.19 0.63 0.47 0.59 0.39 0.49 0.40 0.51 0.18 -0.01 -0.02 0.31
9201 COMF 1.80 1.64 2.02 2.16 1.99 1.78 1.95 1.54 1.65 1.87 0.67 1.84 1.53 1.70 1.38 1.55 1.61 1.79 1.61 1.33 1.45 1.66
9203 COMF 1.27 0.98 1.32 1.43 1.29 1.09 1.36 1.16 0.99 1.24 0.95 1.31 1.35 1.33 1.33 1.37 1.37 1.37 1.04 0.81 0.88 1.20
9205 COMF 0.75 0.22 0.80 0.81 0.65 0.63 0.89 0.89 0.56 0.82 0.44 0.89 0.86 0.88 0.82 0.86 0.82 0.88 0.68 0.54 0.54 0.72
9207 COMF 0.53 -0.05 0.46 0.48 0.38 0.25 0.64 0.61 0.18 0.52 0.03 0.69 0.58 0.66 0.51 0.59 0.51 0.60 0.35 0.19 0.18 0.42
9202 COMF 1.74 1.53 2.02 2.11 1.91 1.84 1.91 1.62 1.73 1.89 0.82 1.79 1.55 1.68 1.42 1.56 1.64 1.79 1.69 1.44 1.55 1.68
9204 COMF 1.28 1.01 1.31 1.43 1.30 1.06 1.36 1.12 0.96 1.22 0.91 1.32 1.35 1.33 1.33 1.37 1.36 1.37 1.00 0.76 0.83 1.19
9206 COMF 0.79 0.40 0.62 0.75 0.71 0.30 0.83 0.60 0.19 0.58 0.04 0.83 0.71 0.81 0.64 0.74 0.68 0.75 0.33 0.09 0.12 0.55
9208 COMF 0.53 -0.05 0.46 0.48 0.38 0.24 0.64 0.60 0.17 0.51 0.01 0.69 0.58 0.66 0.51 0.58 0.51 0.60 0.34 0.18 0.17 0.42
Average 0.66 0.56 0.10 0.46 0.59 -0.50 0.53 -0.21 -0.71 -0.04 -0.99 0.63 0.31 0.59 0.15 0.38 0.21 0.37 -0.52 -0.94 -0.87 0.04
Archetype
Model
type
Medium hazard locations
PMFR

44
Table 23 : PMFR values (τ = 150 years) at medium hazard locations
1 2 3 4 5 6 7 8 9 10 11 12 13 14 15 16 17 18 19 20 21 Average
1003 CSMF 0.75 1.49 -0.67 0.25 0.68 -1.84 0.15 -1.81 -2.34 -1.09 -2.42 0.55 0.09 0.60 -0.18 0.26 -0.25 0.01 -2.09 -2.92 -2.75 -0.64
1011 CSMF 0.07 0.29 -1.03 -0.37 0.02 -2.02 -0.30 -1.60 -2.32 -1.28 -2.49 -0.11 -0.62 -0.17 -0.82 -0.48 -0.72 -0.53 -2.04 -2.70 -2.58 -1.04
5013 CSMF -0.51 -0.36 -1.80 -1.12 -0.62 -2.88 -0.92 -2.25 -3.18 -2.03 -3.44 -0.72 -1.39 -0.82 -1.63 -1.23 -1.49 -1.26 -2.83 -3.51 -3.41 -1.78
5020 CSMF -1.21 -1.16 -2.71 -2.00 -1.40 -3.87 -1.66 -2.98 -4.17 -2.91 -4.55 -1.45 -2.28 -1.58 -2.56 -2.10 -2.40 -2.11 -3.74 -4.43 -4.36 -2.65
1008 CSMF 0.67 1.47 -0.89 0.09 0.56 -2.12 0.00 -2.09 -2.67 -1.34 -2.76 0.44 -0.06 0.51 -0.37 0.11 -0.46 -0.17 -2.40 -3.27 -3.09 -0.85
1012 CSMF -0.19 0.22 -1.59 -0.77 -0.26 -2.75 -0.69 -2.34 -3.12 -1.89 -3.28 -0.41 -1.04 -0.48 -1.28 -0.87 -1.19 -0.96 -2.79 -3.57 -3.43 -1.56
5014 CSMF -0.63 -0.42 -2.02 -1.28 -0.74 -3.15 -1.08 -2.52 -3.47 -2.26 -3.73 -0.86 -1.56 -0.96 -1.81 -1.39 -1.68 -1.43 -3.11 -3.82 -3.72 -1.98
5021 CSMF -1.51 -1.34 -3.19 -2.39 -1.70 -4.46 -2.04 -3.57 -4.80 -3.43 -5.17 -1.78 -2.70 -1.93 -3.01 -2.50 -2.84 -2.52 -4.35 -5.10 -5.01 -3.11
6011 CSMF 0.39 0.04 0.12 0.33 0.33 -0.33 0.41 0.07 -0.48 0.05 -0.67 0.40 0.24 0.38 0.15 0.29 0.21 0.30 -0.29 -0.61 -0.57 0.04
6013 CSMF 0.09 -0.31 -0.34 -0.10 -0.03 -0.85 0.08 -0.31 -1.01 -0.38 -1.27 0.12 -0.17 0.07 -0.29 -0.11 -0.23 -0.09 -0.76 -1.10 -1.08 -0.38
6020 CSMF -0.28 -0.74 -0.90 -0.64 -0.48 -1.50 -0.34 -0.80 -1.67 -0.92 -1.99 -0.23 -0.66 -0.31 -0.83 -0.59 -0.76 -0.56 -1.34 -1.70 -1.71 -0.90
6021 CSMF -0.69 -0.91 -1.76 -1.27 -0.89 -2.65 -0.94 -1.80 -2.89 -1.87 -3.26 -0.80 -1.44 -0.91 -1.67 -1.32 -1.55 -1.30 -2.50 -3.02 -2.99 -1.73
1009 CSMF -0.08 0.80 -1.98 -0.88 -0.25 -3.38 -0.88 -3.21 -3.98 -2.46 -4.11 -0.38 -1.06 -0.33 -1.40 -0.85 -1.51 -1.15 -3.64 -4.60 -4.42 -1.89
1010 CSMF -0.43 0.57 -2.66 -1.44 -0.69 -4.20 -1.39 -4.02 -4.91 -3.23 -5.08 -0.82 -1.62 -0.71 -2.03 -1.39 -2.20 -1.76 -4.54 -5.57 -5.39 -2.55
9101 COMF 1.37 1.26 1.42 1.65 1.53 1.09 1.42 0.87 0.94 1.24 0.06 1.40 1.02 1.24 0.86 1.05 1.11 1.31 0.92 0.59 0.71 1.10
9103 COMF 0.64 0.21 0.83 0.84 0.62 0.72 0.80 0.81 0.65 0.81 0.59 0.74 0.83 0.76 0.82 0.82 0.83 0.83 0.69 0.55 0.59 0.71
9105 COMF 0.18 -0.43 0.31 0.26 0.06 0.22 0.35 0.46 0.17 0.38 0.07 0.37 0.38 0.36 0.34 0.36 0.33 0.38 0.29 0.19 0.18 0.25
9107 COMF -0.02 -0.66 0.02 -0.03 -0.18 -0.13 0.13 0.19 -0.17 0.11 -0.30 0.21 0.14 0.18 0.08 0.13 0.06 0.15 -0.01 -0.12 -0.15 -0.02
9102 COMF 1.27 1.07 1.45 1.60 1.42 1.22 1.38 1.04 1.11 1.31 0.31 1.32 1.07 1.20 0.94 1.08 1.16 1.31 1.08 0.81 0.92 1.15
9104 COMF 0.60 0.13 0.83 0.81 0.58 0.76 0.78 0.85 0.70 0.83 0.65 0.71 0.82 0.73 0.82 0.81 0.83 0.82 0.74 0.62 0.65 0.72
9106 COMF 0.26 -0.17 0.12 0.23 0.17 -0.17 0.33 0.15 -0.27 0.10 -0.42 0.33 0.21 0.31 0.14 0.24 0.18 0.25 -0.13 -0.35 -0.33 0.06
9108 COMF 0.01 -0.53 -0.14 -0.07 -0.14 -0.40 0.09 -0.01 -0.49 -0.10 -0.66 0.15 0.00 0.11 -0.09 0.01 -0.07 0.03 -0.30 -0.49 -0.50 -0.17
9201 COMF 1.32 1.16 1.55 1.68 1.51 1.30 1.47 1.07 1.17 1.39 0.20 1.36 1.05 1.22 0.90 1.07 1.14 1.32 1.14 0.85 0.97 1.18
9203 COMF 0.79 0.50 0.85 0.95 0.81 0.62 0.88 0.68 0.52 0.77 0.47 0.83 0.88 0.85 0.86 0.89 0.89 0.89 0.56 0.33 0.40 0.72
9205 COMF 0.27 -0.26 0.32 0.33 0.18 0.16 0.41 0.42 0.09 0.34 -0.04 0.41 0.38 0.40 0.34 0.38 0.35 0.40 0.21 0.06 0.06 0.25
9207 COMF 0.05 -0.53 -0.01 0.01 -0.10 -0.23 0.16 0.13 -0.30 0.04 -0.45 0.21 0.10 0.18 0.03 0.11 0.04 0.13 -0.13 -0.28 -0.30 -0.05
9202 COMF 1.26 1.05 1.55 1.64 1.43 1.36 1.44 1.15 1.25 1.42 0.34 1.31 1.07 1.20 0.94 1.08 1.16 1.31 1.21 0.97 1.07 1.20
9204 COMF 0.81 0.53 0.83 0.95 0.83 0.58 0.88 0.65 0.48 0.75 0.44 0.84 0.87 0.86 0.85 0.89 0.88 0.89 0.52 0.29 0.36 0.71
9206 COMF 0.31 -0.08 0.14 0.28 0.24 -0.18 0.35 0.13 -0.29 0.10 -0.43 0.35 0.23 0.34 0.16 0.26 0.20 0.28 -0.15 -0.39 -0.36 0.07
9208 COMF 0.05 -0.53 -0.02 0.01 -0.10 -0.23 0.16 0.12 -0.31 0.03 -0.46 0.21 0.10 0.18 0.03 0.11 0.03 0.12 -0.14 -0.30 -0.31 -0.06
Average 0.19 0.08 -0.38 -0.02 0.11 -0.98 0.05 -0.68 -1.19 -0.52 -1.46 0.16 -0.17 0.12 -0.32 -0.10 -0.26 -0.10 -1.00 -1.42 -1.35 -0.44
Archetype
Model
type
Medium hazard locations
PMFR

45
PMFR Values of Medium Hazard Locations
For medium hazard locations and for a τ value of 50 years, the PMFR value averaged over
all the building models and locations is 0.04 ≈ 0. This indicates that in this case, the collapse
probabilities conditioned on MCER shaking level and the collapse risks for a 50 year period are
similar. However, this is not the case for medium hazard locations when τ = 150 years. A
deterministic sensitivity study could be formed for medium hazard locations in an effort take this
study further.

46
6. Deterministic Sensitivity Study
The main purpose for this sensitivity study is to check the parameter to which the PMFR is
most sensitive. The following parameters are considered – Median collapse capacity (θ),
Logarithmic standard deviation of collapse capacity (β), slope of hazard curve (M), y-intercept of
hazard curve (B) and risk coefficient (CR). Low, baseline (or mean) and high values are determined
for each of these parameters.
Low, mean and high values for median collapse capacity are calculated from Table 3. For
logarithmic standard deviation of collapse capacity, they are set to be 0.5, 0.8 and 1.0 respectively.
These values were chosen because Luco et. al. (2007) used β = 0.8, FEMA P-695 building models
considered in this study had a low β = 0.5 and in FEMA P-695 the β values were as high as 0.95.
From a hazard curve, the mean annual exceedance frequencies are interpolated using
double interpolation at 0.1g and 0.5g spectral response accelerations. The hazard curve between
these values is assumed to be linear, as shown in Figure 6. Slope and y-intercept of the hazard
curve is determined using these two points in the equation shown on page 47. This process is
repeated for the hazard curves of all high hazard locations and the low, mean and high values of
slope and y-intercept of hazard curve are determined.
For risk coefficient (CR), the low, mean and high values are taken as 0.8, 0.9 and 1.17
respectively. These are the low, mean and high values obtained from risk coefficient maps of
ASCE 7-10 (Figure 22-18 of ASCE 7-10).

47
After determining the required values of parameters, score, risk score and PMFR values are
calculated using similar procedures as mentioned in Chapter 4. To calculate the MCER spectral
response acceleration value, the MCE value is first calculated using the following equation-
𝑙𝑛(𝑦) = 𝑀. 𝑥 + 𝐵
Where,
y = exceedance frequency (y = 1/2500 in this case since MCE is considered)
M = slope of hazard curve
B = y-intercept of hazard curve
x = shaking intensity (g) (MCE level-this is determined)
Figure 5: Linear approximation of hazard curve (sample representation)
0.000
0.001
0.010
0.100
1.000
0.0 0.5 1.0
log
(G)
-A
nn
ual
exc
ee
de
nce
Fre
qu
en
cy
Spectral Acceleration (g)
Actual hazard curve
0.1g
0.5g
1/2500
Assumed hazard curve
1/2501/2500
0.1g 0.5g MCE

48
As soon as we calculate MCE shaking intensity value (as shown in Figure 6), MCER value
is calculated by multiplying MCE intensity value with the baseline risk coefficient value. Also,
while calculating the risk integral, ground motion values for hazard curve are assumed and their
respective mean annual frequencies are calculated using slope and y-intercept values.
Initially score, risk score and PMFR values are calculated at the baseline (or mean) values
of the parameters. When PMFR at a low θ is to be calculated, except for θ, baseline values are taken
for all other parameters. Similar method is used for all other cases.
For example,
PMFR (at low θ) = f(low θ, baseline β, baseline M, baseline B and baseline CR)
PMFR (at high β) = f(baseline θ, high β, baseline M, baseline B and baseline CR) etc.
After calculating the PMFR values for all the cases, swing is calculated as absolute
difference between PMFR values calculated using low and high values of a parameter. A parameter
with highest swing indicates that PMFR is most sensitive to that parameter. A tornado diagram is
a bar chart in which the low and high values of each parameter are plotted in the decreasing order
of swing. The y-axis of this plot contains the PMFR values and the x-axis represents the range of
the values. A vertical line is drawn at the baseline PMFR value. Figure 7 shows the tornado diagram
for high hazard locations. Table 24 shows the parameters considered and their respective PMFR
values.
For example, Swing (in case of θ) = |PMFR (at high θ) – PMFR (at low θ)|

49
The following table shows the parameters considered and their respective PMFR values. A
tornado diagram is plotted with the decreasing order of swing. The y-axis intercepts the x-axis at
the baseline PMFR value, which is 0.395.
Parameter Low Mean High PMFR
(at low values)
PMFR (at high values)
Swing
Theta - θ(g) 0.1652 1.3 3.09 0.105 0.483 0.378
Slope - M -0.131 -0.048 -0.004 0.916 0.043 0.873
Y - intercept B (g) 0.003 0.026 0.067 1.228 -0.053 1.281
Beta - β (g) 0.5 0.8 1.0 0.564 0.311 0.254
Risk Coefficient (CR) 0.8 0.9 1.17 0.279 0.626 0.346
Table 24 : Deterministic sensitivity study for high hazard locations - PMFR and swing values
Figure 6: Tornado diagram for high hazard locations
-0.10 0.10 0.30 0.50 0.70 0.90 1.10 1.30
B
M
θ
CR
β
PMFR Values
PMFR (at low values)
PMFR (at high values)

50
According to the tornado diagram, PMFR is very sensitive to slope and y-intercept of the
hazard curve. I think that sensitivity to slope indicates that PMFR is sensitive to the variation
between intensity levels in a hazard curve and sensitivity to y-intercept indicates that PMFR is
sensitive to the low intensity earthquakes. The tornado also indicates that median collapse capacity
of a building and its standard deviation are less sensitive to PMFR. I think this indicates the PMFR
does not vary much depending on the type of building model used.

51
7. Conclusions
Bretl (2014) found that collapse probability given MCER shaking level is nearly equal to
the 150 year collapse frequency of a building in case of high hazard locations. However, he did
not arrive at a relationship for medium hazard locations.
In this study, when the risk score is calculated for 150 year period, the average PMFR value
for high hazard locations is 0.09 ≈ 0. This indicates that in this case, the collapse probabilities
conditioned on MCER shaking level and the collapse risks for a 150 year period are similar. Hence,
in FEMA 154, the score can be interpreted not just as the probability of collapse of a building
given MCER shaking level, but also as the collapse risk over a period of 150 years. This result is
similar to the result from Bretl’s (2014) study.
Similarly, when the risk score is calculated for a 50 year period, the average PMFR value
for medium hazard locations is 0.04 ≈ 0. This indicates that in this case, the collapse probabilities
conditioned on MCER shaking level and the collapse risks for a 50 year period are similar. Hence,
in FEMA 154, the score can be interpreted not just as the probability of collapse of a building
given MCER shaking level, but also as the collapse risk over a period of 50 years.
However, PMFR values calculated using 50 year risk score for high hazard locations and
150 year risk score values for medium hazard locations did not yield any definite results. Also,
even in the cases mentioned in the above two paragraphs, the PMFR values are not near zero for
several location-building combinations. Hence, a deterministic sensitivity study is performed for
high hazard locations to check for an input parameter to which the PMFR was most sensitive.

52
The deterministic sensitivity study showed that PMFR is most sensitive to the slope and y-
intercept values of the hazard curves. Further study could be done in this area to know more about
how the hazard curves affect PMFR. A similar sensitivity study could be performed to medium
hazard locations to check for variations between the sensitivity studies, if any.
In this study the risk integral is solved using a numerical integral. Since the PMFR is most
sensitive to hazard curves, further study could be done to calculate the risk integral as a closed
form of integral than by calculating using a numerical integration procedure.

53
References
(ASCE) American Society of Civil Engineers, 2010, ASCE/SEI 7-10, Minimum Design Loads for
Buildings and Other Structures, Reston, VA.
(ATC) Applied Technology Council, 2009, FEMA P-695: Quantification of Building Seismic
Performance Factors, Federal Emergency Management Agency, Washington, DC.
Bretl, D.J., 2014, Relationship Between the Collapse Fragility and Collapse Risk in Existing
Buildings in Regions of High and Moderate Seismicity, M.S. Thesis, CEAE Department, Univ. of
Colorado Boulder.
(FEMA) Federal Emergency Management Agency, 2002, FEMA 154: Rapid Visual Screening of
Buildings for Potential Seismic Hazards, Washington, DC.
Luco, N., Ellingwood, B.R., Hamburger, R.O., Hooper, J.D., Kimball, J.K., & Kircher, C.A., 2007,
Risk-targeted versus current seismic design maps for the conterminous United States, SEAOC
2007 Convention Proceedings, September 26th-29th 2011, Lake Tahoe, CA.
Petersen, M.D., Frankel, A.D., Harmsen, S.C., Mueller, C.S., Haller, K.M., Wheeler, R.L.,
Wesson, R.L., Zeng, Y., Boyd, O.S., Perkins, D.M., Luco, N., Field, E.H., Wills, C.J., & Rukstales,
K.S., 2008, Documentation for the 2008 Update of the United States National Seismic Hazard
Maps: U.S. Geological Survey Open-File Report 2008–1128, 61 p.
Porter, K.A., 2014, Beginners Guide to Fragility and Risk, University of Colorado Boulder.
Porter, K.A., Scawthorn C.R., & Beck J.L., 2006, Cost-effectiveness of stronger woodframe
buildings, Earthquake Spectra 22 (1), 239-266.