studying the possibility of neural network …
TRANSCRIPT

D. Lisjak et al. Istraživanje mogućnosti primjene neuronske mreže u dijagnostici četverotaktnog benzinskog motora pomoću sadržaja čestica trošenja
Tehnički vjesnik 19, 4(2012), 857-862 857
ISSN 1330-3651 UDC/UDK 621.434.12:621.891.017]: 004.032.26
STUDYING THE POSSIBILITY OF NEURAL NETWORK APPLICATION IN THE DIAGNOSTICS OF A SMALL FOUR-STROKE PETROL ENGINE BY WEAR PARTICLE CONTENT Dragutin Lisjak, Gojko Marić, Nedjeljko Štefanić
Original scientific paper
This paper presents the application of artificial neural network (ANN) in engine diagnostics. One-layer feed-forward neural network which is trained using a back-propagation algorithm that updates the weights and biases values according to Levenberg-Marquardt algorithm has been established to predict the Wear Particle Content (WPC) using the number of working hours of the motor engine as input parameter. The generalization property of the developed ANN is very high, which is confirmed by a very good match between the predicted and the targeted values on a new data set that was not included in the training data set. Keywords: neural network, maintenance, motor engine diagnostics
Istraživanje mogućnosti primjene neuronske mreže u dijagnostici četverotaktnog benzinskog motora pomoću sadržaja čestica trošenja
Izvorni znanstveni članak U radu je prikazana primjena umjetne neuronske mreže (ANN) u dijagnostici motora. Primijenjena je unapređena neuronska mreža s povratnim rasprostiranjem greške s Levenberg-Marquardt algoritmom učenja na problemu procjene indeksa sadržaja čestica trošenja (WPC) s brojem sati rada motora kao ulaznim parametrom mreže. Generalizacijska svojstva razvijene umjetne neuronske mreže (ANN) su vrlo visoka, što je i potvrđeno vrlo dobrim međusobnim poklapanjem eksperimentalnih iznosa (nisu bili uključeni u proces učenja) i procijenjenih iznosa indeksa sadržaja čestica trošenja (WPC). Ključne riječi: neuronska mreža, održavanje, dijagnostika motora
1 Introduction There are numerous methods of monitoring the engine condition, based on the analysis of one or several output parameters. The drawback of these methods lies in the unreliability since they give warning only when the engine malfunction has already occurred. This has resulted in the development and application of planned maintenance methods i.e. preventive maintenance. The characteristic of this method is to use the manufacturers’ recommendations, maintenance engineers’ experiences and monitoring of malfunction in the service period, to define a preventive maintenance plan which includes dates and descriptions of interventions that need to be performed on the engine. In the majority of cases this method yields positive economic results regarding the downtime costs, but it also has some disadvantages, such as e.g.: - impossibility to forecast and plan optimal time
interval in which engine maintenance is to be performed due to different service lifecycle of the installed parts [1];
- impossibility to forecast and plan malfunctions in the running in period.
The maintenance concept in application today and developed as early as 1970s is the so-called condition-based maintenance [2]. This concept is based on monitoring of the system condition (in this case the engine) and preventive action before a substantial damage might occur. One of the methods of such monitoring is ferrography [3, 4], which uses the analysis of particles and wear products from lubricating oil to provide data on the current condition of the engine i.e. on the need of
undertaking a preventive maintenance activity (e.g. oil change). The lack of monitoring the engine condition by means of ferrography lies in the fact that the engine has to be stopped in order to take an oil test sample, thus increasing the costs due to downtime. The problem becomes complex if the oil analysis shows that several different preventive measures for different components of the same or several different engines have to be undertaken. These considerations represented the starting point and the main idea of this paper: to avoid stopping the engine, and on the basis of the WPC assessment obtained by neural networks, take the necessary actions for preventive maintenance. In the authors’ opinion, to solve this problem the most suitable method is the application of the neuron networks, precisely because of their capability of generalization i.e. estimation of stochastic system parameters. Fig. 1 shows the principle scheme of the background idea of this paper, and the assumption is that a company owns a larger fleet of engines of the same type which require preventive maintenance in order to reduce the maintenance costs resulting from downtime.
Figure 1 Principle scheme of the background idea of the paper

Studying the possibility of neural network application in the diagnostics of a small four-stroke petrol engine by wear particle content D. Lisjak et al.
858 Technical Gazette 19, 4(2012), 857-862
2 Experimental Part Testing was done on a petrol four-stroke engine, of Briggs & Stratton USA manufacturer, INTEK 190 OHV, Fig. 2. The basic data for the engine are: - power 4 kW - volume 190 cm3 - cylinder diameter/piston movement - 68,3 × 51,8 mm - oil filling 0,6 l - weight 14,7 kg - dimensions (L×W×H) 395 × 25,4 × 385,9 mm - fuel – unleaded petrol SUPER 95.
Figure 2 Tested engine
To load the engine, in order to cause its wear-out the engine is connected to the alternative current generator and energy-using devices in the form of electrical light bulbs. The generator is connected directly to the engine, without a coupling, and its maximum output power is 2,2 kW. During testing the engine ran constantly at 3000 rpm, and under continuous 90 % load, which means that the generator produced constantly a current of 2 kW. The loading value was monitored by a Watt-meter. The testing took 414 hours. Oil samples were taken every 12 hours, except during the period of the first oil change (6 hours) when the samples were taken every 2 hours. The oil changing interval and the type of oil were selected according to the engine manufacturer’s recommendations, who recommended oil SAE 30 for the climatic conditions and oil change every 60 hours of operation. Based on this requirement, INA-SUPER 3 oil of the required gradation was selected. During testing unleaded petrol INA SUPER 95 was used. Before the testing started, the dimensions and the masses of the engine parts were measured, for which it was assumed that they will be most exposed to wear. The precise measurements of masses and characteristic dimensions were carried out at the Laboratory for Precise Measurements of Length at the Faculty of Mechanical Engineering and Naval Architecture of the University of Zagreb. The same measurements were repeated in the middle of testing (210 hours) and at the end of the test. Oil samples were also taken, according to the previously mentioned regime, so that 37 oil samples were collected. During testing, because of the generator requirements, the engine operated constantly with 3000 rpm and fewer than 90 % load. The accuracy of the load value was monitored by a Watt-meter that was plugged into an alternative current
port on the generator which supplied also the energy-using devices. To determine the WPC (Wear Particle Content) index [5], ferrogram PMA 90 S was used with direct reading presented in Fig. 3, and the principle shown in Fig. 4.
Figure 3 Ferrogram PMA 90 S
A sample with wear particles flows through a tube
above a strong magnet which acts on the metal particles and stimulates their depositing at the bottom of the tube.
Figure 4 Operation principle of ferrogram PMA 90 S [6]
Larger particles are isolated before the smaller ones,
since the force on the particle acting in the magnetic field is proportional to its volume, and the resistance through the medium is proportional to the area of the particle cross-section transversal to the movement direction [7, 8]. The WPC index is read directly on the instrument, based on the measurement of the throughput light intensity through photocells 1 and 2 (Fig. 4). The expression which calculates the index is:
,UU
SL
K
DDWPC
(1)
where: WPC – index of the wear particle content, DL – area covered by larger particles, %, DS – area covered by smaller particles, %, KUU – quantity of oil sample, ml. In this way the simplified obtaining of the WPC index enables simple monitoring of wear since sudden increase in WPC, after the system has already passed the running in period, regularly indicates a future failure. This method gives warning a lot in advance of the substantial damage of the system, thus giving the possibility to avoid the malfunction by performing maintenance on time. This method of monitoring the wear makes it possible to
D. Lisjak et al. Istraživanje mogućnosti primjene neuronske mreže u dijagnostici četverotaktnog benzinskog motora pomoću sadržaja čestica trošenja
Tehnički vjesnik 19, 4(2012), 857-862 859
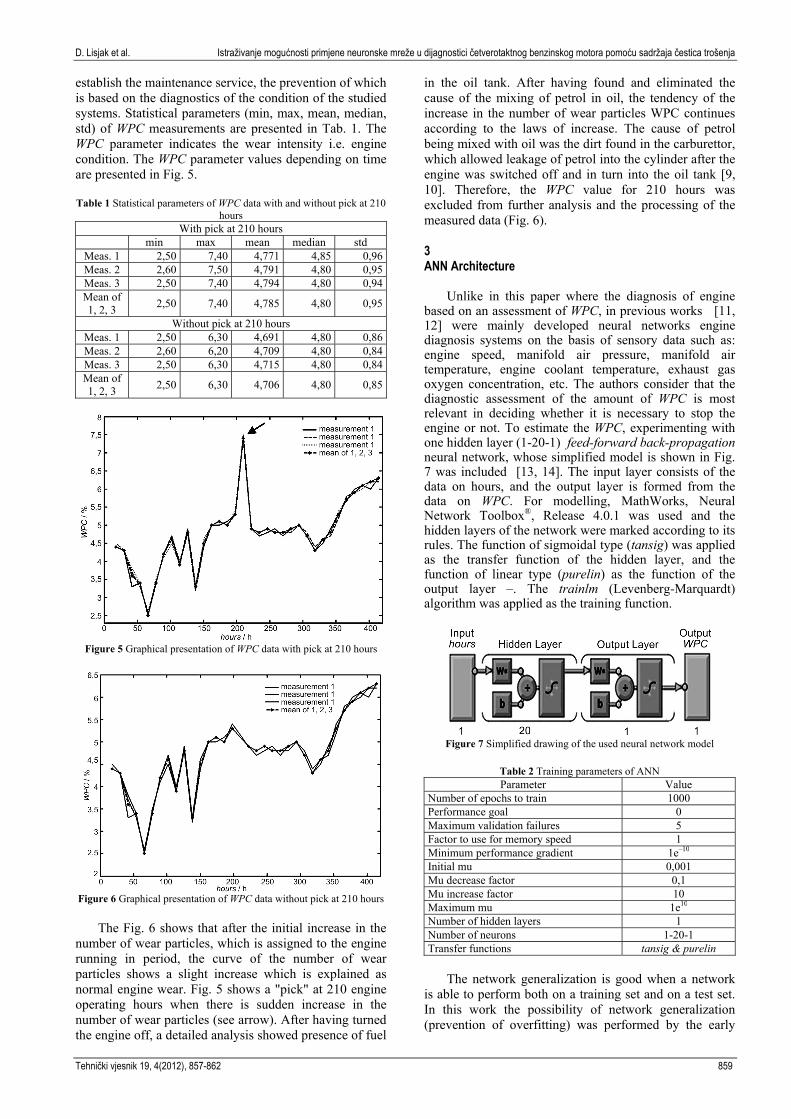
establish the maintenance service, the prevention of which is based on the diagnostics of the condition of the studied systems. Statistical parameters (min, max, mean, median, std) of WPC measurements are presented in Tab. 1. The WPC parameter indicates the wear intensity i.e. engine condition. The WPC parameter values depending on time are presented in Fig. 5. Table 1 Statistical parameters of WPC data with and without pick at 210
hours With pick at 210 hours
min max mean median std Meas. 1 2,50 7,40 4,771 4,85 0,96Meas. 2 2,60 7,50 4,791 4,80 0,95Meas. 3 2,50 7,40 4,794 4,80 0,94Mean of 1, 2, 3
2,50 7,40 4,785 4,80 0,95
Without pick at 210 hours Meas. 1 2,50 6,30 4,691 4,80 0,86Meas. 2 2,60 6,20 4,709 4,80 0,84Meas. 3 2,50 6,30 4,715 4,80 0,84Mean of 1, 2, 3
2,50 6,30 4,706 4,80 0,85
Figure 5 Graphical presentation of WPC data with pick at 210 hours
Figure 6 Graphical presentation of WPC data without pick at 210 hours
The Fig. 6 shows that after the initial increase in the
number of wear particles, which is assigned to the engine running in period, the curve of the number of wear particles shows a slight increase which is explained as normal engine wear. Fig. 5 shows a "pick" at 210 engine operating hours when there is sudden increase in the number of wear particles (see arrow). After having turned the engine off, a detailed analysis showed presence of fuel
in the oil tank. After having found and eliminated the cause of the mixing of petrol in oil, the tendency of the increase in the number of wear particles WPC continues according to the laws of increase. The cause of petrol being mixed with oil was the dirt found in the carburettor, which allowed leakage of petrol into the cylinder after the engine was switched off and in turn into the oil tank [9, 10]. Therefore, the WPC value for 210 hours was excluded from further analysis and the processing of the measured data (Fig. 6). 3 ANN Architecture
Unlike in this paper where the diagnosis of engine based on an assessment of WPC, in previous works [11, 12] were mainly developed neural networks engine diagnosis systems on the basis of sensory data such as: engine speed, manifold air pressure, manifold air temperature, engine coolant temperature, exhaust gas oxygen concentration, etc. The authors consider that the diagnostic assessment of the amount of WPC is most relevant in deciding whether it is necessary to stop the engine or not. To estimate the WPC, experimenting with one hidden layer (1-20-1) feed-forward back-propagation neural network, whose simplified model is shown in Fig. 7 was included [13, 14]. The input layer consists of the data on hours, and the output layer is formed from the data on WPC. For modelling, MathWorks, Neural Network Toolbox®, Release 4.0.1 was used and the hidden layers of the network were marked according to its rules. The function of sigmoidal type (tansig) was applied as the transfer function of the hidden layer, and the function of linear type (purelin) as the function of the output layer –. The trainlm (Levenberg-Marquardt) algorithm was applied as the training function.
Figure 7 Simplified drawing of the used neural network model
Table 2 Training parameters of ANN Parameter Value
Number of epochs to train 1000 Performance goal 0 Maximum validation failures 5 Factor to use for memory speed 1 Minimum performance gradient 1e–10
Initial mu 0,001 Mu decrease factor 0,1 Mu increase factor 10 Maximum mu 1e10 Number of hidden layers 1 Number of neurons 1-20-1 Transfer functions tansig & purelin
The network generalization is good when a network
is able to perform both on a training set and on a test set. In this work the possibility of network generalization (prevention of overfitting) was performed by the early
Studying the possibility of neural network application in the diagnostics of a small four-stroke petrol engine by wear particle content D. Lisjak et al.
860 Technical Gazette 19, 4(2012), 857-862
stopping method. Experimental data set is divided into three subsets: the training set (50 % of experimental data), the validation set (25 % of experimental data) and the test set (25 % of experimental data).
Training was performed only on the training set. The validation set was not included in the training set and was used to decide when the training is to be stopped. The error on the validation set is monitored during the training process. The validation error normally decreases during the initial phase of training, as does the training set error. However, when the network begins to overfit the data, the error on the validation set will typically begin to rise. When the validation error increases in a specified number of iterations, the training is stopped, and the weights (W) and biases (b) are returned to the minimum of the validation error. The test set error was not used during the training, but it was used for the comparison of different models. To produce the most efficient training, the input and output data have been normalized before training. For the estimation of performance of the learning algorithm in solving the specified task, the performance index was defined. The performance index enabled comparison of the applied neural network algorithm with other learning
algorithms. The most frequent performance index is the normalized root mean square error – NRMSE.
2
1
( )Nn n
n
dn
d a
NNRMSE
, (2)
21
1 N
d nnn
d dN
, (3)
1
1 N
nn
d dN
. (4)
where N is the total number of patterns, dn is the desired (target, T) outputs, an is the actual (estimation, A) outputs, dn is the standard deviation. 4 Results
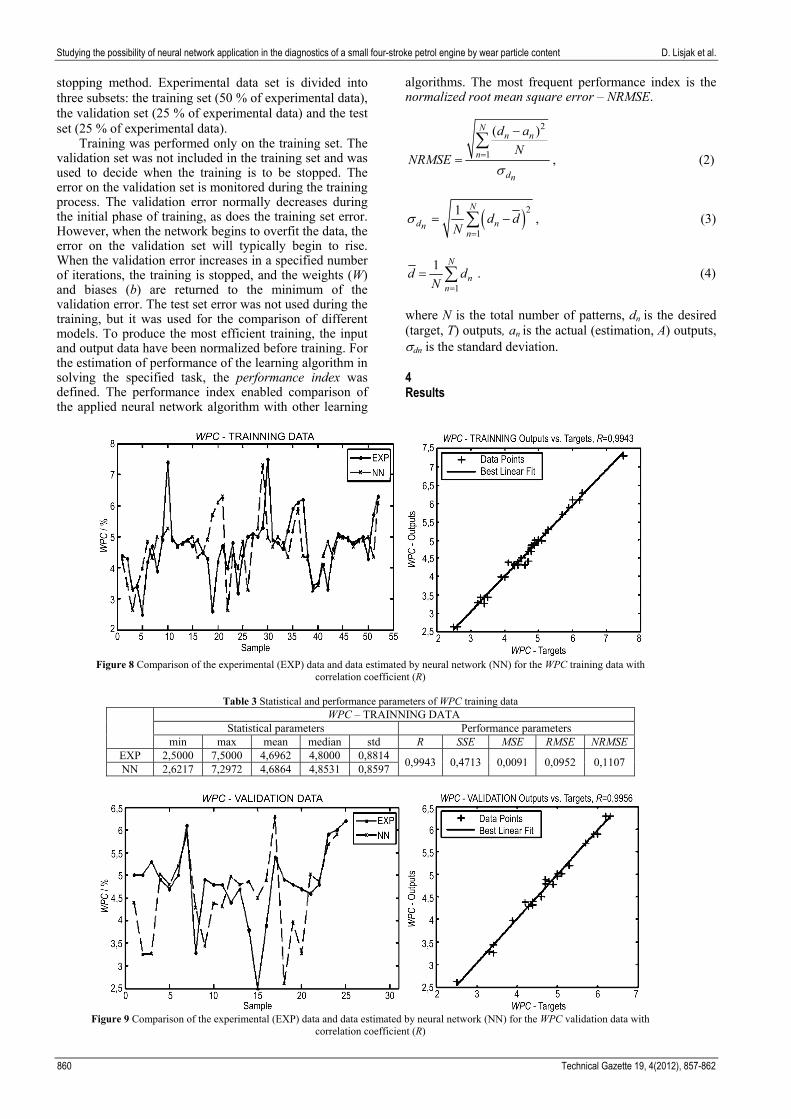
Figure 8 Comparison of the experimental (EXP) data and data estimated by neural network (NN) for the WPC training data with
correlation coefficient (R)
Table 3 Statistical and performance parameters of WPC training data WPC – TRAINNING DATA
Statistical parameters Performance parameters min max mean median std R SSE MSE RMSE NRMSE
EXP 2,5000 7,5000 4,6962 4,8000 0,8814 0,9943 0,4713 0,0091 0,0952 0,1107
NN 2,6217 7,2972 4,6864 4,8531 0,8597
Figure 9 Comparison of the experimental (EXP) data and data estimated by neural network (NN) for the WPC validation data with
correlation coefficient (R)

D. Lisjak et al. Istraživanje mogućnosti primjene neuronske mreže u dijagnostici četverotaktnog benzinskog motora pomoću sadržaja čestica trošenja
Tehnički vjesnik 19, 4(2012), 857-862 861
Table 4 Statistical and performance parameters of WPC validation data WPC – VALIDATION DATA
Statistical parameters Performance parameters min max mean median std R SSE MSE RMSE NRMSE
EXP 2,5000 6,3000 4,6440 4,7000 0,9790 0,9956 0,2011 0,0080 0,0897 0,0922
NN 2,6217 6,3005 4,6507 4,7998 0,9723
Figure 10 Comparison of the experimental (EXP) data and data estimated by neural network (NN) for the WPC test data with
correlation coefficient (R)
Table 5 Statistical and performance parameters of WPC test data
WPC – TEST DATA Statistical parameters Performance parameters
min max mean median std R SSE MSE RMSE NRMSE EXP 3,3000 7,4000 5,1120 4,8000 1,0158
0,9913 0,5671 0,0227 0,1506 0,1473 NN 3,2518 7,2972 5,0387 4,8532 1,0225
5 Discussion
The work studies the possibility of applying the neuron networks for assessment of the four-stroke petrol engine condition in order to reduce the possible downtime costs. Studying the engine operation within an interval of ca. 400 hours, using the ferrogram method, the WPC was measured every two hours of engine operation. Based on these experimental data the (1-20-1) structure of a feed-forward back-propagation neural network was dimensioned, with one hidden layer. According to standard, the experimental data for network training were divided into three sets: a training set, a validation set and a testing set. To evaluate the success or performances of the estimate of experimental data by neuron network the most important is the analysis of R and NRMSE coefficients of the third set of data. As can be seen in Fig. 10 and in Tab. 5, a very high correlation coefficient has been obtained (R=0,9913) and a relatively low coefficient of normalized root mean square error (NRMSE=0,1473) between the test experimental WPC data and WPC data obtained by the estimate of the neuron network. It can also be seen that the mentioned performance parameters for the other two sets are high, i.e. low, as expected. These results have confirmed the introductory hypothesis about the possible application of the neural network for monitoring of the small four-stroke engine condition based on the WPC estimate for the given number of engine operating hours.
6 References [1] Corso, S.; Adamo, R.The Application of Ferrography in
Monitoring Motor Oils during Engine Development. // Lubrication Engineering, 45, (1989), pp. 557-564.
[2] Marić, G.; Ivušić, V. Praćenje trošenja četverotaktnog motora analizom ulja. // Goriva i maziva, 2(2002), pp. 87 - 101.
[3] Seifert, W.; Desjardin, J. An Improved Method for Measuring the Amount of Soot in Diesel Lubricating Oil. // Condition Monitoring Pineridge Press, Swansea, 1994, pp. 543-552.
[4] Lewis, R. T.; Particle Size Considerations in Wear Particle Analysis, Pineridge Press, Swansea, 1991.
[5] Yuang-Cherng, C. Study of Wear Particle Deposition by an Improved Rotary Ferrographic Analyzer. // Wear, 146, (1991), pp. 137-147.
[6] Seifert, W.; Westcott, W. C. A Method for the Study of Wear Particles in Lubricating Oil. // Wear, 21, (1972), pp. 27-42.
[7] Barwell, F. T. Particle Examination Tool for Maintenance Engineers, Chartered Mechanical Engineer, 1978.
[8] Scott, D.; Westcott, W. C. Predictive Maintenance by Ferrography. // Wear, 44, (1977), pp. 163-171.
[9] Yardley, E. D. The Use of Ferrography and Spectrographic Oil Analysis to Monitor the Performances of Three 90 kW Gearboxes. // Wear, 56, (1979), pp. 213-226.
[10] Stachowiak, G. W. Ferrography and Fractal Analysis of Contamination Particles in Unused Lubrication Oils. // Tribology International, 24, (1991), pp. 329-334.
[11] Atkinson, C. M.; Long, T. W. Neural Network-based Intelligent Engine Control for Reducing NOx and M Emissions from CIDI Engines. // Proceedings of the US DOE Diesel Engine Emissions Reduction Workshop, San Diego, CA, July 1997.

Studying the possibility of neural network application in the diagnostics of a small four-stroke petrol engine by wear particle content D. Lisjak et al.
862 Technical Gazette 19, 4(2012), 857-862
[12] Atkinson, C. M.; Long, T. W.; Hanzevack, E. L. Virtual Sensing: a Neural Network-Based Intelligent Performance and Emissions Prediction System for On-Board Diagnostics and Engine Control. // Proceedings of the 1998 SAE International Congress & Exposition, Detroit, USA. Vol. 1357, 1998, pp. 39-51.
[13] Lisjak, D.; Čala, I.; Štefanić, N. The Failure Rate Modeling using Neural Network. // Annals of DAAAM for 2009 & Proceedings of the 20th International DAAAM Symposium, Vienna, Austria, 2009, pp. 1455-1457.
[14] Hagan, M. T.; Menhaj, M. Training feed-forward networks with the Marquardt algorithm. // IEEE Transactions on Neural Networks, 5, 6(1999), pp. 989-993.
Authors' Adresses Dragutin Lisjak, Assist. Prof. Faculty of Mechanical Engineering and Naval Architecture University of Zagreb Ivana Lučića 5, 10000 Zagreb, Croatia E-mail: [email protected]
Gojko Marić, Assist. Prof. Faculty of Mechanical Engineering and Naval Architecture University of Zagreb Ivana Lučića 5, 10000 Zagreb, Croatia E-mail: [email protected]
Nedjeljko Štefanić, Assoc. Prof. Faculty of Mechanical Engineering and Naval Architecture University of Zagreb Ivana Lučića 5, 10000 Zagreb, Croatia E-mail: [email protected]