study on optimization method for working condition change
TRANSCRIPT

Study on Optimization Method for Working Condition Change Process of Steam-powered Ship
Fuel System
Zhaochun Tang, Jiashan Jin, He Ni* and Haibo Qin College of Power Engineering, Naval University of Engineering, Wuhan, China
*Corresponding author
Abstract—Aiming at the problem of pressure fluctuation in front of injector of a certain type of marine steam power plant fuel system caused by working condition change, a system optimization method is proposed, which combines the star-delta connection method of electric motor with the main pressure feedforward control. The mechanism model of fuel system components is established, and the simulation platform of Simuworks is used to build the system. Fuel system model, the fuel system pump switching process simulation and optimization experiments. The results show that the simulation model has good reductivity, and the error between the simulation model and the actual equipment is less than 0.3%. The simulation results after the improved control strategy show that the main pipe pressure and the pre-injector pressure change smoothly during the pump switching process, and there is no significant fluctuation. It proves that the method proposed in this paper can effectively control the pre-injector fuel. Oil pressure ensures the stable operation of the boiler for Working condition change process.
Keywords—fuel oil system; simulation; star triangle circuit; feedforward control; control optimization
I. INTRODUCTION
The fuel supplied to the boiler by the marine fuel system needs to meet the injection pressure requirement of the injector. In order to prevent the quick shutdown procedure of the boiler caused by insufficient fuel supply, a large number of control modes of excessive supply are adopted in a marine fuel system. Although the safety of the boiler operation is ensured, the fluctuation of the pressure before the injector is caused, which results in the fluctuation of the pressure before the injector. The problems of black smoke and increasing fuel consumption of boilers are discussed. Therefore, it is an urgent need to simulate and model the fuel system and study the optimal scheme of pressure control.
In recent years, some experts and scholars have done some research on the optimization of fuel system and achieved some
results. George N. Sakalis [1] uses cross-time static and dynamic optimization methods to optimize the overall design and operation strategy of marine fuel system. Xu Hu [2] optimizes the performance of fuel system by improving parameter matching. On the basis of the above research, this paper optimizes the start-stop mode of electric pump and the pressure control loop of the system. The optimization methods of start-stop of electric pump include frequency converter speed regulation method, soft start method, star triangle wiring method, etc.[3-4] because the operators of the system. Because of limited capacity, complex and old circuits, it is not suitable to be reformed substantially. Star triangle connection method is chosen to optimize. The optimization methods of the control loop include adding feedforward link, PID parameter optimization, model predictive control [5]. In the process of off-design, the real-time pressure change of the main pipe can be calculated in advance according to the speed of the pump, so the feedforward control method is introduced to optimize the main pipe pressure control loop.
Firstly, the dynamic simulation model of fuel system is established, and the off-design process is simulated. Using the motor star triangle wiring method and the feedforward control method of the main pipe pressure control loop, the optimization strategies of the start and stop process of the electric pump are formulated respectively, and the simulation experiments are carried out.
II. MODELING OF FUEL SYSTEM
A. Operation Control Principle of Fuel System
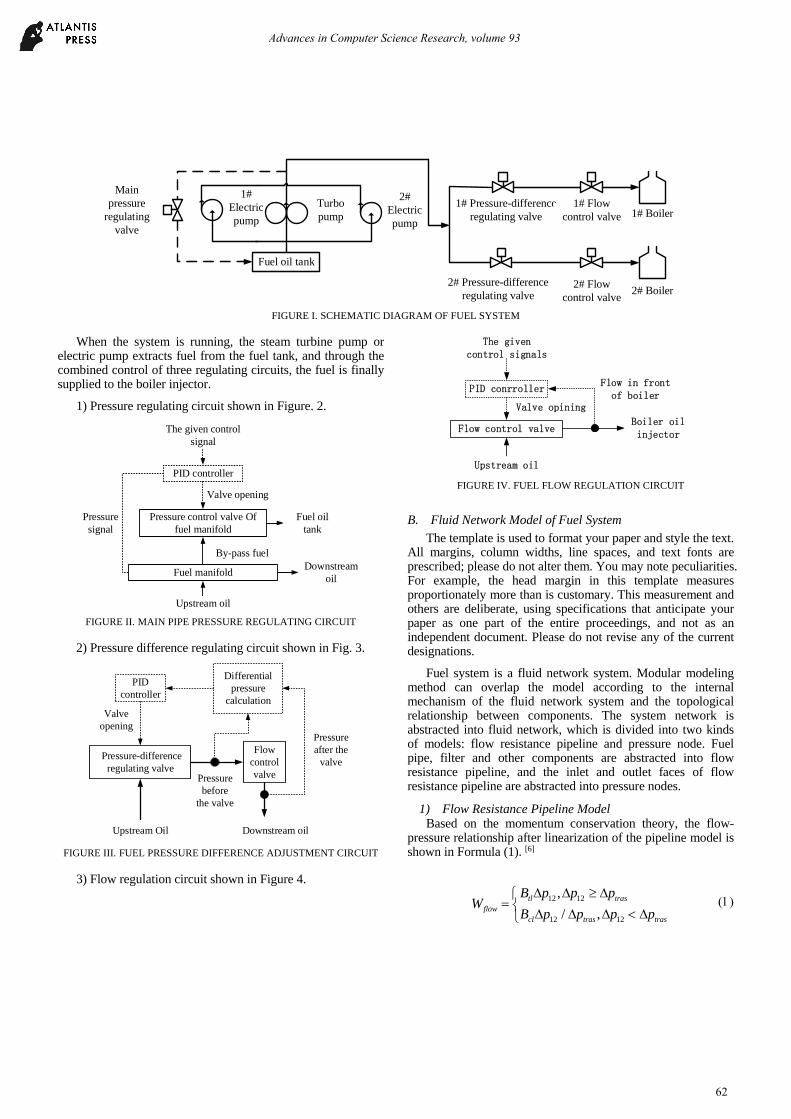
A certain type of marine fuel system is mainly composed of fuel tank, a steam turbine pump, two electric pumps and three pressure regulating circuits. The steam turbine fuel pump and one electric fuel pump are for daily use, while the other one is spare, as shown in Figure 1.
2nd International Conference on Mathematics, Modeling and Simulation Technologies and Applications (MMSTA 2019)
Copyright © 2019, the Authors. Published by Atlantis Press. This is an open access article under the CC BY-NC license (http://creativecommons.org/licenses/by-nc/4.0/).
Advances in Computer Science Research, volume 93
61
Main pressure
regulating valve
1#Electric pump
Fuel oil tank
2#Electric pump
Turbo pump
1# Pressure-difference regulating valve
2# Pressure-difference regulating valve
1# Flow control valve
2# Flow control valve
1# Boiler
2# Boiler
FIGURE I. SCHEMATIC DIAGRAM OF FUEL SYSTEM
When the system is running, the steam turbine pump or electric pump extracts fuel from the fuel tank, and through the combined control of three regulating circuits, the fuel is finally supplied to the boiler injector.
1) Pressure regulating circuit shown in Figure. 2.
Valve opening
By-pass fuel
The given control signal
Pressure signal
Fuel manifold
PID controller
Pressure control valve Of fuel manifold
Downstream oil
Upstream oil
Fuel oil tank
FIGURE II. MAIN PIPE PRESSURE REGULATING CIRCUIT
2) Pressure difference regulating circuit shown in Fig. 3.
Valve opening
Upstream Oil
Pressure before
the valve
Flow control valve
PID controller
Pressure-difference regulating valve
Differential pressure
calculation
Downstream oil
Pressure after the
valve
FIGURE III. FUEL PRESSURE DIFFERENCE ADJUSTMENT CIRCUIT
3) Flow regulation circuit shown in Figure 4.
Flow in front of boiler
Valve opining
The given control signals
Flow control valve
PID conrroller
Boiler oil injector
Upstream oil FIGURE IV. FUEL FLOW REGULATION CIRCUIT
B. Fluid Network Model of Fuel System
The template is used to format your paper and style the text. All margins, column widths, line spaces, and text fonts are prescribed; please do not alter them. You may note peculiarities. For example, the head margin in this template measures proportionately more than is customary. This measurement and others are deliberate, using specifications that anticipate your paper as one part of the entire proceedings, and not as an independent document. Please do not revise any of the current designations.
Fuel system is a fluid network system. Modular modeling method can overlap the model according to the internal mechanism of the fluid network system and the topological relationship between components. The system network is abstracted into fluid network, which is divided into two kinds of models: flow resistance pipeline and pressure node. Fuel pipe, filter and other components are abstracted into flow resistance pipeline, and the inlet and outlet faces of flow resistance pipeline are abstracted into pressure nodes.
1) Flow Resistance Pipeline Model Based on the momentum conservation theory, the flow-
pressure relationship after linearization of the pipeline model is shown in Formula (1). [6]
12 12
12 12
,
/ ,tl tras
flowcl tras tras
B p p pW
B p p p p
Advances in Computer Science Research, volume 93
62

In the formula: tlB is Turbulent Quasilinear Admittance
Coefficient, trasp isTransition pressure difference of fluid,
clB is Laminar admittance coefficient.
2) Pressure Node Model Node model is a part with a certain volume divided by the
boundary of the pipeline inlet and outlet. It can be obtained from the mass conservation equation, the relation is shown in Formula (2) [7].
( )
1 1
( )n m
poin
i i poin pass i
i i
dpK B p p W
dt
In the formula: poinp is node pressure;
( )pass iW is various
bypass flows (such as leakage) of pressure nodes; n is the number of flow resistance pipeline models connected to the node model; m is the number of bypass flows of the node
model; ip is the upstream or downstream pressure of the
connected flow resistance pipeline model; the linear admittance of the corresponding flow resistance pipeline model; and the fuel oil. Compression coefficient.
C. Major Equipment Model
1) Steam Turbine Model The auxiliary steam turbine of the steam pump is a single-
row non-regulating stage steam turbine, and output power shown in Formula (3) [8].
1 2( )turb stm turb turb turbP W H H
In the formula: stmW is the actual intake flow of the steam
turbine; turb is the internal efficiency;
1turbH and 2turbH is the
theoretical intake enthalpy and exhaust enthalpy of the steam turbine.
2) Motor Model A three-phase asynchronous motor is used in the electric
pump. The output power of the simplified star connection method and triangle connection method are shown in Formula (4).
3 cos
3 cosYP UI
P UI
In the model: U is rated voltage; I is rated current; cos is the power factor of the motor; the transmission efficiency of the motor.
3) Fuel Pump Model The fuel pump in the fuel system is a screw pump. Its flow
calculation formula is shown in Formula (5) and its power consumption is shown in Formula (6).
0060pump pW V n n
1 2 1000pump pump pump pumpP W P P
In the model: pumpW is the fuel flow rate for pump output;
0V is the volume for pump; pumpn is the speed for pump; 0n is
the number of cycles required to transfer 0V volume fuel for
pump; pumpP is the power consumption for pump;
1pumpP and
2pumpP is fuel pressure for inlet and outlet of pump respectively.
According to the law of conservation of energy, the dynamic equation of the fuel pump rotor is shown in Formula (7). [9]
2pump in pump
pump
dn P P
dt J
In the formula: pumpn is the speed of the fuel pump; inP is
the output power of the steam turbine or motor; turbJ is the
total inertia of the rotor.
D. Modulation Control Component Model
The three regulating loops of fuel system all use PID controller. The input of the controller is the difference between the given quantity and the regulated quantity. The output quantity is the pressure correction. The pressure correction outputs the regulated valve position after the function transformation, so that the regulated quantity can be stabilized at the given value. The PID algorithm in the control operation link is shown in Formula (8).
0
0
( ) ( ) ( )
1 ( )( ) ( ) ( )
t
p di
e t X t X t
de tY t K e t e t dt T
T dt
In the formula: ( )X t it is the regulated value, 0 ( )X t is the
given value, ( )Y t is the output value of the controller, ( )e t is the deviation value between the regulated quantity and the given quantity;
pK is the proportional coefficient, iT is the
integral time constant ; dT is the differential time constant.
Advances in Computer Science Research, volume 93
63
III. MODEL VALIDATION
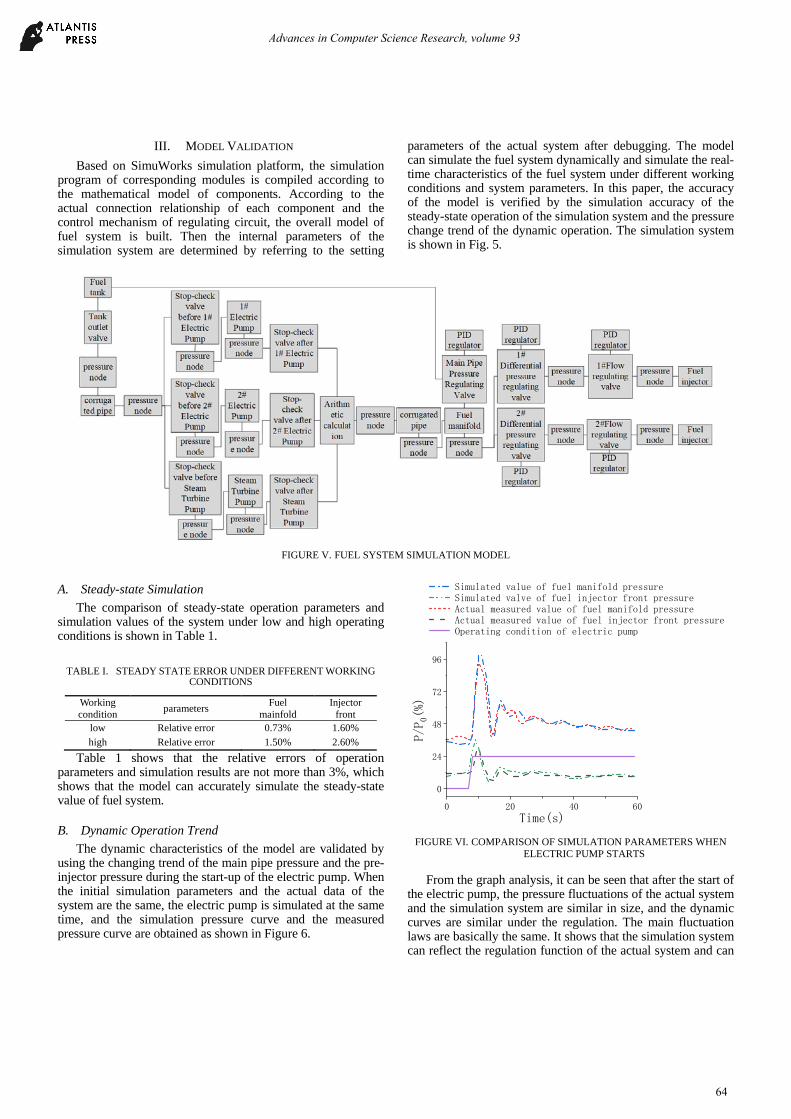
Based on SimuWorks simulation platform, the simulation program of corresponding modules is compiled according to the mathematical model of components. According to the actual connection relationship of each component and the control mechanism of regulating circuit, the overall model of fuel system is built. Then the internal parameters of the simulation system are determined by referring to the setting
parameters of the actual system after debugging. The model can simulate the fuel system dynamically and simulate the real-time characteristics of the fuel system under different working conditions and system parameters. In this paper, the accuracy of the model is verified by the simulation accuracy of the steady-state operation of the simulation system and the pressure change trend of the dynamic operation. The simulation system is shown in Fig. 5.
FIGURE V. FUEL SYSTEM SIMULATION MODEL
A. Steady-state Simulation
The comparison of steady-state operation parameters and simulation values of the system under low and high operating conditions is shown in Table 1.
TABLE I. STEADY STATE ERROR UNDER DIFFERENT WORKING CONDITIONS
Working condition
parameters Fuel
mainfold Injector
front low Relative error 0.73% 1.60%
high Relative error 1.50% 2.60%
Table 1 shows that the relative errors of operation parameters and simulation results are not more than 3%, which shows that the model can accurately simulate the steady-state value of fuel system.
B. Dynamic Operation Trend
The dynamic characteristics of the model are validated by using the changing trend of the main pipe pressure and the pre-injector pressure during the start-up of the electric pump. When the initial simulation parameters and the actual data of the system are the same, the electric pump is simulated at the same time, and the simulation pressure curve and the measured pressure curve are obtained as shown in Figure 6.
0 20 40 60
0
24
48
72
96
P/P 0(%)
Time(s)
Simulated value of fuel manifold pressure Simulated valve of fuel injector front pressure Actual measured value of fuel manifold pressure Actual measured value of fuel injector front pressure Operating condition of electric pump
FIGURE VI. COMPARISON OF SIMULATION PARAMETERS WHEN
ELECTRIC PUMP STARTS
From the graph analysis, it can be seen that after the start of the electric pump, the pressure fluctuations of the actual system and the simulation system are similar in size, and the dynamic curves are similar under the regulation. The main fluctuation laws are basically the same. It shows that the simulation system can reflect the regulation function of the actual system and can
Advances in Computer Science Research, volume 93
64

better simulate the regulation time of the real system. And the law of pressure change.
IV. SIMULATION RESULTS OF OPTIMIZATION
According to the feedback from users, the black smoke mainly occurs in the two processes of the system from high to low and from low to high. In order to verify the optimization method in this paper, the simulation experiments of the above processes are carried out respectively.
A. Process of Low to High Condition
1) Simulation Results before Optimization When the low working condition changes to the high
working condition, the control method of the actual system is: 1 electric pump starts directly, and the control loop is switched to the given value of the high working condition pressure. In the simulation system, it is assumed that a steam turbine pump operates and an electric pump is started in 8 seconds, and the given value of the regulating circuit is changed to rated pressure. The experimental data are shown in Figure 8.
0 10 20 30 40 50
0
33
66
99
Pressure of fuel
manifold(%)
Time(s)
Pressure in front of the injector Pressure of fuel manifold Turbine pump speed Electric pump speed Pressure difference regulating valve opening Fuel flow regulation valve opening Fuel pressure regulating valve opening
0
33
66
99
Pressure in front of
the injector(%)
0
30
60
90
Valve opening(
%)
0
33
67
100
Pump sp
eed(%)
FIGURE VII. PARAMETERS CHANGE WHEN THE SYSTEM
AUTOMATICALLY CHANGES INTO HIGH OPERATING CONDITION
The test results show that the main pipe pressure reaches 244% of the rated pressure as the speed of the electric pump rises to rated speed in 8 seconds, the pressure before the injector rises to peak pressure and reaches 292% of the rated pressure, and then decreases to rated pressure as the opening of the main pipe pressure regulating valve increases in 10 seconds to 15 seconds. After that, under the effect of feedback regulation, the main pipe pressure and the injector front pressure gradually stabilize to a given value.
2) Simulation Results after Optimization Assuming that the system runs steadily under low operating
conditions, the star connection method is used to start the motor in 12 seconds, and the triangle connection method is switched to 39 seconds. The main pipe pressure feedforward
control is used to start the whole process of the pump. The simulation results are shown in Fig. 10.
0 25 50 75 100 1250
25
50
75
100
Pressure of Fuel manifold(%)
Time(s)
Pressure in front of the injector Pressure of Fuel manifold Turbine pump speed Electric pump speed Pressure difference regulating valve opening Fuel flow regulation valve opening Fuel pressure regulating valve opening
0
33
66
100
Pressure in front of the injector(%)
0
20
40
60
Valv
e op
enin
g(
%)
0
33
67
100
Pump speed(%)
FIGURE VIII. PARAMETERS CHANGE WHEN ELECTRIC PUMP
START UP
The simulation results show that 60 seconds are spent in the process of electric pump speed from 0 to rated speed; under the action of feedforward control of the main pipe pressure, the magnitude of the main pipe pressure changes correspondingly decreases with the change of the main pipe speed; and the pressure before the injector basically increases steadily. In this paper, the simulation results of star triangle switching time in 5-45 seconds are compared, and the better time interval of star triangle switching is 25-30 seconds.
B. Process of High to Low Condition
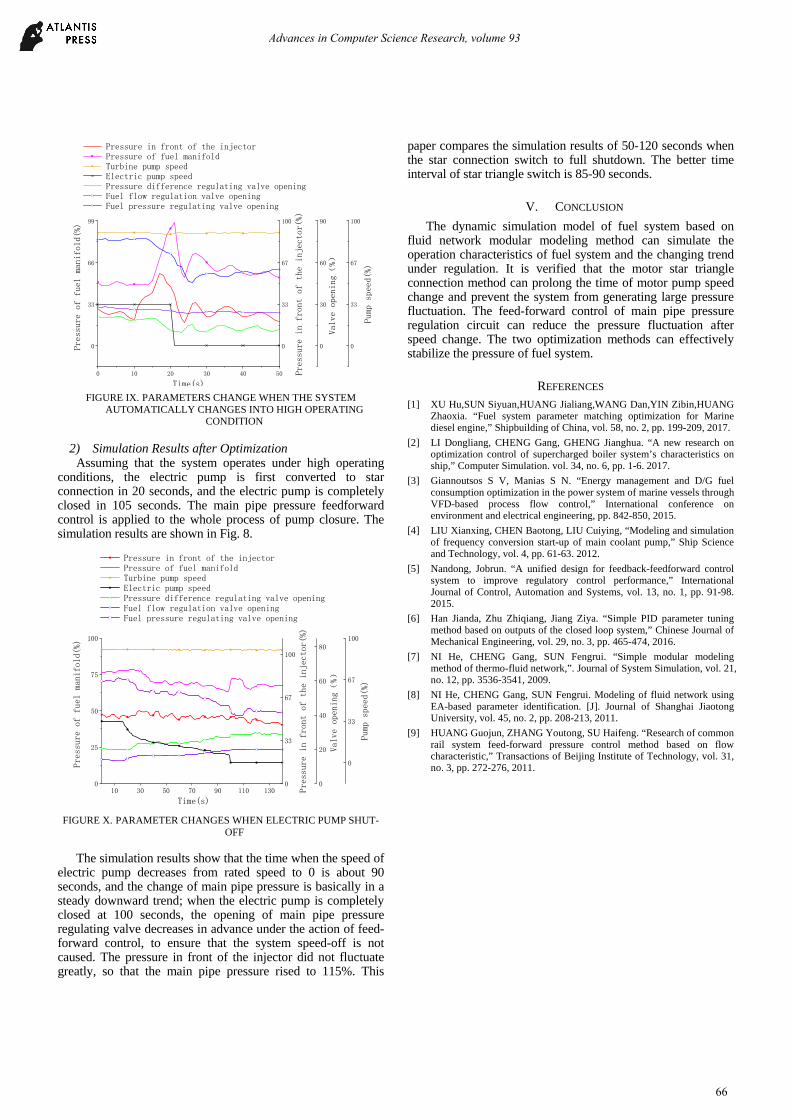
1) Simulation Results before Optimization The control method of the actual system is: after receiving
the off-design signal, the adjusting circuit is switched to a given value of 2 times the low-condition pressure, and the main pipe pressure reaches a given value of 2 times, the electric pump is closed, and the control circuit is switched to a given value of the low-condition pressure. In the simulation system, assuming that the steam turbine pump and an electric pump are running simultaneously, the given value of the main pipe pressure regulating circuit is set to set pressure in 10 seconds. When the main pipe pressure changes to set pressure , the electric fuel pump is stopped, and then the given value is set to rated pressure. The simulation results are shown in Fig. 9.
The simulation results show that the main pipe pressure rises to set pressure at 20s, reaching 196% of the rated pressure. The pressure in front of the injector reaching 148% of the rated pressure. Then the electric pump closes and the main pipe pressure drops rapidly, and then gradually stabilizes at the given value.
Advances in Computer Science Research, volume 93
65
0 10 20 30 40 50
0
33
66
99
Pressure of fuel manifold(%)
Time(s)
Pressure in front of the injector Pressure of fuel manifold Turbine pump speed Electric pump speed Pressure difference regulating valve opening Fuel flow regulation valve opening Fuel pressure regulating valve opening
0
33
67
100
Pressure in front of the injector(%)
0
30
60
90
Valve opening(%)
0
33
67
100
Pump speed(%)
FIGURE IX. PARAMETERS CHANGE WHEN THE SYSTEM
AUTOMATICALLY CHANGES INTO HIGH OPERATING CONDITION
2) Simulation Results after Optimization Assuming that the system operates under high operating
conditions, the electric pump is first converted to star connection in 20 seconds, and the electric pump is completely closed in 105 seconds. The main pipe pressure feedforward control is applied to the whole process of pump closure. The simulation results are shown in Fig. 8.
10 30 50 70 90 110 1300
25
50
75
100
Press
ure
of fuel m
anifold(%
)
Time(s)
Pressure in front of the injector Pressure of fuel manifold Turbine pump speed Electric pump speed Pressure difference regulating valve opening Fuel flow regulation valve opening Fuel pressure regulating valve opening
0
33
67
100
Press
ure
in front
of the in
jector(%)
0
20
40
60
80
Valve ope
ning
(%)
0
33
67
100
Pump speed
(%)
FIGURE X. PARAMETER CHANGES WHEN ELECTRIC PUMP SHUT-
OFF
The simulation results show that the time when the speed of electric pump decreases from rated speed to 0 is about 90 seconds, and the change of main pipe pressure is basically in a steady downward trend; when the electric pump is completely closed at 100 seconds, the opening of main pipe pressure regulating valve decreases in advance under the action of feed-forward control, to ensure that the system speed-off is not caused. The pressure in front of the injector did not fluctuate greatly, so that the main pipe pressure rised to 115%. This
paper compares the simulation results of 50-120 seconds when the star connection switch to full shutdown. The better time interval of star triangle switch is 85-90 seconds.
V. CONCLUSION
The dynamic simulation model of fuel system based on fluid network modular modeling method can simulate the operation characteristics of fuel system and the changing trend under regulation. It is verified that the motor star triangle connection method can prolong the time of motor pump speed change and prevent the system from generating large pressure fluctuation. The feed-forward control of main pipe pressure regulation circuit can reduce the pressure fluctuation after speed change. The two optimization methods can effectively stabilize the pressure of fuel system.
REFERENCES [1] XU Hu,SUN Siyuan,HUANG Jialiang,WANG Dan,YIN Zibin,HUANG
Zhaoxia. “Fuel system parameter matching optimization for Marine diesel engine,” Shipbuilding of China, vol. 58, no. 2, pp. 199-209, 2017.
[2] LI Dongliang, CHENG Gang, GHENG Jianghua. “A new research on optimization control of supercharged boiler system’s characteristics on ship,” Computer Simulation. vol. 34, no. 6, pp. 1-6. 2017.
[3] Giannoutsos S V, Manias S N. “Energy management and D/G fuel consumption optimization in the power system of marine vessels through VFD-based process flow control,” International conference on environment and electrical engineering, pp. 842-850, 2015.
[4] LIU Xianxing, CHEN Baotong, LIU Cuiying, “Modeling and simulation of frequency conversion start-up of main coolant pump,” Ship Science and Technology, vol. 4, pp. 61-63. 2012.
[5] Nandong, Jobrun. “A unified design for feedback-feedforward control system to improve regulatory control performance,” International Journal of Control, Automation and Systems, vol. 13, no. 1, pp. 91-98. 2015.
[6] Han Jianda, Zhu Zhiqiang, Jiang Ziya. “Simple PID parameter tuning method based on outputs of the closed loop system,” Chinese Journal of Mechanical Engineering, vol. 29, no. 3, pp. 465-474, 2016.
[7] NI He, CHENG Gang, SUN Fengrui. “Simple modular modeling method of thermo-fluid network,”. Journal of System Simulation, vol. 21, no. 12, pp. 3536-3541, 2009.
[8] NI He, CHENG Gang, SUN Fengrui. Modeling of fluid network using EA-based parameter identification. [J]. Journal of Shanghai Jiaotong University, vol. 45, no. 2, pp. 208-213, 2011.
[9] HUANG Guojun, ZHANG Youtong, SU Haifeng. “Research of common rail system feed-forward pressure control method based on flow characteristic,” Transactions of Beijing Institute of Technology, vol. 31, no. 3, pp. 272-276, 2011.
Advances in Computer Science Research, volume 93
66