study on impact of apparel brand name in consumer
TRANSCRIPT

Volume 5, Issue 12, December – 2020 International Journal of Innovative Science and Research Technology
ISSN No:-2456-2165
IJISRT20DEC454 www.ijisrt.com 810
Study on Impact of Apparel Brand Name in
Consumer Behaviour for Casual Wear Clothing on
Youth of India
Kavya Jhanji
Abstract :- Various personal, psychological and social
factors affect the consumer buying decision. Brand name
act as a prime driving force that can affect the buyer’s
behavior and purchase intension. It influences
consumers ’preferences, their preparedness to pay a
premium price and advocate the brand to others.
Consumers are more likely to appraise the apparel
product positively, regardless of market price, when they
hold a strong and constructive brand image.The aim of
the paper is to identify the attitude and behaviour of
consumers towards brand that have higher market value
and how it impacts on the decision making process. The
inference is based on survey of 80 respondents, wardrobe
analysis and social media analysis. The results reflect
that strong brand name for casual wear clothing has a
positive and significant impact on youth of India. Brand
name plays a significant role in decision making process
and resultantly, the youth of India is encouraged to pay a
premium price for the apparel that holds a strong brand
name.
Keywords: Consumer behaviour, Consumer Preferences,
Consumer Attitude, Casual Wear, Apparel Brand
I. INTRODUCTION
The competition has been increasing due to
globalisation & increased supply and has brought great
hardships on companies in terms of sustaining in the market.
Companies have to adopt various marketing strategies in
order to create trust in consumers and make their products stand out from other the products of their competitors.
A company’s brand carries monetary value, helps to
differentiate a company from others and gives consumers
quality assurance and guarantees. Hence a company should
firstly embody an accurate brand identity study or how it
wants its brand to be viewed by its consumer. Corporate
identity expresses a company’s role and function and is used
to transmit a company’s targets and values. Hence it can be
presented to consumers in various visual aspects.
Keller (1997) demonstrates that the brand image is important in apparel purchase behavior because it impacts
consumers ’preferences, their willingness to pay a premium
price and recommend the brand to others. Consumers are
more likely to assess the apparel product positively,
regardless of market price when they hold a strong and
constructive brand image.
As things currently stand, brand plays a supreme role
to boost the economy of a country. Brand is one of the tools
that can change the buyer’s behavior and purchase intension.
Today, people are more conscious about the brand than they
were in the past but there are limited studies to find out the
impact of brand on consumer behavior for casual wear
clothing on youth of India in 2019. Hence this study is
conducted to examine the buying behavior of youth in respect of a brand name or brand image.
Objectives
This study aims at identifying the attitude of consumers
towards brand with higher market value.
To explore the effect of brand name on consumer
decision making,
To understand the buying behavior of consumers with
respect to brand
II. LITERATURE REVIEW
The review of study on impact of apparel brand name
in consumer behavior for casual wear clothing on youth of
India focuses on brand equity, brand awareness, brand
image, brand association, consumer behaviour and
consumer buying decision process.
Brand equity
Brand equity is defined as social value of a brand
name and its symbol. It has an ability to impose beneficial
or detrimental effects on the values arising from the product
or services.
For instance, in De Chernatony’s book ‘Creating Powerful
Brands’, the author depicts a brand equity test between Diet
Pepsi and Diet Coke. Where first the 2 brands are concealed,
the test shows that 51% of the consumers prefer Pepsi while
44% of them prefer Coke while 5% of them cannot tell the
difference. For contrast, when the test is conducted without
concealing the brands showing a significant differences, it
shows that only 23% of the buyer prefers Pepsi and
therefore the proportion of the buyer who prefers Coke
increases to 65% and 12% of them thinks that two brands of
cola are equal.
Brand awareness
Brand awareness is one of the major drivers of brand
equity. Brand awareness is the ability of a possible buyer to
classify and bring to mind the association to the brand as
good. It refers to the degree of familiarity of consumer with
Volume 5, Issue 12, December – 2020 International Journal of Innovative Science and Research Technology
ISSN No:-2456-2165
IJISRT20DEC454 www.ijisrt.com 811
the brand. Hence it is the strength of a brand’s existence in
the mind of the consumer.
Brand Image
In the present competitive market place, consumers
need to make their choice between a variety of brands in the
market that differ very small in its price or function. Usually
their final decision depends on the image they relate with
dissimilar brands. Brand image is the current interpretation
of the brand in consumer’s mind. It is not inherent in the
technical, functional or physical concerns of the product but
affected by marketing strategies and characteristics of the
perceiver. A good brand image is one of the most important
assets a firm possesses.
Brand association
Brand associations is the main key word when
analyzing literature on brand image. Brand associations are
the images and the symbols related to the brand. It is the
perceived quality of the brand to a brand associated known
entity. Building of a positive brand association is critical to
develop the image of a brand that differs brands have
different associations to their prospective customers. It helps
the buyers to recall the brand on account of its unique
properties. It helps brand to retain the customer helping them to make purchase decisions and even become loyal to
the brand. A good brand association adds to the possibility
of increased brand equity.
Consumer behaviour
Consumer behaviour is linked to the actions of the
consumers in the marketplace and the motives for those
actions. Consumer buys products according to their needs,
preferences, group influence, marketing campaign and
purchasing power. Consumer behaviour depends on various
personal, psychological and social factors. Analysing
consumer behavior is important to attract new customers and also to retain existing customers. It is also important to a
company to predict future trends, innovate new product and
improve customer service.
Consumer buying decision process
The buying decision process plays different roles in
the decision-making process. Buying decision is divided
into five functions:
Initiator: The one who first suggests the thought of
shopping for the merchandise
Influencer: The one who persuade others within the
group of individuals to shop for the merchandise
Decider: The individual with the facility to form the
conclusive choice regarding whether to shop for, what to
shop for, the way to buy, or where to shop for. Buyer: The one that makes the particular purchase
User: The one that finally consumes the merchandise
III. RESEARCH METHODOLOGY
The present study aims to determine the factors
affecting consumers purchase intentions towards branded
apparel that is available in the market. The study has
provided the variation of the consumers in making choices
for branded apparel. The study has been conducted among
the students of different colleges. To get a clear understanding of the role of different factors and marketing
strategies of a brand and finally affecting consumer
perception and consumer behaviour , various factors viz.
advertisement of the brand, promotion of the brand, price of
the brand and image of the brand have been studied.
Sampling method involved is simple random sampling
method. It is a method of sampling , which involves random
selection of members selected without specifying any
criteria for selection.
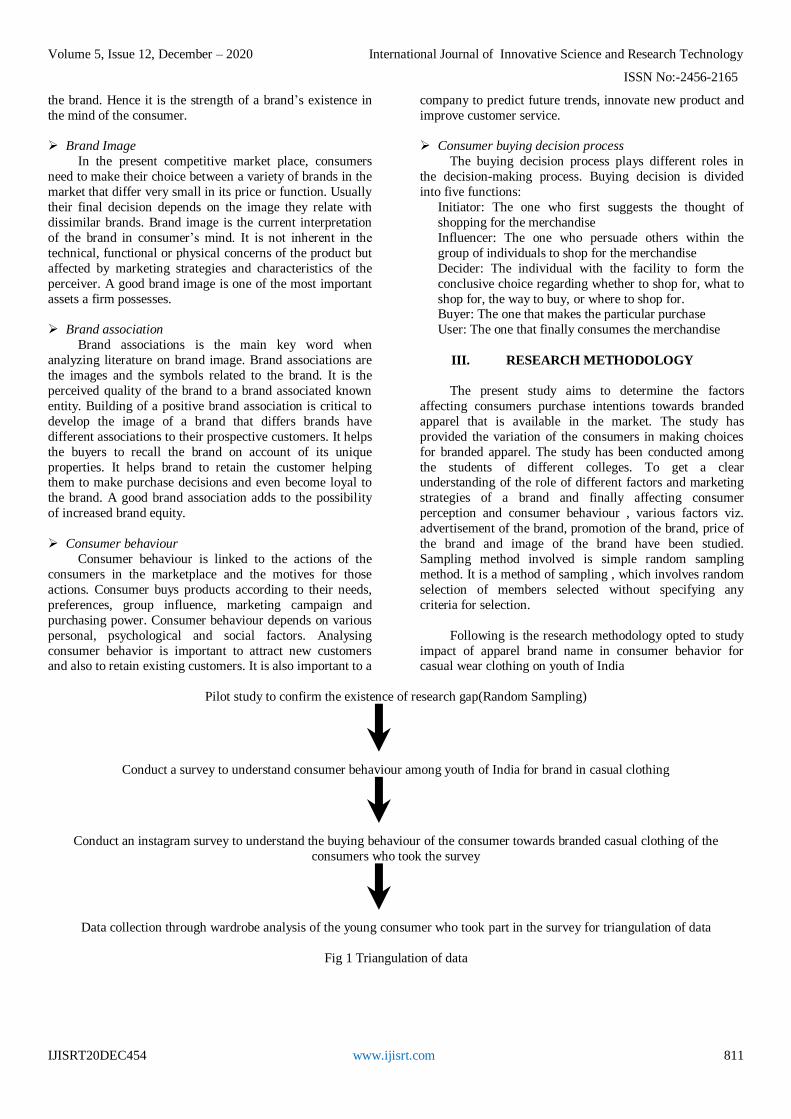
Following is the research methodology opted to study
impact of apparel brand name in consumer behavior for casual wear clothing on youth of India
Pilot study to confirm the existence of research gap(Random Sampling)
Conduct a survey to understand consumer behaviour among youth of India for brand in casual clothing
Conduct an instagram survey to understand the buying behaviour of the consumer towards branded casual clothing of the
consumers who took the survey
Data collection through wardrobe analysis of the young consumer who took part in the survey for triangulation of data
Fig 1 Triangulation of data

Volume 5, Issue 12, December – 2020 International Journal of Innovative Science and Research Technology
ISSN No:-2456-2165
IJISRT20DEC454 www.ijisrt.com 811
Pre-test (Pilot run)
Before the data collection, a visual examination through convenience sampling is conducted to learn about
people’s preferences of the brands available in the market
through their photos on social media and wardrobe audit and
identified that age group between 13 - 30 mostly preferred
buying from brands like H&M, Zara, Marks & Spencer as
their products are trendy and reliable.
Followed by a feasibility study to ensure the presence
of gap and feasibility of the research paper. This is done
using a set of 5 questions circulated in a circle of 30 people
to understand their preference of branded casual wear over
non branded and percentage of people to whom brand name affects their shopping preference.
Primary Data (Survey)
After the gap is understood, a set of detailed
questionnaire survey with 80 people is conducted in age
group of 13-25 to understand the brand consciousness ,
materialism , social comparison, fashion innovative and involvement and perceived value of brand. Based on the
visual examination and people’s perception, a detailed
survey was designed to identify the customer’s attitude and
perception on branded products and also to identify whether
the attitude and perception really affects their shopping.
Secondary Data (Instagram Analysis)
After the primary data set is collected, the set of 30
people through simple random sampling who took the
survey are analysed through various social media platforms
to validate the responses collected through primary data
collection process.
Triangulation Data (Wardrobe Analysis)
After the secondary data collection, triangulation of
data is completed by analysing wardrobe of sample size of
10 people.
IV. RESEARCH FINDINGS
Below are the outcomes involved in research process obtained through primary and secondary data collection method.
4.1 Initial findings
Figure 2 Brand preference of casual wear
Volume 5, Issue 12, December – 2020 International Journal of Innovative Science and Research Technology
ISSN No:-2456-2165
IJISRT20DEC454 www.ijisrt.com 813
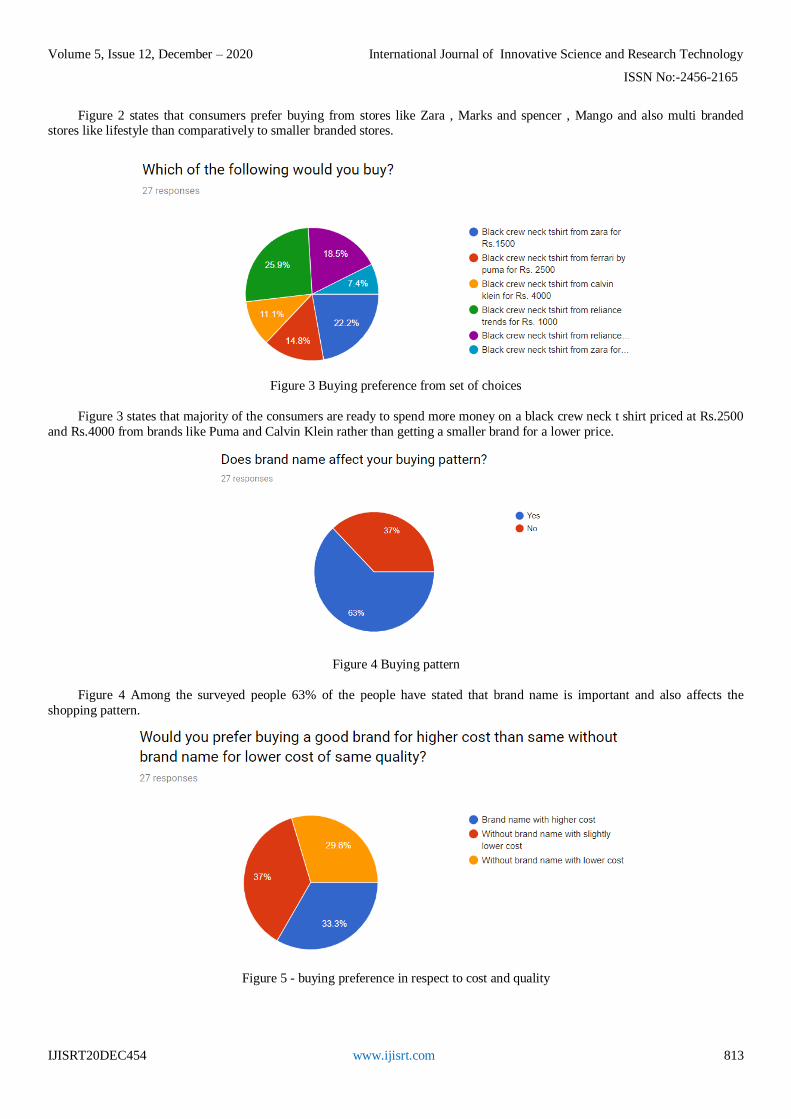
Figure 2 states that consumers prefer buying from stores like Zara , Marks and spencer , Mango and also multi branded stores like lifestyle than comparatively to smaller branded stores.
Figure 3 Buying preference from set of choices
Figure 3 states that majority of the consumers are ready to spend more money on a black crew neck t shirt priced at Rs.2500
and Rs.4000 from brands like Puma and Calvin Klein rather than getting a smaller brand for a lower price.
Figure 4 Buying pattern
Figure 4 Among the surveyed people 63% of the people have stated that brand name is important and also affects the
shopping pattern.
Figure 5 - buying preference in respect to cost and quality

Volume 5, Issue 12, December – 2020 International Journal of Innovative Science and Research Technology
ISSN No:-2456-2165
IJISRT20DEC454 www.ijisrt.com 814
Figure 5 states that cost also matters to the consumer just like how brand does. Consumers would still buy a non branded
product at a lower cost if it is just to get the look of the product. Hence cost factor in their buying pattern plays a major role.
Figure 6-Reasons for preference
Figure 6 states that people prefer buying a good branded product majorly because of the good quality products the brand
provide and also the long standing reputation and trust in the market which helps them shop without a doubt.
4.2 Wardrobe analysis
Figure 7-Wardrobe audit
After understanding the preferences of the respondents, ten respondents were chosen and a wardrobe audit was conducted to
compare their responses and what they have actually shopped. Like their responses, their buying pattern matched with their
responses and owned branded casual wear majorly. Figure 7 states the ratios of branded is to non branded garments the chosen
respondents for wardrobe audit owned.
4.3 Detailed survey In order to provide a clear overview of the results of respondents ’attitudes are grouped according to the selected criteria of
the respondents ’such as buying platform preferences, brand choices, gender, age, expenditure, etc.

Volume 5, Issue 12, December – 2020 International Journal of Innovative Science and Research Technology
ISSN No:-2456-2165
IJISRT20DEC454 www.ijisrt.com 815
Figure i-Shopping medium of consumers
Figure i shows results in the form of a pie chart of respondents ’answers after giving the online shopping platforms as
online and offline. From the pie chart we can understand that 74.7% men and women prefer to buy casual wear from physical stores (offline) and 21.3% on online shopping platforms.
Figure ii-International vs domestic brand preference
In figure ii Respondents ’attitudes towards popular international brands are very positive, 89.3 % men and women are
preferring international brands over domestic brands because of their perception of international brands having a higher market
value.
Figure iii-Perceived brand quality
Volume 5, Issue 12, December – 2020 International Journal of Innovative Science and Research Technology
ISSN No:-2456-2165
IJISRT20DEC454 www.ijisrt.com 816
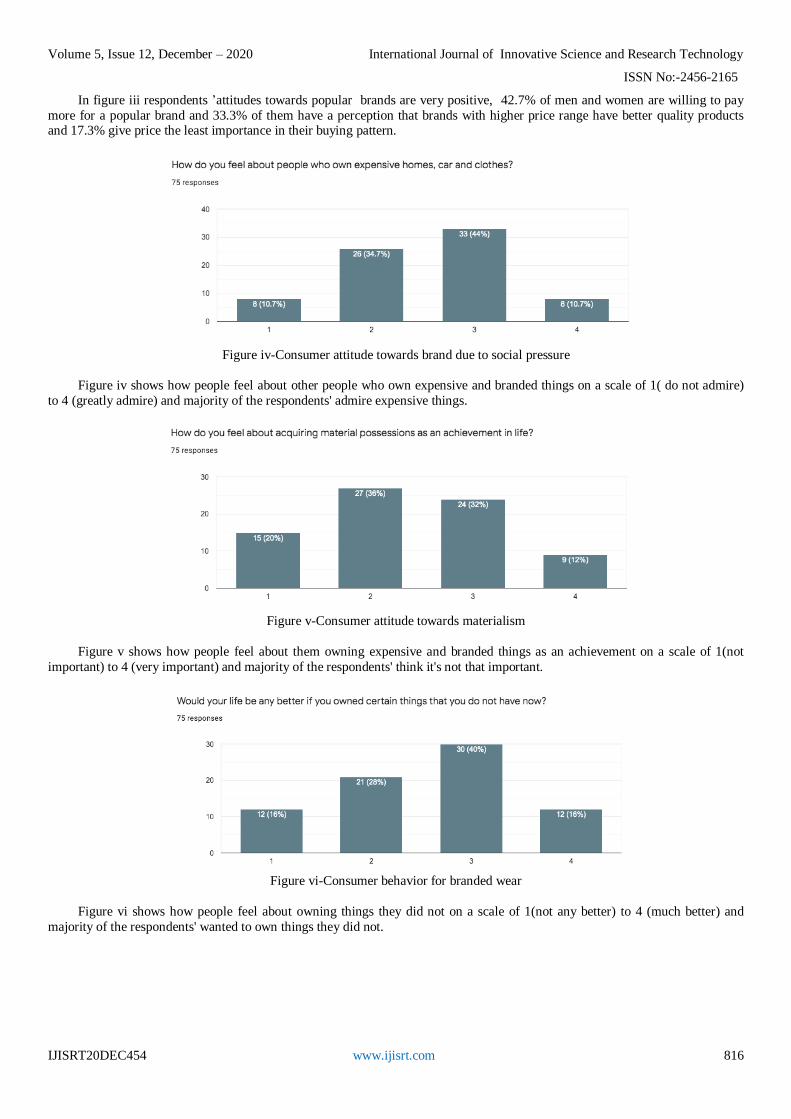
In figure iii respondents ’attitudes towards popular brands are very positive, 42.7% of men and women are willing to pay
more for a popular brand and 33.3% of them have a perception that brands with higher price range have better quality products and 17.3% give price the least importance in their buying pattern.
Figure iv-Consumer attitude towards brand due to social pressure
Figure iv shows how people feel about other people who own expensive and branded things on a scale of 1( do not admire)
to 4 (greatly admire) and majority of the respondents' admire expensive things.
Figure v-Consumer attitude towards materialism
Figure v shows how people feel about them owning expensive and branded things as an achievement on a scale of 1(not
important) to 4 (very important) and majority of the respondents' think it's not that important.
Figure vi-Consumer behavior for branded wear
Figure vi shows how people feel about owning things they did not on a scale of 1(not any better) to 4 (much better) and
majority of the respondents' wanted to own things they did not.

Volume 5, Issue 12, December – 2020 International Journal of Innovative Science and Research Technology
ISSN No:-2456-2165
IJISRT20DEC454 www.ijisrt.com 817
Figure vii-Consumer attitude towards branded
Figure vii shows how people feel about affording expensive and branded things on a scale of 1(not any happier) to 4 (much
happier) and majority of the respondents' say that they would be happier being able to afford more things.
Figure viii- Consumer attitude towards branded
Figure viii shows how people feel about things describing how well people are doing in their lives on a scale of 1(very little)
to 4 (a great deal) and majority of the respondents' think that things people own say a lot about their lifestyle.
Figure Ix- Consumer attitude towards branded

Volume 5, Issue 12, December – 2020 International Journal of Innovative Science and Research Technology
ISSN No:-2456-2165
IJISRT20DEC454 www.ijisrt.com 818
Figure x-Consumer attitude towards branded
Figure ix & x shows the list of influencers that affect people’s sense of fashion and shopping and majority of the
respondents' get influenced by celebrities, models, sportstars and social media mainly instagram.
Figure xi- Consumer behavior to branded casual wear
Figure xi shows the buying pattern of the respondents and majority of the respondents buy clothes when it is trending.

Volume 5, Issue 12, December – 2020 International Journal of Innovative Science and Research Technology
ISSN No:-2456-2165
IJISRT20DEC454 www.ijisrt.com 819
Figure xii-Consumer behaviour to purchase of casual wear
Figure xii shows that majority of the respondents have bought less than 10 casual wear in the past 3 months.
Figure xiii-Consumer attitude towards quality
Figure xiii shows how people feel about better brands having better quality products from the scale 1(strongly agree) to
5(strongly disagree) and most of them agree to the fact that better brands provide better quality.
Figure xiv-Consumer attitude towards branded possession
Figure xiv shows how people feel about branded products being better in every way than other products from the scale
1(strongly agree) to 5(strongly disagree) and most of them agree to the fact that branded products are better.
Volume 5, Issue 12, December – 2020 International Journal of Innovative Science and Research Technology
ISSN No:-2456-2165
IJISRT20DEC454 www.ijisrt.com 820
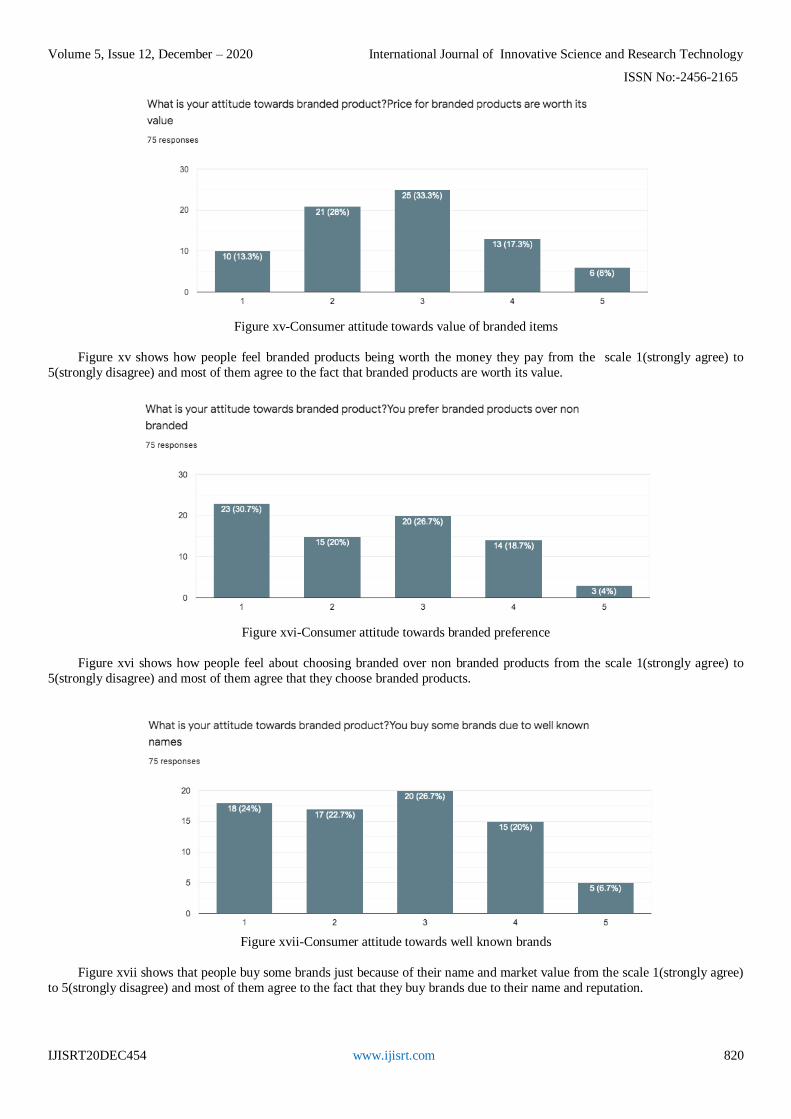
Figure xv-Consumer attitude towards value of branded items
Figure xv shows how people feel branded products being worth the money they pay from the scale 1(strongly agree) to
5(strongly disagree) and most of them agree to the fact that branded products are worth its value.
Figure xvi-Consumer attitude towards branded preference
Figure xvi shows how people feel about choosing branded over non branded products from the scale 1(strongly agree) to
5(strongly disagree) and most of them agree that they choose branded products.
Figure xvii-Consumer attitude towards well known brands
Figure xvii shows that people buy some brands just because of their name and market value from the scale 1(strongly agree)
to 5(strongly disagree) and most of them agree to the fact that they buy brands due to their name and reputation.

Volume 5, Issue 12, December – 2020 International Journal of Innovative Science and Research Technology
ISSN No:-2456-2165
IJISRT20DEC454 www.ijisrt.com 821
Figure xviii-Consumer attitude towards possession of branded items
Figure xviii shows if people feel confident wearing branded products from the scale 1(strongly agree) to 5(strongly disagree)
and most of them agree to the fact that they feel confident wearing branded clothing.
Figure xix-Consumer attitude towards perceived status of branded product
Figure xix shows people’s perception about branded products being a representation of social status and wealth from the
scale 1(strongly agree) to 5(strongly disagree).
Figure xx-Gender ratio of respondents
Figure xx shows that 56% of the respondents were women, 42.7% were men and 1.3% belonged to other category.

Volume 5, Issue 12, December – 2020 International Journal of Innovative Science and Research Technology
ISSN No:-2456-2165
IJISRT20DEC454 www.ijisrt.com 822
Figure xxi-Age group classification of respondents
Figure xxi shows that 76% of the respondents were in between the age group of 20-30 years and 24% of the respondents
were in between the age group of 13-20 years.
Figure xxii-Monthly expenditure of respondents
Figure xxiii- Monthly expenditure of respondents
Volume 5, Issue 12, December – 2020 International Journal of Innovative Science and Research Technology
ISSN No:-2456-2165
IJISRT20DEC454 www.ijisrt.com 823
Figure xxii & xxiii show the monthly expenditure of the respondents and we got a huge range starting from Rs 1,000 to Rs 25,000 and majority of respondents spend about Rs 2000 to Rs 5000 monthly.
4.4 Results In order to provide a clear overview of the results of respondents ’attitudes are grouped according to the selected criteria of
the respondents ’such as buying platform preferences, brand choices, gender, age, expenditure, etc.
For the question if the respondents prefer shopping online or offline, the results show that 74.7% men and women prefer to
buy casual wear from physical stores (offline) and 21.3% on online shopping platforms.
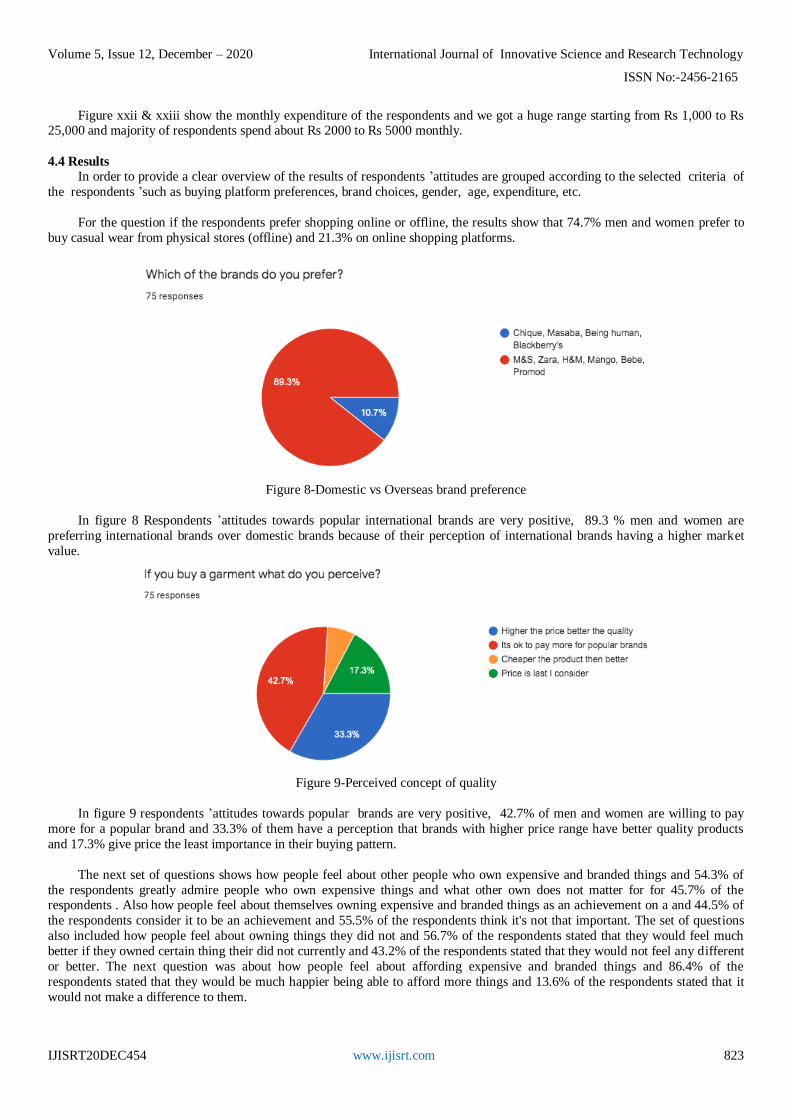
Figure 8-Domestic vs Overseas brand preference
In figure 8 Respondents ’attitudes towards popular international brands are very positive, 89.3 % men and women are
preferring international brands over domestic brands because of their perception of international brands having a higher market
value.
Figure 9-Perceived concept of quality
In figure 9 respondents ’attitudes towards popular brands are very positive, 42.7% of men and women are willing to pay
more for a popular brand and 33.3% of them have a perception that brands with higher price range have better quality products
and 17.3% give price the least importance in their buying pattern.
The next set of questions shows how people feel about other people who own expensive and branded things and 54.3% of
the respondents greatly admire people who own expensive things and what other own does not matter for for 45.7% of the respondents . Also how people feel about themselves owning expensive and branded things as an achievement on a and 44.5% of
the respondents consider it to be an achievement and 55.5% of the respondents think it's not that important. The set of questions
also included how people feel about owning things they did not and 56.7% of the respondents stated that they would feel much
better if they owned certain thing their did not currently and 43.2% of the respondents stated that they would not feel any different
or better. The next question was about how people feel about affording expensive and branded things and 86.4% of the
respondents stated that they would be much happier being able to afford more things and 13.6% of the respondents stated that it
would not make a difference to them.
Volume 5, Issue 12, December – 2020 International Journal of Innovative Science and Research Technology
ISSN No:-2456-2165
IJISRT20DEC454 www.ijisrt.com 824
The next question was about how people feel about things describing how well people are doing in their lives on a scale and
59.2% of the respondents think it is a great deal and things people own say a lot about their lifestyle but 40.8% of the respondents think it has very little impact.
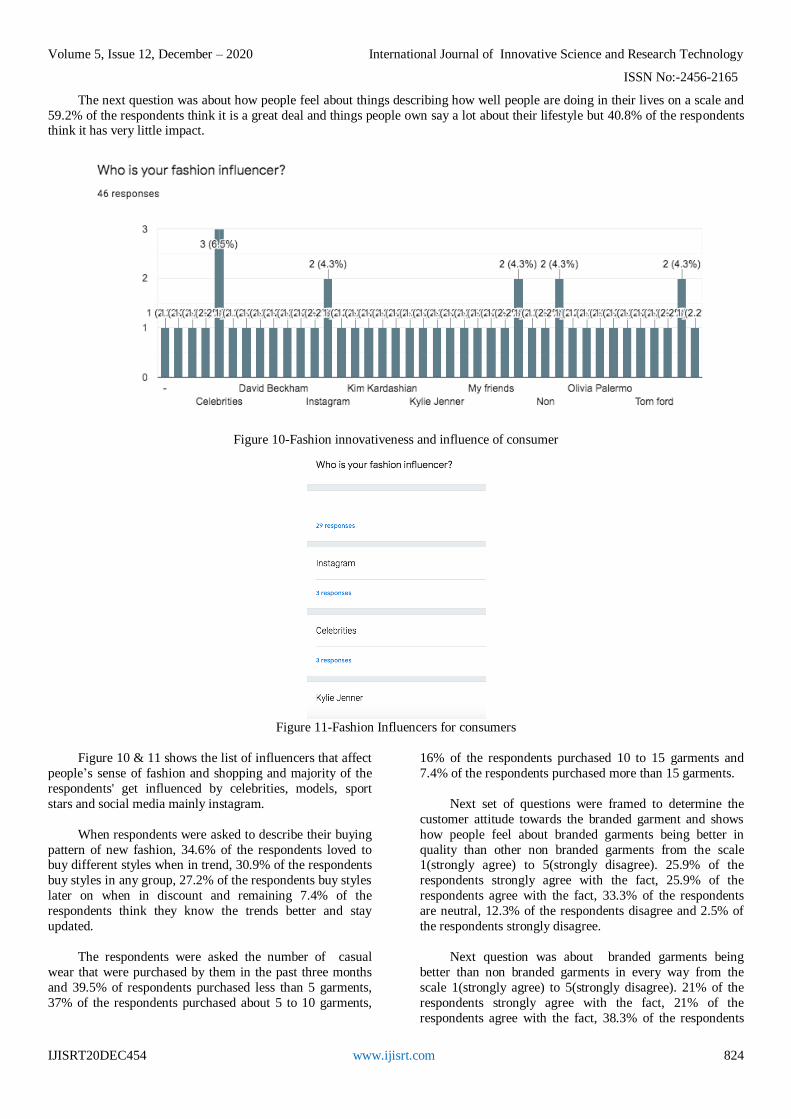
Figure 10-Fashion innovativeness and influence of consumer
Figure 11-Fashion Influencers for consumers
Figure 10 & 11 shows the list of influencers that affect
people’s sense of fashion and shopping and majority of the
respondents' get influenced by celebrities, models, sport
stars and social media mainly instagram.
When respondents were asked to describe their buying
pattern of new fashion, 34.6% of the respondents loved to buy different styles when in trend, 30.9% of the respondents
buy styles in any group, 27.2% of the respondents buy styles
later on when in discount and remaining 7.4% of the
respondents think they know the trends better and stay
updated.
The respondents were asked the number of casual
wear that were purchased by them in the past three months
and 39.5% of respondents purchased less than 5 garments,
37% of the respondents purchased about 5 to 10 garments,
16% of the respondents purchased 10 to 15 garments and
7.4% of the respondents purchased more than 15 garments.
Next set of questions were framed to determine the
customer attitude towards the branded garment and shows
how people feel about branded garments being better in
quality than other non branded garments from the scale 1(strongly agree) to 5(strongly disagree). 25.9% of the
respondents strongly agree with the fact, 25.9% of the
respondents agree with the fact, 33.3% of the respondents
are neutral, 12.3% of the respondents disagree and 2.5% of
the respondents strongly disagree.
Next question was about branded garments being
better than non branded garments in every way from the
scale 1(strongly agree) to 5(strongly disagree). 21% of the
respondents strongly agree with the fact, 21% of the
respondents agree with the fact, 38.3% of the respondents
Volume 5, Issue 12, December – 2020 International Journal of Innovative Science and Research Technology
ISSN No:-2456-2165
IJISRT20DEC454 www.ijisrt.com 825
are neutral, 13.6% of the respondents disagree and 6.2% of
the respondents strongly disagree.
Next question was about people’s perception about
branded garments being worth the money invested from the
scale 1(strongly agree) to 5(strongly disagree). 12.3% of the
respondents strongly agree with the fact, 27.2% of the
respondents agree with the fact, 33.3% of the respondents
are neutral, 18.5% of the respondents disagree and 8.6% of
the respondents strongly disagree.
Next question was about people preferring branded
garments over non branded garments from the scale
1(strongly agree) to 5(strongly disagree). 30.7% of the respondents strongly agree with the fact, 20% of the
respondents agree with the fact, 26.7% of the respondents
are neutral, 18.7% of the respondents disagree and 4% of the
respondents strongly disagree.
Next question was about people preferring branded
garments due to well known brand names, market value and
the reputation of the brand from the scale 1(strongly agree)
to 5(strongly disagree). 24% of the respondents strongly
agree with the fact, 22.7% of the respondents agree with the fact, 26.7% of the respondents are neutral, 20% of the
respondents disagree and 6.7% of the respondents strongly
disagree.
Next question was about consumers feeling confident
if they wear branded garments from the scale 1(strongly
agree) to 5(strongly disagree). 22.7% of the respondents
strongly agree with the fact, 24% of the respondents agree
with the fact, 29.3% of the respondents are neutral, 12% of
the respondents disagree and 12% of the respondents
strongly disagree and hence most of them agree to the fact
that they feel confident wearing branded apparel.
Next question was about consumers ’perception about
branded garments as a representation of social wealth and
status from the scale 1(strongly agree) to 5(strongly
disagree). 20% of the respondents strongly agree with the
fact, 17.3% of the respondents agree with the fact, 24% of
the respondents are neutral, 21.3% of the respondents
disagree and 17.3% of the respondents strongly disagree.
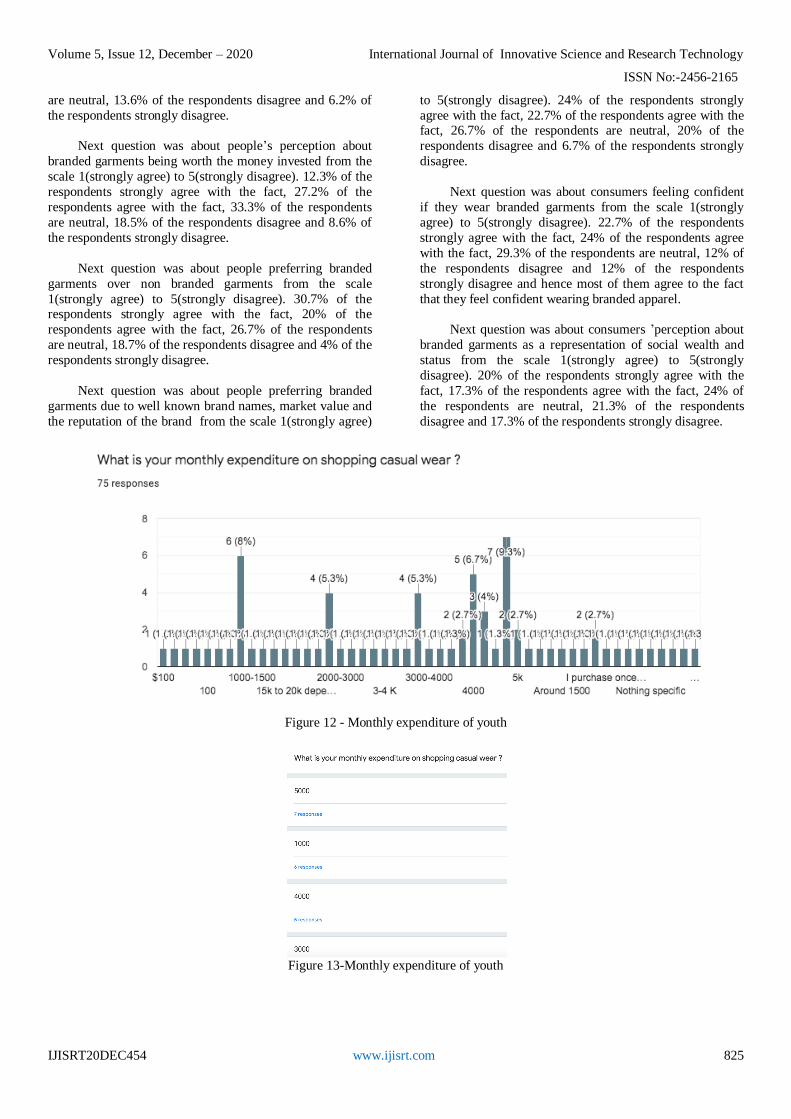
Figure 12 - Monthly expenditure of youth
Figure 13-Monthly expenditure of youth

Volume 5, Issue 12, December – 2020 International Journal of Innovative Science and Research Technology
ISSN No:-2456-2165
IJISRT20DEC454 www.ijisrt.com 826
Figure 12 & 13 show the monthly expenditure of the
respondents and we got a huge range starting from Rs 1,000 to Rs 25,000 and majority of respondents spend about Rs
2000 to Rs 5000 monthly.
The above responses were from a set of people in
which 56% of the respondents were women, 42.7% were
men and 1.3% belonged to other category. Out of the group
of people that were surveyed 76% of the respondents were
between the age group of 20-30 years and 24% of the
respondents were between the age group of 13-20 years.
V. CONCLUSION
This study, the impact of apparel brand name in
consumer behavior and attitude for casual wear clothing on
youth of India and also NRI was done between the months
of September to November 2019, about 75 people have
taken part in this study and out of which 56% of the
respondents were women, 42.7% were men and 1.3%
belonged to other category. Out of the group of people that
were surveyed 76% of the respondents were between the age
group of 20-30 years and 24% of the respondents were
between the age group of 13-20 years.
According to the research results a popular brand is far
more important for youth of India. The attitude of
respondents to pay more for brand is due to the experience
and satisfaction with a set of brands mostly international
brands due to the consumers ’perception of the brands
having a higher market value. The option of buying cheap
products is not really important for respondents as the
respondents are willing to spend more money just for a
better brand name and buy lesser number of garments but a
better brand.
Based on the respondents ’age group, their attitude towards brands signifies that the youth is conscious about
brands and the brand name is more important to them than
the price they are paying for it and also the fact whether the
brand is cheaper or more expensive does plays an important
role in decision making process before buying as the
respondents have a perception that brands with higher price
range have better quality products and hence they are
willing to pay for the quality and the brand and also have the
perception that the brand they are wearing exposes their
social status. If we look at gender wise girls are more
conscious about brands. Hence, the youth focuses on brand name and its quality as well, so the overall results show
youth brands play an important role in the youth’s buying
pattern.
REFERENCES
[1]. Aaker , D.A. 1996 “Measuring brand equity across
products and markets “ ; California Management
Review , 38 , pg 102-120
[2]. Dobni D, Zinkhan G.M 1990 “Insearch of brand image:
A foundation Analysis” ; Advances in consumer
research volume 17 ; pg 110-119
[3]. Gabbott M , Hogg G.W. 1998 “Consumers & Services”
ISBN 0471962694 pg 302-302
[4]. Solomon M.R 2011 “Values, Brands & Image”
Creating images and the psychology of Marketing
communication Lawrence Erlbalm pg 279-290
[5]. Keller K.L 1993 “Values, Brands & Image” Creating images and the psychology of Marketing
communication Lawrence Erlbalm pg 279-290
[6]. Keller K.L 1997 “Twenty First Century Branding”
Journal of Brand Management Vol 4 No. 6 ; pg 368-370
[7]. Keller K.L 2000 “The Brand Report Card” ; Harvard
Business review Jan/Feb Pg 147