consumer perceptions of apparel fit satisfaction and
TRANSCRIPT

University of Arkansas, FayettevilleScholarWorks@UARK
Theses and Dissertations
5-2015
Consumer Perceptions of Apparel Fit Satisfactionand Sizing Based Upon 3D Body Scanning andBlock Garment AssessmentNicole Lee CouryUniversity of Arkansas, Fayetteville
Follow this and additional works at: http://scholarworks.uark.edu/etd
Part of the Fashion Design Commons, Home Economics Commons, and the MarketingCommons
This Thesis is brought to you for free and open access by ScholarWorks@UARK. It has been accepted for inclusion in Theses and Dissertations by anauthorized administrator of ScholarWorks@UARK. For more information, please contact [email protected], [email protected].
Recommended CitationCoury, Nicole Lee, "Consumer Perceptions of Apparel Fit Satisfaction and Sizing Based Upon 3D Body Scanning and Block GarmentAssessment" (2015). Theses and Dissertations. 1136.http://scholarworks.uark.edu/etd/1136

Consumer Perceptions of Apparel Fit Satisfaction and Sizing
Based Upon 3D Body Scanning and Block Garment Assessment

Consumer Perceptions of Apparel Fit Satisfaction and Sizing
Based Upon 3D Body Scanning and Block Garment Assessment
A proposal submitted in partial fulfillment of the requirements for the degree of
Master of Science in Human Environmental Sciences
By
Nicole L. Coury University of Arkansas
Bachelor of Science in Human Environmental Sciences, 2013
May 2015 University of Arkansas
This thesis is approved for recommendation to the Graduate Council.
Dr. Laurie Apple Thesis Director Dr. Kathleen Smith Committee Member
Dr. Kevin Fitzpatrick Committee Member

ABSTRACT
The objectives of this study were to first, determine whether Walmart, Inc. customers are
purchasing the correct size garments for their body measurements, and their perceptions of the fit
of Walmart, Inc. clothing prior to trying on the current block garments. The next objective was
to determine which factors influence fit satisfaction after the participants have tried on the
current block garments. Hypothesis 1 tested participants’ perceived size and their actual size,
Hypothesis 2 tested participants’ pre and post try-on fit satisfaction perceptions, and Hypothesis
3, 4, and 5 tested which factors have a significant effect on garment fit satisfaction. Through the
utilization of a 3D body scanner and two questionnaires, the hypotheses were tested.
There were a total of 55 usable responses (100% female), and all participants were
Walmart, Inc. consumers. Participants were found to purchase the incorrect size garments more
often than the correct size garments based on the results. Fit satisfaction increased post garment
try-on from pre garment try-on. Age, garment type, and size were all statistically significantly
influencing factors on fit satisfaction for shirts. Only garment type was found to be a statistically
significant influencing factor on fit satisfaction for pants.

©2015 by Nicole L. Coury
All Rights Reserved

ACKNOWLEDGEMENTS
I would like to express my sincerest gratitude toward my thesis committee, Dr. Laurie
Apple, Dr. Kathy Smith, and Dr. Kevin Fitzpatrick for the numerous hours they have spent
teaching me and supporting me through this process. I would like to give a special thank you to
Dr. Apple, my thesis director and academic advisor, for her support and guidance, and also for
facilitating the relationship with Walmart, Inc. that allowed this all to be possible. To Dr. Smith,
I would like to thank you for your encouraging words, extensive proofreading, and reminding me
to breathe whenever I was feeling overwhelmed. Dr. Fitzpatrick, I cannot thank you enough for
your assistance with the statistics and data analysis, and for answering my never-ending list of
questions. As a team, you all have provided me with your wisdom and understanding as I have
voyaged through this learning process. I will forever be grateful, and could not have completed
this thesis without you all.
I would like to thank all of the Apparel Merchandising and Product Development faculty
members, Dr. Leigh Southward, Dr. Eunjoo Cho, Dr. Ja Young Hwang, Ms. Stephanie Hubert,
and Mr. Lance Cheramie for their support, understanding, and assistance throughout this process.
I would especially like to thank Dr. Leigh Southward, Dr. Eunjoo Cho, and Dr. Ja Young for
their guidance with coursework, and support of the completion of this thesis and my degree. I
would also like to thank the students in the program who helped me with my pilot study and who
supported me throughout my graduate studies.
I would like to thank all of the Walmart, Inc. employees who made this thesis possible
and who assisted me in the process: Ken Lanshe, Dontai Nash, Eleanor Butler, Libby Wilson,
Kristen Veit, Dominika Lipecka, Pamela Pelletier, and everyone else at the Walmart, Inc. apparel

offices who contributed. This thesis would not have been possible without all of your help and
support.
I would also like to thank my fellow graduate students, Jennifer Rose and Shan Gao, for
their words of encouragements, support, and friendship.
Finally I would like to thank my friends and family, for always believing in me and
encouraging me, and lifting my spirits when I needed it most.

DEDICATION
This thesis is dedicated to my parents, my sister, and my grandmother. I don’t know how
I would have made it through the last two years without your constant encouragement and
prayers. Thank you for always believing in me, even when I didn’t, and cheering me on until the
end. Words cannot express how much I love you all and appreciate everything you all have done
for me.

TABLE OF CONTENTS
CHAPTER 1 .................................................................................................................................. 1
INTRODUCTION ...................................................................................................................... 1
Statement of the Problem ........................................................................................................ 1
Purpose of the Study ............................................................................................................... 2
Research Questions ................................................................................................................. 3
Hypotheses .............................................................................................................................. 3
CHAPTER 2 .................................................................................................................................. 5
REVIEW OF LITERATURE ...................................................................................................... 5
Social Importance of Clothing ................................................................................................ 5
Psychological Importance of Clothing: Body Image .............................................................. 5
Vanity Sizing ...................................................................................................................... 8
Apparel Fit Quality: Importance to Consumers and Retailers ............................................... 8
Brand Perceptions ............................................................................................................. 11
Garment Fit Complications .................................................................................................. 12
CHAPTER 3 ................................................................................................................................ 15
DATA AND METHODS .......................................................................................................... 15
Methods ................................................................................................................................. 15
Sample ................................................................................................................................... 15
Instruments ............................................................................................................................ 16
Body scanner ..................................................................................................................... 17
Demographic and Shopping Preference Questionnaire .................................................... 18
Quality of Fit Assessment Based on Consumer Preferences Questionnaire ..................... 18

Data Collection ..................................................................................................................... 19
Body Scanning Process ..................................................................................................... 20
Block Garment Assessment Process ................................................................................. 20
CHAPTER 4 ................................................................................................................................ 22
RESULTS ................................................................................................................................. 22
Sample Characteristics ......................................................................................................... 23
Research Question 1: Perceived Size versus Actual Size ..................................................... 25
Hypothesis 1...................................................................................................................... 25
Research Question 2: Fit Satisfaction Perceptions .............................................................. 27
Hypothesis 2...................................................................................................................... 27
Research Question 3: Influencing Factors on Fit Satisfaction ............................................. 28
Hypothesis 3...................................................................................................................... 28
Hypothesis 4...................................................................................................................... 30
Hypothesis 5...................................................................................................................... 31
CHAPTER 5 ................................................................................................................................ 33
CONCLUSIONS ...................................................................................................................... 33
Summary ............................................................................................................................... 33
Conclusion ............................................................................................................................ 34
Limitations ............................................................................................................................ 36
Implications ........................................................................................................................... 36
Recommendations ................................................................................................................. 37
REFERENCES ............................................................................................................................ 38
APPENDICES ............................................................................................................................. 41

APPENDIX A: IRB APPROVAL ............................................................................................. 42
APPENDIX B: SURVEY 1 & CONSENT FORM INSTRUMENT ......................................... 43
APPENDIX C: SURVEY 2 INSTRUMENT ............................................................................ 47
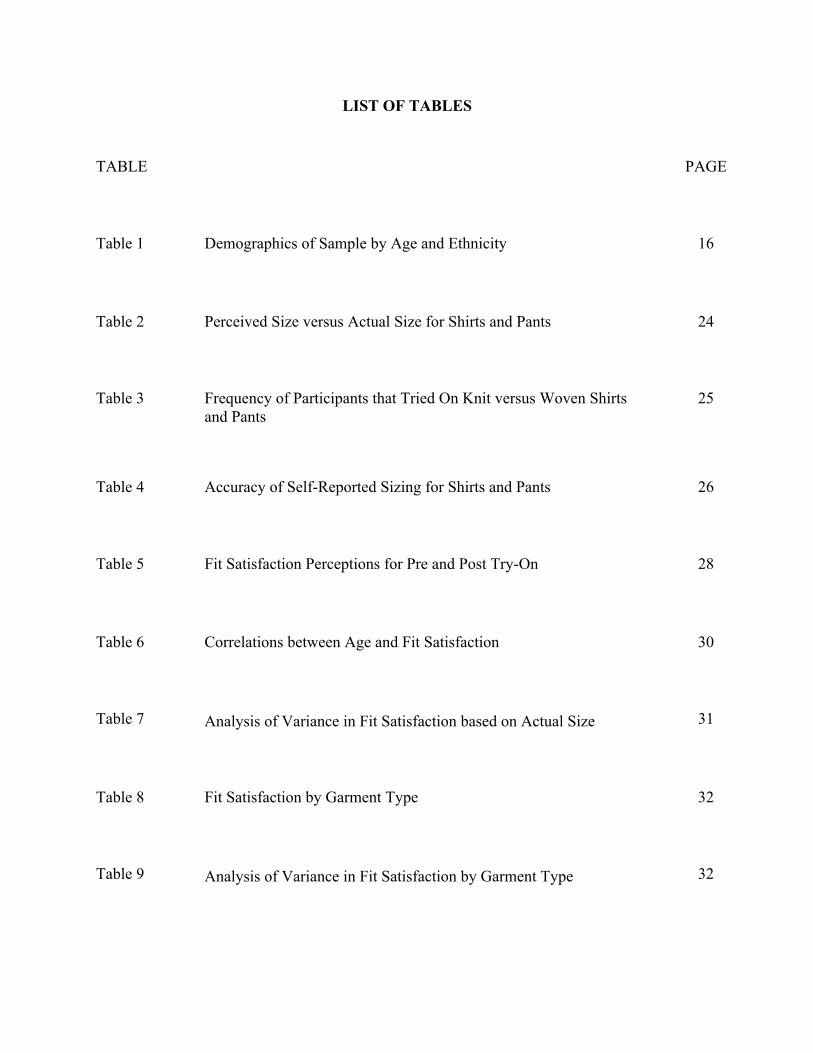
LIST OF TABLES
TABLE PAGE
Table 1 Demographics of Sample by Age and Ethnicity 16
Table 2 Perceived Size versus Actual Size for Shirts and Pants 24
Table 3 Frequency of Participants that Tried On Knit versus Woven Shirts and Pants
25
Table 4 Accuracy of Self-Reported Sizing for Shirts and Pants 26
Table 5 Fit Satisfaction Perceptions for Pre and Post Try-On 28
Table 6 Correlations between Age and Fit Satisfaction 30
Table 7 Analysis of Variance in Fit Satisfaction based on Actual Size 31
Table 8 Fit Satisfaction by Garment Type 32
Table 9 Analysis of Variance in Fit Satisfaction by Garment Type 32

1
CHAPTER 1
INTRODUCTION
Sizing and fit in ready-to-wear apparel causes issues for retailers and consumers alike.
Retailers must strive to better understand their consumers’ perceptions of themselves in order to
help them purchase properly fitting clothing. If a manufacturer is able to improve their sizing
system to provide a better fit for more body sizes, they may be able to help reduce returns and
markdowns, as well as boost customer satisfaction and potentially increase sales. Due to the
advancement in technology, retailers now have the ability to improve fit issues and to develop a
more consistent and accurate sizing system (Alexander, Connell, & Presley, 2005; Kasambala,
Kempen, & Pandarum, 2014; Pisut & Connell, 2007; Song & Ashdown, 2013).
Retailers of apparel must understand their consumers’ fit preferences, fit issues, and the
diversity of body sizes. Fit is defined as the way in which a garment conforms to the body and
how it appears on the body (Kasambala et al., 2014). Apparel retailers must also understand that
different body sizes and body satisfaction levels result in different fit issues and preferences.
The understanding of the physical and psychological issues associated with fit is necessary. As
new technology is developed, it is now possible to integrate body scanning into apparel retail
businesses for improved garment patterns and apparel fit (Alexander et al., 2005; Pisut &
Connell, 2007; Song & Ashdown, 2013).
Statement of the Problem
There is no national standardized sizing for women’s wear, often causing consumers to
guess which size they wear and thus, creating confusion (Alexander et al., 2005; Kasambala et
al., 2014; Mason, DeKlerk, Sommervile, & Ashdown, 2008; Pisut & Connell, 2007; Song &
Ashdown, 2013). In addition, there is a lack of information available to consumers, including

2
specific measurements for each size (Pisut & Connell, 2007). Typical consumers often do not
know their true measurements (Alexander et al., 2005; Pisut & Connell, 2007; Song & Ashdown,
2013).
Within a particular size category, garment measurements can vary by several inches.
Consumers who do not know their true size could potentially be purchasing the incorrect size
garment, which likely would not fit correctly, leading them to believe the quality of the clothing
is poor. This can be detrimental to a company in terms of sales, returns, and consumer
perceptions (Alexander et al., 2005; Kinley, 2010).
As an example, Walmart, Inc. is working on improving the fit of their clothing in order to
better meet the needs of their customers. A key objective of this study was to evaluate the fit of
Walmart, Inc.’s standard block garments by assessing customer satisfaction, and to determine
how accurately consumers comprehend their body size by utilizing body scanning technology.
Consumer perceptions and preferences with regard to Walmart, Inc. clothing are central to the
study.
Purpose of the Study
Fit is a major issue in the apparel industry and poor fit can lead to unsatisfied customers.
In order to better serve their customers, Walmart, Inc. has been interested in researching
consumers’ perceptions of the fit of clothing for Walmart, Inc., as well as determining how 3D
technology can improve Walmart, Inc.’s business. The purpose of this study was to determine
consumers’ fit satisfaction levels of the current standard block garments based on general
consumer perceptions, visual aids, and background characteristics. The study also investigated
consumers’ perceptions of their body size and perceptions of self.

3
A 3D body scanner was used to take full-body measurements of Walmart, Inc. customers
who were willing to participate in the study. The scans provided accurate measurements of all
participants. In addition to being scanned, participants were asked to complete a brief survey
providing general information about themselves, as well as some of their shopping preferences.
After being scanned, participants were asked if they would be willing to try on a set of Walmart,
Inc.'s standard block garments and complete a survey analyzing consumer perceptions of the fit
of the garments. Photos of the participants wearing the clothing were taken from the neck down
to verify their responses. This allowed the researcher to determine how satisfied customers are
with the fit of Walmart, Inc.’s standard block garments, and to examine how fit might be
improved based on customer responses.
Research Questions:
The research questions used to guide this study are as follows:
1. Are consumers purchasing the correct size garments based on their body measurements?
2. Do consumer perceptions of fit satisfaction of Walmart, Inc. clothing improve after the
consumer tries on the standard block garments?
3. What are contributing factors affecting consumers’ fit satisfaction levels of Walmart, Inc.’s
standard block garments?
Hypotheses:
The hypotheses tested in this study are as follows:
H1: Consumers purchase the incorrect size garments based on their 3D body scan measurements.
H2: Consumers will have higher fit satisfaction post garment try-on, than pre garment try-on.
H3A: Younger consumers have higher fit satisfaction of shirts than older consumers.
H3B: Younger consumers have higher fit satisfaction of pants than older consumers.

4
H4A: Consumer size is an influencing factor on fit satisfaction of shirts.
H4B: Consumer size is an influencing factor on fit satisfaction of pants.
H5A: Knit shirts result in higher fit satisfaction ratings than woven shirts.
H5B: Knit pants result in higher fit satisfaction ratings than woven pants.

5
CHAPTER 2
REVIEW OF LITERATURE
Social Importance of Clothing
Consumers use clothing as a means of self-expression and as a way to identify
themselves with a particular social group (Alexander et al., 2005; Johnson, Schofield, &
Yurchisin, 2002; Kinley, 2010). Clothing is used as a form of nonverbal communication to
convey a message to others, either consciously or subconsciously (Alexander et al., 2005;
Damhorst, 1990; Johnson et al., 2002; Kasambala et al., 2014; Ryan, 1991). Appearance is used
as a cue when forming impressions and making assumptions about others (Johnson et al., 2002;
Kasambala et al., 2014; Kinley, 2010; Ryan, 1991). Fit is a commonly used indicator when
forming an opinion about someone (Johnson et al., 2002; Kasambala et al., 2014). Most people
believe that their impressions of others based on appearance are accurate, and that the opinions
others form about themselves based on their appearance are likely accurate as well (Johnson et
al., 2002).
Psychological Importance of Clothing: Body Image
The social comparison theory developed by Festinger in 1954 suggests that people desire
to have their opinions and abilities validated by others, which they achieve by either deliberate or
unconscious comparison to others (Festinger, 1954; Kinley, 2010). When appearance is validated
through comparisons, self-esteem increases (Kinley, 2010; Stone, 1962).
Body cathexis is the level of satisfaction or dissatisfaction with different parts of the
body, and is related to body image. Simply put, body cathexis is a person’s feelings about their
body. These feelings have a substantial influence on clothing preferences, including fit

6
preferences. A relationship between body cathexis and fit satisfaction levels has been confirmed
through previous research (Alexander et al., 2005; Shin & Baytar, 2013).
Body image and self-esteem are two separate constructs. Self-esteem is most commonly
defined as a person’s general feeling of self-worth (Demo, 1985; Kinley, 2010). Body image is
typically described as one’s “mental representation” of self and the “psychological investment in
appearance” (Cash, 2005; Kinley, 2010). Research has shown that there is a positive relationship
between self-esteem and body image (Kinley, 2010; Lennon, Rudd, Sloan, & Kim, 1999).
Both body size and garment size effect self-esteem. Self-esteem is related to self-value,
while body image is specifically how a person feels about their body. Women who are heavier
tend to be less satisfied with their body. Heavier women’s self-esteem decreases when they are
able to fit into the size they expect to be. This differs from a smaller woman’s reaction, which
results in an increase in self-esteem when they fit into the expected size. Body size is likely a
determining factor in satisfaction with body image, which effects self-esteem (Kinley, 2010).
It was determined that body satisfaction is positively correlated with fit satisfaction. It
can be concluded that the more satisfied a person is with their body, the more satisfied they will
be with the fit of their clothing (Alexander et al., 2005; Shin & Baytar, 2013; Song & Ashdown,
2013). Research has found that thinner women are more satisfied with their bodies than heavier
women (Frederick, Peplau, & Lever, 2006; Kinley, 2010). Consumers’ fit satisfaction is highly
associated with and dependent on their perceived body size and body cathexis, which varies
based on their actual body size (Alexander et al., 2005; Kasambala et al., 2014; Shin & Baytar,
2013; Song & Ashdown, 2013).
Problems with fit are often exacerbated by consumers’ body image and perceptions of
self (Alexander et al., 2005; DesMarteau, 2000; Kinley, 2010; Shin & Baytar, 2013). Clothing is

7
often used to alleviate self-consciousness and camouflage perceived “figure faults” (Alexander et
al., 2005; Kasambala et al., 2014; Kinley, 2010; Kwon & Parham, 1994).
Research has found that women who are more concerned with their appearance have a
lower self-esteem than those who do not care as much about their appearance. Clothing is a
critical component of appearance that individuals are able to control, unlike many other aspects
of appearance (Kinley, 2010; Shin & Baytar, 2013). Clothing is very important for women
socially and psychologically because appearance affects how people perceive themselves and
their self-confidence. Unsurprisingly, women want to improve their appearance and others’
perceptions of them (Alexander et al., 2005; Bailey, 2010; Shin & Baytar, 2013; Yoo, 1996).
Fit preferences differ across age groups (Alexander et al., 2005; Kasambala et al., 2014).
There have been conflicting reports on whether younger or older women are more satisfied with
their body image and fit satisfaction (Kinley, 2010). Changes in body size due to aging
influences fit satisfaction (Kasambala et al., 2014). Two studies have determined that younger
women are more satisfied with their body image than older women (Cash & Henry, 1995;
Frederick et al., 2006; Kinley, 2010). Another study reported that older women are not satisfied
with the fit of apparel designed for their age group (Alexander et al., 2005).
However, research has demonstrated that age does not affect body satisfaction, and that
body satisfaction remains fairly consistent throughout a woman’s lifetime (Kinley, 2010;
Tiggemann, 2004). Kinley (2010) reported that younger women were more influenced by size
than older women and that older women seem to be more content with their bodies than younger
women, which aligns with Tiggemann’s (2004) findings. It is believed that women typically
become more satisfied with their appearance as they get older. Older women are less concerned
with size than younger women (Kinley, 2010). This does not mean that they are more satisfied

8
with fit (Alexander et al., 2005). Clothing is used as self-expression for women, and whenever
they are unable to find clothing that is age appropriate and fits properly, it can negatively affect
their self-perception (Alexander et al., 2005; Bailey, 2010; Johnson et al., 2002; Kinley, 2010).
Vanity Sizing
There is a psychological need in Western culture to feel slim, which has caused a
majority of retailers to use vanity sizing. “Vanity sizing” is a tactic used by retailers to convince
their customers that they are smaller than they actually are, in order to boost their self-esteem by
wearing smaller sizes. Retailers mark garments with smaller sizes, but larger measurements to
fill the mental and emotional needs of consumers to feel smaller. Retailers use vanity sizing to
boost the ego of their customers because they tend to feel better when they are able to buy a
smaller size (Alexander et al., 2005; DesMarteau, 2000; Kinley, 2010; Shin & Baytar, 2013).
When a woman is able to wear a smaller size, she feels better about herself. In spite of this,
women’s self-esteem is not negatively affected by needing a larger size. External circumstances
have little influence on self-esteem, which indicates that a larger size does not have a significant
effect on self-esteem. Vanity sizing can have a positive impact on consumers’ self-esteem, but it
is not necessary because buying a larger size does not significantly negatively affect their self-
esteem (Kinley, 2010).
Apparel Fit Quality: Importance to Consumers and Retailers
Consumers’ attitudes toward apparel and their expectations of clothing impact their
garment choices, either consciously or subconsciously. The attitude consumers have towards
clothing impacts their fit preference. Confidence and comfort of consumers is heavily dependent
on the fit of their clothing. Properly fitted clothing is essential for the mental and emotional
stability and health of consumers. When a garment is well fitted, it looks best on the wearer,

9
therefore making the wearer more confident and satisfied. Unfortunately, dissatisfaction with fit
is a frequently reported problem with apparel consumption. It has been found that a majority of
the female population struggles to find correctly fitting clothing without alterations (Alexander et
al., 2005; Kinley, 2009; Newcomb & Istook, 2004).
Most consumers are not properly educated on how to take their body measurements, and
it can be concluded that their perceptions of self may be skewed. It was found that a majority of
consumers did not know their lower body measurements, and therefore did not accurately know
their size. This is why body scanning has the potential to be beneficial to the retail and apparel
industry (Alexander et al., 2005; Pisut & Connell, 2007). Consumers’ understanding of sizing
and fit has a strong impact on their perceptions of garments pre-purchase and post-purchase
(Mason et al., 2008). Customers often do not know their correct size, and their perceptions of
their body image are unlikely to match their true body size (Alexander et al., 2005; Song &
Ashdown, 2013).
Misconceptions of body size create a multitude of problems for consumers and retailers,
but retailers cannot amend this. What they can do is improve how well their clothing fits their
target market (Song & Ashdown, 2013). Consumers’ perceptions of themselves create additional
problems with fit, often believing that they are to blame when a garment does not fit them
properly. In reality, fit issues often arise because the garment is made for a specific body size,
which may not be flattering on all body sizes (Alexander et al., 2005; DesMarteau, 2000;
Kasambala et al., 2014; Kinley, 2010).
Fit dissatisfaction is a commonly stated problem associated with apparel purchases
(Alexander et al., 2005; Kinley, 2009; Newcomb & Istook, 2004). If a consumer is not satisfied
with a garment that they purchase, they will either blame themselves or the retailer. If the

10
consumer believes that the retailer is to blame for their disappointment then the consumer might
not continue shopping at that retailer or may tell friends about their negative experience, which
could hurt the business of the retailer (Alexander et al., 2005; Kasambala et al., 2014; Mason et
al., 2008). Retailers lose revenue every year because of markdowns, which are somewhat caused
by dissatisfaction with fit. Contrariwise, if a retailer is able to provide garments with the correct
fit for their target market, they will increase customer loyalty and satisfaction, which has the
potential to improve the company’s success in multiple ways, including reducing markdowns.
Body scanning technology not only makes this plausible, but also easier for retailers (Alexander
et al., 2005).
Fit dissatisfaction has been determined as the third leading cause of loss of sales due to
consumers’ unwillingness to purchase ill-fitted garments. Female consumers spend a majority of
their shopping time trying on clothing, because they must try on multiple garments to find one
that fits properly (Alexander et al., 2005; Kasambala et al., 2014; Newcomb & Istook, 2004;
Yoo, 1996).
Finding the perfect fit is especially hard in women’s clothing because different brands are
designed with different target markets in mind. Certain garments are more difficult to achieve
the perfect fit. Women need to try on pants more often than tops, because tops often are more
versatile when it comes to the body sizes they fit. Research has found that pants are the most
difficult garment for women to find in the correct size, and fit is the main concern when
shopping for pants (Alexander et al., 2005; Kasambala et al., 2014; Kinley, 2009, 2010).
One of the issues that many women face is that sizing labels for women’s clothing often
are not very informative or descriptive. With men’s clothing, actual measurements are typically
used to describe the size of the garment, making it much easier to find the correct size. If a

11
customer can more easily find her correct size, she will have a more positive experience
shopping, which may help retailers succeed (Mason et al., 2008).
The issue of fit is dependent on the personal preferences of the consumer, which means
that ‘good fit’ has a multitude of meanings. A few of the factors that influence fit preference are
how comfortable the garment is, how it looks on the consumer, the consumers’ personal
preferences, fashion trends, cultural influences, age, gender, body size, and lifestyle. The most
consistent complaints of poor fit across the population are related to tightness and length. Many
fit issues are associated with one another; meaning if there is an issue in one area, there is likely
to be a correlating issue in another related area. The most common fit preference for garments is
semi-fitted, which is described as being close to the body with ease added for comfort and
movement. Loosely fitted clothing is the second most common fit preference, except in jackets.
Consumers with higher body satisfaction have a tendency to prefer more fitted clothing. This
means that those who prefer more fitted clothing are more likely to be more highly satisfied with
their bodies (Alexander et al., 2005; Kasambala et al., 2014; Pisut & Connell, 2007).
Brand Perceptions
Brand equity is a complex construct, primarily comprised of brand awareness and brand
association. Perceived quality and brand association, along with other components, can
drastically effect brand equity. Perceived quality is not the actual quality of a product, but is the
consumers’ perceptions of the quality of a product, in comparison to other brands’ alternatives
(Kim, Knight, & Pelton, 2009; Tong & Hawley, 2009). Quality of apparel is defined as the
consumer’s assessment of the “standard of performance” of a garment. Consumers use both
intrinsic and extrinsic cues to evaluate the quality of a product. Intrinsic cues of apparel quality
can include fabric type, construction, style, color, fiber content, and fit. Consumers expect to

12
find quality garments when they go shopping, and whatever they buy must meet their needs in
some way. Consumer expectations are based on how well they believe a product will perform,
and product performance. Product quality positively and directly correlates to purchase
intentions and overall customer satisfaction (Nelson, Rayman, & Burns, 2011).
Consumers use many cues to determine brand equity, but the most influential on purchase
intentions is perceived quality. Higher quality increases purchase intentions and gives a brand a
competitive edge over their competitors. There is a positive relationship between perceived
quality, consumer satisfaction, and company profitability. Brand association is the consumers’
emotional connection to a brand, which creates brand image. Brand associations give value to a
brand and increase purchase intentions as well (Kim et al., 2009; Tong & Hawley, 2009).
Garment Fit Complications
Mass produced, ready-to-wear clothing makes it necessary to have some sort of
consistent sizing system to allow consumers to decipher which garments should fit them
(Alexander et al., 2005; Gill & Brownbridge). Consumers use clothing size to determine what to
purchase based on their body size, but the problem lies in the idea of standardized sizing being a
universal truth. Individual manufacturers, retailers, and designers develop custom size standards
and occasionally change them as needed (Alexander et al., 2005; DesMarteau, 2000; Kinley,
2010). There is no standardized sizing that is consistent across retailers and despite consumers
being somewhat aware of this problem, they are still influenced by the number or letter on the
tag (Gill & Brownbridge; Pisut & Connell, 2007).
The primary factors affecting fit are: the body measurements of the population, the
construction of the garment, the quality of fit management, and the labeling of sizing information
(Alexander et al., 2005; Mason et al., 2008). Outdated body measurements and inconsistent

13
sizing measurements across or within different retailers result in various fit problems (Alexander
et al., 2005; DesMarteau, 2000; Kinley, 2010; Mason et al., 2008; Pisut & Connell, 2007).
The way in which clothing is sized is critical to how consumers view clothing and it
impacts how the wearer views herself. The sizing system that is commonly used is not only
inconsistent, but also outdated and there is a lack of clarity of how the system is intended to work
(Alexander et al., 2005; Gill & Brownbridge). The Federal Trade Commission and the
Department of Commerce established the standard sizing system used today in the 1940s. This
system is no longer relevant or useful because of how women’s bodies have transformed, which
is why so many retailers have developed their own sizing standards. Consumers are very
dissatisfied with the fit of clothing due to the archaic data used to set the sizing standards. The
changes in the weight and shape of the population, as well as changes that occur as consumers’
age, must be taken into consideration by retailers to meet the needs of their consumers
(Alexander et al., 2005; Newcomb & Istook, 2004).
Fit and comfort are two of the most important attributes that consumers use to determine
whether or not they will purchase something. This means that if a garment does not fit well,
consumers will not buy it. This creates problems for retailers because clothing that does not sell
results in profit loss (Alexander et al., 2005; Kasambala et al., 2014; Newcomb & Istook, 2004).
The only way retailers can determine if fit is an issue is by analyzing the returns of
merchandise. A majority of returns are because of poor fit or the garment being the incorrect
size. It is difficult to determine the severity of the impact of poor fit on profit loss because it is
difficult to measure factors like dissatisfaction with brand, lost sales, and time wasted trying on
garments. Due to the problems with sizing, consumers spend a lot of time and money trying to

14
find perfect fitting garments, which sometimes means they also must have them altered
(Alexander et al., 2005; Newcomb & Istook, 2004; Yoo, 1996).

15
CHAPTER 3
DATA AND METHODS
Methods
Retailers have been attempting to find solutions to issues in apparel fit through research
and the use of 3D body scanners. Issues with apparel fit are not only due to the technical aspect
of garment fit, but also result from consumers’ perceptions and preferences, and an inconsistency
in sizing. Body size differences also contribute to issues with fit and fit preferences.
The purpose of this study was to determine consumers’ fit satisfaction levels of Walmart,
Inc.’s current standard block garments based on consumer perceptions and background
characteristics. The study also investigated consumers’ perceptions of their body size and
perceptions of themselves. To obtain the information needed, a 3D body scanner and two
questionnaires were utilized. The research questions proposed include:
1. Are consumers purchasing the correct size garments based on their body measurements?
2. Do consumer perceptions of fit satisfaction of Walmart, Inc. clothing improve after the
consumer tries on the standard block garments?
3. What are contributing factors affecting consumers’ fit satisfaction levels of Walmart,
Inc.’s standard block garments?
Sample
The population for this study was female, Walmart, Inc. customers 18 years and older.
This study was limited to females because only women’s garments were available for garment
try-on. The participants had to be at least 18 years of age based on the target market for the
garments utilized. Participation for this study was voluntary and a total of 55 females
participated. Participants were awarded a five-dollar Starbucks gift card upon completion of the

16
study. The average age of the participants was about 36 years old (S.D. = 11.07), with a range of
21 to 66 years old. The majority of participants were white (73.1%) with the remaining 26.9%
varying across several ethnicities as documented in Table 1. All information was coded for
confidentiality. This study has been granted IRB approval (Appendix A) from the University of
Arkansas for the collection and analysis of data.
Table 1
Demographics of Sample by Age and Ethnicity
N = 55 % Mean S.D.
Age --- 36.44 11.07
Ethnicity American Indian or Alaskan Native 3.6% Asian or Asian American 3.6% Black or African American 3.6% Hispanic or Latino 12.5% White 73.1% Other/ Combination 3.6%
Instruments
The instruments required to collect the data for this study include the TC2-KX-16 3D
Body Scanner (3D Body Scanner, 2014), and two questionnaires developed from previous
research findings and Walmart, Inc.’s current fit evaluation standards. The fit satisfaction
questionnaire was constructed based on terminology and components of fit communicated as
essential by Walmart, Inc.’s technical design team. Fit satisfaction components were also
extracted from a study conducted by Pisut and Connell (2006), entitled Fit Preferences of
Female Consumers in the USA, which evaluated crucial elements of fit as identified by female
consumers. The first questionnaire was developed based on these foundations to meet the needs

17
of Walmart, Inc. and to align with the technical design team’s evaluation of ‘good fit’. ‘Good
fit’ is subjective deeming it necessary to analyze fit based on Walmart, Inc.’s definition and
standards of ‘good fit’.
The first questionnaire was designed to gather demographic information, as well as to
assess participants’ knowledge and preferences. The second questionnaire was used to
determine customers’ fit satisfaction of the block garments. The Apparel Merchandising and
Product Development professors and a team of Walmart, Inc. employees reviewed both
questionnaires. A pilot study was conducted with a convenience sample of approximately 60
undergraduate students. Based on the pilot study and the feedback of the reviewers,
modifications were made to the questionnaires.
Body scanner
The TC2-KX-16 3D body scanner was used to collect body measurements. This scanner
uses light to collect measurements of the entire body, approximately 300 total. For the purpose
of the study only 30 measurements that are determined to be the most crucial and relevant were
extracted. The scanner is portable, which allowed the body scanner to be transported to
Walmart, Inc.’s offices to collect the data. The scanner is approximately the same size as a
fitting room and is free standing (3D Body Scanner, 2014). Curtains were set up to further
ensure privacy. The scanner was calibrated once it is reassembled to ensure reliable
measurements are gathered. Guidelines were set in place to show the participants where and
how to stand inside the scanner.
One of the requirements of being scanned is that the participant had to remove their outer
clothing, wearing only undergarments. ‘Scan wear’ was provided for those who desired and
would feel more comfortable. The provided scan wear included tank tops, shorts, and leggings.

18
The objective of wearing minimal clothing while being scanned was to provide the most accurate
measurements. The body scanner only provides an outline of the shape inside the scanner, so if
the person inside is wearing clothing that is not form-fitted, only the outline of the clothing will
be captured, not the outline of the body. If the actual body is not scanned, the measurements
extracted from the scan will be inaccurate. The scanner uses the measurements to create a unique
body model for each participant (3D Body Scanner, 2014).
Demographic and Shopping Preference Questionnaire
The first questionnaire (Appendix B) asked the participants to provide demographic
information about themselves including age and ethnicity. Gender was not necessary as only
females were eligible for participation. Participants were asked to list their age in years.
Ethnicity was listed as (A: American Indian or Alaska native, B: Asian, C: Black or African
American (not Hispanic), D: Hispanic or Latino, E: Native Hawaiian or other Pacific Islander, F:
White (not Hispanic), G: Other/Combination). Participants were asked what size shirt (A: X-
Small, B: Small, C: Medium, D: Large, E: X-Large, F: XX-Large) and pant (A: X-Small/ 0-2, B:
Small/ 4-6, C: Medium/8-10, D: Large/12-14, E: X-Large/16-18, F: XX-Large/20) they typically
purchase for comparison to the Walmart, Inc.’s sizing measurements. They were also asked to
rate their satisfaction with the fit of Walmart, Inc. clothing as (A: Poor, B: Fair, C: Good, D:
Perfect, E: N/A). This questionnaire was divided into two parts, with a total of eleven questions.
Quality of Fit Assessment Based on Consumer Preferences Questionnaire
The second questionnaire (Appendix C) was intended to gauge participants’ fit
satisfaction of the standard block garments. The survey was completed electronically via
Qualtrics Online Survey Software. The survey was divided into two sections, one to assess the
shirt and one to assess the pant. The section to rate the shirt consisted of 15 questions, and the

19
pant section consisted of 17 questions. Participants rated fit satisfaction on different parts of the
body (shoulders, length, hip, waist, etc.), as well as overall fit satisfaction on a six-point Likert-
type scale. Respondents chose answers on a scale of 0-5 (0= Very Poor; 1= Poor; 2= Fair; 3=
Good; 4= Perfect; and 5= Not Applicable). Participants indicated which top or pant they were
wearing by choosing from a drop down menu and they were instructed to type their participation
number so that results may be compared to their scans, demographic surveys, and photos.
Data Collection
Numerous meetings were held with representatives from Walmart, Inc.’s technical design
department. Based on Walmart, Inc.’s expected outcomes, potential studies were formulated and
a plan was devised to efficiently collect a variety of data. Over the course of several meetings
and discussions with Walmart, Inc.’s legal and store operations departments, the plans for the
study were finalized. The Institutional Review Board for the University of Arkansas and
Walmart, Inc.’s legal team approved the study for data collection.
Prior to the data collection, promotions were sent via email and posters advertising the
study were placed at the location. The location of the data collection was Walmart, Inc.’s
apparel offices in Bentonville, Arkansas. Data collection took place over the course of two days
with a total of eleven hours. A team of Walmart, Inc. employees (five total) volunteered to assist
with the data collection process to ensure efficiency and accuracy. Two rooms at the office were
reserved for the duration of the study.
In order to collect as much data as possible, the study was split into two parts. Part one
consisted of the consent form and the Demographic and Shopping Preference Questionnaire.
Once the participant completed the consent form and questionnaire, they were body scanned.
Part two required the participants to try on a set of Walmart, Inc.’s block garments, have their

20
photo taken, and complete the Quality of Fit Assessment Based on Consumer Preferences
Questionnaire to evaluate their fit satisfaction levels regarding the block garments.
Body Scanning Process
Participants were required to sign the consent form before body scanning. The
participants were given an overview of the body scanning process and the requirements. The
researcher demonstrated how they were to stand inside the body scanner, and showed them
where the scan wear was located. The participants then completed the first questionnaire, which
was open-ended. Upon completion of the consent form and questionnaire, the participant
entered the body scanning area. The computer was located in a separate area from the body
scanner to allow for total privacy. The researcher was able to communicate with the participant
through a moveable wall.
There were certain requirements for being body scanned, such as attire. Scan wear was
available to participants inside the body scanning room. Signs posted in the body scanner
instructed the participants on how to stand inside the body scanner. Another stipulation of the
scanner was that participants needed to ensure that nothing was obstructing their measurements,
including hair. Hair ties were provided for participants.
Once the participant was in the proper attire and positioned correctly inside the scanner,
they indicated to the researcher that they were ready. The researcher then began the scan and
once the image was captured, the researcher informed the participant that they could re-dress.
Block Garment Assessment Process
The participants who were willing to participate in the second part of the study were
given a set of clothing to try on based on their measurements. A separate dressing area was
arranged for the participants to try on the block garments. The participants had their photos

21
taken wearing the block garments to validate the results of their surveys. Photos were taken
from the neck down to ensure anonymity.
A full-length mirror was provided to allow participants to assess how the garments
appeared when worn. They then completed the second questionnaire through Qualtrics Online
Survey Software via laptop or iPad. The questionnaire required the assessment of their
satisfaction level with the fit of the garments after they tried them on. Upon completion of the
study, participants were awarded a $5 Starbucks gift card for their contribution to the study.

22
CHAPTER 4
RESULTS
The objectives of this study were to determine whether Walmart, Inc. customers are
purchasing the correct size garments for their body measurements, and their perceptions of the fit
of Walmart, Inc. clothing prior to trying on the current block garments, as well as to determine
which factors influence fit satisfaction, after the participants have tried on the current block
garments. Hypothesis 1 tested participants’ perceived size and their actual size, Hypothesis 2
tested participants’ pre and post try-on fit satisfaction perceptions, and Hypothesis 3, 4, and 5
tested which factors have a significant effect on garment fit satisfaction.
All data from the instruments was recorded and entered into Statistical Package for the
Social Science (SPSS) data analysis software for hypothesis testing. Descriptive statistics,
correlations, chi-square, and univariate analysis of variances (ANOVA) were utilized to analyze
the data and test each of the hypotheses. Cronbach’s alpha coefficients were used to analyze the
internal consistency reliability of the items used to measure the variables used to test the
hypotheses. The Cronbach’s alpha value for the 11 variables used resulted in a calculated score
of 0.721, which meets the recommended value of 0.70 and is acceptable.
The hypotheses tested are as follows:
H1: Consumers purchase the incorrect size garments based on their 3D body scan measurements.
H2: Consumers will have higher fit satisfaction post garment try-on, than pre garment try-on.
H3A: Younger consumers have higher fit satisfaction of shirts than older consumers.
H3B: Younger consumers have higher fit satisfaction of pants than older consumers.
H4A: Consumer size is an influencing factor on fit satisfaction of shirts.
H4B: Consumer size is an influencing factor on fit satisfaction of pants.

23
H5A: Knit shirts result in higher fit satisfaction ratings than woven shirts.
H5B: Knit pants result in higher fit satisfaction ratings than woven pants.
Sample Characteristics
Walmart, Inc.’s legal team granted permission to collect data within their offices to
ensure that participants were Walmart, Inc. consumers. Participation was completely voluntary,
and a small incentive was offered for contributing to the study. Every participant signed a
consent form prior to participating in the study. There were a total of 55 usable responses (100%
female), and all participants were Walmart, Inc. consumers.
As seen in Table 1, the average age of the participants was about 36 years old (S.D. =
11.07) with participants’ ages ranging from 21 to 66 years old. All of the participants were
female, with a majority (73.1%) being Caucasian, and the remaining (26.9%) split among several
ethnicities (Table 1). A majority of participants indicated that they typically purchase size
medium shirts (30.9%) and size medium pants (30.9%) as illustrated in Table 2. A majority of
participants’ actual size is medium for shirts (23.6%) and medium for pants (27.3%) as shown in
Table 2, based on the 3D body scan measurements.
Participants were randomly assigned a set of either knit garments or woven garments to
try-on. A majority of the participants (54.5%) tried on the knit shirt, while the remaining
(45.5%) tried on the woven shirt as documented in Table 3. A majority of participants (55.6%)
tried on the woven pants, while the remaining (44.4%) tried on the knit pants (Table 3).

24
Table 2
Perceived Size versus Actual Size for Shirts and Pants
% Mean S.D.
Self-Reported Perceived Size
Shirt: --- 3.19 1.35 X-Small (1) 7.3% Small (2) 27.3% Medium (3) 30.9% Large (4) 9.1% X-Large (5) 20.0% XX-Large (6) 3.6% Pant: --- 3.02 1.38
X-Small (1) 12.7% Small (2) 25.5% Medium (3) 30.9% Large (4) 9.1% X-Large (5) 16.4% XX-Large (6) 3.6%
Actual Size
Shirt: --- 3.70 1.49
X-Small (1) 7.3% Small (2) 14.5% Medium (3) 23.6% Large (4) 20.0% X-Large (5) 21.8% XX-Large (6) 9.1% XXX-Large (7) 1.8% Pant: --- 3.43 1.60
X-Small (1) 7.3% Small (2) 25.5% Medium (3) 27.3% Large (4) 12.7% X-Large (5) 9.1% XX-Large (6) 14.5% XXX-Large (7) 1.8%

25
Table 3
Frequency of Participants that Tried On Knit versus Woven Shirts and Pants
% Frequency N
Shirt Type
Knit 54.5% 30 55 Woven 45.5% 25 55
Pant Type Knit 44.4% 24 54 Woven 55.6% 30 54
Research Question 1: Perceived Size versus Actual Size
Hypothesis 1: Consumers purchase the incorrect size garments based on their 3D body
scan measurements. To measure consumers’ size perceptions, participants were asked to select
the size shirt and pant they typically purchase with options for shirts listed as x-small to xx-large
(A = X-Small, B = Small, C = Medium, D = Large, E = X-Large, F = XX-Large) and selections
for pants listed as x-small to xx-large (A = X-Small/ 0-2, B = Small/ 4-6, C = Medium/ 8-10, D =
Large/ 12-14, E = X-Large/ 16-18, F = XX-Large/ 20). Participants’ actual sizes were computed
based on their body measurements extracted from their 3D body scans and compared with the
Walmart, Inc. sizing chart measurements. A variable, ‘correct versus incorrect’, was created by
comparing consumers’ self-reported perceived sizes and their actual sizes. Respondents who’s
self-reported perceived size was not the same as their actual size were coded as ‘1 = Incorrect’.
Participants who’s self-reported perceived size was the same as their actual size were coded as ‘0
= Correct’. This variable was used to determine the percentage of participants that were correct
and the percentage of participants that were incorrect. Descriptive statistics were used to analyze
the sizing results in conjunction with chi-square to test hypothesis 1.

26
A strong majority of the participants (64.8%) purchase the incorrect size shirts and
exactly half of the participants (50%) purchase the incorrect size pants based on their 3D body
scan measurements as documented in Table 4. Actual size and perceived size were analyzed
utilizing chi-square to determine whether there were significant differences between perceived
size and actual size. Statistically significant differences were found between perceived and
actual size for both shirts (chi2=0.000, p<0.001, V=0.709) and pants (chi2=0.000, p<0.001,
V=0.574). This means that the participants were more frequently incorrect than correct.
Hypothesis 1 is supported based on the results of the data analysis. A majority of the
participants purchase the incorrect size for shirts, and at least half of the participants purchase the
incorrect size for pants. The difference between actual size and perceived size is statistically
significant for both shirts and pants.
Table 4
Accuracy of Self-Reported Sizing for Shirts and Pants
% Frequency N
Self-Reported Sizing
Shirts: Correct 35.2% 19 54 Incorrect 64.8% 35 54 Pants:
Correct 50% 27 54 Incorrect 50% 27 54

27
Research Question 2: Fit Satisfaction Perceptions
Hypothesis 2: Consumers will have higher fit satisfaction post garment try-on, than pre
garment try-on. To assess consumers’ perceptions of apparel fit, participants were first asked to
rate how Walmart, Inc. clothing typically fits them on a scale of poor to perfect (A: Poor, B: Fair,
C: Good, D: Perfect, E: N/A) prior to being body scanned or trying on the block garments. After
completion of their body scan, willing participants were given a set of the standard block
garments to try on. After they tried the garments on, they were instructed to complete a
questionnaire assessing the fit of the garments. Respondents were asked to rate the overall fit of
each of the garments they tried on, using a six-point Likert-type scale of 0-5 (0= Very Poor; 1=
Poor; 2= Fair; 3= Good; 4= Perfect; and 5= Not Applicable). The variables were recoded as (0 =
N/A, 1 = Very Poor, 2 = Poor, 3 = Fair, 4 = Good, 5 = Perfect) for analysis purposes. To test
hypothesis 2, descriptive statistics were utilized to determine the relationship between pre and
post garment try-on fit assessment ratings.
As shown in Table 5, there was an increase in fit satisfaction from pre try-on to post try-
on for both the shirts and the pants. A majority (49.1%) of participants listed their pre try-on
satisfaction as fair. Post try-on fit satisfaction for shirts was primarily listed as good (49.1%),
and post try-on fit satisfaction for pants was also primarily listed as good (25.5%). The average
pre try-on perception of fit satisfaction was M = 3.13 (S.D. = 0.71). The average fit satisfaction
rating for the shirts post try-on was M = 3.65 (S.D. = 1.04) and for the pants it was M = 3.24
(S.D. = 1.40). Based on the means and percentages illustrated in Table 5, there is an increase in
fit satisfaction post try-on from pre try-on for both shirts and pants. Thus, the results support the
hypothesis.

28
Table 5
Fit Satisfaction Perceptions for Pre and Post Try-On
% Mean S.D.
Pre Try-On Fit Satisfaction Perception --- 3.13 0.71
Poor 18.2% Fair 49.1% Good 30.9% Fit Satisfaction of Shirts (Post) --- 3.65 1.04
Very Poor 3.6% Poor 12.7% Fair 16.4% Good 49.1% Perfect 18.2% Fit Satisfaction of Pants (Post) --- 3.24 1.40
Very Poor 18.2% Poor 9.1% Fair 23.6% Good 25.5% Perfect 21.8%
Research Question 3: Influencing Factors on Fit Satisfaction
Hypothesis 3: Participants were asked to provide their age for research purposes.
Respondents were asked to rate the overall fit of each of the garments tried on, using a six-point
Likert-type scale of 0-5 (0= Very Poor; 1= Poor; 2= Fair; 3= Good; 4= Perfect; and 5= Not
Applicable). The variables were recoded as (0 = N/A, 1 = Very Poor, 2 = Poor, 3 = Fair, 4 =
Good, 5 = Perfect) for analysis purposes. Correlations were employed to test hypothesis 3.
Hypothesis 3A: Younger consumers have higher fit satisfaction of shirts than older
consumers. Data presented in Table 6 show that there is a mild, negative relationship (-0.24)
between age and fit satisfaction of the shirts. As age increased, fit satisfaction of the shirts
decreased. As age decreased, fit satisfaction of the shirts increased. Thus, younger participants

29
had a higher fit satisfaction of the shirts than older participants. The relationship between age
and fit satisfaction of the shirts is statistically significant (0.04) at the p<0.05 level. Age is an
influencing factor on fit satisfaction of the shirts. Based on the results, hypothesis 3A is
supported.
Hypothesis 3B: Younger consumers have higher fit satisfaction of pants than older
consumers. There is a mild, negative relationship (-0.04) between age and fit satisfaction of the
pants (Table 6). As age increased, fit satisfaction of the pants decreased. As age decreased, fit
satisfaction of the pants increased. Younger participants had a higher fit satisfaction of the pants
than older participants. The relationship between age and fit satisfaction of the pants is not
statistically significant (0.40) at the p<0.05 level, but a weak relationship does exist. The
assumption that as age increases, fit satisfaction for pants decreases was confirmed, but the
relationship was not found to be statistically significant. Thus, age is not a significantly
influencing factor on fit satisfaction of the pants. Hypothesis 3B was not supported based on the
insignificance of the relationship.
Table 6
Correlations between Age and Fit Satisfaction
Fit Satisfaction: Shirts
Fit Satisfaction: Pants
Age
Pearson Correlation
-0.243
-0.036
Significance
(p < 0.05; 2-tailed)
0.038
0.399

30
Hypothesis 4: To measure consumers’ size perceptions, participants were asked to select
the size shirt and pant they typically purchase with choices for shirts listed as x-small to xx-large
(A = X-Small, B = Small, C = Medium, D = Large, E = X-Large, F = XX-Large) and choices for
pants listed as x-small to xx-large (A = X-Small/ 0-2, B = Small/ 4-6, C = Medium/ 8-10, D =
Large/ 12-14, E = X-Large/ 16-18, F = XX-Large/ 20). Respondents’ actual sizes were
computed based on their body measurements extracted from their 3D body scans and compared
with the Walmart, Inc. sizing chart measurements. Participants were asked to rate the overall fit
of each of the garments tried on, using a six-point Likert-type scale of 0-5 (0= Very Poor; 1=
Poor; 2= Fair; 3= Good; 4= Perfect; and 5= Not Applicable). The variables were recoded as (0 =
N/A, 1 = Very Poor, 2 = Poor, 3 = Fair, 4 = Good, 5 = Perfect) for analysis purposes. To test
hypothesis 4, univariate analysis of variances (ANOVA) was utilized.
Hypothesis 4A: Consumer size is an influencing factor on fit satisfaction of shirts. Based
on the results of the ANOVA there is a statistically significant difference (0.03) in fit satisfaction
of the shirts between participant sizes (Table 7). This means that size is an influencing factor on
fit satisfaction of the shirts. Hypothesis 4A is supported by these findings.
Hypothesis 4B: Consumer size is an influencing factor on fit satisfaction of pants. Based
on the results of the ANOVA documented in Table 7, there is not a statistically significant
difference (0.14) in fit satisfaction of the pants between participant sizes. Hypothesis 4B is not
supported by these findings.

31
Table 7
Analysis of Variance in Fit Satisfaction based on Actual Size
Variable XS S M L XL XXL
XXXL
F-value
Significance (p<0.05)
Fit Satisfaction
of Shirts (Post)
Mean 4.25 3.75 3.69 2.91 3.67 4.60 3.00
2.142
0.033 N 4 8 13 11 12 5 1
Fit Satisfaction
of Pants (Post)
Mean 3.50 3.57 2.47 3.29 3.60 3.43 5.00
1.280
0.143 N 4 14 15 7 5 7 1
Hypothesis 5: Participants were instructed to select the shirt and pant type they tried on
for the garment fit assessment. Participants were asked to rate the overall fit of each of the
garments tried on, using a six-point Likert-type scale of 0-5 (0= Very Poor; 1= Poor; 2= Fair; 3=
Good; 4= Perfect; and 5= Not Applicable). The variables were recoded as (0 = N/A, 1 = Very
Poor, 2 = Poor, 3 = Fair, 4 = Good, 5 = Perfect) for analysis purposes. To test hypothesis 5,
descriptive statistics and ANOVA were utilized.
Hypothesis 5A: Knit shirts result in higher fit satisfaction ratings than woven shirts. The
knit shirt (M = 3.87; S.D. = 1.01) resulted in a higher average fit satisfaction than the woven shirt
(M = 3.40; S.D. = 1.04) as illustrated in Table 8. As expected, knit shirts proved to have better
fit than woven shirts. Based on the ANOVA, there is a statistically significant difference (0.05)
in fit satisfaction of the shirts between shirt types as seen in Table 9. Hypothesis 5A is
supported based on these results.
Hypothesis 5B: Knit pants result in higher fit satisfaction ratings than woven pants. The
knit pants (M = 3.96; S.D. = 1.04) resulted in a higher average fit satisfaction than the woven
pants (M = 2.67; S.D. = 1.40) as shown in Table 8. This result supported the assumption that

32
knit pants would fit better than woven pants. Based on the ANOVA, there is a statistically
significant difference (0.000) in fit satisfaction of the pants between pant types as documented in
Table 9. Hypothesis 5b is supported based on these results.
Table 8
Fit Satisfaction by Garment Type
N Mean S.D.
Fit Satisfaction of Shirts (Post)
Knit 30 3.87 1.01 Woven 25 3.40 1.04
Fit Satisfaction of Pants (Post) Knit 24 3.96 1.04 Woven 30 2.67 1.40
Table 9
Analysis of Variance in Fit Satisfaction by Garment Type
Variable Knit Garment Woven Garment F-value Significance (p<0.05)
Fit Satisfaction of Shirts (Post)
Mean 3.87 3.40 2.838
0.049 N 30 25
Fit Satisfaction of Pants (Post)
Mean 3.96 2.67 14.172
0.000 N 24 30

33
CHAPTER 5
CONCLUSIONS
Summary
The Demographic and Shopping Preference Questionnaire, The Quality of Fit
Assessment Based on Consumer Preferences Questionnaire, and the 3D body scans were used
for data collection to compare perceived size and actual size of participants, and to determine if
age, size, and garment type influence fit satisfaction. Differences between pre and post try-on fit
satisfaction were determined by comparing the results of the demographics and shopping
preference questionnaire and the quality of fit assessment based on consumer perceptions
questionnaire. Hypotheses tested for this study were:
H1: Consumers purchase the incorrect size garments based on their 3D body scan measurements.
H2: Consumers will have higher fit satisfaction post garment try-on, than pre garment try-on.
H3A: Younger consumers have higher fit satisfaction of shirts than older consumers.
H3B: Younger consumers have higher fit satisfaction of pants than older consumers.
H4A: Consumer size is an influencing factor on fit satisfaction of shirts.
H4B: Consumer size is an influencing factor on fit satisfaction of pants.
H5A: Knit shirts result in higher fit satisfaction ratings than woven shirts.
H5B: Knit pants result in higher fit satisfaction ratings than woven pants.
Findings of the research, resulting from the data analysis, all of the hypotheses were
supported except Hypotheses 3B and 4B. The results of the data analysis for hypothesis 3B
showed an insignificant relationship between pant fit satisfaction and age. The relationship did
exist and supported the assumption that as age increases fit satisfaction decreases, but the
findings were not statistically significant. The results of the analysis for hypothesis 4B showed

34
insignificant differences in pant fit satisfaction between consumer sizes. Thus, size did not
significantly affect fit satisfaction for the pants and the hypothesis was not supported.
Participants were found to purchase the incorrect size garments more often than the correct size
garments, based on the results. Fit satisfaction increased post garment try-on from pre garment
try-on. Age, garment type, and size were influencing factors on fit satisfaction for shirts. Only
garment type was found to be an influencing factor on fit satisfaction for pants.
Conclusion
In response to the first research question, “Are consumers purchasing the correct size
garments based on their body measurements?” it can be concluded from the findings that no,
consumers are not purchasing the correct size garments for their body measurements. A majority
of respondents self-reported purchasing the incorrect size, which could result in dissatisfaction
with garment fit. This supports the previous research that has shown that consumers often do not
accurately know their garment size (Alexander et al., 2005; Mason et al., 2008; Pisut & Connell,
2007; Song & Ashdown, 2013). Consumers need to be better educated on sizing and fit in order
to have a higher fit satisfaction, and better perception of quality.
Research question two asked, “Do consumers perceptions of fit satisfaction of Walmart,
Inc. clothing improve after the consumer tries on the standard block garments?” Based on the
data the answer is yes, their fit satisfaction did increase after trying on the garments. This could
indicate that consumers’ perceptions of Walmart, Inc. clothing are negatively skewed, but that if
consumers actually try on the clothing, their perceptions could be positively influenced. If
perceived quality is increased, brand perception will be improved. When consumers’
perceptions of a brand are higher, it positively impacts their purchase intentions by improving
brand equity (Kim et al., 2009; Nelson et al., 2011; Tong & Hawley, 2009). If Walmart, Inc. is

35
able to improve their consumers’ perception of their apparel quality, and therefore improve brand
equity, they may be able to increase company profitability and consumer satisfaction.
The third research question asked, “What are contributing factors affecting consumers’ fit
satisfaction levels of Walmart, Inc.’s standard block garments?” Based on the findings, age,
size, and garment type all affected fit satisfaction of the shirts. Garment type was the only factor
found to significantly affect fit satisfaction of the pants. Previous research found conflicting
results on how age impacts fit satisfaction (Alexander et al., 2005; Cash & Henry, 1995;
Frederick et al., 2006; Kasambala et al., 2014; Kinley, 2010; Tiggemann, 2004). From the
results, age was found to correlate negatively with fit satisfaction, however the correlation was
not statistically significant for pants. The results show that as age increases, fit satisfaction
decreases. This supports several previous findings, which suggested that younger consumers
may have a higher level of fit satisfaction (Cash & Henry, 1995; Frederick et al., 2006; Kinley,
2010). Earlier research found that size influences fit satisfaction (Alexander et al., 2005;
DesMarteau, 2000; Frederick, Peplau, & Lever, 2006; Kasambala et al., 2014; Kinley, 2010;
Kwon & Parham, 1994; Shin & Baytar, 2013; Song & Ashdown, 2013). The results partially
support this, because there were statistically significant difference in fit satisfaction of the shirts
between sizes, but not for the pants. There has not been previous research on how garment type
influences fit satisfaction, but the data showed significant differences in fit satisfaction between
the types of garments. As expected, knit garments resulted in higher fit satisfaction ratings than
the woven garments. This is likely due to the properties of the fabric and the style of the
garments. One thing that was particularly surprising was that the knit pants were rated highest
overall. Previous research has shown that pants are the most difficult garment to find proper fit
in, which made it very interesting that they resulted in the highest fit satisfaction (Alexander et

36
al., 2005; Kasambala et al., 2014; Kinley, 2009, 2010; Mason et al., 2008; Newcomb & Istook,
2004; Pisut & Connell, 2007; Yoo, 1996).
Overall, the variable ‘fit satisfaction of shirts’ was impacted by the three independent
variables tested, which were age, size, and garment type. ‘Fit satisfaction of pants’ was only
significantly influenced by garment type, which illustrated statistically significant differences in
fit satisfaction between the knit pants and the woven pants. Respondents were more frequently
incorrect about their clothing size than they were correct. Fit satisfaction perceptions increased
from pre try-on to post try-on, meaning once the participants tried on the clothing, they rated the
overall fit as higher than their initial perception of Walmart, Inc. clothing prior to trying on the
garments.
Limitations
There were several limitations to this study. First, approval was needed by Walmart,
Inc.’s legal team for data collection methods, which somewhat limited the data that could be
collected and the location of data collection. The sample was limited to only female Walmart,
Inc. consumers over the age of 18 located in the mid-southern region of the United States, and
participation was voluntary. Due to certain restrictions from a legal aspect, the sample size (N=
55) was small. Results from this study may not be nationally representative, and further research
should be collected with an increased sample size and a more diverse population. Participants’
responses may have been skewed based on any associations with Walmart, Inc.
Implications
The results from this study provide information regarding consumer perceptions of
themselves, as well as of Walmart, Inc. clothing. Consumers’ skewed perceptions of their
garment size may result in dissatisfaction with fit because they are not purchasing or trying on
37
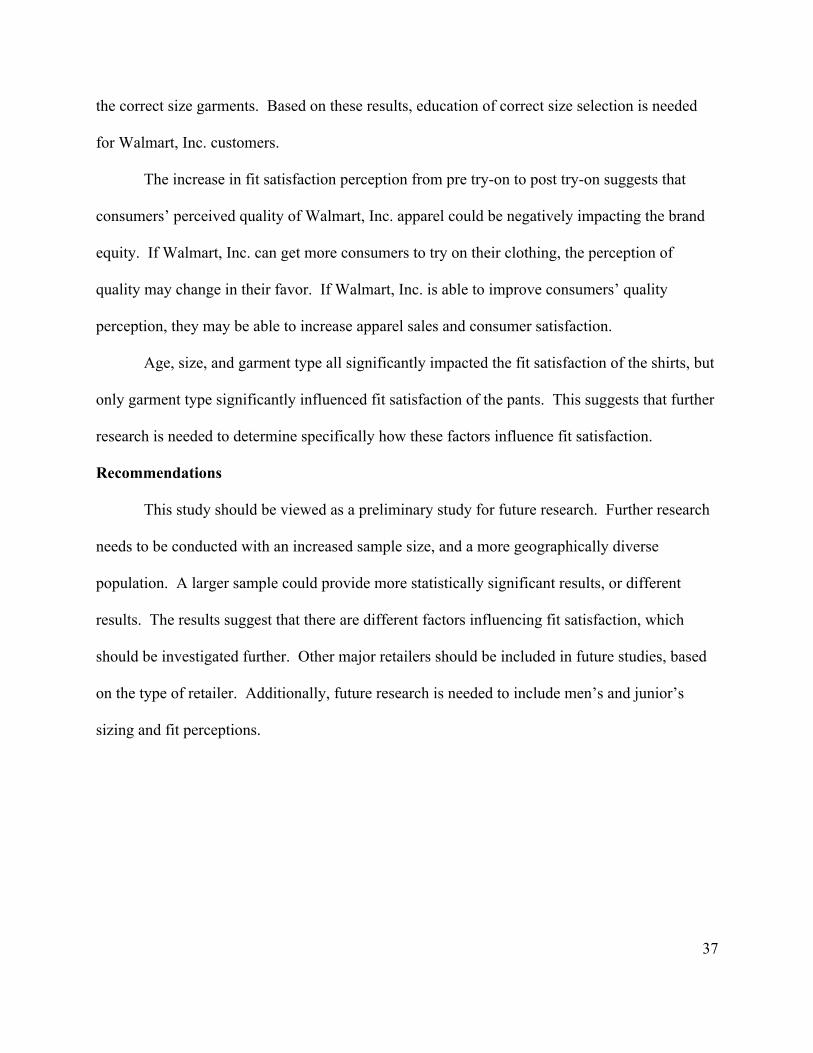
the correct size garments. Based on these results, education of correct size selection is needed
for Walmart, Inc. customers.
The increase in fit satisfaction perception from pre try-on to post try-on suggests that
consumers’ perceived quality of Walmart, Inc. apparel could be negatively impacting the brand
equity. If Walmart, Inc. can get more consumers to try on their clothing, the perception of
quality may change in their favor. If Walmart, Inc. is able to improve consumers’ quality
perception, they may be able to increase apparel sales and consumer satisfaction.
Age, size, and garment type all significantly impacted the fit satisfaction of the shirts, but
only garment type significantly influenced fit satisfaction of the pants. This suggests that further
research is needed to determine specifically how these factors influence fit satisfaction.
Recommendations
This study should be viewed as a preliminary study for future research. Further research
needs to be conducted with an increased sample size, and a more geographically diverse
population. A larger sample could provide more statistically significant results, or different
results. The results suggest that there are different factors influencing fit satisfaction, which
should be investigated further. Other major retailers should be included in future studies, based
on the type of retailer. Additionally, future research is needed to include men’s and junior’s
sizing and fit perceptions.

38
REFERENCES
3D Body Scanner | [TC]². (2014). Retrieved October 10, 2014, from http://www.tc2.com/products/body-scanner/
Alexander, M., Connell, L., & Presley, A. (2005). Clothing fit preferences of young female adult consumers. International Journal of Clothing Science and Technology, 17(1), 52-64.
Bailey, C. S. (2010). Petite women: the reflection of confidence for petite women through dress (Doctoral dissertation, Cape Peninsula University of Technology).
Cash, T. F. (2005). The influence of sociocultural factors on body image: Searching for constructs. Clinical Psychology: Science and Practice, 12(4), 438-442.
Cash, T. F., & Henry, P. E. (1995). Women's body images: The results of a national survey in the USA. Sex roles, 33(1-2), 19-28.
Damhorst, M. L. (1990). In search of a common thread: Classification of information communicated through dress. Clothing & Textiles Research Journal, 8(2), 1-12. doi:10.1177/0887302X9000800201
Demo, D. H. (1985). The measurement of self-esteem: Refining our methods. Journal of Personality and Social Psychology, 48(6), 1490.
DesMarteau, K. (2000). Let the fit revolution begin. (cover story). Bobbin, 42(2), 42.
Festinger, L. (1954). A theory of social comparison processes. Human relations, 7(2), 117-140.
Frederick, D. A., Peplau, L. A., & Lever, J. (2006). The swimsuit issue: Correlates of body image in a sample of 52,677 heterosexual adults. Body Image, 3(4), 413-419.
Gill, S., & Brownbridge, K. The myth of standard sizing.

39
Johnson, K. K. P., Schofield, N. A., & Yurchisin, J. (2002). Appearance and dress as a source of information: A qualitative approach to data collection. Clothing and Textiles Research Journal, 20(3), 125-137. doi:10.1177/0887302X0202000301
Kasambala, J., Kempen, E., & Pandarum, R. (2014). Female consumers’ perceptions of garment fit, personal values and emotions considering their body shapes. The Retail and Marketing Review, 10(1), 95-108.
Kim, E. Y., Knight, D. K., & Pelton, L. E. (2009). Modeling brand equity of a U.S. apparel brand as perceived by Generation Y consumers in the emerging Korean market. Clothing and Textiles Research Journal, 27(4), 247-258.
Kinley, T. R. (2009). Fit and shopping preferences by clothing benefits sought. Journal of Fashion Marketing and Management, 14(3), 397-411. doi:10.1108/13612021011061852
Kinley, T. R. (2010). The Effect of Clothing Size on Self‐Esteem and Body Image. Family and Consumer Sciences Research Journal, 38(3), 317-332.
Kwon, Y. H., & Parham, E. S. (1994). Effects of state of fatness perception on weight conscious women's clothing practices. Clothing and textiles research journal, 12(4), 16-21.
Lennon, S. J., Rudd, N. A., Sloan, B., & Kim, J. S. (1999). Attitudes toward gender roles, self- esteem, and body image: Application of a model. Clothing and Textiles Research Journal, 17(4), 191-202.
Mason, A. M., De Klerk, H. M., Sommervile, J., & Ashdown, S. P. (2008). Consumers' knowledge on sizing and fit issues: a solution to successful apparel selection in developing countries. International Journal of Consumer Studies, 32(3), 276-284.
Nelson, C. N., Rayman, D., & Burns, D. (2011). Apparel Product Quality: Its Nature and Measurement. Journal of Global Fashion Marketing, 2, 66-75.
Newcomb, B., & Istook, C. (2004). A case for the revision of US sizing standards. Journal of Textile and Apparel, Technology and Management, 4(10), 1-6.

40
Pisut, G., Connell, L. J. (2007). Fit preferences of female consumers in the USA. Journal of Fashion Marketing & Management, 11(3), 366-379.
Ryan, M. S. (1991). Clothing: A study in human behavior. Human Ecology, 19(3), 28.
Shin, E., & Baytar, F. (2013). Apparel Fit and Size Concerns and Intentions to Use Virtual Try- On: Impacts of Body Satisfaction and Images of Models’ Bodies. Clothing and Textiles Research Journal, 0887302X13515072.
Song, H. K., & Ashdown, S. P. (2013). Female apparel consumers’ understanding of body size and shape: Relationship among body measurements, fit satisfaction, and body cathexis. Clothing and Textiles Research Journal, 31(3), 143-156.doi:10.1177/0887302X13493127
Stone, G.P. (1962). Appearance and the Self, 86-118. In Human Behavior and social processes: an interactionist approach. A. M. Rose, Ed. New York: Houghton Mifflin Company.
Tiggemann, M. (2004). Body image across the adult life span: Stability and change. Body image, 1(1), 29-41.
Tong, X., & Hawley, J. M. (2009). Measuring customer-based brand equity: empirical evidence from the sportswear market in China. Journal of Product & Brand Management, 18(4), 262-271.
Yoo, S. H. (1996). Investigation of petite and tall sized women's clothing needs: fashion involvement versus pre-purchase clothing satisfaction.

41
APPENDICES

42
APPENDIX A: IRB APPROVAL

43
APPENDIX B: SURVEY 1 & CONSENT FORM INSTRUMENT

44

45

46

47
APPENDIX C: SURVEY 2 INSTRUMENT

48

49