perceptions are relative - vanderbilt business school · perceptions are relative. ... theoretical...
TRANSCRIPT
Perceptions are relativeAn examination of the relationship between
relative satisfaction metrics and shareof wallet
Timothy Lee KeininghamIpsos Loyalty, Parsippany, New Jersey, USA
Bruce CooilGraduate School of Management, Vanderbilt University, Nashville,
Tennessee, USAEdward C. Malthouse
Department of Integrated Marketing Communication,Northwestern University, Evanston, Illinois, USAAlexander Buoye and Lerzan Aksoy
Schools of Business, Fordham University, Bronx, New York, USA, andArne De Keyser and Bart Larivière
Department of Management, Innovation and Entrepreneurship,Ghent University, Ghent, Belgium
AbstractPurpose – There is general agreement among researchers and practitioners that satisfaction isrelative to competitive alternatives. Nonetheless, researchers and managers have not treatedsatisfaction as a relative construct. The result has been weak relationships between satisfaction andshare of wallet in the literature, and challenges by managers as to whether satisfaction is a usefulpredictor of customer behavior and business outcomes. The purpose of this paper is to explore the bestapproach for linking satisfaction to share of wallet.Design/methodology/approach – Using data from 79,543 consumers who provided 258,743observations regarding the brands that they use (over 650 brands) covering 20 industries from 15countries, various models such as the Wallet Allocation Rule (WAR), Zipf-AE, and Zipf-PM, truncatedgeometric model, generalization of the WAR and hierarchical regression models are compared toeach other.Findings – The results indicate that the relationship between satisfaction and share of wallet isprimarily driven by the relative fulfillment customers perceive from the various brands that they use(as gauged by their relative ranked satisfaction level), and not the absolute level of satisfaction.Practical implications – The findings provide practical insight into several easy-to-use approachesthat researchers and managers can apply to improve the strength of the relationship betweensatisfaction and share of wallet.Originality/value – This research provides support to the small number of studies that point to thesuperiority of using relative metrics, and encourages the adoption of relative satisfaction metricsby the academic community.Keywords Customer behaviour, Consumer satisfactionPaper type Research paper
Journal of Service ManagementVol. 26 No. 1, 2015pp. 2-43©EmeraldGroup Publishing Limited1757-5818DOI 10.1108/JOSM-12-2013-0345
Received 10 December 2013Revised 7 February 201426 April 201422 June 2014Accepted 6 July 2014
The current issue and full text archive of this journal is available on Emerald Insight at:www.emeraldinsight.com/1757-5818.htm
Arne De Keyser and Bart Larivière acknowledge support from the Special Research Fund(BOF, Ghent University, project 01N04011) and the National Bank of Belgium. Bruce Cooilacknowledges support from the Dean’s Fund for Faculty Research, Owen Graduate School,Vanderbilt University.
2
JOSM26,1
Managers widely believe that customer satisfaction is a fundamental determinantof long-term consumer behavior (Oliver, 1980; Yi, 1990). This widespread acceptancehas made customer satisfaction the most widely used metric in the measurement andmanagement of consumer loyalty (Aksoy, 2013a; Zeithaml et al., 2006). Companiesspend substantial amounts of money to measure and manage customer satisfaction.For example, Inside Research (2012) found that for the 13 marketing research firms thatresponded to their survey, revenue from US-only customer satisfaction research wouldexceed $750 million – this figure likely underestimates the total spent with marketingresearch firms given the small number of responding firms.
A review of the scientific literature on customer satisfaction supports management’sfocus on customer satisfaction. In particular, many studies have linked customersatisfaction to customers’ purchasing behaviors (e.g. Bolton, 1998; Mittal and Kamakura,2001; Rust and Zahorik, 1993). A close examination of the research regarding customersatisfaction and customers’ share of category spending, however, reveals that while therelationship is positive, it tends to be very weak (Hofmeyr et al., 2008; Mägi, 2003).
Because of the weak relationship, managers have difficulty connecting their effortsto improve satisfaction with tangible financial outcomes (Aksoy, 2013a; Keininghamet al., 2014). For example, in an article entitled “Proof that it pays to be America’smost-hated companies,” Bloomberg Businessweek reported that their analysis of therelationship between the American Customer Satisfaction Index (ACSI) and stockperformance found the relationship to be negative. Specifically, the magazine reported(Chemi, 2013):
[…] customer-service scores have no relevance to stock market returns […] the most-hatedcompanies perform better than their beloved peers […] Your contempt really, truly doesn’tmatter […] If anything, it might hurt company profits to spend money making customers happy.
Results such as these have led to calls by some managers and researchers todiscontinue the measurement and management of satisfaction (Gupta and Zeithaml,2006). Books like Customer Satisfaction is Worthless, Customer Loyalty is Priceless, byconsultant Jeffery Gitomer (1998), and articles like “Customer satisfaction: it is dead,but it will not lie down,” by researchers Williams and Visser (2002) are indicative of thisgeneral frustration.
Given customer satisfaction’s weak relationship to business outcomes and customerbehaviors, Mägi (2003, p. 104) argues “it might be informative to use relative measuresof satisfaction when predicting customer share” (i.e. share of wallet). Researchers agreethat perceptual metrics such as satisfaction need to be measured relative to competitivealternatives (e.g. Varki and Rust, 1997). Furthermore, there is a large body of researchconfirming the influence of competitive comparisons on both choice and post-purchaseevaluations (e.g. Rust et al., 2000).
The small number of studies that have used relative satisfaction in the scientificliterature (e.g. Bolton et al., 2000; Bowman and Narayandas, 2004; Hardie et al., 1993;Wind, 1970) point to the superiority of relative metrics in linking to customer behavior.Nonetheless, the scientific community has been slow to use relative satisfaction in theirresearch. None of the methods used by these researchers have been widely used inother scientific investigations. Rather, the overwhelming majority of scientific researchinvestigating satisfaction relies on absolute metrics on a single firm. Furthermore, thesemethods are rarely used by managers.
The same reluctance to use relative metrics cannot be said for the practitionercommunity. Some of the world’s largest survey research organizations specifically
3
Perceptionsare relative
advocate the use of relative metrics when linking customer satisfaction to a customer’sshare of wallet, and make them the foundation of their brand equity and customerexperience measurement approaches, i.e., TNS: Conversion Model (Louw and Hofmeyr,2012), Ipsos: Brand Value Creator (Hofmeyr et al., 2008), and Ipsos: Wallet AllocationOptimizer (Keiningham et al., 2011). These firms report strong correlations betweentheir approaches and share of wallet.
The creators of these frameworks have made them widely available formanagers to apply in their organizations by publishing their methodologies. Eachof these approaches, however, uses a different technique to link relative metrics toshare of wallet. Furthermore, despite their publication, these methodologies are notoften used by managers outside of their application within a research firm’s specificproduct offer. This, however, does not mean that they are not widely used. Forexample, the Conversion Model is used by “80% of the world’s most valuablebrands” (TNS, 2012).
The gap between the science and the practice of marketing in this regard hasprofound implications for both managers and researchers. There is no research inthe peer reviewed literature that rigorously investigates various methodologies todetermine their efficacy. As a result, researchers and managers are left with almost noguidance as to the usefulness of different approaches, or even to the validity of relativesatisfaction metrics in general.
Additionally, if relative metrics more accurately reflect the relationship betweensatisfaction and customers’ share of category spending, this would likely serve asimpetus for new research in a number of areas. Clearly, this would necessitate newresearch into the relative nature of satisfaction and its corresponding impact onconsumer behavior. It would also likely spur examinations into the potential relativeimpact of other perceptual and attitudinal metrics on consumer behavior (e.g. commitment,emotions, etc.).
As a result, there is a need for research regarding the efficacy of relative satisfactionmetrics and best practices regarding the use relative satisfaction metrics. This researchfills these gaps by investigating the relationship between relative satisfaction andcustomers’ share of category spending (i.e. share of wallet) using data from 79,543consumers who provided 258,743 observations regarding the brands that they usewithin a particular industry category. Data included ratings of over 650 brands in 20industries from 15 countries.
The results of this investigation find that relative satisfaction significantlyoutperforms absolute satisfaction levels in linking to customers’ share of categoryspending. Models based upon absolute satisfaction levels were consistently the worstperforming models investigated. Moreover, we find that the most commonly usedpower laws in practice perform well compared to other models investigated in linkingrelative satisfaction to share of wallet. Finally, we note that there are significantdifferences in the complexity of the various approaches examined. Therefore managersneed to consider the trade-off between relationship strength and complexity whenselecting the best approach for use within their firms.
Structure of manuscriptThis investigation relies upon a rigorous investigation of different power laws andhierarchical regression models. As a result, a thorough description of the investigationrequires a detailed presentation of several models and analytic procedures. This has thepotential to make the paper quite technical and fragmented, resulting in a paper that is
4
JOSM26,1
difficult for most managers to read. As a result, we believe that the core message of thepaper can be lost in the technical descriptions of the models and analytics.
Therefore, in an effort to maximize the readability and insights gleaned fromthis investigation, this paper is divided into two main sections. The first section focuseson the theoretical foundation, core findings, and implications of the research.The second section is a Technical Appendix that provides a detailed overview of themodels examined, and the various approaches used to investigate the properties ofthese models.
By using this approach, we hope that we are able to provide researchers andmanagers with clear and relevant insights while maintaining scientific rigor andtransparency regarding our analyses and findings.
Theoretical backgroundCustomer satisfactionSatisfaction is the consumer’s emotional response to the fulfillment of needs,expectations, wishes or desires. Specifically, Oliver (2010, p. 8) defines customersatisfaction as follows: “Satisfaction is the consumer’s fulfillment response. It is ajudgment that a product/service feature, or the product or service itself, provided (oris providing) a pleasurable level of consumption-related fulfillment, including levelsof under- or overfulfillment.”
Researchers have extensively examined the theoretical underpinnings of thesatisfaction construct (e.g. Fornell et al., 1996; Luo and Bhattacharya, 2006; Oliver,1997). Researchers have also investigated the effects of customer satisfaction on futureconsumer behaviors (e.g. Crosby and Stephens, 1987; Keiningham et al., 2003; Luo andHomburg, 2007).
Of particular importance to this investigation, there is general agreement amongresearchers and practitioners that satisfaction is relative to perceived competitivealternatives (e.g. Birtchnell, 1994; Holt and Huber, 1969; Varki and Rust, 1997; Semon,1994). For example, Woodruff et al. (1983) argue that norms based on consumerexperiences with brands within a product category and relative to competing alternativesin that category were a more natural comparison standard than focal brand expectations.Research by Cadotte et al. (1987) found that experience-based norms better explainvariations in satisfaction than focal brand expectations. Additionally, Gardial et al. (1994)found that consumers tend to rely on competitive comparisons/norms when evaluatingtheir consumption experiences.
This can in part be explained by expectancy-disconfirmation model of the appraisalsequence for satisfaction (Oliver, 2010, pp. 355-360). Oliver (2010, p. 22) defines expectancy-disconfirmation as “the psychological interpretation of an expectation-performancediscrepancy. Consumers would describe this concept in terms of the performance of aproduct or service being better or worse than expected.”
Although satisfaction and disconfirmation are not perfectly correlated, “satisfactionresults primarily from disconfirmation” (Rust et al., 1996, p. 234). As such, expectationstend to play a strong role in consumers’ satisfaction judgments.
Consumers’ expectations are strongly affected by their experiences. Experiences,however, are not limited to the focal/purchased brand, but frequently include broaderexperiences within a product or service category (Woodruff et al., 1983). In addition,expectations may be affected by advertising and word of mouth (Boulding et al., 1993;Miller, 1977). This, to a large degree, explains why satisfaction is influenced bycompetitive comparisons or norms.
5
Perceptionsare relative

Customer satisfaction and share of walletThe relationship between satisfaction and consumer behavior is grounded in the theoryof planned behavior (Ajzen and Madden, 1986), an offshoot of the theory of reasonedaction (Ajzen, 2001; Ajzen and Fishbein, 1980). The theory argues that behaviors areinfluenced by three factors: attitudes, subjective norms, and perceived behavioralcontrol. Specifically, favorable/unfavorable attitudes, in combination perceived societal“norms” are the primary determinants of a consumer’s intention to perform a behavior(provided the consumer believes he/she has the ability to perform the behavior).Although satisfaction is generally viewed as a perception (e.g. Oliver, 1980) this reflectsthe generally accepted view of how satisfaction ultimately influences consumerpurchase decisions (Mittal and Frennea, 2010).
Share of wallet is widely believed to be driven in part by customers’ perceptions ofthe brands they use. The chain of effects can be thought of as product/serviceperformance → satisfaction → share of wallet. In fact, this chain of effects is a logicaladaptation of the core chain of effects proposed in some of the seminal models inmarketing (Keiningham et al., 2005): SERVQUAL (Parasuraman et al., 1988; Zeithamlet al., 1996), service profit chain (Heskett et al., 1994), return on quality (Rust et al., 1995),and the satisfaction profit chain (Anderson and Mittal, 2000).
The idea that customer satisfaction should link to share of category spending isintuitive (i.e. we tend to spend more with firms that better satisfy us). A large body ofresearch does support this positive relationship (e.g. Baumann et al., 2005; Bowman andNarayandas, 2004; Cooil et al., 2007; Keiningham et al., 2003, 2005; Larivière, 2008; Mägi,2003; Perkins-Munn et al., 2005; Silvestro and Cross, 2000).
The problem from a managerial perspective, however, is that while there tends to bea statistically significant positive relationship between satisfaction and share of wallet,the percentage of variance explained by this relationship is low (Hofmeyr et al., 2008;Mägi, 2003). As a result, managers have openly challenged “whether the relationshipbetween unobservable measures such as customer satisfaction and observablebehavior such as purchasing was sufficiently strong to justify its use as the primaryunobservable predictor” (Gupta and Zeithaml, 2006, p. 721).
Researchers have proposed two possible reasons to explain this weak relationship.First, customers appear to differ in their sensitivity to variations in satisfaction(Hofmeyr and Parton, 2010). For example, demographic differences have been shown toimpact the satisfaction-share of wallet relationship (Cooil et al., 2007). Second, researchersargue that satisfaction’s impact on customer behavior is nonlinear and asymmetric(e.g. Anderson and Mittal, 2000; Crotts et al., 2008; Keiningham and Vavra, 2001).Accounting for the asymmetric, non-linear pattern of satisfaction has improved therelationship between satisfaction and share of wallet (e.g. Bowman and Narayandas,2004; Keiningham et al., 2003). Nonetheless, a large portion of the variance remainsunexplained (Hofmeyr and Parton, 2010).
An alternative explanation for the weak relationship has been proposed bymembers of the practitioner community. Hofmeyr and Parton (2010) argue that theoverriding reason for the asymmetric, non-linear relationship between satisfactionand share of wallet is not the absolute level of satisfaction per se. Rather at somepoint higher/lower levels of satisfaction correspond to a shift in a customer’s preferenceranking for a brand vis-à-vis competitive brands that the customer also uses. As aresult, Hofmeyr and colleagues (Hofmeyr et al., 2008; Hofmeyr and Parton 2010) arguethat the focus of satisfaction research should shift from absolute satisfaction levelsto the relative preference rank that a brand’s satisfaction level represents among
6
JOSM26,1
competing brands used by customers to improve the strength of the relationshipbetween satisfaction and share of wallet.
Relative measuresThere is a large body of research confirming the influence of competitive comparisonson both choice and post-purchase evaluations (e.g. Gardial et al., 1994; Rust et al., 2000;Woodruff et al., 1983). For a review of the psychology literature associated with relativethinking in the pre- and post-purchase consumption process, we refer the reader toKeiningham et al. (2014).
Relative thinking is central to the consumer decision process. For example, Jacobyand Chesnut (1978, p. 88) argue that “brand loyalty is a function of decision making,evaluative processes. It reflects a purchase decision in which the various brands havebeen psychologically (perhaps even physically) compared and evaluated on certaininternalized criteria, the outcome of this evaluation being that one or more brandswas (were) selected.”
Similarly, Dick and Basu (1994, pp. 100-101) observe, “Attitudes have been related tobehaviors, although it is important to note that one may hold a favorable attitudetoward a brand but not purchase it over multiple occasions because of comparable orgreater attitudinal extremity toward other brands. For purposes of predictive validity,it is hence advantageous to compare brands that are viewed by consumers to berelevant in a given consumption context. The nature of relative attitudes is likely toprovide a stronger indication of repeat patronage than the attitude toward a branddetermined in isolation.”
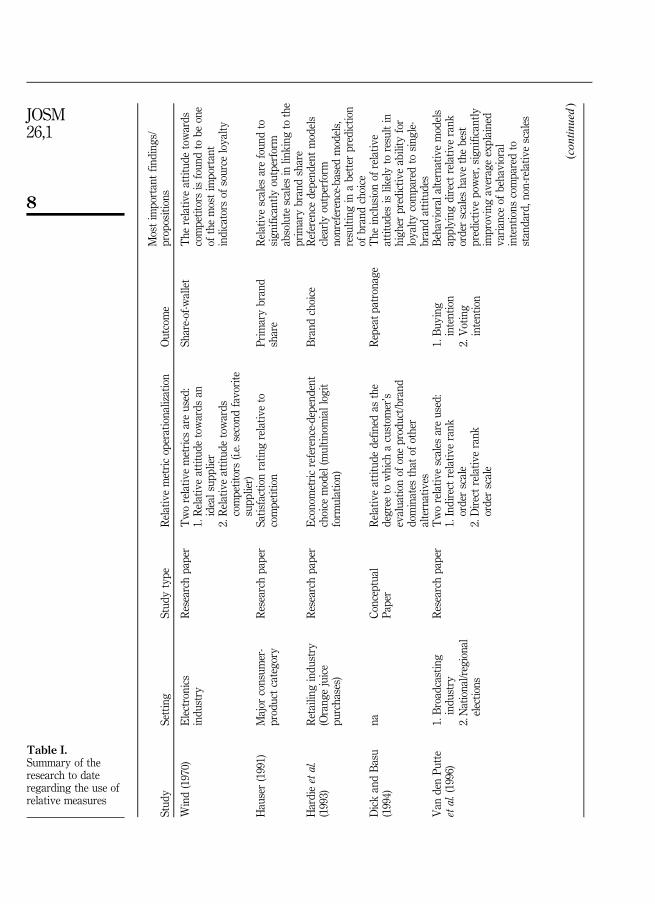
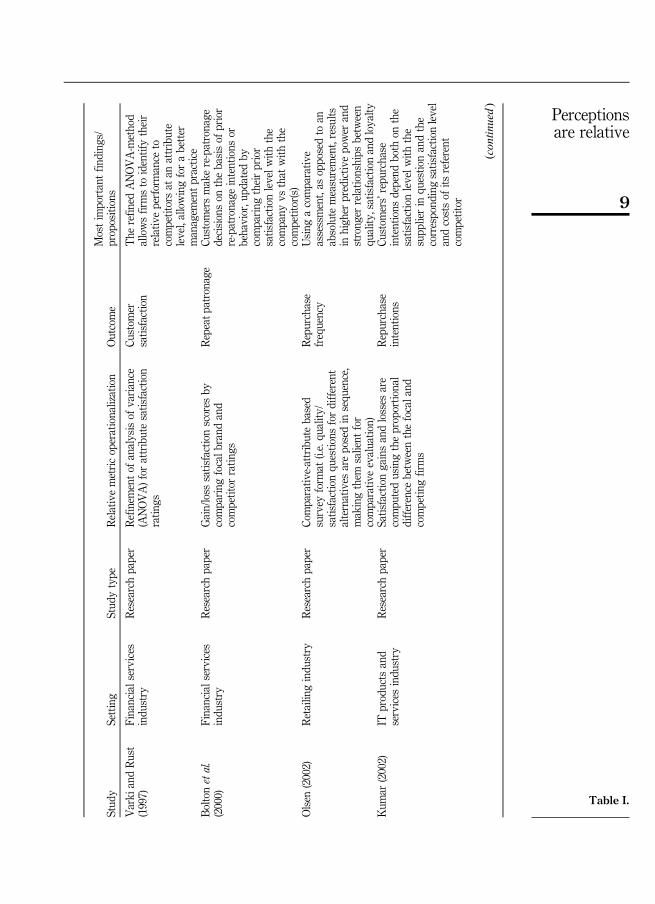
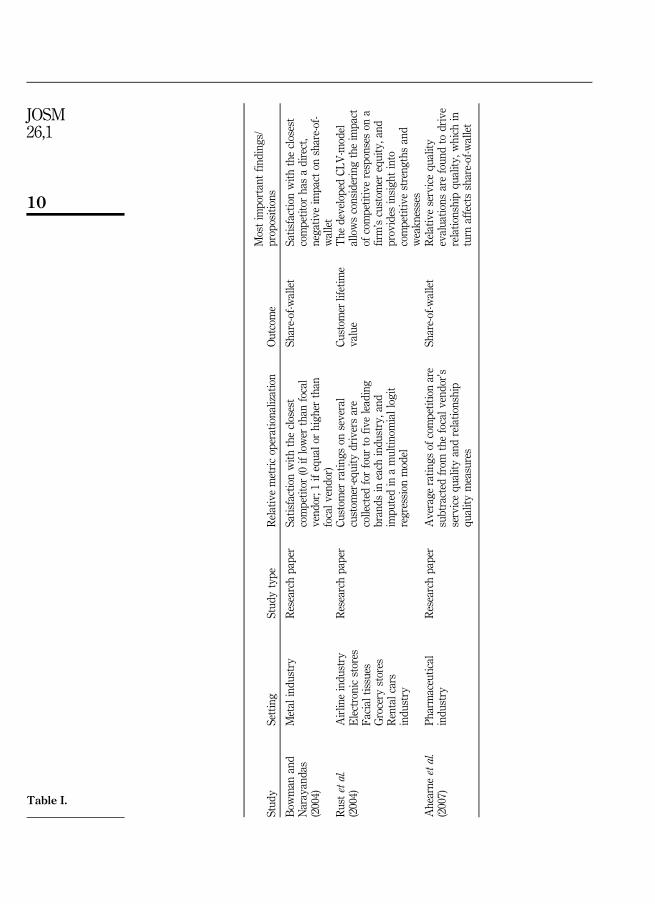
Despite this recognition, academic research has overwhelmingly focused onabsolute metrics. There are, however, some notable exceptions. Table I provides a briefsummary of the research to date regarding the use of relative measures in the scientificliterature.
An examination of the research in Table I supports the superiority of relativemetrics in linking to customer intentions and behaviors. Interestingly, none of themethods used by these researchers have been widely employed in other scientificinvestigations. Furthermore, these methods are rarely used by managers.
Instead, the most prominent voices for the use of relative measures in the predictionof share (specifically market share and share of wallet) and the most widely usedmethodologies come from practitioners. The first widely adopted approach wascustomer value analysis (CVA), advocated by Bradley Gale (1994) in the bookManaging Customer Value. One of the primary points of differentiation of the CVAapproach was its incorporation of relative brand position in linking customerperceptions to business outcomes, most notably market share. At one time this metricwas widely used in industry, although it has fallen out of favor because of underlyingstatistical issues with the ratios used in the process (Keiningham and Vavra, 2001,pp. 41-44) and the inability of many firms to validate the claimed link to market share(Keiningham et al., 2008).
Hofmeyr et al. (2008) introduced a new brand “attitudinal equity” (AE) measureusing the Zipf distribution (Zipf, 1935)[1]. The AE measure was calculated bytransforming satisfaction (or other perceptual/attitudinal metrics) into relative ranks.Specifically, to transform a customer’s satisfaction ratings to ranks, the highestsatisfaction rating a customer gave to a brand in his/her usage set would be assigned a“1,” the second highest a “2,” and so on; in the case of ties, the average is used for theranks that would have been used had there been no ties. These ranks were then
7
Perceptionsare relative
Stud
ySetting
Stud
ytype
Relativemetricoperationalization
Outcome
Mostim
portantfin
ding
s/propositions
Wind(1970)
Electronics
indu
stry
Researchpaper
Tworelativ
emetrics
areused:
1.Relativeattitud
etowards
anidealsup
plier
2.Relativeattitud
etowards
competitors(i.e.second
favorite
supp
lier)
Share-of-wallet
The
relativ
eattitud
etowards
competitorsisfoun
dto
beone
ofthemostim
portant
indicators
ofsource
loyalty
Hauser(1991)
Major
consum
er-
productcategory
Researchpaper
Satisfactionratin
grelativ
eto
competition
Prim
arybrand
share
Relativescales
arefoun
dto
sign
ificantly
outperform
absolutescales
inlin
king
tothe
prim
arybrandshare
Hardieetal.
(1993)
Retailin
gindu
stry
Researchpaper
Econometricreference-depend
ent
choice
model(m
ultin
omiallogit
form
ulation)
Brand
choice
Reference
depend
entmodels
clearlyoutperform
nonreference-based
models,
resulting
inabetter
predictio
nof
brandchoice
(Orang
ejuice
purchases)
DickandBasu
(1994)
naCo
nceptual
Paper
Relativeattitud
edefin
edas
the
degree
towhich
acustom
er’s
evaluatio
nof
oneproduct/b
rand
dominates
that
ofother
alternatives
Repeatp
atronage
The
inclusionof
relativ
eattitud
esislik
elyto
resultin
high
erpredictiv
eability
for
loyalty
comparedto
sing
le-
brandattitud
esVan
denPu
tte
etal.(1996)
1.Broadcasting
indu
stry
Researchpaper
Tworelativ
escales
areused:
1.Indirect
relativ
erank
orderscale
2.Directrelativ
erank
orderscale
1.Buy
ing
intention
Behaviorala
lternativemodels
applying
direct
relativ
erank
orderscales
have
thebest
predictiv
epower,significantly
improvingaverageexplained
variance
ofbehavioral
intentions
comparedto
standard,n
on-relativescales
2.National/regional
electio
ns2.Voting
intention
(con
tinued)
Table I.Summary of theresearch to dateregarding the use ofrelative measures
8
JOSM26,1
Stud
ySetting
Stud
ytype
Relativemetricoperationalization
Outcome
Mostim
portantfin
ding
s/propositions
Varki
andRust
(1997)
Financialservices
indu
stry
Researchpaper
Refinem
entof
analysisof
variance
(ANOVA)for
attributesatisfaction
ratin
gs
Custom
ersatisfaction
The
refin
edANOVA-m
ethod
allowsfirmsto
identifytheir
relativ
eperformance
tocompetitorsat
anattribute
level,allowingforabetter
managem
entpractice
Boltonetal.
(2000)
Financialservices
indu
stry
Researchpaper
Gain/loss
satisfactionscores
bycomparing
focalb
rand
and
competitor
ratin
gs
Repeatp
atronage
Custom
ersmakere-patronage
decisionson
thebasisof
prior
re-patronage
intentions
orbehavior,u
pdated
bycomparing
theirprior
satisfactionlevelw
iththe
company
vsthat
with
the
competitor(s)
Olsen
(2002)
Retailin
gindu
stry
Researchpaper
Comparativ
e-attributebased
survey
form
at(i.e.qu
ality
/satisfactionqu
estio
nsfordifferent
alternatives
areposedin
sequ
ence,
makingthem
salient
for
comparativ
eevaluatio
n)
Repurchase
frequency
Using
acomparativ
eassessment,as
opposedto
anabsolute
measurement,results
inhigh
erpredictiv
epower
and
strong
errelatio
nships
betw
een
quality
,satisfactionandloyalty
Kum
ar(2002)
ITproducts
and
services
indu
stry
Researchpaper
Satisfactiongainsandlosses
are
compu
tedusingtheproportio
nal
difference
betw
eenthefocala
ndcompetin
gfirms
Repurchase
intentions
Custom
ers’repu
rchase
intentions
depend
both
onthe
satisfactionlevelw
iththe
supp
lierin
questio
nandthe
correspond
ingsatisfactionlevel
andcostsof
itsreferent
competitor
(con
tinued)
Table I.
9
Perceptionsare relative
Stud
ySetting
Stud
ytype
Relativemetricoperationalization
Outcome
Mostim
portantfin
ding
s/propositions
Bow
man
and
Narayandas
(2004)
Metal
indu
stry
Researchpaper
Satisfactionwith
theclosest
competitor
(0iflower
than
focal
vend
or;1
ifequalo
rhigh
erthan
focalv
endor)
Share-of-wallet
Satisfactionwith
theclosest
competitor
hasadirect,
negativ
eim
pact
onshare-of-
wallet
Rustetal.
(2004)
Airlin
eindu
stry
Researchpaper
Custom
erratin
gson
several
custom
er-equ
itydriversare
collected
forfour
tofiv
eleading
brands
ineach
indu
stry,and
impu
tedin
amultin
omiallogit
regression
model
Custom
erlifetim
evalue
The
developedCL
V-m
odel
allowsconsideringtheim
pact
ofcompetitiveresponseson
afirm’scustom
erequity,and
provides
insigh
tinto
competitivestreng
thsand
weakn
esses
Electronicstores
Facial
tissues
Grocery
stores
Rentalcars
indu
stry
Ahearne
etal.
(2007)
Pharmaceutical
indu
stry
Researchpaper
Average
ratin
gsof
competitionare
subtracted
from
thefocalv
endor’s
servicequ
ality
andrelatio
nship
quality
measures
Share-of-wallet
Relativeservicequ
ality
evaluatio
nsarefoun
dto
drive
relatio
nshipqu
ality
,which
inturn
affectsshare-of-wallet
Table I.
10
JOSM26,1
transformed to share of wallet estimates using the Zipf distribution. The parameters[2]of the Zipf distribution were determined by fitting the relationship between the rank ofa brand and the corresponding share of wallet that the customer allocated to thatbrand. (For the remainder of this paper, we will refer to this model as Zipf-AE.)
The results of the Zipf-AE approach showed a large improvement in model R2. Inparticular, Hofmeyr et al. report that the average R2 between customer satisfaction andcustomers’ share of wallet using absolute measures was 0.24, while using the rank-based Zipf-AE transformation resulted in a 0.44 R2.
Keiningham et al. (2011) introduced a power law for transforming relative “ranked”satisfaction into share of wallet predictions which they called the Wallet AllocationRule (WAR). Satisfaction ranks were calculated using the same approach as Hofmeyret al. (2008). WAR is a fixed parameter model; as such, no estimation (i.e. data fitting) isrequired to estimate the relationship between rank transformed satisfaction and shareof wallet. Keiningham et al. (2011) report that changes in customers’ WAR scoresand changes in their share of wallet over time showed a correlation of approximately0.8, which corresponds to an R2 of approximately 0.6.
Recently Louw and Hofmeyr (2012) proposed what they described as “animprovement to the original measure of brand attitudinal equity proposed by Hofmeyret al. (2008, p. 10)” which they refer to as a measure of “power of the mind” (PM).As with Hofmeyr et al. (2008), the calculation of PM is also based upon the Zipfdistribution. (For the remainder of the paper, we will refer to this model as Zipf-PM.)
The primary distinguishing characteristic between the Zipf-AE and Zipf-PMapproaches is that Zipf-PM uses “the share that a brand’s rating achieves as a percentof the sum of a respondent’s ratings of relevant brands” in the Zipf distributionequation (Louw and Hofmeyr, 2012, p. 11).
Louw and Hofmeyr (2012) report that the Zip-PM approach has a higher correlationto share of wallet “by a very small margin” (p. 14) than the Zip-AE and WARapproaches. It is important to note, however, that the comparison made in theirinvestigation was not apples-to-apples; WAR and Zipf-AE were calculated using asingle satisfaction question, whereas Zipf-PM was calculated using a combinationof two questions in their comparison. Even with this difference, however, there wasvery little difference in terms of variance explained between the three approaches.
The Zipf and WAR approaches have received a great deal of attention by marketresearchers. Moreover, both the Zipf-AE (Hofmeyr et al., 2008) and WAR (Keininghamet al., 2011) approaches have received important industry awards for innovation(Gesulado, 2011; Humphrey, 2008).
The primary use of these approaches in practice is within specific products offeredby two of the world’s largest market research firms. Specifically, Ipsos and TNS usethese power laws as core components of their brand equity and customer experiencemanagement approaches. As a result, it would be difficult to overstate their use bymanagers through the use of products offered by these firms. Even if we assume 100percent overlap of clients, the research firms using these approaches work with over5,000 different companies worldwide (Ipsos, 2012).
These approaches are not yet widely used by managers outside of the specificproduct offerings of these firms. As these approaches are not “black boxes” (i.e. thesemethods are published) and the creators actively promote these approaches (e.g.Hofmeyr, 2012; Keiningham, 2012), however, marketing managers are increasinglyaware of the call for relative metrics to more strongly link satisfaction and share ofwallet (e.g. Keiningham et al., 2014).
11
Perceptionsare relative
Moreover, while the call for relative metrics has largely come from practitioners,there is early evidence that the academic community has taken notice. For example,Rust and Huang (2014, p. 4) argue that Keiningham (2014) “show convincingly thatrelative metrics (relative to competitors) are essential.”
Research objectivesThe primary purpose of this study is to examine the relationship between relativesatisfaction and share of wallet. As noted earlier, the research to date tends to supportthe superiority of relative perceptual and attitudinal metrics to monadic metrics incorrelating to consumer buying behaviors such as share of wallet (e.g. Bowman andNarayandas, 2004; Hofmeyr et al., 2008; Keiningham et al., 2011). Therefore, wehypothesize:
H1. Ranked satisfaction levels are more strongly correlated to share of wallet thanare absolute satisfaction levels.
Furthermore, although the empirical research appears to confirm the link betweenabsolute satisfaction and share of wallet across various industries such as fleettrucking (Perkins-Munn et al., 2005), pharmaceutical (Perkins-Munn et al., 2005),institutional securities (Keiningham et al., 2005), retail banking (Baumann et al., 2005),processed metals (Bowman and Narayandas, 2004), and grocery retailing (Mägi, 2003;Silvestro and Cross, 2000), the majority of this research has relied on cross sectionaldata. Although longitudinal examinations of the effect of customer satisfaction on otherperformance measures have found a positive relationship to customer retention (Bolton,1998), firm revenues and shareholder value (Anderson et al., 2004), the impact on shareof wallet is limited. One exception is the longitudinal share of wallet study by Cooil et al.(2007) where results indicate a positive relationship between changes in satisfactionand changes in share of wallet over time. In line with these findings, we would expectlongitudinal ranked satisfaction levels to link to changes in share or wallet over time.Therefore we hypothesize:
H2. Changes over time in ranked satisfaction levels are more strongly correlatedto contemporaneous changes in share of wallet than are changes in absolutesatisfaction levels.
In addition to testing the two hypotheses above, another important goal of thisinvestigation is to provide insight into the most widely used approaches for linkingsatisfaction and SOW in practice, i.e., WAR (Keiningham et al., 2011), Zipf-AE (Hofmeyret al., 2008), and Zipf-PM (Louw and Hofmeyr, 2012). In particular, we examine each ofthe proposed power laws to determine their efficacy in predicting SOW from rankedsatisfaction. As noted earlier, to date there is no research in the peer-reviewed scientificliterature that examines these various methods to determine their efficacy. Also, weseek to identify better approaches (if any) to link relative satisfaction levels to shareof wallet.
Data and measuresData collectionThe data were collected by a large marketing research firm as part of its global normsdatabase. In total, the data consisted of 79,543 customers providing 258,743 observationsregarding the brands that they use within a particular industry category. Eachrespondent in the database used two or more brands in the category (i.e. single-brand
12
JOSM26,1
users were not included in our database for analysis since their SOW is, bydefinition, one).
Industries and brands. Data included ratings of over 650 brands in 20 industries.Airlines represented the largest industry in terms of number of respondents, althoughit should be noted that retail was broken out into more homogeneous subgroups. Thecomplete industry breakdown is: airline (44.9 percent), asthma Rx OTC (0.4 percent),automobiles (0.3 percent), baby retail (1.8 percent), beauty (1.7 percent), clothing retail(2.4 percent), credit card (4.3 percent), DIY retail (0.7 percent), drugstores (1.0 percent),electronics retail (2.0 percent), furniture (2.9 percent), general retail (8.0 percent), groceryretail (13.9 percent), mass merchandise retail (0.5 percent), mobile phone carrier(0.03 percent), office supply (0.6 percent), personal computers (0.2 percent), pharmacy(1.6 percent), printer supplies (2.1 percent), and retail banking (10.7 percent).
Countries. Respondents were sampled from 15 countries, with the majority from theUSA. The percentage of respondents from each country is: Australia (0.4 percent),Brazil (3.3 percent), China (0.8 percent), Denmark (0.6 percent), Finland (0.5 percent),Germany (0.6 percent), Italy (8.2 percent), the Netherlands (0.4 percent), Norway(0.6 percent), Peru (0.3 percent), South Africa (0.2 percent), Sweden (0.6 percent), Turkey(1.1 percent), the UK (10.8 percent) and the USA (71.7 percent).
Gender. In terms of total respondents, 51 percent of respondents are female, 49 percentmale. The percentage of female respondents for each country is: Australia (30 percent),Brazil (43 percent), Denmark (31 percent), Finland (40 percent), Italy (29 percent), theNetherlands (48 percent), Norway (34 percent), Peru (31 percent), South Africa (20percent), Sweden (35 percent), Turkey (21 percent), the UK (52 percent), and the USA (53percent). Gender was not available in the database for Chinese and German respondents.
Age. The average age for all respondents is 49. The average age for respondents ineach country is: Australia (48), Brazil (40), China (34), Denmark (49), Finland (45),Germany (38), Italy (48), the Netherlands (47), Norway (45), Peru (41), South Africa (47),Sweden (49), Turkey (34), the UK (48) and the USA (50).
Longitudinal data. A subset of these respondents (all from the USA) were contacted6 months following the initial survey to provide longitudinal information regardingchanges in satisfaction ratings and changes in share of wallet. The longitudinal dataconsisted of 1,138 customers providing 2,686 observations on the same brands in bothperiods 1 and 2. These customers provided a total of 3,228 rankings in period 1 and3,365 rankings in period 2. These 1,138 customers were chosen because they ranked atleast two brands in each period. We needed at least two brands from each customer inperiod 1 in order to be able to use their information to help estimate model parameters.Also, we needed at least two brands per customer in period 2 in order to estimate SOWo100 percent (i.e. when number of brands equal one, SOW is by default 100 percent).
Gender distribution for the longitudinal sample is approximately even (51 percentmale, 49 percent female) with an average age of 55.6. Breakdown of respondents byindustry is as follows: grocery (13.4 percent), drugstore (13.4 percent), pharmacy (4.2percent), mass merchandisers (10.1 percent), retail bank (0.5 percent), asthma Rx (7.9percent), DIY (17.0 percent), office supply (13.5 percent), airline (12.2 percent), computers(3.1 percent), mobile phone carrier (0.4 percent), and automobiles (4.1 percent).
Constructs and measuresCustomer satisfaction. Following Mittal et al. (1999) we measured overall satisfactionwith the brand using a single item (1¼ completely dissatisfied, 10¼ completely
13
Perceptionsare relative
satisfied). Satisfaction levels were converted to ranks using the approach of Hofmeyret al. (2008) discussed earlier.
It is important to note that relative “ranked” satisfaction is not a single-itemconstruct in the commonly used sense. Rather ranks for customers when “number ofbrands⩾2” are based upon consumers’ perceptions of multiple brands. In exampleform, imagine that Brand A has a 7 in satisfaction on a ten-point scale. Its rank willdepend on Brand B. If Brand B rates a 5, then Brand A is rank¼ 1. If Brand B rates a 9,then Brand A is rank¼ 2. In other words, the same satisfaction level can result indifferent ranks as information from all brands used by a respondent is used to determinerank. (Note: In this investigation, all respondents used two or more brands.)
With regard to the use of single-item measures in general, although marketingacademics typically prefer multi-item measures, single-item measures of overallsatisfaction have been used in many prior studies and shown to perform adequately(e.g. Bolton, 1998; Bolton and Lemon, 1999; Cooil et al., 2007; Crosby and Stephens, 1987;Drolet and Morrison, 2001; Mittal and Kamakura, 2001; Mittal et al., 1998, 1999).
Bergkvist and Rossiter (2007) have demonstrated that single-item measures achievethe same predictive ability as multi-item measures, provided that the focal construct isconcrete and singular in nature. Satisfaction would appear to meet this standard.Zeithaml et al. (2006, p. 170) observe, “Customer satisfaction is the most widely usedperceptual metric because it is generic and can be universally gauged for all productsand services (including nonprofit and public services). Even without a precise definitionof the term, customer satisfaction is clearly understood by respondents, and itsmeaning is easy to communicate to managers.”
Moreover, psychometric analyses conducted by Drolet and Morrison (2001) finds thatthe incremental information from even the second or third item in a multi-item scalecontributes very little to the information obtained from the first item in a multi-item scale.They also find that “added items actually aggravate respondent behavior, inflatingacross-item error term correlation and undermining respondent reliability” (p. 196).
Of particular relevance to this investigation, Hofmeyr et al. (2008) and Keininghamet al. (2011) specifically create ranks based upon responses to a single-item measure.This is not surprising given that in practice most firms use single-item measuresof satisfaction (Morgan et al., 2005), and these approaches were developed in large partby industry practitioners. Therefore, it is appropriate to apply this same approach inour investigation of these methods.
It is important to note, however, that the longitudinal data examined in this analysisalso contained the survey measures used in the ACSI to measure overall customersatisfaction, specifically: overall satisfaction (as used in the single item measure),performance relative to expectations, and performance relative to the customer’s ideal(Fornell et al., 1996). Therefore, to be certain that our findings were robust we comparedthe overall satisfaction measure with two reliable composites of these three questions:both the average of all three and the first principal component of the three items.The average and first principal component are essentially the same (the correlationbetween the two summaries is 1.000 across both periods) and overall satisfaction has acorrelation of 0.95 with each. Given this equivalence, the single-item measure ispreferred as the most direct estimate of overall satisfaction.
Share of wallet. Following the approach of Cooil et al. (2007), share of wallet wasmeasured as the percent of spending in the category that respondents allocate to thevarious brands that they use.
14
JOSM26,1
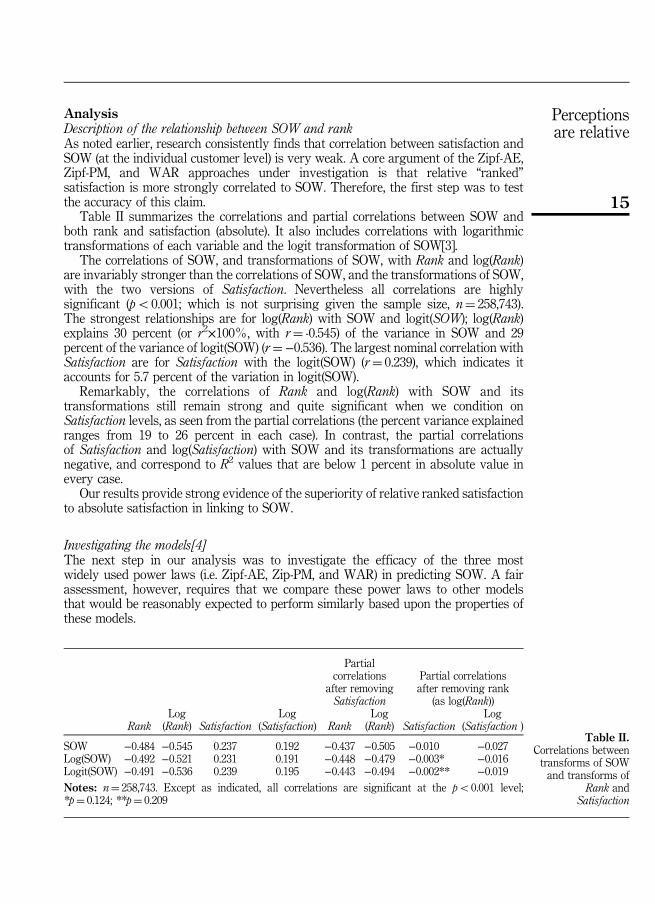
AnalysisDescription of the relationship between SOW and rankAs noted earlier, research consistently finds that correlation between satisfaction andSOW (at the individual customer level) is very weak. A core argument of the Zipf-AE,Zipf-PM, and WAR approaches under investigation is that relative “ranked”satisfaction is more strongly correlated to SOW. Therefore, the first step was to testthe accuracy of this claim.
Table II summarizes the correlations and partial correlations between SOW andboth rank and satisfaction (absolute). It also includes correlations with logarithmictransformations of each variable and the logit transformation of SOW[3].
The correlations of SOW, and transformations of SOW, with Rank and log(Rank)are invariably stronger than the correlations of SOW, and the transformations of SOW,with the two versions of Satisfaction. Nevertheless all correlations are highlysignificant (po0.001; which is not surprising given the sample size, n¼ 258,743).The strongest relationships are for log(Rank) with SOW and logit(SOW); log(Rank)explains 30 percent (or r2×100%, with r¼ -0.545) of the variance in SOW and 29percent of the variance of logit(SOW) (r¼−0.536). The largest nominal correlation withSatisfaction are for Satisfaction with the logit(SOW) (r¼ 0.239), which indicates itaccounts for 5.7 percent of the variation in logit(SOW).
Remarkably, the correlations of Rank and log(Rank) with SOW and itstransformations still remain strong and quite significant when we condition onSatisfaction levels, as seen from the partial correlations (the percent variance explainedranges from 19 to 26 percent in each case). In contrast, the partial correlationsof Satisfaction and log(Satisfaction) with SOW and its transformations are actuallynegative, and correspond to R2 values that are below 1 percent in absolute value inevery case.
Our results provide strong evidence of the superiority of relative ranked satisfactionto absolute satisfaction in linking to SOW.
Investigating the models[4]The next step in our analysis was to investigate the efficacy of the three mostwidely used power laws (i.e. Zipf-AE, Zip-PM, and WAR) in predicting SOW. A fairassessment, however, requires that we compare these power laws to other modelsthat would be reasonably expected to perform similarly based upon the properties ofthese models.
Partialcorrelations
after removingSatisfaction
Partial correlationsafter removing rank
(as log(Rank))
RankLog
(Rank) SatisfactionLog
(Satisfaction) RankLog
(Rank) SatisfactionLog
(Satisfaction )
SOW −0.484 −0.545 0.237 0.192 −0.437 −0.505 −0.010 −0.027Log(SOW) −0.492 −0.521 0.231 0.191 −0.448 −0.479 −0.003* −0.016Logit(SOW) −0.491 −0.536 0.239 0.195 −0.443 −0.494 −0.002** −0.019Notes: n¼ 258,743. Except as indicated, all correlations are significant at the po0.001 level;*p¼ 0.124; **p¼ 0.209
Table II.Correlations betweentransforms of SOWand transforms of
Rank andSatisfaction
15
Perceptionsare relative
The Zipf functions imply a Pareto decay in SOW as rank increases, which is distinctfrom a geometric decay and more rapid than the linear decay of the WAR model (whenthere are more than two brands). Therefore, to provide an additional reasonable pointof comparison for the Zipf-AE and Zipf-PM power laws, we examine the effectivenessof the truncated geometric model in using ranked satisfaction to predict SOW.
Whenever possible, we examine three versions of these discrete distributions: afixed-parameter version, a one-parameter version (i.e. the parameter does not vary bythe total number of brands), and what we label as a nine-parameter version (i.e. theparameter varies by the total number of brands used; we consider customers who usefrom two to ten brands). It is important to note that there is no one-parameter version ofWAR, and no established fixed-parameter version of the truncated geometric. In total,we explore ten versions of the discrete distribution models by including fixed-parameter, one-parameter and nine-parameter versions of the various models.
Additionally, because hierarchical regression models are commonly used in researchand practice to assess the relationship between satisfaction and SOW (e.g. Keininghamet al., 2003) we investigated these models as a point of comparison. In each of thesemodels, a random effect at the customer level is used to accommodate the dependenceamong observations from the same customer within a product category. Specifically,we consider four hierarchical regression models (where for each of set of predictors,we estimate one version with common parameters across all m-categories, where mrepresents the total number of brands, and another with separate parameters withineach m-category).
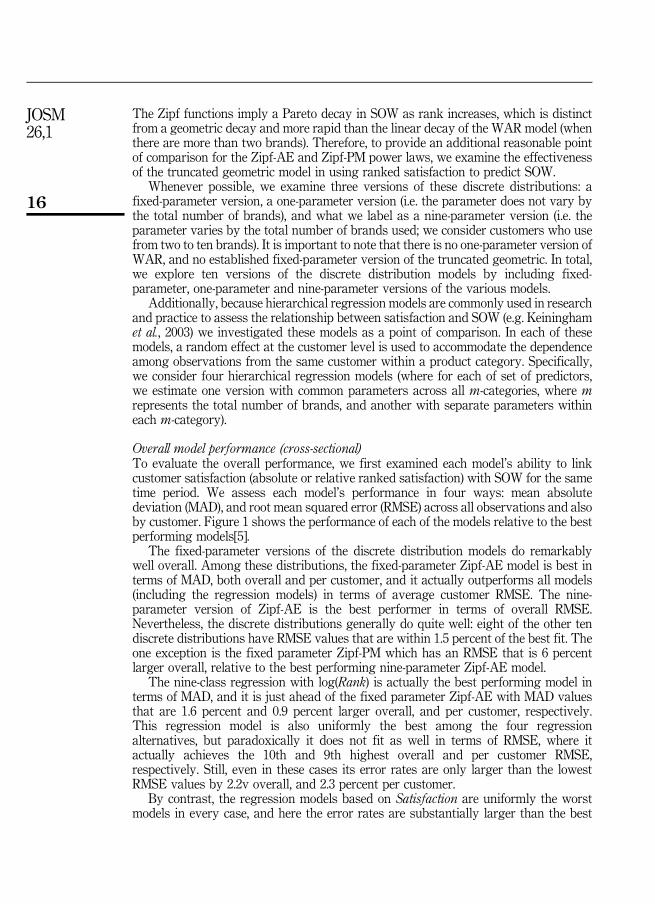
Overall model performance (cross-sectional)To evaluate the overall performance, we first examined each model’s ability to linkcustomer satisfaction (absolute or relative ranked satisfaction) with SOW for the sametime period. We assess each model’s performance in four ways: mean absolutedeviation (MAD), and root mean squared error (RMSE) across all observations and alsoby customer. Figure 1 shows the performance of each of the models relative to the bestperforming models[5].
The fixed-parameter versions of the discrete distribution models do remarkablywell overall. Among these distributions, the fixed-parameter Zipf-AE model is best interms of MAD, both overall and per customer, and it actually outperforms all models(including the regression models) in terms of average customer RMSE. The nine-parameter version of Zipf-AE is the best performer in terms of overall RMSE.Nevertheless, the discrete distributions generally do quite well: eight of the other tendiscrete distributions have RMSE values that are within 1.5 percent of the best fit. Theone exception is the fixed parameter Zipf-PM which has an RMSE that is 6 percentlarger overall, relative to the best performing nine-parameter Zipf-AE model.
The nine-class regression with log(Rank) is actually the best performing model interms of MAD, and it is just ahead of the fixed parameter Zipf-AE with MAD valuesthat are 1.6 percent and 0.9 percent larger overall, and per customer, respectively.This regression model is also uniformly the best among the four regressionalternatives, but paradoxically it does not fit as well in terms of RMSE, where itactually achieves the 10th and 9th highest overall and per customer RMSE,respectively. Still, even in these cases its error rates are only larger than the lowestRMSE values by 2.2v overall, and 2.3 percent per customer.
By contrast, the regression models based on Satisfaction are uniformly the worstmodels in every case, and here the error rates are substantially larger than the best
16
JOSM26,1
model in every instance. Although the nine-class version of this model is the betterperformer, even its error rates range from being higher by 7.3 percent (MAD overall) to12.6 percent (RMSE per customer).
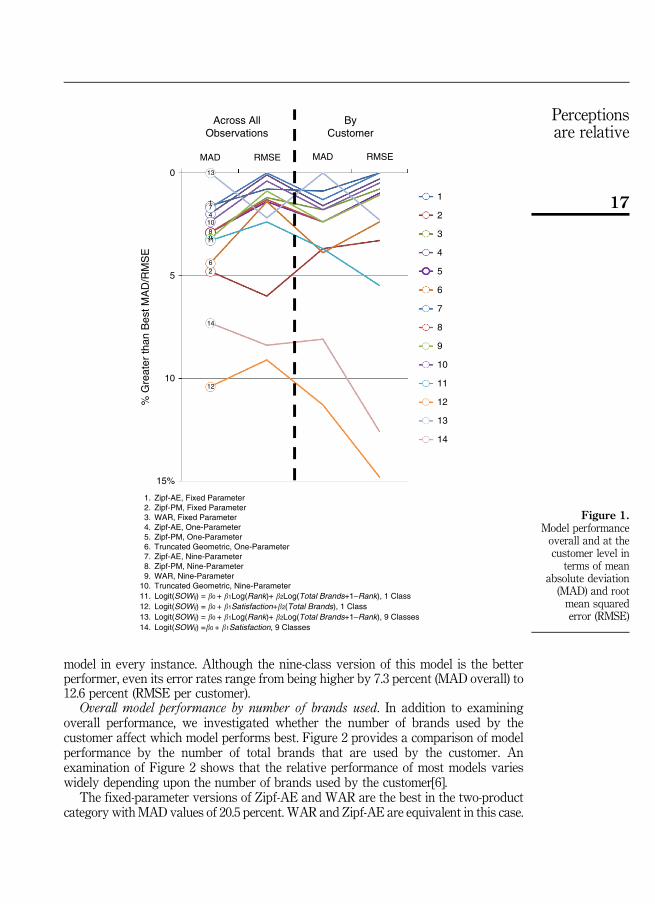
Overall model performance by number of brands used. In addition to examiningoverall performance, we investigated whether the number of brands used by thecustomer affect which model performs best. Figure 2 provides a comparison of modelperformance by the number of total brands that are used by the customer. Anexamination of Figure 2 shows that the relative performance of most models varieswidely depending upon the number of brands used by the customer[6].
The fixed-parameter versions of Zipf-AE and WAR are the best in the two-productcategory with MAD values of 20.5 percent. WAR and Zipf-AE are equivalent in this case.
1. Zipf-AE, Fixed Parameter2. Zipf-PM, Fixed Parameter3. WAR, Fixed Parameter4. Zipf-AE, One-Parameter5. Zipf-PM, One-Parameter6. Truncated Geometric, One-Parameter7. Zipf-AE, Nine-Parameter8. Zipf-PM, Nine-Parameter9. WAR, Nine-Parameter
10. Truncated Geometric, Nine-Parameter11. Logit(SOWij) = �0 + �1Log(Rank)+ �2Log(Total Brands+1–Rank), 1 Class12. Logit(SOWij) = �0 + �1Satisfaction+�2(Total Brands), 1 Class13. Logit(SOWij) = �0 + �1Log(Rank)+ �2Log(Total Brands+1–Rank), 9 Classes14. Logit(SOWij) =�0 + �1Satisfaction, 9 Classes
Across AllObservations
ByCustomer
MAD RMSE MAD RMSE
1
2
3
4
5
6
7
8
9
10
11
12
13
14
0
5
10
15%
% G
reat
er th
an B
est M
AD
/RM
SE
1
2
4
6
7
89
10
11
12
13
14
Figure 1.Model performanceoverall and at thecustomer level in
terms of meanabsolute deviation(MAD) and rootmean squarederror (RMSE)
17
Perceptionsare relative
This is the only category where the nine-class regression with log(Rank) is not the bestmodel, and even in the two-category case this regression model is nearly the best with aMAD that is 20.6 percent (relative to the best MAD of 20.5 percent).
The nine-parameter Zipf-AE model and the nine-class regression with log(Rank) arethe best overall performers across categories, and the Zipf-AE models are alwaysamong the top 5 models when total brands is less than seven (m⩽6). Finally theregression models based on Satisfaction are the worst models overall, in terms ofmedian rank across categories, although the nine-class regression on Satisfaction is thesecond best model in the last category (7⩽m⩽10). The regression models based onSatisfaction are uniformly the poorest performers when there are four or fewer totalbrands (m⩽4).
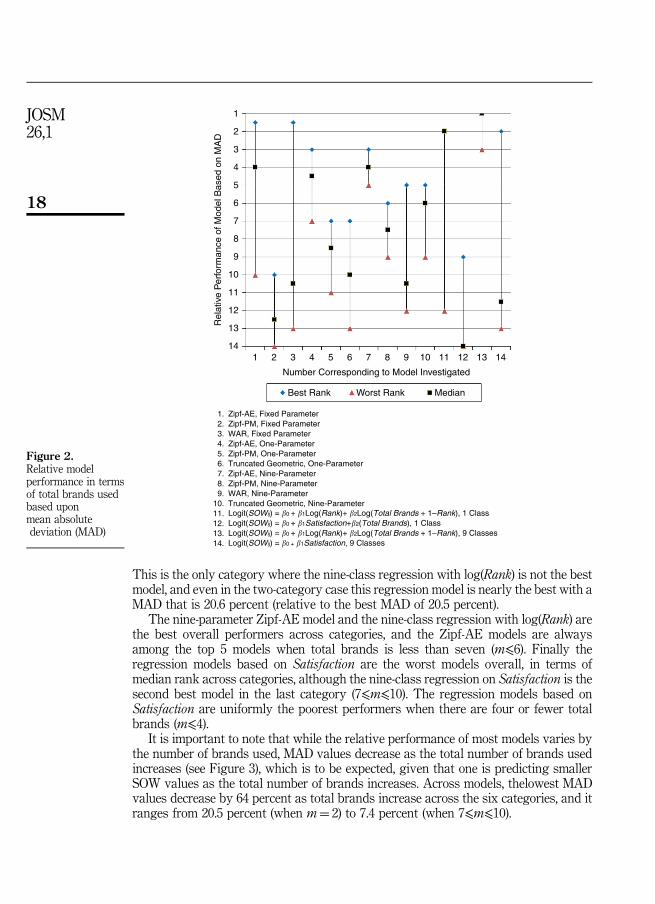
It is important to note that while the relative performance of most models varies bythe number of brands used, MAD values decrease as the total number of brands usedincreases (see Figure 3), which is to be expected, given that one is predicting smallerSOW values as the total number of brands increases. Across models, thelowest MADvalues decrease by 64 percent as total brands increase across the six categories, and itranges from 20.5 percent (when m¼ 2) to 7.4 percent (when 7⩽m⩽10).
Best Rank Worst Rank Median
Number Corresponding to Model Investigated
1
2
3
4
5
6
7
8
9
10
11
12
13
141 2 3 4 5 6 7 8 9 10 11 12 13 14
Rel
ativ
e P
erfo
rman
ce o
f Mod
el B
ased
on
MA
D
1. Zipf-AE, Fixed Parameter2. Zipf-PM, Fixed Parameter3. WAR, Fixed Parameter4. Zipf-AE, One-Parameter5. Zipf-PM, One-Parameter6. Truncated Geometric, One-Parameter7. Zipf-AE, Nine-Parameter8. Zipf-PM, Nine-Parameter9. WAR, Nine-Parameter
10. Truncated Geometric, Nine-Parameter11. Logit(SOWij) = �0 + �1Log(Rank)+ �2Log(Total Brands + 1–Rank), 1 Class12. Logit(SOWij) = �0 + �1Satisfaction+�2(Total Brands), 1 Class13. Logit(SOWij) = �0 + �1Log(Rank)+ �2Log(Total Brands + 1–Rank), 9 Classes14. Logit(SOWij) = �0 + �1Satisfaction, 9 Classes
Figure 2.Relative modelperformance in termsof total brands usedbased uponmean absolutedeviation (MAD)
18
JOSM26,1
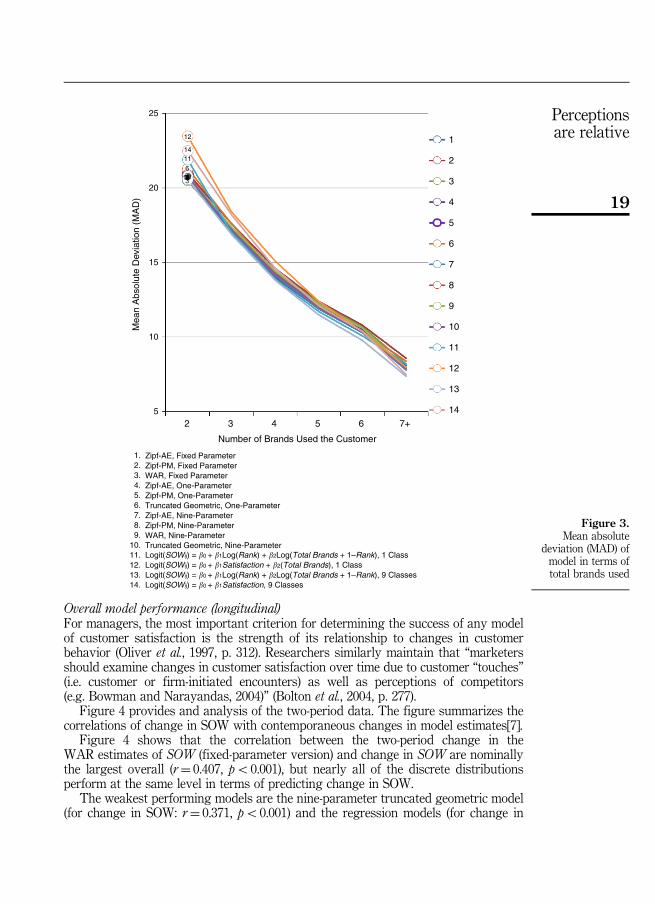
Overall model performance (longitudinal)For managers, the most important criterion for determining the success of any modelof customer satisfaction is the strength of its relationship to changes in customerbehavior (Oliver et al., 1997, p. 312). Researchers similarly maintain that “marketersshould examine changes in customer satisfaction over time due to customer “touches”(i.e. customer or firm-initiated encounters) as well as perceptions of competitors(e.g. Bowman and Narayandas, 2004)” (Bolton et al., 2004, p. 277).
Figure 4 provides and analysis of the two-period data. The figure summarizes thecorrelations of change in SOW with contemporaneous changes in model estimates[7].
Figure 4 shows that the correlation between the two-period change in theWAR estimates of SOW (fixed-parameter version) and change in SOW are nominallythe largest overall (r¼ 0.407, po0.001), but nearly all of the discrete distributionsperform at the same level in terms of predicting change in SOW.
The weakest performing models are the nine-parameter truncated geometric model(for change in SOW: r¼ 0.371, po0.001) and the regression models (for change in
1
2
3
4
5
6
7
8
9
10
11
12
13
14
25
20
15
10
5
12345678910
11
12
13
14
2 3 4 5 6 7+
Number of Brands Used the Customer
Mea
n A
bsol
ute
Dev
iatio
n (M
AD
)
1. Zipf-AE, Fixed Parameter2. Zipf-PM, Fixed Parameter3. WAR, Fixed Parameter4. Zipf-AE, One-Parameter5. Zipf-PM, One-Parameter6. Truncated Geometric, One-Parameter7. Zipf-AE, Nine-Parameter8. Zipf-PM, Nine-Parameter9. WAR, Nine-Parameter
10. Truncated Geometric, Nine-Parameter11. Logit(SOWij) = �0 + �1Log(Rank) + �2Log(Total Brands + 1–Rank), 1 Class12. Logit(SOWij) = �0 + �1Satisfaction + �2(Total Brands), 1 Class13. Logit(SOWij) = �0 + �1Log(Rank) + �2Log(Total Brands + 1–Rank), 9 Classes14. Logit(SOWij) = �0 + �1Satisfaction, 9 Classes
Figure 3.Mean absolute
deviation (MAD) ofmodel in terms oftotal brands used
19
Perceptionsare relative
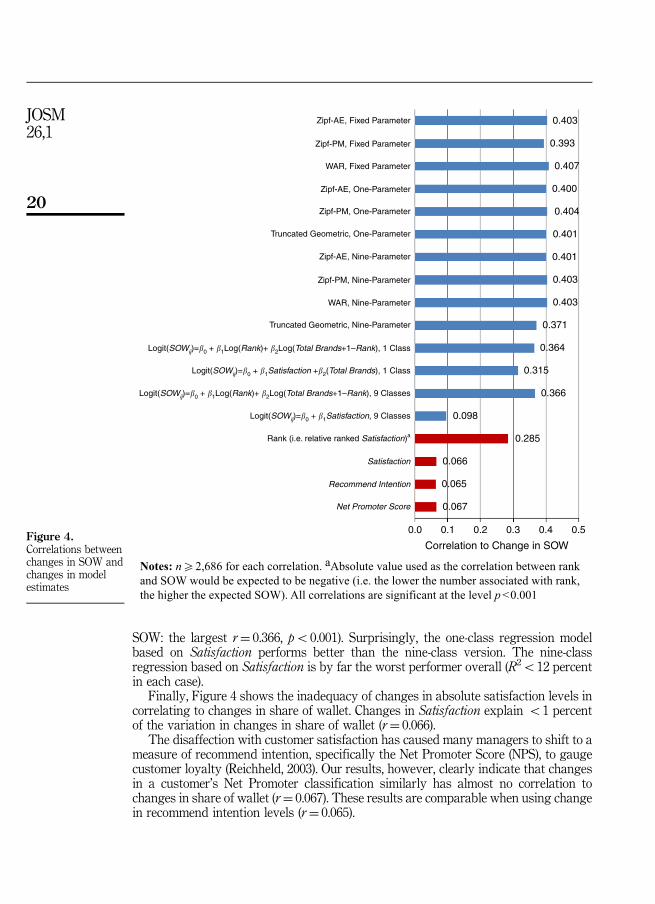
SOW: the largest r¼ 0.366, po0.001). Surprisingly, the one-class regression modelbased on Satisfaction performs better than the nine-class version. The nine-classregression based on Satisfaction is by far the worst performer overall (R2o12 percentin each case).
Finally, Figure 4 shows the inadequacy of changes in absolute satisfaction levels incorrelating to changes in share of wallet. Changes in Satisfaction explain o1 percentof the variation in changes in share of wallet (r¼ 0.066).
The disaffection with customer satisfaction has caused many managers to shift to ameasure of recommend intention, specifically the Net Promoter Score (NPS), to gaugecustomer loyalty (Reichheld, 2003). Our results, however, clearly indicate that changesin a customer’s Net Promoter classification similarly has almost no correlation tochanges in share of wallet (r¼ 0.067). These results are comparable when using changein recommend intention levels (r¼ 0.065).
Notes: n�2,686 for each correlation. aAbsolute value used as the correlation between rankand SOW would be expected to be negative (i.e. the lower the number associated with rank,the higher the expected SOW). All correlations are significant at the level p<0.001
Zipf-AE, Fixed Parameter
Zipf-PM, Fixed Parameter
WAR, Fixed Parameter
WAR, Nine-Parameter
Zipf-AE, One-Parameter
Zipf-PM, One-Parameter
Zipf-AE, Nine-Parameter
Zipf-PM, Nine-Parameter
Truncated Geometric, One-Parameter
Truncated Geometric, Nine-Parameter
Logit(SOWij)=�0 + �1Log(Rank)+ �2Log(Total Brands+1–Rank), 1 Class
Logit(SOWij)=�0 + �1Log(Rank)+ �2Log(Total Brands+1–Rank), 9 Classes
Logit(SOWij)=�0 + �1Satisfaction +�2(Total Brands), 1 Class
Logit(SOWij)=�0 + �1Satisfaction, 9 Classes
Satisfaction
Rank (i.e. relative ranked Satisfaction)a
Recommend Intention
Net Promoter Score
0.0 0.1 0.2 0.3 0.4 0.5
Correlation to Change in SOW
0.403
0.393
0.371
0.364
0.315
0.366
0.285
0.098
0.066
0.065
0.067
0.407
0.400
0.404
0.401
0.401
0.403
0.403
Figure 4.Correlations betweenchanges in SOW andchanges in modelestimates
20
JOSM26,1
Results summary. H1 postulated that “ranked satisfaction levels are more stronglycorrelated to share of wallet than are absolute satisfaction levels.” This studyconclusively showed this to be true.
First, Table II shows that Rank and log(Rank) account for 23 and 30 percent of thevariance in SOW (the corresponding correlations are-0.484 and-0.545, respectively). Incontrast, the percentage of variance explained by satisfaction is 5.7 percent (r¼ 0.239).Even more striking, the conditional correlations between Rank and log(Rank) withSOW and logit(SOW) remain strong, when conditioning on Satisfaction levels,while the conditional (partial) correlations with Satisfaction and log(Satisfaction)) arenot significant, when we condition on log(Rank).
Further, the regressions based on Satisfaction in Figure 2 demonstrate that thesemodels do not fit as well as the corresponding regression based on Rank, and almostwithout exception, the Satisfaction models are the worst performing models. The oneexception occurs in the largest total brand category (see Table AI in the Appendix 1),where the nine-class regression with Satisfaction is second only to the nine-classregression model based on Rank. Finally, among the discrete distribution models, onlythe three Zipf-PM models use information on absolute satisfaction, and these aregenerally among the worst performing discrete distribution models. The findingstherefore clearly indicate the superiority of using a relative ranked approach to customersatisfaction measurement compared to absolute satisfaction when attempting to link to acustomers’ share of wallet. H1 is therefore supported.
H2 postulated that “changes over time in ranked satisfaction levels are morestrongly correlated to contemporaneous changes in share of wallet than are changes inabsolute satisfaction levels.”
The two-period analysis summarized in Figure 4 shows how two-period changes inranked satisfaction levels are more strongly correlated to contemporaneous changes inshare of wallet, than are changes in absolute satisfaction levels. Change in Rank and log(Rank) have substantially larger absolute correlations with change in SOW (r¼−0.285,and r¼−0.332, respectively) and with Logit(SOW) (r¼−0.278, and r¼−0.328,respectively), than with Satisfaction and log(Satisfaction) (here the largest correlation isr¼ 0.111 between satisfaction and Logit(SOW)). Among the 14 models considered, theregression models based on Satisfaction provide estimates of change in SOW and logit(SOW) that have the smallest correlations with actual change in SOW and Logit(SOW).
Using a longitudinal data set, the findings therefore clearly demonstrate that whenlinking changes in customers’ satisfaction levels to changes in corresponding shareof wallet over time, compared to absolute satisfaction, relative ranked satisfactionremains the more closely linked measure to share of wallet. H2 is therefore supported.
Discussion and conclusionThe analysis reported here advances the empirical research regarding the relationshipbetween customer satisfaction and share of wallet in two overarching ways. First, ourfindings clearly demonstrate that relative ranked satisfaction is superior to absolutesatisfaction in linking to the share of category spending that customers allocate tothe brands that they use.
Specifically, our research finds that absolute satisfaction explains only 5.6 percentof the variation in share of wallet when examined cross-sectionally, and changesin absolute satisfaction explain only a very small 0.4 percent of the variation incontemporaneous changes in share of wallet. By contrast, relative ranked satisfaction
21
Perceptionsare relative
explains 23.4 percent in the variation in share of wallet, and changes in relative rankedsatisfaction explains 8.1 percent of the variation in changes in share of wallet.Furthermore, almost without exception, models based on absolute satisfaction are theworst performing models examined in our investigation.
Second, our findings indicate that there are multiple methodologies available toresearchers and managers to transform ranked satisfaction into relatively goodapproximations of customers’ share of wallet allocations.
Specifically, we find that all of the most commonly used discrete distributions(i.e. Zipf-AE, Zipf-PM, and WAR) perform remarkably well. For example, thepercentage of variance explained from changes in the share of wallet estimates fromthese models and changes in customers’ share of category spending ranged from a highof 16.6 percent (for the WAR-fixed parameter model) to a low of 15.4 percent (for theZip-PM fixed parameter model), with the rest of the models explaining 16 percent ormore of the variance.
Additionally, when examined cross-sectionally, the percentage of varianceexplained by these models ranges from a low of 34.6 percent (for the Zip-PM fixedparameter model) to a high of 37.6 percent (for the Zipf-AE nine-parameter model).
Similar cross-sectional results were obtained for hierarchical regression modelsbased on rank (36.0 and 37.0 percent for the two models examined). Longitudinally,however, these models explained approximately 13 percent of the variation in changesin share of wallet.
Taken together, these findings have wide reaching implications for both the practiceand the science of marketing.
Implications for researchersThese results also have several important implications for scientific researchers,and point to the need for new research in several areas. The most obviousimplication of this research is that the traditional view of the satisfaction and shareof wallet relationship (i.e. a non-linear, s-shaped relationship) based upon absolutesatisfaction levels is at best incomplete. Our findings indicate that the relationshipis instead primarily driven by the relative fulfillment customers perceive from thevarious brands that they use (as gauged by their relative ranked satisfaction level),and not the absolute level of satisfaction. Therefore, while consumer satisfactionrepresents a widely studied area of research (for a review, see Oliver, 2010), ourfindings indicate a need for additional research into the nature of satisfaction andits corresponding impact on consumer behavior which better takes competitiveeffects into account.
Choice modelers have known for years that you need to consider all brands in theusage set (Luce, 1959, 1977), yet this simple fact has not been applied by most satisfactionresearchers. Satisfaction researchers must recognize that consumers are making a choice,and that the choice is relative.
The relative nature of satisfaction also indicates that we need new, more comprehensivemodels linking satisfaction to business results. As noted earlier, the seminal satisfaction-based chain of effects models in the literature focus on absolute, focal-firm only metrics.
Additionally, given the relative nature of consumer satisfaction, this raises thelikelihood that other perceptual and attitudinal metrics display similar properties.For example, since most researchers presume that satisfaction is an antecedent tocommitment (e.g. Bansal et al., 2004; Garbarino and Johnson, 1999; Hennig-Thurau et al.,2002), this begs the question, “Is commitment also relative?” If yes, how do consumers
22
JOSM26,1
trade off different types of commitment (e.g. affective, calculative, and normative) with thevarious brands that they use in a category?
Furthermore, previous satisfaction literature has devoted attention to themoderating impact of customer and situational characteristics on the relationshipbetween satisfaction and share of wallet (e.g. Cooil et al., 2007). Hence, given our newinsights, additional research is warranted, investigating these moderating influences ina relative context. For example, length of relationship could be of particular importanceto this research context, as this has been found to lower the relationship betweenabsolute satisfaction and loyalty (e.g. Homburg et al., 2003).
Finally, this research relied on using ranks to capture relative satisfaction.While ranks have been used in other marketing applications to capture relativeperformance (e.g. Kohli and Sah, 2006; Shugan and Mitra, 2013), and Shuganand Mitra (2013) offer a compelling argument regarding the benefits of using ranksas a unit of analysis, more research is needed to determine the best means ofcapturing relative satisfaction (and other perceptual metrics). To date, there areseveral approaches proposed. For example, rank transformation (e.g. Hofmeyret al., 2008; Keiningham et al., 2011) and mean-centering (Wind, 1970) are twocommon approaches for deriving relative position. Van den Putte et al. (1996) usedirect ranking scales (i.e. respondents assign a rank). Still other researchers haveproposed relative scales (e.g. Hauser, 1991). Therefore, there is a need to examinedifferent relative measurement approaches to determine which methods work bestand under what conditions.
Implications for managersOne of the most important implications is that firms need to shift from focusing on theirsatisfaction score (i.e. rating level) to focusing on their rank to which the satisfactionlevel corresponds. This need not be complicated, particularly since ranks are used inmultiple aspects of our lives (sports, education, etc.). If the firm already has a customersatisfaction tracking program in place, managers can simply add questions aboutcompetitors used and ask respondents to provide satisfaction ratings for thesecompetitors in addition to the focal firm. For firms that do not have a tracking systemin place, managers can institute one with new questionnaires that measure satisfactionperceptions for the firm and its competitors which could then be transformed intoranks. The information collected would provide valuable input for calculating metricsto be tracked and/or included in dashboards and also provide opportunities to benchmarkover time.
For example, Keiningham et al. (2014) argue that managers should focus on thepercentage of their customers who would be classified as ranking the firm firstamong all the competitors that they used; they refer to this metric as the percentage“First Choice.” There is an obvious appeal to managers for such a metric. Regardlessof the level of the employee within the organization, all have a visceral sense of theimportance of being first-choice vis-à-vis competition. While there are limitations with afocus on being “first,” it does offer managers a measure that is easy to communicateand easy to rally support around that keeps the focus of the organization onrelative rank.
Another important finding for managers is that managers have several viableoptions when deciding on how they wish to link satisfaction to SOW. The discretedistributions examined perform remarkably well. Nearly all of the discrete distributionsperform at the same level when predicting change in SOW.
23
Perceptionsare relative
It is important to note, however, that with the exception of “automatic decisionmodels such as those involved in search engine optimization, revenue managementsystems and so forth,” simple models tend to perform better when users are involved(Lilien, 2013). Little (1970, 2004) observes that for models to be both useful and used inpractice they must be “(1) simple, (2) robust, (3) easy to control, (4) adaptive, (5) completeon important issues, (6) easy to communicate with” (2004, p. 1855). While marketingacademics likely view most (if not all) of the models investigated – particularly the mostcommonly used discrete models – as being relatively straightforward, the reality isthat most managers do not. In fact, when explaining the WAR – the simplest modelinvestigated – the Harvard Business Review first implored managers with “Don’t let themath scare you” (Keiningham et al., 2011, p. 30).
The danger is that managers tend to reject models that they don’t understand and“revert to models of great simplicity” (Little, 2004, p. 1855). For example, the simplicityof the calculation and the ease of communicating the underlying philosophy wouldappear to explain in large part the continued popularity of the Net Promoter metric(Owen and Brooks, 2009, p. 10) despite a wide body of scientific evidence (including thisinvestigation) which casts doubt on its reported claims to link to business outcomes(e.g. Keiningham et al., 2007; Morgan and Rego, 2006; Sharp, 2008).
Therefore, managers need to balance precision with the ability to easily understandand communicate the fundamentals of the model selected. In the case of thisexamination, several of the models tested require no data fitting to arrive at share ofwallet estimates, specifically the WAR (both fixed parameter and nine-parameterversions) and all of the fixed parameter discrete distributions). As a result, managershave relatively simple models to use which can significantly increase the strength ofthe relationship between satisfaction and share of wallet.
These findings have another important implication for managers. Becauserank-based models are substantially superior to absolute satisfaction based modelsin linking to SOW, the drivers of satisfaction and the drivers of share of wallet arelikely to be different. By “drivers” we mean the underlying attributes that influenceoverall satisfaction levels (Morgan et al., 2005; Anderson and Mittal, 2000).
Most managers identify drivers of satisfaction based upon consumer ratingsregarding the performance of their firm only. Relative ranked satisfaction models,however, by their nature take competition into account. Early research into thedifferences between drivers of satisfaction and drivers of rank (based on relativesatisfaction levels) indicates that consumers who use more than one brand in a categoryat the same time do so to fulfill different needs (Aksoy, 2013b). Therefore, improving rankwould imply not only increasing satisfaction with a firm’s offering, but also reducingconsumers’ perceived needs to use competitors.
ConclusionThere is general agreement among researchers and practitioners that satisfaction isrelative to competitive alternatives (e.g. Birtchnell, 1994; Holt and Huber, 1969; Varkiand Rust, 1997; Semon, 1994). Nonetheless, researchers and managers have nottreated satisfaction as a relative construct. The result has been weak relationshipsbetween satisfaction and SOW in the literature, and challenges by managers as towhether satisfaction is a useful predictor of customer behavior and business growth(Chemi, 2013; Gupta and Zeithaml, 2006; Reichheld, 2003).
This research similarly challenges the usefulness of using absolute satisfactionlevels, and absolute levels of other commonly used metrics such recommend intention
24
JOSM26,1
and the NPS, in linking to customers’ share of category spending. Our findings indicatethat these commonly used metrics explain less than one half of one percent of thevariance in share of wallet. While this may be statistically significant, it is almostcertainly not managerially relevant.
This investigation provides compelling evidence of the superiority of relativeranked satisfaction to absolute satisfaction in linking to share of wallet. Moreover,it provides practical insight into several easy-to-use approaches that researchers andmanagers can apply to improve the strength of the relationship between satisfactionand share of wallet. For example, our research found that almost all versions of thethree most commonly used power laws explained 35 percent or more of the variancein share of wallet when examined cross-sectionally, and 16 percent or more of thevariance in changes in share of wallet when examined longitudinally.
Finally, this research points to the critical need for new research into the relativenature of satisfaction, as well as other perceptual and attitudinal constructs, to betterunderstand their influence on consumer behavior.
LimitationsAlthough this investigation used a large data set comprised of multiple brands, industries,and countries, there are limitations that should be noted. Inclusion of additional brands,industries and countries would more clearly establish the generalizability of our findings.
Additionally, our investigation analyzed only multi-brand usage markets andcustomers. Therefore, research needs to be conducted in single brand usage categoriesto better understand the relationship between satisfaction and consumer behavior todetermine if and how relative satisfaction levels impact this relationship.
Finally, our analysis identified the presence of a statistically significant relationshipbetween current share of wallet levels and relative ranked satisfaction, and changesin share of wallet and concomitant changes in relative ranked satisfaction levels. Wedid not, however, prove causation. Therefore, additional longitudinal research shouldbe conducted to examine the robustness of these findings.
Nonetheless, we believe these results provide compelling evidence of the superiorityof relative satisfaction metrics in linking to customers’ share of wallet allocations.Moreover, this investigation provides insight into several viable approaches thatresearchers and managers can apply to more strongly link satisfaction to customers’spending behaviors.
Notes1. At its core, Zipf’s Law states that the frequency an event is inversely proportional to its rank.
Many types of data studied in the physical and social sciences have been shown to beinversely proportional to rank. Of importance to this investigation, Zipf’s Law has beenshown to apply to market share (Kohli and Sah 2006), corporation sizes (Ramsden andKiss-Haypál, 2000), and the income distribution of companies (Okuyamaa et al., 1999).
2. Note, Hofmeyr et al. (2008) modeled separate Zipf Distributions for each brand usage size.
3. Although the logit transformation is the standard link function used when general linearmodels are applied to binomial data, it is used here, and in the models introduced later, toprovide as an unbounded and relatively familiar dependent variable for linear regression.
4. A detailed description of all models investigated and all analytics conducted is provided inthe Technical Appendix.
25
Perceptionsare relative
5. Table AI in the Appendix 1 provides a detailed comparison of model performance overalland at the customer level in terms of mean absolute deviation (MAD) and root mean squarederror (RMSE) as percent of total SOW.
6. Table AII in the Appendix 1 provides a detailed comparison of model performance by thenumber of total brands (m) that are used by the customer.
7. Table AIII in the Appendix 1 provides a detailed summary of the correlations of changein SOW and logit(SOW) with contemporaneous changes in model estimates and changes inother variables.
8. The nine-class models are fit separately to nine groups defined by the number of TotalBrands, and they include one additional hierarchical parameter per group).
9. In the regression models that use satisfaction, total brands does not need to be used as apredictor, because a separate intercept is fit within each total brand category.
References
Ahearne, M., Jelinek, R. and Jones, E. (2007), “Examining the effect of salesperson servicebehavior in a competitive context”, Journal of the Academy of Marketing Science, Vol. 35No. 4, pp. 603-616.
Ajzen, I. (2001), “Nature and operation of attitudes”, Annual Review of Psychology, Vol. 52 No. 1,pp. 27-58.
Ajzen, I. and Fishbein, M. (1980), Understanding Attitudes and Predicting Social Behavior,Prentice Hall, Englewood Cliffs, NJ.
Ajzen, I. and Madden, T.J. (1986), “Prediction of goal-directed behavior: attitudes, intentions, andperceived behavioral control”, Journal of Experimental Social Psychology, Vol. 22 No. 5,pp. 453-474.
Aksoy, L. (2013a), “How do you measure what you can’t define? The current state of loyaltymeasurement and management”, Journal of Service Management, Vol. 24 No. 4, pp. 356-381.
Aksoy, L. (2013b), “Linking member satisfaction to share of deposits: applying the WalletAllocation Rule in credit unions”, research report, Filene Research Institute PublicationNumber No. 290, Filene Research Institute, Madison, WI, February.
Anderson, E.W. and Mittal, V. (2000), “Strengthening the satisfaction-profit chain”, Journal ofService Research, Vol. 3 No. 2, pp. 107-120.
Anderson, E.W., Fornell, C. and Mazvancheryl, S.K. (2004), “Customer satisfaction and shareholdervalue”, Journal of Marketing, Vol. 68 No. 4, pp. 172-185.
Bansal, H.S., Irving, P.G. and Taylor, S.F. (2004), “A three-component model of customercommitment to service providers”, Journal of the Academy of Marketing Science, Vol. 32No. 3, pp. 234-250.
Baumann, C., Burton, S. and Elliot, G. (2005), “Determinants of customer loyalty and share ofwallet in retail banking”, Journal of Financial Services Marketing, Vol. 9 No. 3, pp. 231-248.
Bergkvist, L. and Rossiter, J.R. (2007), “The predictive validity of multiple-item versus single-itemmeasures of same constructs”, Journal of Marketing Research, Vol. 44 No. 2, pp. 175-184.
Birtchnell, J. (1994), “The interpersonal octagon: an alternative to the interpersonal circle”,Human Relations, Vol. 47 No. 5, pp. 511-529.
Bolton, R.N. (1998), “A dynamic model of the duration of the customer’s relationship witha continuous service provider: the role of satisfaction”, Marketing Science, Vol. 17 No. 1,pp. 45-65.
26
JOSM26,1
Bolton, R.N., Kannan, P.K. and Bramlett, M.D. (2000), “Implications of loyalty programmembership and service experiences for customer retention and value”, Journal of theAcademy of Marketing Science, Vol. 28 No. 1, pp. 95-108.
Bolton, R.N. and Lemon, K.N. (1999), “A dynamic model of customers’ usage of services: usageas an antecedent and consequence of satisfaction”, Journal of Marketing Research, Vol. 36No. 2, pp. 171-186.
Bolton, R.N., Lemon, K.N. and Verhoef, P.C. (2004), “The theoretical underpinnings of customerasset management: a framework and propositions for future research”, Journal of theAcademy of Marketing Science, Vol. 32 No. 3, pp. 271-292.
Boulding, W., Kalra, A., Staelin, R. and Zeithaml, V.A. (1993), “A dynamic process model of servicequality”, Journal of Marketing Research, Vol. 30 No. 1, pp. 7-27.
Bowman, D. and Narayandas, D. (2004), “Linking customer management effort to customerprofitability in business markets”, Journal of Marketing Research, Vol. 41 No. 4,pp. 433-447.
Cadotte, E.R., Woodruff, R.B. and Jenkins, R.L. (1987), “Expectations and norms in models ofconsumer satisfaction”, Journal of Marketing Research, Vol. 24 No. 3, pp. 305-314.
Chemi, E. (2013), “Proof that it pays to be America’s most-hated companies,” BloombergBusinessweek, December 17, available at: www.businessweek.com/articles/2013-12-17/proof-that-it-pays-to-be-americas-most-hated-companies (accessed April 18, 2014).
Cooil, B., Keiningham, T.L., Aksoy, L. and Hsu, M. (2007), “A longitudinal analysis of customersatisfaction and share of wallet: investigating the moderating effect of customercharacteristics”, Journal of Marketing, Vol. 71 No. 1, pp. 67-83.
Crosby, L.A. and Stephens, N. (1987), “Effects of relationship marketing on satisfaction, retention,and prices in the life insurance industry”, Journal of Marketing Research, Vol. 24 No. 4,pp. 404-411.
Crotts, J.C., Pan, B. and Raschid, A.E. (2008), “A survey method for identifying key drivers ofguest delight”, International Journal of Contemporary Hospitality Management, Vol. 20No. 4, pp. 462-470.
Dick, A.S. and Basu, K. (1994), “Customer loyalty: toward an integrated conceptual framework”,Journal of the Academy of Marketing Science, Vol. 22 No. 2, pp. 99-113.
Drolet, A.L. and Morrison, D.G. (2001), “Do we really need multiple-item measures in serviceresearch?”, Journal of Service Research, Vol. 3 No. 3, pp. 196-204.
Fornell, C., Johnson, M.D., Anderson, E.W., Cha, J. and Bryant, B.E. (1996), “The Americancustomer satisfaction index: nature, purpose, and findings”, Journal of Marketing, Vol. 60No. 4, pp. 7-18.
Gale, B.T. (1994), Managing Customer Value, The Free Press, New York, NY.
Garbarino, E. and Johnson, M.S. (1999), “The different roles of satisfaction, trust, and commitmentin customer relationships”, Journal of Marketing, Vol. 63 No. 2, pp. 70-87.
Gardial, S.F., Clemons, D.S., Woodruff, R.B., Schumann, D.W. and Burns, M.J. (1994), “Comparingconsumers recall of prepurchase and postpurchase product evaluation experiences”,Journal of Consumer Research, Vol. 20 No. 4, pp. 548-560.
Gasbarra, D., Kulathinal, D., Pirinen, M. and Sillanpää, M.J. (2011), “Estimating haplotypefrequencies by combining data from large DNA pools with database information”, IEEE/ACM Transactions on Computational Biology and Bioinformatics, Vol. 8 No. 1, pp. 36-44.
Gesulado, N. (2011), “Team including Prof. Aksoy wins innovation award”, Gabelli Connect,November 9, available at: www.gabelliconnect.com/disruptiveinnovation (accessedDecember 18, 2012).
27
Perceptionsare relative
Gitomer, J. (1998), Customer Satisfaction is Worthless, Customer Loyalty Is Priceless, Bard Press,Austin, TX.
Gupta, S. and Zeithaml, V. (2006), “Customer metrics and their impact on financial performance”,Marketing Science, Vol. 25 No. 6, pp. 718-739.
Hardie, B., Johnson, E.J. and Fader, P.S. (1993), “Modeling loss aversion and reference dependenceeffects on brand choice”, Marketing Science, Vol. 12 No. 4, pp. 378-394.
Hauser, J.R. (1991), Comparison of Importance Measurement Methodologies and their Relationshipto Consumer Satisfaction, MIT Sloan School of Management, Cambridge, MA.
Hennig-Thurau, T., Gwinner, K.P. and Gremler, D.D. (2002), “Understanding relationshipmarketing outcomes: an integration of relational benefits and relationship quality”, Journalof Service Research, Vol. 4 No. 3, pp. 230-247.
Heskett, J.L., Jones, T.O., Loveman, G.W., Sasser, W.E. Jr and Schlesinger, L.A. (1994), “Puttingthe service-profit chain to work”, Harvard Business Review, Vol. 72 No. 2, pp. 164-174.
Hofmeyr, J. (2012), “Bringing marketing research into the 21st Century”, TNS Conversion ModelSeminar, TNS Sifo, September 11, available at: www.slideshare.net/tnssifo/tns-conversionmodel-seminar-911-hur-du-vinner-slaget (accessed December 6, 2013).
Hofmeyr, J. and Parton, G. (2010), “Rank matters”, Marketing Research, Vol. 22 No. 3, pp. 6-12.
Hofmeyr, J., Goodall, V., Bongers, M. and Holtzman, P. (2008), “A new measure of brandattitudinal equity based on the Zipf distribution”, International Journal of Market Research,Vol. 50 No. 2, pp. 181-202.
Holt, C.C. and Huber, G.P. (1969), “A computer aided approach to employment service placementand counseling”, Management Science, Vol. 15 No. 11, pp. 573-594.
Homburg, C., Giering, A. and Menon, A. (2003), “Relationship characteristics as moderators of therelationship between customer satisfaction and loyalty: an empirical analysis”, Psychologyand Marketing, Vol. 18 No. 1, pp. 35-62.
Humphrey, J. (2008), “Synovate wins MRS David Winton Award for Innovation”, press release,December 11, available at: www.pressreleasepoint.com/synovate-wins-mrs-david-winton-award-innovation (accessed December 18, 2012).
Inside Research (2012), “Special report: US CSM spend back”, Vol. 23, Issue 289, Number 3(March), p. 16.
Ipsos (2012), “Fast facts”, available at: www.ipsos.com/Fast_facts (accessed December 27, 2012).
Jacoby, J. and Chesnut, R.W. (1978), Brand Loyalty Measurement and Management, John Wiley,New York, NY.
Johnson, N.L. (1960), “An approximation to the multinomial distribution: some properties andapplications”, Biometrika, Vol. 47 Nos 1/2, pp. 93-102.
Keiningham, T.L. (2012), “Customer loyalty measurement is broken – let’s fix it!”, presented at the2012 Conference Board Customer Experience Leadership Conference, New York, NY,March 22-23.
Keiningham, T.L. and Vavra, T.G. (2001), The Customer Delight Principle, McGraw Hill,New York, NY.
Keiningham, T.L., Perkins-Munn and Evans, H. (2003), “The impact of customer satisfaction onshare-of-wallet in a business-to-business environment”, Journal of Service Research, Vol. 6No. 1, pp. 37-50.
Keiningham, T.L., Perkins-Munn, T., Aksoy, L. and Estrin, D. (2005), “Does customer satisfactionlead to profitability?: The mediating role of share-of-wallet”, Managing Service Quality,Vol. 15 No. 2, pp. 172-181.
28
JOSM26,1
Keiningham, T.L., Cooil, B., Andreassen, T.W. and Aksoy, L. (2007), “A longitudinal examinationof net promoter and firm revenue growth”, Journal of Marketing, Vol. 71 No. 3,pp. 39-51.
Keiningham, T.L., Aksoy, L., Cooil, B. and Andreassen, T.W. (2008), “Linking customer loyalty togrowth”, MIT Sloan Management Review, Vol. 49 No. 4, pp. 50-57.
Keiningham, T.L., Aksoy, L., Buoye, A. and Cooil, B. (2011), “Customer loyalty isn’t enough. Growyour share of wallet”, Harvard Business Review, Vol. 89 No. 10, pp. 29-31.
Keiningham, T.L., Gupta, S., Aksoy, L. and Buoye, A. (2014), “The high price of customersatisfaction”, MIT Sloan Management Review, Vol. 55 No. 3, pp. 37-46.
Keiningham, T.L., Aksoy, L., De Keyser, A., Larivière, B., Buoye, A. and Williams, L. (2014),“It’s not your score that matters: the importance of relative metrics”, in Roland, R. andHuang, M.-H. (Eds), Handbook of Service Marketing Research, Edward Elgar Publishing,Cheltenham, pp. 166-181.
Kohli, R. and Sah, R. (2006), “Some empirical regularities in market shares”,Management Science,Vol. 52 No. 11, pp. 1792-1798.
Kumar, P. (2002), “The impact of performance, cost, and competitive considerations on therelationship between satisfaction and repurchase intent in business markets”, Journal ofService Research, Vol. 5 No. 1, pp. 55-68.
Larivière, B. (2008), “Linking perceptual and behavioral customer metrics to multiperiod customerprofitability – a comprehensive service-profit chain application”, Journal of Service Research,Vol. 11 No. 1, pp. 3-21.
Lilien, G. (2013), “Personal communication”, e-mail, July 17.
Little, J.D.C. (1970), “Models and managers: the concept of a decision calculus”, ManagementScience, Vol. 16 No. 8, pp. B466-B485.
Little, J.D.C. (2004), “Comments on ‘models and managers: the concept of a decision calculus’:managerial models for practice”,Management Science, Vol. 50 No. Suppl 12, pp. 1854-1860.
Louw, A. and Hofmeyr, J. (2012), “Reality check in the digital age: the relationship between whatwe ask and what people actually do”, in Fellows, D.S. (Ed.), 3D Digital Dimensions 2012(ESOMAR Publication Series Volume S355 (ISBN 920831-0261-4), ESOMAR,Amsterdam.
Luce, R.D. (1959), Individual Choice Behavior: A Theoretical Analysis, John Wiley & Sons,New York, NY.
Luce, R.D. (1977), “The choice axiom after twenty years”, Journal of Mathematical Psychology,Vol. 15 No. 3, pp. 215-233.
Luo, X. and Bhattacharya, C.B. (2006), “Corporate social responsibility, customer satisfaction,and market value”, Journal of Marketing, Vol. 70 No. 4, pp. 1-18.
Luo, X. and Homburg, C. (2007), “Neglected outcomes of customer satisfaction”, Journal ofMarketing, Vol. 71 No. 2, pp. 133-149.
Mägi, A.W. (2003), “Share of wallet in retailing: the effects of customer satisfaction, loyalty cardsand shopper characteristics”, Journal of Retailing, Vol. 79 No. 2, pp. 97-106.
Miller, J.A. (1977), “Studying satisfaction, modifying models, eliciting expectation, posingproblems and making meaningful measurement”, in Hunt, H.K. (Ed.), Conceptualization andMeasurement of Consumer Satisfaction and Dissatisfaction, Marketing Science Institute,Cambridge, MA, pp. 72-91.
Mittal, V. and Frennea, C.M. (2010), “Customer satisfaction: a strategic review and guidelines formanagers”, Fast Forward MSI Report No. 10-701, Cambridge, MA.
29
Perceptionsare relative
Mittal, V. and Kamakura, W.A. (2001), “Satisfaction, repurchase intent, and repurchase behavior:investigating the moderating effect of customer characteristics”, Journal of MarketingResearch, Vol. 38 No. 1, pp. 131-142.
Mittal, V., Kumar, P. and Tsiros, M. (1999), “Attribute-level performance, satisfaction, andbehavioral intentions over time: a consumption system approach”, Journal of Marketing,Vol. 63 No. 2, pp. 88-101.
Mittal, V., Ross, W.T. Jr and Baldasare, P.M. (1998), “The asymmetric impact of negative andpositive attribute-level performance on overall satisfaction and repurchase intentions”,Journal of Marketing, Vol. 62, January, pp. 33-47.
Morgan, N.A., Anderson, E.W. and Mittal, V. (2005), “Understanding firms’ customer satisfactioninformation usage”, Journal of Marketing, Vol. 69 No. 3, pp. 131-151.
Morgan, N.A. and Rego, L.L. (2006), “The value of different customer satisfaction and loyaltymetrics in predicting business performance”,Marketing Science, Vol. 25 No. 5, pp. 426-439.
Okuyamaa, K., Takayasu, M. and Takayasu, H. (1999), “Zipf’s law in income distribution ofcompanies”, Physica A: Statistical Mechanics and its Applications, Vol. 269 No. 1,pp. 125-131.
Oliver, R.L. (1980), “A cognitive model of the antecedents and consequences of satisfactiondecisions”, Journal of Marketing Research, Vol. 17 No. 4, pp. 460-469.
Oliver, R.L. (1997), Satisfaction: A Behavioral Perspective on the Consumer, McGraw Hill,New York, NY.
Oliver, R.L. (2010), Satisfaction: A Behavioral Perspective on the Consumer, 2nd ed., M.E. Sharpe,Armonk, NY.
Oliver, R.L., Rust, R.T.R. and Varki, S. (1997), “Customer delight: foundations, findings, andmanagerial insight”, Journal of Retailing, Vol. 73 No. 3, pp. 311-336.
Olsen, S.O. (2002), “Comparative evaluation and the relationship between quality, satisfaction,and repurchase loyalty”, Journal of the Academy of Marketing Science, Vol. 30 No. 3,pp. 240-249.
Owen, R. and Brooks, L. (2009),Answering the Ultimate Question, Jossey-Bass, San Francisco, CA.
Parasuraman, A., Zeithaml, V.A. and Berry, L.L. (1988), “SERVQUAL: s multiple-item scale formeasuring consumer perceptions of service quality”, Journal of Retailing, Vol. 64 No. 1,pp. 12-40.
Perkins-Munn, T., Aksoy, L., Keiningham, T.L. and Estrin, D. (2005), “Actual purchase as a proxyfor share of wallet”, Journal of Service Research, Vol. 7 No. 3, pp. 245-256.
Ramsden, J.J. and Kiss-Haypál, G. (2000), “Company size distribution in different countries”,Physica A: Statistical Mechanics and its Applications, Vol. 277 Nos 1-2, pp. 220-227.
Reichheld, F.F. (2003), “The one number you need to grow”, Harvard Business Review, Vol. 81No. 12, pp. 46-54.
Rust, R.T., Danaher, P.J. and Varki, S. (2000), “Using service quality data for competitivemarketing decisions”, International Journal of Service Industry Management, Vol. 11 No. 5,pp. 438-469.
Rust, R.T. and Huang, M. (2014), “Service marketing research: emerging directions”, in Roland, R.and Huang, M.-H. (Eds), Handbook of Service Marketing Research, Edward ElgarPublishing, Cheltenham, pp. 3-8.
Rust, R.T., Lemon, K.N. and Zeithaml, V.A. (2004), “Return on marketing: using customer equityto focus marketing strategy”, Journal of Marketing, Vol. 68 No. 1, pp. 109-127.
Rust, R.T. and Zahorik, A.J. (1993), “Customer satisfaction, customer retention, and marketshare”, Journal of Retailing, Vol. 69 No. 2, pp. 193-215.
30
JOSM26,1
Rust, R.T., Zahorik, A.J. and Keiningham, T.L. (1995), “Return on quality (ROQ), making servicequality financially accountable”, Journal of Marketing, Vol. 59 No. 2, pp. 58-70.
Rust, R.T., Zahorik, A.J. and Keiningham, T.L. (1996), Service Marketing. Harper Collins,HarperCollins, New York, NY.
Semon, T.T. (1994), “Customer satisfaction is relative”, Marketing News, Vol. 28 No. 10, pp. 15.
Sharp, B. (2008), “Net promoter score fails the test”, Marketing Research, Vol. 20 No. 4, pp. 28-30.
Shugan, S.M. and Mitra, D. (2013), “A theory for market growth or decline”, Marketing Science,Vol. 33 No. 1, pp. 47-65.
Silvestro, R. and Cross, S. (2000), “Applying the service profit chain in a retail environment –challenging the ‘satisfaction mirror’”, International Journal of Service IndustryManagement, Vol. 11 No. 3, pp. 244-268.
TNS (2012), “Conversion Model™ – commitment measurement”, available at: www.tns-global.be/solutions/commitment-research/ (accessed December 5, 2012).
Van den Putte, B., Hoogstraten, J. and Meertens, R. (1996), “A comparison of behaviouralalternative models in the context of the theory of reasoned action”, British Journal of SocialPsychology, Vol. 35 No. 2, pp. 257-266.
Varki, S. and Rust, R.T. (1997), “Satisfaction is relative”, Marketing Research, Vol. 9 No. 2,pp. 14-19.
Williams, R. and Visser, R. (2002), “Customer satisfaction: it is dead but it will not lie down”,Managing Service Quality, Vol. 12 No. 3, pp. 194-200.
Wind, Y. (1970), “Industrial source loyalty”, Journal of Marketing Research, Vol. 7 No. 4,pp. 450-457.
Woodruff, R.B., Cadotte, E.R. and Jenkins, R.L. (1983), “Modeling consumer satisfaction processesusing experience-based norms”, Journal of Marketing Research, Vol. 20 No. 3, pp. 296-304.
Yi, Y. (1990), “A critical review of consumer satisfaction”, in Zeithaml, V.A. (Ed.), Review ofMarketing, American Marketing Association, Chicago, IL, pp. 68-123.
Zeithaml, V.A., Berry, L.L. and Parasuraman, A. (1996), “The behavioral consequences of servicequality”, Journal of Marketing, Vol. 60 No. 2, pp. 31-46.
Zeithaml, V.A., Bolton, R., Deighton, J., Keiningham, T.L., Lemon, K. and Petersen, A. (2006),“Forward-looking customer focus: can firms have adaptive foresight?”, Journal of ServiceResearch, Vol. 9 No. 2, pp. 168-183.
Zipf, G.K. (1935), The Psycho-Biology of Language: an Introduction to Dynamic Philology,Houghton Mifflin, Boston, MA.
Further reading
Anderson, E.W. and Sullivan, M.W. (1993), “The antecedents and consequences of customersatisfaction for firms”, Marketing Science, Vol. 12 No. 2, pp. 125-143.
(The Appendix follows overleaf.)
31
Perceptionsare relative
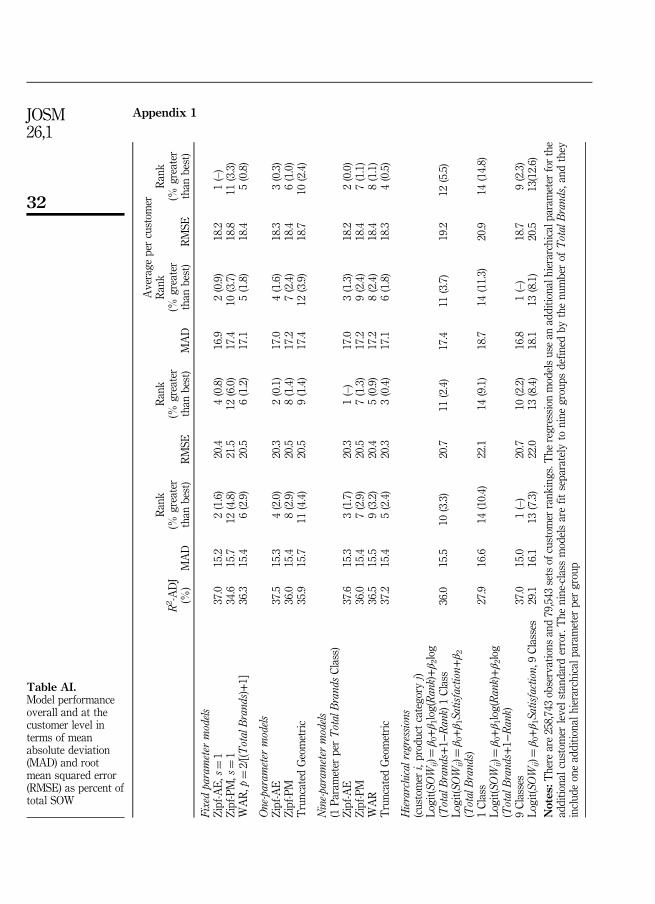
Appendix 1
Average
percustom
er
R2 -ADJ
(%)
MAD
Rank
(%greater
than
best)
RMSE
Rank
(%greater
than
best)
MAD
Rank
(%greater
than
best)
RMSE
Rank
(%greater
than
best)
Fixedparameter
models
Zipf-AE,s
¼1
37.0
15.2
2(1.6)
20.4
4(0.8)
16.9
2(0.9)
18.2
1(–)
Zipf-PM,s
¼1
34.6
15.7
12(4.8)
21.5
12(6.0)
17.4
10(3.7)
18.8
11(3.3)
WAR,p
¼2/[(T
otalBrand
s)+1]
36.3
15.4
6(2.9)
20.5
6(1.2)
17.1
5(1.8)
18.4
5(0.8)
One-param
eter
models
Zipf-AE
37.5
15.3
4(2.0)
20.3
2(0.1)
17.0
4(1.6)
18.3
3(0.3)
Zipf-PM
36.0
15.4
8(2.9)
20.5
8(1.4)
17.2
7(2.4)
18.4
6(1.0)
Truncated
Geometric
35.9
15.7
11(4.4)
20.5
9(1.4)
17.4
12(3.9)
18.7
10(2.4)
Nine-parameter
models
(1Pa
rameter
perTotalBrand
sClass)
Zipf-AE
37.6
15.3
3(1.7)
20.3
1(–)
17.0
3(1.3)
18.2
2(0.0)
Zipf-PM
36.0
15.4
7(2.9)
20.5
7(1.3)
17.2
9(2.4)
18.4
7(1.1)
WAR
36.5
15.5
9(3.2)
20.4
5(0.9)
17.2
8(2.4)
18.4
8(1.1)
Truncated
Geometric
37.2
15.4
5(2.4)
20.3
3(0.4)
17.1
6(1.8)
18.3
4(0.5)
Hierarchicalregressions
(customer
i,productcategory
j)Lo
git(S
OW
ij)¼β 0+β 1log(Ran
k)+β 2log
(TotalBrand
s+1−
Ran
k)1Class
36.0
15.5
10(3.3)
20.7
11(2.4)
17.4
11(3.7)
19.2
12(5.5)
Logit(S
OW
ij)¼β 0+β 1Sa
tisfaction+
β 2(TotalBrand
s)1Class
27.9
16.6
14(10.4)
22.1
14(9.1)
18.7
14(11.3)
20.9
14(14.8)
Logit(S
OW
ij)¼β 0+β 1log(Ran
k)+β 2log
(TotalBrand
s+1−
Ran
k)9Classes
37.0
15.0
1(–)
20.7
10(2.2)
16.8
1(–)
18.7
9(2.3)
Logit(S
OW
ij)¼β 0+β 1Sa
tisfaction,9Classes
29.1
16.1
13(7.3)
22.0
13(8.4)
18.1
13(8.1)
20.5
13(12.6)
Notes
:There
are258,743observations
and79,543
setsof
custom
errank
ings.T
heregression
modelsusean
additio
nalh
ierarchicalp
aram
eter
forthe
additio
nalcustomer
levelstand
arderror.The
nine-class
modelsarefit
separately
tonine
groups
defin
edby
thenu
mberof
Total
Brand
s,andthey
includ
eoneadditio
nalh
ierarchicalp
aram
eter
pergroup
Table AI.Model performanceoverall and at thecustomer level interms of meanabsolute deviation(MAD) and rootmean squared error(RMSE) as percent oftotal SOW
32
JOSM26,1
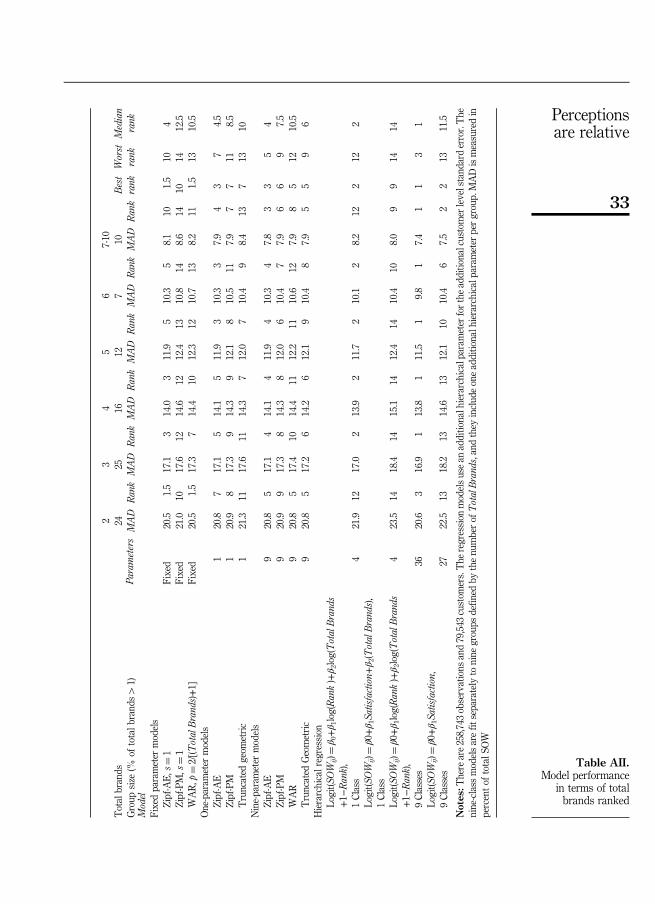
23
45
67-10
Total
brands
2425
1612
710
Best
Worst
Median
Group
size
(%of
totalb
rand
sW1)
MAD
Ran
kMAD
Ran
kMAD
Ran
kMAD
Ran
kMAD
Ran
kMAD
Ran
krank
rank
rank
Model
Parameters
Fixedparameter
models
Zipf-AE,s
¼1
Fixed
20.5
1.5
17.1
314.0
311.9
510.3
58.1
101.5
104
Zipf-PM,s
¼1
Fixed
21.0
1017.6
1214.6
1212.4
1310.8
148.6
1410
1412.5
WAR,p
¼2/[(T
otalBrand
s)+1]
Fixed
20.5
1.5
17.3
714.4
1012.3
1210.7
138.2
111.5
1310.5
One-param
eter
models
Zipf-AE
120.8
717.1
514.1
511.9
310.3
37.9
43
74.5
Zipf-PM
120.9
817.3
914.3
912.1
810.5
117.9
77
118.5
Truncated
geom
etric
121.3
1117.6
1114.3
712.0
710.4
98.4
137
1310
Nine-parameter
models
Zipf-AE
920.8
517.1
414.1
411.9
410.3
47.8
33
54
Zipf-PM
920.9
917.3
814.3
812.0
610.4
77.9
66
97.5
WAR
920.8
517.4
1014.4
1112.2
1110.6
127.9
85
1210.5
Truncated
Geometric
920.8
517.2
614.2
612.1
910.4
87.9
55
96
Hierarchicalregression
Logit(S
OW
ij)¼
β 0+β 1log(Ran
k)+β 2log(TotalBrand
s+1−
Ran
k),
421.9
1217.0
213.9
211.7
210.1
28.2
122
122
1Class
Logit(S
OW
ij)¼
β0+β 1Sa
tisfaction+
β 2(TotalBrand
s),
423.5
1418.4
1415.1
1412.4
1410.4
108.0
99
1414
1Class
Logit(S
OW
ij)¼
β0+β 1log(Ran
k)+β 2log(TotalBrand
s+1−
Ran
k),
3620.6
316.9
113.8
111.5
19.8
17.4
11
31
9Classes
Logit(S
OW
ij)¼
β0+β 1Sa
tisfaction,
2722.5
1318.2
1314.6
1312.1
1010.4
67.5
22
1311.5
9Classes
Notes
:There
are258,743observations
and79,543
custom
ers.The
regression
modelsusean
additio
nalh
ierarchicalparam
eter
fortheadditio
nalcustomer
levelstand
arderror.The
nine-class
modelsarefit
separately
tonine
groups
defin
edby
thenu
mberof
TotalBrand
s,andthey
includ
eoneadditio
nalh
ierarchicalp
aram
eter
pergroup.MADismeasuredin
percentof
totalS
OW
Table AII.Model performance
in terms of totalbrands ranked
33
Perceptionsare relative
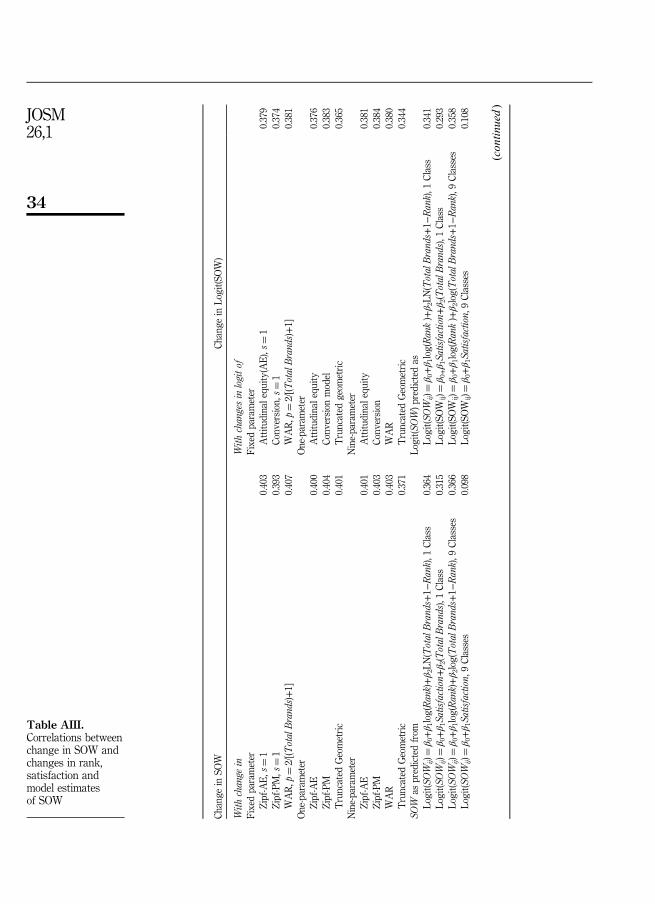
Change
inSO
WCh
ange
inLo
git(S
OW)
With
chan
gein
With
chan
gesin
logitof
Fixedparameter
Fixedparameter
Zipf-AE,s
¼1
0.403
Attitu
dinalequ
ity(AE),s¼
10.379
Zipf-PM,s
¼1
0.393
Conv
ersion,s
¼1
0.374
WAR,p
¼2/[(T
otalBrand
s)+1]
0.407
WAR,p
¼2/[(T
otalBrand
s)+1]
0.381
One-param
eter
One-param
eter
Zipf-AE
0.400
Attitu
dinalequ
ity0.376
Zipf-PM
0.404
Conv
ersion
model
0.383
Truncated
Geometric
0.401
Truncated
geom
etric
0.365
Nine-parameter
Nine-parameter
Zipf-AE
0.401
Attitu
dinalequ
ity0.381
Zipf-PM
0.403
Conv
ersion
0.384
WAR
0.403
WAR
0.380
Truncated
Geometric
0.371
Truncated
Geometric
0.344
SOW
aspredictedfrom
Logit(S
OW)p
redicted
asLo
git(S
OW
ij)¼β 0+β 1log(Ran
k)+β 2LN
(TotalBrand
s+1−
Ran
k),1
Class
0.364
Logit(S
OW
ij)¼β 0+β 1log(Ran
k)+β 2LN
(TotalBrand
s+1−
Ran
k),1
Class
0.341
Logit(S
OW
ij)¼β 0+β 1Sa
tisfaction+
β 2(TotalBrand
s),1
Class
0.315
Logit(S
OW
ij)¼β 0
+β 1Sa
tisfaction+
β 2(TotalBrand
s),1
Class
0.293
Logit(S
OW
ij)¼β 0+β 1log(Ran
k)+β 2log(TotalBrand
s+1−
Ran
k),9
Classes
0.366
Logit(S
OW
ij)¼β 0+β 1log(Ran
k)+β 2log(TotalBrand
s+1−
Ran
k),9
Classes
0.358
Logit(S
OW
ij)¼β 0+β 1Sa
tisfaction,
9Classes
0.098
Logit(S
OW
ij)¼β 0+β 1Sa
tisfaction,
9Classes
0.108
(con
tinued)
Table AIII.Correlations betweenchange in SOW andchanges in rank,satisfaction andmodel estimatesof SOW
34
JOSM26,1
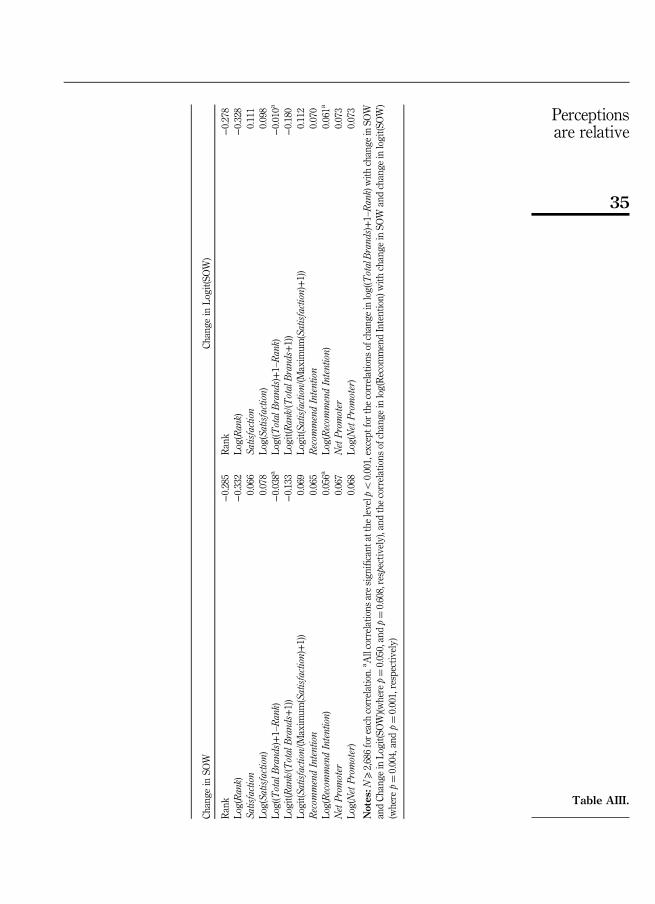
Change
inSO
WCh
ange
inLo
git(S
OW)
Rank
−0.285
Rank
−0.278
Log(Ran
k)−0.332
Log(Ran
k)−0.328
Satisfaction
0.066
Satisfaction
0.111
Log(Sa
tisfaction)
0.078
Log(Sa
tisfaction)
0.098
Log((TotalBrand
s)+1–Ran
k)−0.038a
Log((TotalBrand
s)+1–Ran
k)−0.010a
Logit(R
ank/(TotalBrand
s+1))
−0.133
Logit(R
ank/(TotalBrand
s+1))
−0.180
Logit(S
atisfaction/(M
axim
um(Satisfaction)+1))
0.069
Logit(S
atisfaction/(M
axim
um(Satisfaction)+1))
0.112
Recom
mendIntention
0.065
Recom
mendIntention
0.070
Log(Recom
mendIntention)
0.056a
Log(Recom
mendIntention)
0.061a
NetProm
oter
0.067
NetProm
oter
0.073
Log(NetProm
oter)
0.068
Log(NetProm
oter)
0.073
Notes
:N⩾2,686foreach
correlation.
a Allcorrelations
aresign
ificant
atthelevelp
o0.001,except
forthe
correlations
ofchange
inlog((TotalBrand
s)+1–Ran
k)with
change
inSO
WandCh
ange
inLo
git(S
OW)(w
here
p¼0.050,andp¼0.608,respectiv
ely),and
thecorrelations
ofchange
inlog(Recom
mendIntention)
with
change
inSO
Wandchange
inlogit(S
OW)
(where
p¼0.004,andp¼0.001,respectiv
ely)
Table AIII.
35
Perceptionsare relative
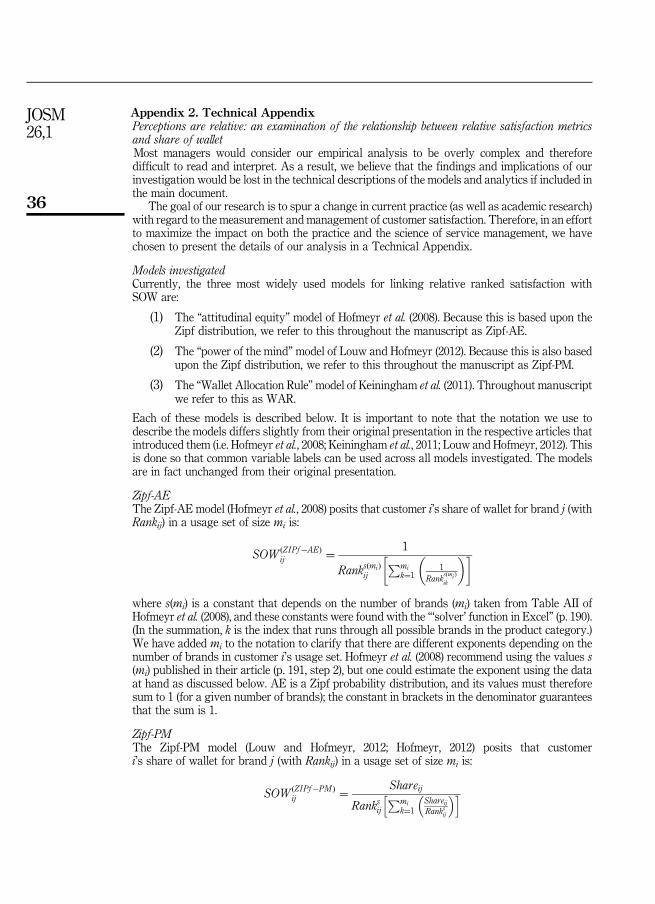
Appendix 2. Technical AppendixPerceptions are relative: an examination of the relationship between relative satisfaction metricsand share of walletMost managers would consider our empirical analysis to be overly complex and thereforedifficult to read and interpret. As a result, we believe that the findings and implications of ourinvestigation would be lost in the technical descriptions of the models and analytics if included inthe main document.
The goal of our research is to spur a change in current practice (as well as academic research)with regard to the measurement and management of customer satisfaction. Therefore, in an effortto maximize the impact on both the practice and the science of service management, we havechosen to present the details of our analysis in a Technical Appendix.
Models investigatedCurrently, the three most widely used models for linking relative ranked satisfaction withSOW are:
(1) The “attitudinal equity” model of Hofmeyr et al. (2008). Because this is based upon theZipf distribution, we refer to this throughout the manuscript as Zipf-AE.
(2) The “power of the mind” model of Louw and Hofmeyr (2012). Because this is also basedupon the Zipf distribution, we refer to this throughout the manuscript as Zipf-PM.
(3) The “Wallet Allocation Rule”model of Keiningham et al. (2011). Throughout manuscriptwe refer to this as WAR.
Each of these models is described below. It is important to note that the notation we use todescribe the models differs slightly from their original presentation in the respective articles thatintroduced them (i.e. Hofmeyr et al., 2008; Keiningham et al., 2011; Louw and Hofmeyr, 2012). Thisis done so that common variable labels can be used across all models investigated. The modelsare in fact unchanged from their original presentation.
Zipf-AEThe Zipf-AE model (Hofmeyr et al., 2008) posits that customer i’s share of wallet for brand j (withRankij) in a usage set of size mi is:
SOW ðZIPf�AEÞij ¼ 1
RanksðmiÞij
Pmik¼1
1Rank
sðmi Þik
� �� �
where s(mi) is a constant that depends on the number of brands (mi) taken from Table AII ofHofmeyr et al. (2008), and these constants were found with the “‘solver’ function in Excel” (p. 190).(In the summation, k is the index that runs through all possible brands in the product category.)We have added mi to the notation to clarify that there are different exponents depending on thenumber of brands in customer i’s usage set. Hofmeyr et al. (2008) recommend using the values s(mi) published in their article (p. 191, step 2), but one could estimate the exponent using the dataat hand as discussed below. AE is a Zipf probability distribution, and its values must thereforesum to 1 (for a given number of brands); the constant in brackets in the denominator guaranteesthat the sum is 1.
Zipf-PMThe Zipf-PM model (Louw and Hofmeyr, 2012; Hofmeyr, 2012) posits that customeri’s share of wallet for brand j (with Rankij) in a usage set of size mi is:
SOW ðZIPf�PM Þij ¼ Shareij
RanksijPmi
k¼1ShareijRanksij
� �h i
36
JOSM26,1
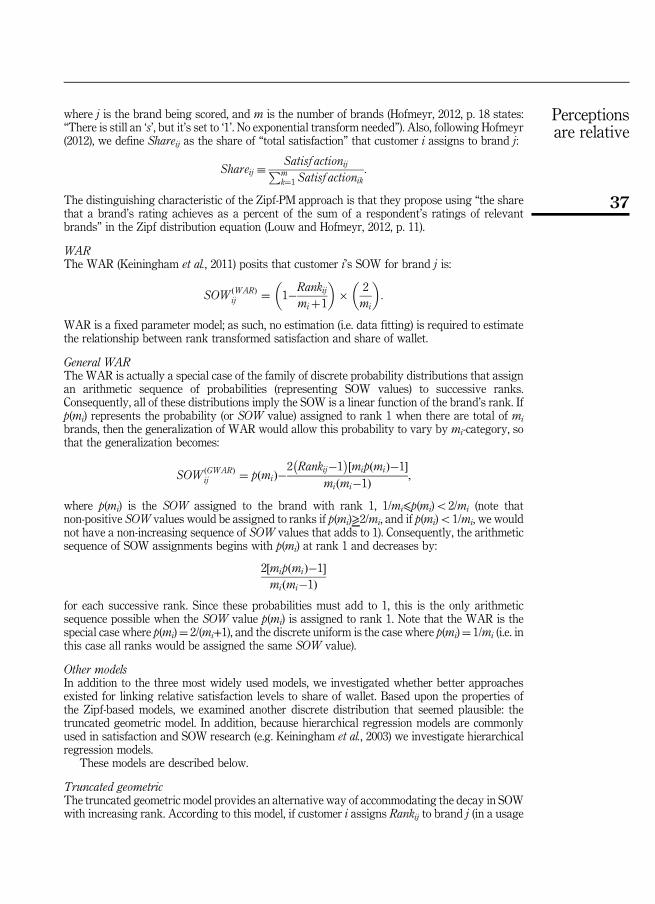
where j is the brand being scored, and m is the number of brands (Hofmeyr, 2012, p. 18 states:“There is still an ‘s’, but it’s set to ‘1’. No exponential transform needed”). Also, following Hofmeyr(2012), we define Shareij as the share of “total satisfaction” that customer i assigns to brand j:
Shareij �Satisf actionijPmk¼1 Satisf actionik
:
The distinguishing characteristic of the Zipf-PM approach is that they propose using “the sharethat a brand’s rating achieves as a percent of the sum of a respondent’s ratings of relevantbrands” in the Zipf distribution equation (Louw and Hofmeyr, 2012, p. 11).
WARThe WAR (Keiningham et al., 2011) posits that customer i’s SOW for brand j is:
SOW ðWARÞij ¼ 1�Rankij
miþ1
� �� 2
mi
� �:
WAR is a fixed parameter model; as such, no estimation (i.e. data fitting) is required to estimatethe relationship between rank transformed satisfaction and share of wallet.
General WARThe WAR is actually a special case of the family of discrete probability distributions that assignan arithmetic sequence of probabilities (representing SOW values) to successive ranks.Consequently, all of these distributions imply the SOW is a linear function of the brand’s rank. Ifp(mi) represents the probability (or SOW value) assigned to rank 1 when there are total of mibrands, then the generalization of WAR would allow this probability to vary by mi-category, sothat the generalization becomes:
SOW ðGWARÞij ¼ p mið Þ�2 Rankij�1
� mip mið Þ�1½ �
mi mi�1ð Þ ;
where p(mi) is the SOW assigned to the brand with rank 1, 1/mi⩽p(mi)o2/mi (note thatnon-positive SOW values would be assigned to ranks if p(mi)⩾2/mi, and if p(mi)o1/mi, we wouldnot have a non-increasing sequence of SOW values that adds to 1). Consequently, the arithmeticsequence of SOW assignments begins with p(mi) at rank 1 and decreases by:
2½mip mið Þ�1�miðmi�1Þ
for each successive rank. Since these probabilities must add to 1, this is the only arithmeticsequence possible when the SOW value p(mi) is assigned to rank 1. Note that the WAR is thespecial case where p(mi)¼ 2/(mi+1), and the discrete uniform is the case where p(mi)¼ 1/mi (i.e. inthis case all ranks would be assigned the same SOW value).
Other modelsIn addition to the three most widely used models, we investigated whether better approachesexisted for linking relative satisfaction levels to share of wallet. Based upon the properties ofthe Zipf-based models, we examined another discrete distribution that seemed plausible: thetruncated geometric model. In addition, because hierarchical regression models are commonlyused in satisfaction and SOW research (e.g. Keiningham et al., 2003) we investigate hierarchicalregression models.
These models are described below.
Truncated geometricThe truncated geometric model provides an alternative way of accommodating the decay in SOWwith increasing rank. According to this model, if customer i assigns Rankij to brand j (in a usage
37
Perceptionsare relative

set of mi brands), then customer i’s share of wallet for brand j is:
SOW ðGÞij ¼ pðmiÞ½1�pðmiÞ�Rankij�1
pðmiÞPmi
k¼1 ½1�pðmiÞ�k�1� �:(The denominator would be [1−(1−p(mi))
mi ] if there were no rank ties.) Here p(mi) represents the
share of wallet corresponding to the brand ranked 1 (in the untruncated case). In the one-parameter model, it is estimated across all customers, and in the nine-parameter model it isestimated separately across all customers in one of the nine usage sets (mi), as is the case with theZipf models. Following the truncated geometric paradigm, the SOW for the brand with Rankij isproportional to the probability of not finding the (Rankij–1) preferred brands, where we assumean equal failure probability (1−p(mi)) of not finding each one of the preferred brands.
Hierarchical regressionFinally, we also consider two-level regression models for SOWij, which represents customer i’sSOW for brand j when it is assigned a rank of Rankij among themi total brands in that category:
Logit SOW ðHRÞij
� �¼ f Rankij;mi
� þeiþeij;
and:
Logit SOW ðHRÞij
� �¼ f Satisf actionij;mi
� þeiþeij;
where εi represents the customer random effect and εij represents overall model error, bothof which are normally distributed with mean zero, and distinct variances. The random effect atthe customer level provides a flexible way to accommodate the natural dependence amongthe observations from one customer across brands within a product category. As models in thiscategory, we considered the best two-predictor regressions based on the total number of brands(mi) and either Rankij or Satisfactionij. (Models with more than two predictors based on thesevariables generally did not explain more than an additional 0.6 percent of the variance in SOW.)Rankij and Satisfactionij were considered directly as candidate predictors along with the logtransforms of each variable, and the logit transforms of each when it is expressed as a proportion,i.e. the logits of the proportions PR¼Rankij/(mi+1), and Ps¼ Satisfactionij /(Maximum Rating+1)(here the maximum possible satisfaction rating is 10). As candidate predictors, we alsoconsidered the components of these logit transforms: log(mi+1−Rankij ), and log(MaximumRating+1–Satisfactionij).
Parameter estimationWith the exception of the hierarchical regression models, the other models are discreteprobability distributions that automatically provide SOW estimates that sum to 1 for eachcustomer. If we group the customer observations by the number of total brands ranked (m) wecan view each set of customer ranks within m-category as an estimate of the same continuousmultinomial distribution (Johnson, 1960). This is complicated by the fact that we allow tied ranks,but it still provides a straightforward method of obtaining maximum likelihood estimates for theparameters in each of the proposed models. This approach is consistent with the hierarchicalstructure of repeated customer rankings within each brand category.
For each of the discrete-distribution models, we consider, whenever possible, three versions: apopular fixed-parameter version, a one-parameter version (where the parameter does not vary bythe total number of brands, m), and the M-parameter version where the parameter is allowed tovary by m-category. All three versions are possible for Zipf-AE and Zipf-PM. We refer to theWAR as a fixed parameter model (since in this case p(m)≡2/(m+1), so that no estimation isrequired). There is no one-parameter version of WAR (since p(m) must vary with the total numberof brands,m), and no popular (or established) fixed-parameter version of the truncated geometric.
38
JOSM26,1
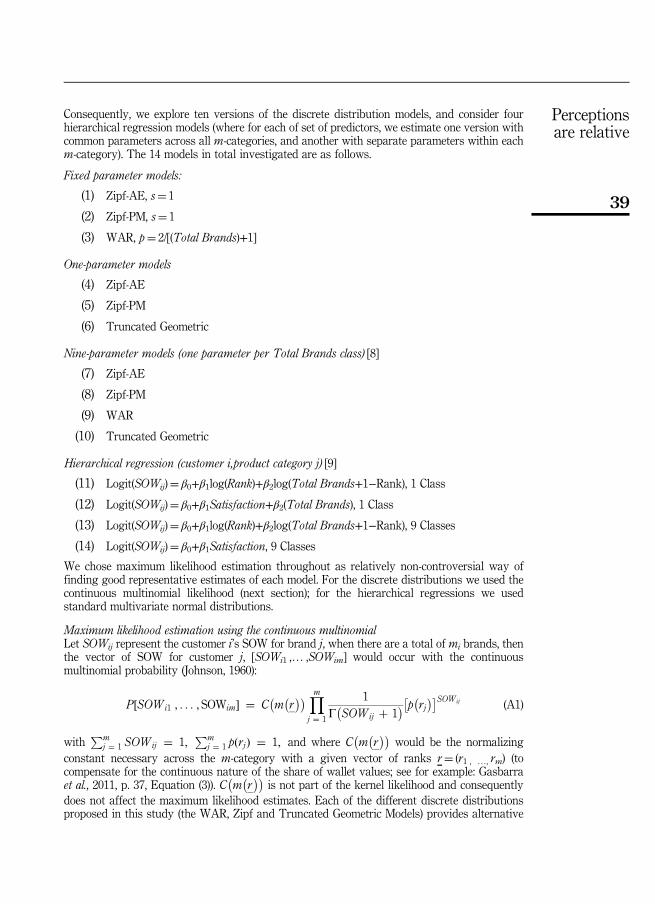
Consequently, we explore ten versions of the discrete distribution models, and consider fourhierarchical regression models (where for each of set of predictors, we estimate one version withcommon parameters across all m-categories, and another with separate parameters within eachm-category). The 14 models in total investigated are as follows.
Fixed parameter models:
(1) Zipf-AE, s¼ 1
(2) Zipf-PM, s¼ 1
(3) WAR, p¼ 2/[(Total Brands)+1]
One-parameter models
(4) Zipf-AE
(5) Zipf-PM
(6) Truncated Geometric
Nine-parameter models (one parameter per Total Brands class) [8]
(7) Zipf-AE
(8) Zipf-PM
(9) WAR
(10) Truncated Geometric
Hierarchical regression (customer i,product category j) [9]
(11) Logit(SOWij)¼ β0+β1log(Rank)+β2log(Total Brands+1−Rank), 1 Class
(12) Logit(SOWij)¼ β0+β1Satisfaction+β2(Total Brands), 1 Class
(13) Logit(SOWij)¼ β0+β1log(Rank)+β2log(Total Brands+1−Rank), 9 Classes
(14) Logit(SOWij)¼ β0+β1Satisfaction, 9 Classes
We chose maximum likelihood estimation throughout as relatively non-controversial way offinding good representative estimates of each model. For the discrete distributions we used thecontinuous multinomial likelihood (next section); for the hierarchical regressions we usedstandard multivariate normal distributions.
Maximum likelihood estimation using the continuous multinomialLet SOWij represent the customer i’s SOW for brand j, when there are a total of mi brands, thenthe vector of SOW for customer j, [SOWi1 ,… ,SOWim] would occur with the continuousmultinomial probability (Johnson, 1960):
P SOWi1 ; . . . ; SOWim½ � ¼ C m r� � Ym
j ¼ 1
1G SOWij þ 1� p rj
� �SOWij (A1)
withPm
j ¼ 1 SOWij ¼ 1;Pm
j ¼ 1 pðrjÞ ¼ 1; and where C m r� �
would be the normalizingconstant necessary across the m-category with a given vector of ranks r¼ (r1 , …, rm) (tocompensate for the continuous nature of the share of wallet values; see for example: Gasbarraet al., 2011, p. 37, Equation (3)). C m r
� � is not part of the kernel likelihood and consequently
does not affect the maximum likelihood estimates. Each of the different discrete distributionsproposed in this study (the WAR, Zipf and Truncated Geometric Models) provides alternative
39
Perceptionsare relative
models for how the rank-category probabilities {p(rk)} are determined as functions of the ranks{r}¼ {r1 ,… , rm}.
Since we must allow for tied ranks, there are more than one possible set of ranks perm-category. For example, sets of ranks {2,2,2} and {1,2,3} would be two of the four possible setsof ranks possible there are m¼ 3 brands. Let N(m(r)) represent the total number of customersthat use a particular set of ranks {r} when there are m(r) total brands. For example, N(m(2,2,2))would represent the total number of customers that use the ranks {2,2,2} to rank 3 brands, i.e.,m(2,2,2)¼ 3. Let S(rk ,m(r)) represent the sum of the customer share of wallet values for all brandswith rank rk across the total number of customers, N(m(r)), who use the specific set of ranks {r}(which includes rk ), i.e.:
Sðrk; m r� � ¼
XN m rð Þð Þ
i ¼ 1
SOWirk
Here we are summing overall customer share of wallet values SOWirk that correspond to thesame rank rk. Thus, given a specific set of ranks {r}, with L distinct ranks, the correspondingvector of the total share of wallets for each of those ranks:
S r1;m r� �
; . . . ;S rL;m r� � �
;
would also have a continuous multinomial distribution, that is:
P S r1;m r� �
; . . . ; S rL;m r� � �
¼ D r ;N ðmðrÞ� YLk ¼ 1
1G S rk;m r
� � þ 1� p rkð Þ½ �S rk ;m rð Þð Þ; (A2)
where D(r,m(r)) is the appropriate normalizing constant. Note that in those cases wherecustomers are assigning only one rank across the full set of brands (e.g. when {2,2,2} isassigned to each of 3 brands (m¼ 3)), then there is only one distinct category, L¼ 1, and thedistribution in (2) becomes an example of the degenerate multinomial case where there is onlyone category.
For a fixed number of total brands m, there can be many possible sets of ranks {r} that areused by customers (because of the different ways there can be ties), and a different multinomialdistribution for each set. The full likelihood would then be a product of all the independentlikelihoods (of the form given in (2)) across all the distinct sets of ranks {r} that are used bycustomers when m is the total number of brands ranked. For example, when m¼ 3, the fulllikelihood would be the product of four different versions of the likelihood in (2), that correspondto the four different ways of assigning ranks ({1, 2, 3}, {2, 2, 2}, {1.5, 1.5, 3}, {1,2.5,2.5}, and thenumber of distinct ranks for each set are L¼ 3, 1, 2, and 3, respectively). As the sample sizeincreases, the non-integral nature of the {S(rk, m(r))} makes very little difference, and estimatesbased on the rounded sufficient statistics (and the standard multinomial distribution) arevirtually the same as they would be using the continuous multinomial.
Application of the modelsOverall model performance (cross-sectional). Table AI shows four comparisons for each model:MAD, and RMSE across all observations and by customer.
In Table AI, the fixed-parameter versions of the discrete distribution models do remarkablywell overall. Among these distributions, the fixed-parameter Zipf-AE model is best in terms ofMAD, both overall and per customer, and it actually outperforms all models (including theregression models) in terms of average customer RMSE. The nine-parameter version ofZipf-AE is the best performer in terms of overall RMSE. Nevertheless, the discrete distributionsgenerally do quite well: eight of the other ten discrete distributions have RMSE values that are
40
JOSM26,1
within 1.5 percent of the best fit. The one exception is the fixed parameter Zipf-PM whichhas an RMSE that is 6 percent larger overall, relative to the best performing nine-parameterZipf-AE model.
The nine-class regression with log(Rank) is actually the best performing model in termsof MAD, and it is just ahead of the fixed parameter Zipf-AE with MAD values that are 1.6and 0.9 percent larger overall, and per customer, respectively. This regression model isalso uniformly the best among the four regression alternatives, but paradoxically it doesnot fit as well in terms of RMSE, where it actually achieves the 10th and 9th highest overalland per customer RMSE, respectively. Still, even in these cases its error rates are onlylarger than the lowest RMSE values by 2.2 percent overall, and 2.3 percent per customer.In contrast, the regression models based on Satisfaction are uniformly the worst models inevery case, and here the error rates are substantially larger than the best model in everyinstance. Although the 9-class version of this model is the better performer, even itserror rates range from being higher by 7.3 percent (MAD overall) to 12.6 percent (RMSEper customer).
Table AII provides a comparison of model performance by the number of total brands(m) that are considered by the customer. The fixed-parameter versions of Zipf-AE andWAR are the best in the two-product category with MAD values of 20.5 percent. WARand Zipf-AE are equivalent in this case, where each predicts SOW values of (2/3,1/3) whenthe ranks are (1,2) and values of (1/2,1/2) when ranks are tied (1.5,1.5). This is the onlycategory where the nine-class regression with log(Rank) is not the best model, and even in thetwo-category case this regression model is nearly the best with a MAD that is 20.6 percent(relative to the best MAD of 20.5 percent). Across models, the lowest MAD values decreaseby 64 percent as total brands increase across the six categories, and it ranges from 20.5percent (when m¼ 2) to 7.4 percent (when 7⩽m⩽10). The 9-parameter Zipf-AE model and thenine-class regression with log(Rank) are the best overall performers across categories, andthe Zipf-AE models are always among the top 5 models when total brands is less than seven(m⩽6). Finally the regression models based on Satisfaction are the worst models overall,in terms of median rank across categories, although the nine-class regression on Satisfactionis the second best model in the last category (7⩽m⩽10). The regression models basedon Satisfaction are uniformly the poorest performers when there are four or fewer totalbrands (m⩽4).
Overall model performance (longitudinal)Table AIII provides an analysis of the two-period data. This table summarizes the correlations ofchange in SOW and logit(SOW) with contemporaneous changes in model estimates and changesin other variables. For the eleven models that require parameter estimates (i.e. all models exceptfor three fixed-parameter models), the parameters are estimated in period 1 and those estimatesare then used to predict SOW in period 2 (using period 2 information on Rank, Total Brands, andSatisfaction).
Table AIII shows that the correlation between the two-period change in the WAR estimatesof SOW (fixed-parameter version) and actual change in SOW are nominally the largest overall(r¼ 0.407, po0.001), but nearly all of the discrete distributions perform at the same level interms of predicting change in SOW and change in logit(SOW). The weakest performing modelsare the nine-parameter truncated geometric model (for change in SOW: r¼ 0.371, po0.001) andthe regression models (for change in SOW: the largest r¼ 0.366, po0.001). Surprisingly, theone-class regression model based on Satisfaction performs better than the nine-class version.The nine-class regression based on Satisfaction is by far the worst performer overall (R2o12percent in each case).
The comparison of regression models indicates that the one-class regression on Satisfactionand Total Brands provides an alternative way of “calibrating” satisfaction relative to totalbrands, so that it is comparable (in the two-period case) to a regression on a relative measureof satisfaction (like rank). This “calibration” is not achieved by the nine-class version of the
41
Perceptionsare relative
same model because, although this category-specific estimation of the coefficient for Satisfactionprovides a better fit within category, it does not provide a single “calibration” of Satisfaction relativeto the total brands, across the nine categories.
Finally, Table AIII shows the inadequacy of changes in absolute satisfaction, recommendintention, and NPS levels in correlating to changes in share of wallet. Changes in these variablesexplain o1 percent of the variation in changes in share of wallet.
About the authorsDr Timothy Lee Keiningham is the Global Chief Strategy Officer and the Executive VicePresident at Ipsos Loyalty. He is the Author and/or Editor of eight books, his most recent beingWhy Loyalty Matters. He has received best paper awards from the Journal of Marketing (twice),the Journal of Service Research, and Managing Service Quality (twice), and has received theCitations of Excellence “Top 50” award (top 50 management papers of approximately 20,000papers reviewed) from Emerald Management Reviews. Tim also received the best revieweraward from the Journal of Service Research. Dr Timothy Lee Keiningham is the correspondingauthor and can be contacted at: [email protected]
Dr Bruce Cooil is The Dean Samuel B. and Evelyn R. Richmond Professor of Management at theOwen Graduate School of Management, Vanderbilt University. His research interests include theadaptation of grade-of-membership and latent class models for marketing and medical research,estimation of qualitative data reliability, large sample estimation theory and extreme value theory.He has also written and consulted on models for mortality, medical complications, medicalmalpractice, and automobile insurance claims. His publications have appeared in business, statisticsand medical journals, including the Journal of Marketing Research, Journal of Marketing,Psychometrika, Journal of the American Statistical Association, Annals of Probability, Circulation,and the New England Journal of Medicine.
Dr Edward C. Malthouse is the Theodore R and Annie Laurie Sills Professor of IntegratedMarketing Communications at the Northwestern University and was the Co-Editor of the Journalof Interactive Marketing between 2005 and 2011. His research interests center on mediamarketing, database marketing, advertising, new media, and integrated marketingcommunications. He is the Co-Editor of Medill on Media Engagement, and has extensivelypublished on these topics, with his work appearing in Journal of Service Research, Journal ofConsumer Psychology, Journal of Interactive Marketing, Expert Systems with Applications,Data Mining and Knowledge Discovery, IEEE Transactions on Neural Networks, Computers inChemical Engineering, Journal of Advertising, Journal of Advertising Research, Journal ofBroadcasting and Electronic Media, International Journal of Market Research, Journal of MediaBusiness Studies, International Journal of Media Management, and others.
Alexander Buoye is an Assistant Professor of Marketing at the Fordham University Schools ofBusiness in New York. Prior to joining Fordham, he was the Head of Loyalty Analytics and aSenior Vice President at Ipsos Loyalty. He is the co-recipient of the 2011 Next Gen Market ResearchDisruptive Innovator Award for his role in the discovery and development of the Wallet AllocationRule. His work has been accepted for publication in such journals asHarvard Business Review,MITSloan Management Review, Journal of Service Research, Journal of Service Management, andJournal of Business Research. He received his MA and PhD in Sociology and a Bachelor of BusinessAdministration (Marketing) from the University of Notre Dame.
Dr Lerzan Aksoy is a Professor of Marketing at the Fordham University Schools of Businessin New York. She is author and/or editor of four books, including Loyalty Myths andWhy LoyaltyMatters. She has received best paper awards from the Journal of Marketing, Journal of ServiceManagement, andManaging Service Quality (twice), and has received the Citations of Excellence“Top 50” award (top 50 management papers of approximately 20,000 papers reviewed) fromEmerald Management Reviews. She was awarded finalist for best paper in the Journal of ServiceResearch. Lerzan also received best reviewer awards from the Journal of Service Management andthe Journal of Service Research.
42
JOSM26,1
Arne De Keyser is a PhD-Candidate at the Ghent University, where he is also a Member of theCenter for Service Intelligence. His interests focus on multichannel marketing management andcustomer experience management. His research is forthcoming in Journal of Service Managementand Managing Service Quality. He won the Best Doctoral Service Paper Award at the secondPositive Marketing Conference (New York, Fordham University, 2013) and received the BestPractitioner Presentation Award at the 2013 Frontiers in Service Conference (National TaiwanUniversity).
Dr Bart Larivière is an Assistant Professor of Service Management at the Ghent University,where he is the Founder and the Executive Director of the Center for Service Intelligence.His research focuses on customer loyalty, servitization, servicescape, consumer well-being, andmultichannel management. He intensively collaborates with Belgian companies bridging the gapbetween practice and academia. His research has been published in Journal of Service Research,Journal of Service Management, Journal of Interactive Marketing, the European Journal ofOperational Research, and Expert Systems with Applications. He was finalist for best paper inJournal of Service Research, and his research won the Best Practitioner Presentation Award(twice) at the Frontiers in Service Conference.
For instructions on how to order reprints of this article, please visit our website:www.emeraldgrouppublishing.com/licensing/reprints.htmOr contact us for further details: [email protected]
43
Perceptionsare relative