study on flow regimes of high-pressure and dense-phase
TRANSCRIPT

Journal of Physics Conference Series
OPEN ACCESS
Study on flow regimes of high-pressure anddense-phase pneumatic conveyingTo cite this article Lu Peng et al 2009 J Phys Conf Ser 147 012078
View the article online for updates and enhancements
You may also likeReview of flow regime in CFB standpipeand circulation rate measurementZhao Yang Xuemin Liu Guoli Qi et al
-
Effect of properties of pulverized coal ondense phase pneumatic conveying at highpressureChen Xiao-ping Zhou Yun Liang Cai etal
-
Dense-phase pneumatically conveyed coalparticle velocity measurement usingelectrostatic probes and cross correlationalgorithmC Xu J Zhang D Yang et al
-
This content was downloaded from IP address 11920158203 on 11022022 at 0744
Study on Flow Regimes of High-pressure and Dense-phase
Pneumatic Conveying
Lu Peng Chen Xiaoping Liang Cai Pu Wenhao Zhou Yun Xu Pan Zhao Changsui
School of Energy amp Environment Southeast University Si Pailou 2 Nanjing 210096 China
seu_lupengyahoocomcn xpchenseueducn cszhaoseueducn
Abstract High-pressure and dense-phase pneumatic conveying of pulverized coal is a key technology in the field of large-scale entrained bed coal gasification Flow regime plays an important role in two-phase flow because it affects not only flow behavior and safety operation but also the reliability of practical processes Few references and experiences in high-pressure and dense-phase conveying are available especially for the flow regimes And because of the high stickiness and electrostatic attraction of pulverized coal to the pipe wall it is very difficult to make out the flow regimes in the conveying pipe by visualization method Thus quartz powder was chosen as the conveyed material to study the flow regime High-speed digital video camera was employed to photograph the flow patterns Experiments were conducted on a pilot scale experimental setup at the pressure up to 36MPa With the decrease in superficial gas velocity three distinguishable flow regimes were observed stratified flow dune flow and plug flow The characteristics of pressure traces acquired by high frequency response pressure transmitter and their EMD (Empirical Mode Decomposition) characteristics were correlated strongly with the flow regimes Combining high-speed photography and pressure signal analysis together can make the recognition of flow patterns in the high-pressure and dense-phase pneumatic conveying system more accurate The present work will lead to better understanding of the flow regime transition under high-pressure
1 INTRODUCTION High-pressure and dense-phase pneumatic conveying of pulverized coal is a vital technology in the field of large-scale entrained bed coal gasification The pneumatic conveying has been successfully used in the chemical engineering energy metallurgy and other industrial processes with advantages such as reliability flexibility of layout ease of automation low maintenance
The 6th International Symposium on Measurement Techniques for Multiphase Flows IOP PublishingJournal of Physics Conference Series 147 (2009) 012078 doi1010881742-65961471012078
ccopy 2009 IOP Publishing Ltd 1
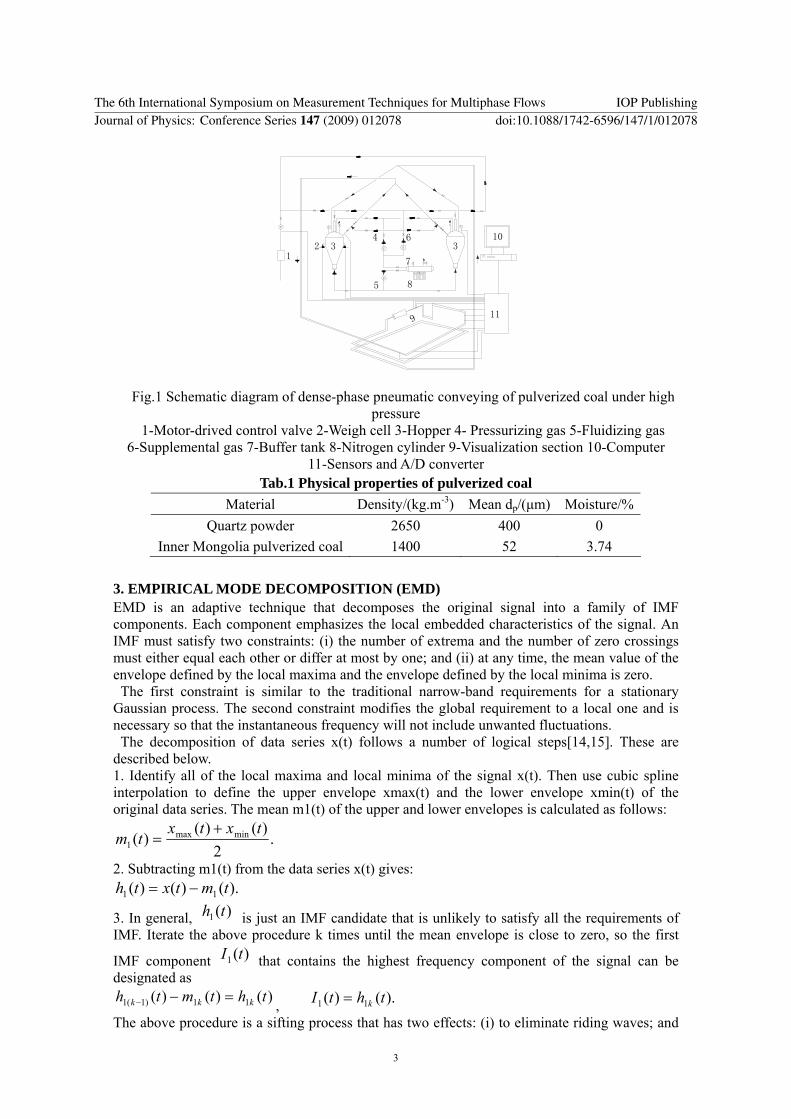
hygienic and environmental friendly In recent years numerous studies for instance experiment signal analysis and numerical simulation have been conducted on different pneumatic conveying systems Many valuable achievements on pneumatic conveying have been obtained Gong et al [1] investigated the flow characteristic of high solid loading pneumatic conveying under low pressure and obtained some fitted empirical equations Wypych [2] explored the mechanism for the formation of the unstable zone experimentally and theoretically Li [3] adopted photographic technology to measure the particle velocity and concentration profiles in the horizontal dilute-phase pneumatic conveying Masona [4] developed a two-layer model to simulate dense phase pneumatic transport of fine powders and the model showed good quantitative agreement with experimentally determined pressure profiles for fully developed flows in straight horizontal pipes Laouar [56]rsquos aims were to characterize the differential pressure in dense-phase pneumatic conveying line at a very low velocity and a general differential pressure law was obtained which proves to be independent of both flow regimes and pipe diameter However the above achievements are mainly about the low pressure pneumatic conveying [1-10] At present the large-scale coal gasification technology is gaining attention and developed and dense-phase pneumatic conveying of pulverized coal under high pressure is one of its key technologies [11-12] Few references and experiences in high-pressure and dense-phase conveying are available especially for the flow regimes EMD is capable of extracting all the oscillatory modes present in signal Each extracted mode is referred to as an Intrinsic Mode Function (IMF) which has a unique local characteristic EMD has been widely applied in recent years in the fields of meteorology ocean engineering earthquake studies etc HDing et al has used the method for characterization of gas-liquid two-phase flow and achieved satisfactory results [13] This paper is devoted to flow regime visualization and pressure signal analysis of solid-gas flow in high-pressure and dense-phase pneumatic conveying 2 EXPERIMENTAL APPARATUS The pressurized experimental facility is shown schematically in Fig1 High pressure nitrogen from the buffer tank is divided into pressurizing gas fluidizing gas and supplement gas The feeding hopper adopts the bottom-fluidization and top-discharge arrangement Pulverized coal in the feeding hopper is fluidized by fluidizing gas and enters the conveying pipeline through the accelerating segment Supplement gas is introduced at the outlet of the feeding hopper to enhance the conveying ability Pressurizing gas is used to keep pressure constant in the feeding hopper The pressure of the receiving hopper is controlled by the motor-drive control valve Both the feeding hopper and the receiving hopper have capacity of 0648m3 The conveying pipeline is stainless steel tube with an inside diameter of 10mm and a length of 53m The gas volume rates are measured by the metal tube rotary flow meters and solid mass in hopper is measured by the weight cells Pressure and differential pressure are measured by the semiconductor pressure transducers with frequency response of 200Hz and precision of 03 Signals of differential pressure pressure weight and gas volume flow rate are acquired by a multi-channel sampling system and sent to a computer through an AD converter Physical properties of conveyed materials are listed in Tab1
The 6th International Symposium on Measurement Techniques for Multiphase Flows IOP PublishingJournal of Physics Conference Series 147 (2009) 012078 doi1010881742-65961471012078
2
11
13 32
7
85
F P
4 6
P
F
9
FF
P
10
Fig1 Schematic diagram of dense-phase pneumatic conveying of pulverized coal under high
pressure 1-Motor-drived control valve 2-Weigh cell 3-Hopper 4- Pressurizing gas 5-Fluidizing gas
6-Supplemental gas 7-Buffer tank 8-Nitrogen cylinder 9-Visualization section 10-Computer 11-Sensors and AD converter
Tab1 Physical properties of pulverized coal Material Density(kgm-3) Mean dp(μm) Moisture
Quartz powder 2650 400 0 Inner Mongolia pulverized coal 1400 52 374
3 EMPIRICAL MODE DECOMPOSITION (EMD) EMD is an adaptive technique that decomposes the original signal into a family of IMF components Each component emphasizes the local embedded characteristics of the signal An IMF must satisfy two constraints (i) the number of extrema and the number of zero crossings must either equal each other or differ at most by one and (ii) at any time the mean value of the envelope defined by the local maxima and the envelope defined by the local minima is zero The first constraint is similar to the traditional narrow-band requirements for a stationary Gaussian process The second constraint modifies the global requirement to a local one and is necessary so that the instantaneous frequency will not include unwanted fluctuations The decomposition of data series x(t) follows a number of logical steps[1415] These are described below 1 Identify all of the local maxima and local minima of the signal x(t) Then use cubic spline interpolation to define the upper envelope xmax(t) and the lower envelope xmin(t) of the original data series The mean m1(t) of the upper and lower envelopes is calculated as follows
2
)()()( minmax
1txtx
tm+
=
2 Subtracting m1(t) from the data series x(t) gives )()()( 11 tmtxth minus=
3 In general is just an IMF candidate that is unlikely to satisfy all the requirements of IMF Iterate the above procedure k times until the mean envelope is close to zero so the first
IMF component that contains the highest frequency component of the signal can be designated as
)(1 th
)(1 tI
)()()( 11)1(1 thtmth kkk =minusminus )()( 11 thtI k= The above procedure is a sifting process that has two effects (i) to eliminate riding waves and
The 6th International Symposium on Measurement Techniques for Multiphase Flows IOP PublishingJournal of Physics Conference Series 147 (2009) 012078 doi1010881742-65961471012078
3
(ii) to smooth uneven amplitude In order to avoid obliterating the physically meaningful amplitude fluctuations a stop criterion for the sifting process is defined [16]
sum= minus
minus
⎥⎥
⎦
⎤
⎢⎢
⎣
⎡ minus=
T
t k
kk
th
ththSD
02
)1(1
2
1)1(1
)(
)()((
4 Separate from the rest of the data series The residue is treated as the new data series
)(1 tI )(1 tr
)()()( 11 tItxtr minus= Since the residue still contains much information from lower frequency components it is subjected to the same sifting process Repeat the above procedure on the subsequent residual
until the range of the residue is below a predetermined value or the residue contains the lowest frequency component and the result is
)(1 tr
)(trj
)()()()()()( 1221 trtItrtrtItr nnn =minus=minus minus where denotes the trend of the signal from which no more IMF can be extracted and is the nth IMF Each IMF contains lower frequency components than the one extracted just
before At the end of the EMD procedure the signal can be exactly reconstructed using a linear combination
)(trn nI
)(tx
)()()(1
trtItx n
n
ii += sum
=
4 RESULTS AND DISCUSSION 41 Photos and pressure traces Because of the high stickiness and electrostatic attraction of pulverized coal to the pipe wall it is very difficult to make out the flow regimes in the conveying pipe through visualization method So quartz powder with average diameter of 400μm and density of 2650kgm3 was adopted as the substitute conveyed material to study the flow regime High-speed digital video camera (125fps 4096picsrun) was employed to photograph the flow patterns Length of visualization section is 016m and interior diameter is 10mm Fig2 depicts that flow regime transits from stratified flow to plug flow as superficial gas velocity diminishes under the basic condition (P=36MPa PT=08MPa) When superficial gas
velocity is relatively high a suspended phase and a settled layer of material are generally observed With decrease in superficial gas velocity dunes or clusters can be seen riding on a settled layer of material At further lower gas velocity the material may flow as discreet or as a packed bed The characteristics of pressure traces acquired by high frequency response pressure sensor were correlated closely with the flow regimes When superficial gas velocity was relatively high flow pattern was stratified flow and pressure signal fluctuated more quickly than that of the other flow regimes As superficial gas velocity diminished flow pattern transited to slug flow and pressure signal fluctuated like sine wave Further decrease in superficial gas velocity yielded plug flow meanwhile sine-like pressure signal fluctuated with further lower frequency and higher amplitude 42 EMD characteristics of pressure fluctuation signals with quartz 421 IMF components As presented above pressure signal traces of different flow regimes show distinguishable characteristics In order to investigate the characteristics of pressure more deeply EMD analysis
The 6th International Symposium on Measurement Techniques for Multiphase Flows IOP PublishingJournal of Physics Conference Series 147 (2009) 012078 doi1010881742-65961471012078
4
Flow Direction
t=0s t=0016s
t=0032s t=0048s
0 2000 4000 6000 8000 10000 12000 14000 16000 18000314
315
316
317
318
319
N
PM
Pa
(a) Vg=94ms μ=101kgm3 Stratified flow
t=0s t=0016s
t=0032s t=0048s
0 2000 4000 6000 8000 10000 12000 14000 16000 1800028
3
32
34
36
38
N
PM
Pa
(b) Vg=56ms μ=146kgm3 Dune speed 15~2ms
t=0016s
t=0048s
t=0s
t=0032s
0 2000 4000 6000 8000 10000 12000 14000 16000 1800026
28
3
32
34
36
N
PM
Pa
(c) Vg=17ms μ=348kgm3 Plug speed 08~1ms
Fig2 Visualizatio rent superficial gas
was employed on the pressure signals Fig3 shows side by side the IMF components of the
n photos of flow regimes and pressure traces at diffevelocity
pressure fluctuation signal IMFs have different local frequencies The EMD method picks out the highest frequency component present in the signal Thus each IMF component that contains a lower frequency than the preceding one extracted is presented in turn The smaller scales
The 6th International Symposium on Measurement Techniques for Multiphase Flows IOP PublishingJournal of Physics Conference Series 147 (2009) 012078 doi1010881742-65961471012078
5
represent the high-frequency information in the signal and the larger scales represent the low-frequency information in the signal
316318
sign
al
Empirical Mode Decomposition
323436
sign
al
Empirical Mode Decomposition
-0010
001
imf1
-0020
002
imf2
-0050
005
imf3
-010
01
imf4
-020
02
imf5
-020
02
imf6
-010
01
imf7
-010
01
imf8
0 2000 4000 6000 8000 10000 12000 14000 16000 18000-01
001
imf9
-505
x 10-3
imf1
-505
x 10-3
imf2
-505
x 10-3
imf3
-202
x 10-3
imf4
-202
x 10-3
imf5
-202
x 10-3
imf6
-202
x 10-3
imf7
-505
x 10-3
imf8
0 2000 4000 6000 8000 10000 12000 14000 16000 18000-505
x 10-3
imf9
(a) IMF components (dilute stratified flow) (b) IMF components (dune flow)
3
35
sign
al
Empirical Mode Decomposition
001
-001
imf1 0
002
-002
imf2 0
005
-005
imf3 0
01
-01
imf4 0
01
-01
imf5 0
02
-02
imf6 0
01
-01
imf7 0
01
-01
imf8 0
02
0 2000 4000 6000 8000 10000 12000 14000 16000 18000-02
0
imf9
(c) IMF components (plug flow)
Fig3 IMF componen f different flow pattern 422 Ener
In this study the energy distribution Hj of different frequency bands is defined a
ts of pressure fluctuation signal ogy distribution of IMF
s EE
H jj =
(j
gy of the
energy each frequency band of local energy and the energy
gy distribution of the signal taken and literature published the IMF
= 1 2 3) where jE (measured by Standard Deviation) stands for the local ener different frequency bands (j=1 denotes the high-frequency band j=2 the middle-frequency band and j=3 the low-frequency band) and E is the total energy(measured by Standard Deviation also) The energy distribution Hj is selected as the characteristics of the pressure fluctuation signal In this study a number of logical steps were followed (1) Acquire the pressure fluctuation signal (2) Apply EMD to the signal (3) Calculate the total signaldistribution (4) Determine the enerAs per the extensive experimental work undercomponents are divided into three frequency bands in terms of their inherent frequencies for quantitative analysis of the energy distribution high-frequency band H1 with IMF components of IMF1 IMF 2 and IMF 3 middle-frequency band H2 with IMF components of IMF 4 IMF 5 and IMF 6 and low-frequency band H3 with IMF components of IMF 7 and IMF 8 E1 represents the total energy of IMF 1 IMF 2 and IMF 3 E2 is the sum of the energy of IMF 4 IMF 5 and IMF 6 and E3 is the total energy of IMF7 and IMF8 Tab2 summarizes the variations of energy characteristics Hj with flow pattern
The 6th International Symposium on Measurement Techniques for Multiphase Flows IOP PublishingJournal of Physics Conference Series 147 (2009) 012078 doi1010881742-65961471012078
6
Tab 2 Conveying condition and energy distribution with quartz eristics Hj ()Energy charactP (MPa) ΔPT (MPa) μ (kgm3) Vg (ms) Flow pattern
H1 H2 H3 101 94 Stratified flow 5 1 4 469 261 269146 56 Dune flow 479 5523 3998 36 28 348 17 Plug flow 314 5485 4202
ab2 illustrates the variation of energy distribution in different frequency bands With
characteristic Hj changes with the flow pattern and can
3 Energy distribution of IMF with pulverized coal 2μm was conveyed in the experimental
aracteristic Hj with the deceasing gas velocity was
tion method three flow patterns can be classified
Tab 3 Conveying condition and energy distribution with pulverized coal
Tdecreasing gas velocity the flow pattern of solid-gas flow is continually changing and the energy characteristics Hj changes too According to Table2 I1 I2 and I3 carry almost half of the embedded energy for the dilute stratified flow In the case of dune flow the energy diverts from the high-frequency band to the lower-frequency band Consequently the ratio of energy embedded in the high-frequency band decreases dramatically and the ratio of energy embedded in the middle and low-frequency band increases As for plug flow the ratio of energy embedded in the high-frequency band decreases further and the ratio of energy embedded in the low-frequency band increases slightly The above results imply that the energytherefore be regarded as an indicator for the identification of the flow pattern of high-pressure and dense-phase solid-gas flow The result also demonstrates that EMD is suitable for analyzing the pressure fluctuation signal However it has to be pointed out that Hj changes from dune flow to plug flow not as evidently as from stratified flow to dune flow 4Inner Mongolia pulverized coal with mean diameter of 5facility Conveying condition is shown in Tab3 Because of the high stickiness and electrostatic attraction of pulverized coal to the pipe wall it is very difficult to recognize the flow regimes in the conveying pipe through visualization method Itrsquos also unclear and impossible to identify the flow pattern through the pressure signal trace alone Through the preceding results EMD is considered as an effective method to analyze the pressure fluctuation signal in order to identify the flow regime in the pipeline indirectly Similar varying tendency of the energy chfound With decreasing gas velocity the energy characteristics Hj changes obviously According to Tab3 H1 carry more than 70 of the embedded energy at the relatively high Vg which is 111ms When Vg changes from 62ms to 102ms the energy diverts from the high-frequency band to the lower-frequency band Consequently the ratio of energy embedded in the high-frequency band decreases to about 60 and the ratio of energy embedded in the middle and low-frequency band increases Further decreasing Vg to 41ms or below the ratio of energy embedded in the high-frequency band decreases and the ratio of energy embedded in the low-frequency band increases significantly As a result though impossible by visualizaapproximately according to the energy characteristics Hj when conveying pulverized coal
Energy characteristics Hj () P (MPa)
ΔPT (MPa) μ (kgm3) Vg (ms) H1 H2 H3
102 111 7 4 9 701 150 147126 102 5628 1152 3220 166 9 5860 1171 2969 213 79 34 04 6185 1300 2515 309 62 6117 1601 2281 531 41 2860 1451 5689
The 6th International Symposium on Measurement Techniques for Multiphase Flows IOP PublishingJournal of Physics Conference Series 147 (2009) 012078 doi1010881742-65961471012078
7
5 CONCLUSIONS ble flow regimes dilute stratified flow dune flow and plug flow were
the characteristics of pressure traces acquired by high
deeply EMD has been applied in
identify the flow pattern through the pressure signal
CKNOWLEDGMENT supported by the National Key Basic Research Program of China
OMENCLATURE ocity [mmiddots-1]
solid-gas ratio [kgmiddotm-3]
ending pressure (pressure in the sending hopper) [MPa]
PT total conveying differential pressure [MPa]
EFERENCES and et al (2006) ldquoHigh solids loading pneumatic conveying of pulverized
W Wypych and J Yi(2003) ldquoMinimum transport boundary for horizontal dense-phase
Li and Y Tomita(2000) ldquoParticle velocity and concentration characteristics in a horizontal
J Masona A Lev(2001) ldquoA model for non-suspension gas-solids flow of fine powders in
Laouar Y Molodtsof (1998)rdquoExperimental drop in dense phase pneumatic transport at very
Molerus(1996) ldquoOverview pneumatic transport of solidsrdquo Powder technology Vol88
(1) Three distinguishaobserved visually when conveying quartz powder under high-pressure and dense-phase pneumatic conveying (2) When conveying quartz powderfrequency response pressure transmitter were correlated closely with the flow regimes When superficial gas velocity was relatively high flow pattern was dilute stratified flow and pressure signal fluctuated more quickly than that of the other flow regimes As superficial gas velocity diminished flow pattern transited to dune flow and pressure signal fluctuated like sine wave Further decrease in superficial gas velocity yielded plug flow meanwhile sine-like pressure signal fluctuated with lower frequency and higher amplitude (3) In order to investigate the characteristics of pressure morethe analysis of a pressure fluctuation signal Results have demonstrated that the extracted energy characteristics reflect the energy shift with the variation of flow pattern The energy characteristic Hj changes with the flow regimes and can therefore be regarded as an indicator for the identification of the flow regimes (4) Itrsquos unclear and almost impossible to trace alone Using EMD analysis on the pressure signal the flow regime in the pipeline can be identified indirectly AThis work was financially (No 2004CB217702) NVg superficial gas vel μ P ∆ RX Gong X Guocoalrdquo Journal of Chemical Industry and Engineering (china)Vol57 pp640-644 Ppneumatic conveying of granular materialsrdquo Powder technology Vol129 pp111-121 Hdilute swirling flow pneumatic conveyingrdquopowder technology Vol107 pp144-152 Dpipesrdquo International Journal of Multiphase Flow Vol27 pp415-435 Slow velocity ldquoPowder Technology Vol95 pp165-173 Opp309-321
The 6th International Symposium on Measurement Techniques for Multiphase Flows IOP PublishingJournal of Physics Conference Series 147 (2009) 012078 doi1010881742-65961471012078
8
Pavol Rajniak Kumar Dhanasekharan Csaba Sinka et al(2008) ldquoModeling and measurement
antiago Laiacuten Martin Sommerfeld (2008) ldquoEulerLagrange computations of pneumatic
J Azzopardi K Jackson JP Robinson et al (2008) ldquoFluctuations in dense phase pneumatic
A Woods RB Thorpe SE Johnson (2008) ldquoHorizontal pneumatic conveying from a
Shen and Y Xiong (2005) ldquoExperimental study on dense-phase pneumatic conveying of
hen Xiaoping Fan Chunlei Liang Cai et al (2006) ldquoInvestigation on Characteristics of
ao Ding Zhiyao Huang Zhihuan Song et al (2007) ldquoHilbert-Huang transform based signal
ouzid A Ellouze N (2004) ldquoEmpirica mode decompostion of voiced speech signalrdquo In First
landrin P Rilling G Goncalves P (2004) ldquoEmpirical mode decompostion as a filter bankrdquo
uang NE Shen Z Long SR (1999) ldquoA new view of nonliner water waves The Hilbert
of granule attrition during pneumatic conveying in a laboratory scale systemrdquoPowder Technology 185(3) pp202-210 Sconveying in a horizontal channel with different wall roughnessrdquo Powder Technology 184(1) pp76-88 Bconveying of pulverised coal measured using electrical capacitance tomographyrdquo Chemical Engineering Science 63(9)pp2548-2558 Jfluidized bedrdquo Chemical Engineering Science 63(7) pp1741-1760 Xpulverized coal at high pressuresrdquo Proceedings of the CSEE Vol25 pp103-107 CPulverized Coal Dense-phase Pneumatic Conveying under High PressurerdquoKorean Journal of Chemical Engineering 24(3) pp499-502 Hanalysis for the characterization of gas-liquid two-phase flowrdquoFlow Measurement and Instrumentation 18 pp37-46 Binternational symposium on control communications and signal processing pp603-606 FIEEE Signal Prcocessing Letters 11(2) pp112-114 HsprectrumrdquoAnnual Review of Fluid Mechanis 31 pp417-457
The 6th International Symposium on Measurement Techniques for Multiphase Flows IOP PublishingJournal of Physics Conference Series 147 (2009) 012078 doi1010881742-65961471012078
9
Study on Flow Regimes of High-pressure and Dense-phase
Pneumatic Conveying
Lu Peng Chen Xiaoping Liang Cai Pu Wenhao Zhou Yun Xu Pan Zhao Changsui
School of Energy amp Environment Southeast University Si Pailou 2 Nanjing 210096 China
seu_lupengyahoocomcn xpchenseueducn cszhaoseueducn
Abstract High-pressure and dense-phase pneumatic conveying of pulverized coal is a key technology in the field of large-scale entrained bed coal gasification Flow regime plays an important role in two-phase flow because it affects not only flow behavior and safety operation but also the reliability of practical processes Few references and experiences in high-pressure and dense-phase conveying are available especially for the flow regimes And because of the high stickiness and electrostatic attraction of pulverized coal to the pipe wall it is very difficult to make out the flow regimes in the conveying pipe by visualization method Thus quartz powder was chosen as the conveyed material to study the flow regime High-speed digital video camera was employed to photograph the flow patterns Experiments were conducted on a pilot scale experimental setup at the pressure up to 36MPa With the decrease in superficial gas velocity three distinguishable flow regimes were observed stratified flow dune flow and plug flow The characteristics of pressure traces acquired by high frequency response pressure transmitter and their EMD (Empirical Mode Decomposition) characteristics were correlated strongly with the flow regimes Combining high-speed photography and pressure signal analysis together can make the recognition of flow patterns in the high-pressure and dense-phase pneumatic conveying system more accurate The present work will lead to better understanding of the flow regime transition under high-pressure
1 INTRODUCTION High-pressure and dense-phase pneumatic conveying of pulverized coal is a vital technology in the field of large-scale entrained bed coal gasification The pneumatic conveying has been successfully used in the chemical engineering energy metallurgy and other industrial processes with advantages such as reliability flexibility of layout ease of automation low maintenance
The 6th International Symposium on Measurement Techniques for Multiphase Flows IOP PublishingJournal of Physics Conference Series 147 (2009) 012078 doi1010881742-65961471012078
ccopy 2009 IOP Publishing Ltd 1
hygienic and environmental friendly In recent years numerous studies for instance experiment signal analysis and numerical simulation have been conducted on different pneumatic conveying systems Many valuable achievements on pneumatic conveying have been obtained Gong et al [1] investigated the flow characteristic of high solid loading pneumatic conveying under low pressure and obtained some fitted empirical equations Wypych [2] explored the mechanism for the formation of the unstable zone experimentally and theoretically Li [3] adopted photographic technology to measure the particle velocity and concentration profiles in the horizontal dilute-phase pneumatic conveying Masona [4] developed a two-layer model to simulate dense phase pneumatic transport of fine powders and the model showed good quantitative agreement with experimentally determined pressure profiles for fully developed flows in straight horizontal pipes Laouar [56]rsquos aims were to characterize the differential pressure in dense-phase pneumatic conveying line at a very low velocity and a general differential pressure law was obtained which proves to be independent of both flow regimes and pipe diameter However the above achievements are mainly about the low pressure pneumatic conveying [1-10] At present the large-scale coal gasification technology is gaining attention and developed and dense-phase pneumatic conveying of pulverized coal under high pressure is one of its key technologies [11-12] Few references and experiences in high-pressure and dense-phase conveying are available especially for the flow regimes EMD is capable of extracting all the oscillatory modes present in signal Each extracted mode is referred to as an Intrinsic Mode Function (IMF) which has a unique local characteristic EMD has been widely applied in recent years in the fields of meteorology ocean engineering earthquake studies etc HDing et al has used the method for characterization of gas-liquid two-phase flow and achieved satisfactory results [13] This paper is devoted to flow regime visualization and pressure signal analysis of solid-gas flow in high-pressure and dense-phase pneumatic conveying 2 EXPERIMENTAL APPARATUS The pressurized experimental facility is shown schematically in Fig1 High pressure nitrogen from the buffer tank is divided into pressurizing gas fluidizing gas and supplement gas The feeding hopper adopts the bottom-fluidization and top-discharge arrangement Pulverized coal in the feeding hopper is fluidized by fluidizing gas and enters the conveying pipeline through the accelerating segment Supplement gas is introduced at the outlet of the feeding hopper to enhance the conveying ability Pressurizing gas is used to keep pressure constant in the feeding hopper The pressure of the receiving hopper is controlled by the motor-drive control valve Both the feeding hopper and the receiving hopper have capacity of 0648m3 The conveying pipeline is stainless steel tube with an inside diameter of 10mm and a length of 53m The gas volume rates are measured by the metal tube rotary flow meters and solid mass in hopper is measured by the weight cells Pressure and differential pressure are measured by the semiconductor pressure transducers with frequency response of 200Hz and precision of 03 Signals of differential pressure pressure weight and gas volume flow rate are acquired by a multi-channel sampling system and sent to a computer through an AD converter Physical properties of conveyed materials are listed in Tab1
The 6th International Symposium on Measurement Techniques for Multiphase Flows IOP PublishingJournal of Physics Conference Series 147 (2009) 012078 doi1010881742-65961471012078
2
11
13 32
7
85
F P
4 6
P
F
9
FF
P
10
Fig1 Schematic diagram of dense-phase pneumatic conveying of pulverized coal under high
pressure 1-Motor-drived control valve 2-Weigh cell 3-Hopper 4- Pressurizing gas 5-Fluidizing gas
6-Supplemental gas 7-Buffer tank 8-Nitrogen cylinder 9-Visualization section 10-Computer 11-Sensors and AD converter
Tab1 Physical properties of pulverized coal Material Density(kgm-3) Mean dp(μm) Moisture
Quartz powder 2650 400 0 Inner Mongolia pulverized coal 1400 52 374
3 EMPIRICAL MODE DECOMPOSITION (EMD) EMD is an adaptive technique that decomposes the original signal into a family of IMF components Each component emphasizes the local embedded characteristics of the signal An IMF must satisfy two constraints (i) the number of extrema and the number of zero crossings must either equal each other or differ at most by one and (ii) at any time the mean value of the envelope defined by the local maxima and the envelope defined by the local minima is zero The first constraint is similar to the traditional narrow-band requirements for a stationary Gaussian process The second constraint modifies the global requirement to a local one and is necessary so that the instantaneous frequency will not include unwanted fluctuations The decomposition of data series x(t) follows a number of logical steps[1415] These are described below 1 Identify all of the local maxima and local minima of the signal x(t) Then use cubic spline interpolation to define the upper envelope xmax(t) and the lower envelope xmin(t) of the original data series The mean m1(t) of the upper and lower envelopes is calculated as follows
2
)()()( minmax
1txtx
tm+
=
2 Subtracting m1(t) from the data series x(t) gives )()()( 11 tmtxth minus=
3 In general is just an IMF candidate that is unlikely to satisfy all the requirements of IMF Iterate the above procedure k times until the mean envelope is close to zero so the first
IMF component that contains the highest frequency component of the signal can be designated as
)(1 th
)(1 tI
)()()( 11)1(1 thtmth kkk =minusminus )()( 11 thtI k= The above procedure is a sifting process that has two effects (i) to eliminate riding waves and
The 6th International Symposium on Measurement Techniques for Multiphase Flows IOP PublishingJournal of Physics Conference Series 147 (2009) 012078 doi1010881742-65961471012078
3
(ii) to smooth uneven amplitude In order to avoid obliterating the physically meaningful amplitude fluctuations a stop criterion for the sifting process is defined [16]
sum= minus
minus
⎥⎥
⎦
⎤
⎢⎢
⎣
⎡ minus=
T
t k
kk
th
ththSD
02
)1(1
2
1)1(1
)(
)()((
4 Separate from the rest of the data series The residue is treated as the new data series
)(1 tI )(1 tr
)()()( 11 tItxtr minus= Since the residue still contains much information from lower frequency components it is subjected to the same sifting process Repeat the above procedure on the subsequent residual
until the range of the residue is below a predetermined value or the residue contains the lowest frequency component and the result is
)(1 tr
)(trj
)()()()()()( 1221 trtItrtrtItr nnn =minus=minus minus where denotes the trend of the signal from which no more IMF can be extracted and is the nth IMF Each IMF contains lower frequency components than the one extracted just
before At the end of the EMD procedure the signal can be exactly reconstructed using a linear combination
)(trn nI
)(tx
)()()(1
trtItx n
n
ii += sum
=
4 RESULTS AND DISCUSSION 41 Photos and pressure traces Because of the high stickiness and electrostatic attraction of pulverized coal to the pipe wall it is very difficult to make out the flow regimes in the conveying pipe through visualization method So quartz powder with average diameter of 400μm and density of 2650kgm3 was adopted as the substitute conveyed material to study the flow regime High-speed digital video camera (125fps 4096picsrun) was employed to photograph the flow patterns Length of visualization section is 016m and interior diameter is 10mm Fig2 depicts that flow regime transits from stratified flow to plug flow as superficial gas velocity diminishes under the basic condition (P=36MPa PT=08MPa) When superficial gas
velocity is relatively high a suspended phase and a settled layer of material are generally observed With decrease in superficial gas velocity dunes or clusters can be seen riding on a settled layer of material At further lower gas velocity the material may flow as discreet or as a packed bed The characteristics of pressure traces acquired by high frequency response pressure sensor were correlated closely with the flow regimes When superficial gas velocity was relatively high flow pattern was stratified flow and pressure signal fluctuated more quickly than that of the other flow regimes As superficial gas velocity diminished flow pattern transited to slug flow and pressure signal fluctuated like sine wave Further decrease in superficial gas velocity yielded plug flow meanwhile sine-like pressure signal fluctuated with further lower frequency and higher amplitude 42 EMD characteristics of pressure fluctuation signals with quartz 421 IMF components As presented above pressure signal traces of different flow regimes show distinguishable characteristics In order to investigate the characteristics of pressure more deeply EMD analysis
The 6th International Symposium on Measurement Techniques for Multiphase Flows IOP PublishingJournal of Physics Conference Series 147 (2009) 012078 doi1010881742-65961471012078
4
Flow Direction
t=0s t=0016s
t=0032s t=0048s
0 2000 4000 6000 8000 10000 12000 14000 16000 18000314
315
316
317
318
319
N
PM
Pa
(a) Vg=94ms μ=101kgm3 Stratified flow
t=0s t=0016s
t=0032s t=0048s
0 2000 4000 6000 8000 10000 12000 14000 16000 1800028
3
32
34
36
38
N
PM
Pa
(b) Vg=56ms μ=146kgm3 Dune speed 15~2ms
t=0016s
t=0048s
t=0s
t=0032s
0 2000 4000 6000 8000 10000 12000 14000 16000 1800026
28
3
32
34
36
N
PM
Pa
(c) Vg=17ms μ=348kgm3 Plug speed 08~1ms
Fig2 Visualizatio rent superficial gas
was employed on the pressure signals Fig3 shows side by side the IMF components of the
n photos of flow regimes and pressure traces at diffevelocity
pressure fluctuation signal IMFs have different local frequencies The EMD method picks out the highest frequency component present in the signal Thus each IMF component that contains a lower frequency than the preceding one extracted is presented in turn The smaller scales
The 6th International Symposium on Measurement Techniques for Multiphase Flows IOP PublishingJournal of Physics Conference Series 147 (2009) 012078 doi1010881742-65961471012078
5
represent the high-frequency information in the signal and the larger scales represent the low-frequency information in the signal
316318
sign
al
Empirical Mode Decomposition
323436
sign
al
Empirical Mode Decomposition
-0010
001
imf1
-0020
002
imf2
-0050
005
imf3
-010
01
imf4
-020
02
imf5
-020
02
imf6
-010
01
imf7
-010
01
imf8
0 2000 4000 6000 8000 10000 12000 14000 16000 18000-01
001
imf9
-505
x 10-3
imf1
-505
x 10-3
imf2
-505
x 10-3
imf3
-202
x 10-3
imf4
-202
x 10-3
imf5
-202
x 10-3
imf6
-202
x 10-3
imf7
-505
x 10-3
imf8
0 2000 4000 6000 8000 10000 12000 14000 16000 18000-505
x 10-3
imf9
(a) IMF components (dilute stratified flow) (b) IMF components (dune flow)
3
35
sign
al
Empirical Mode Decomposition
001
-001
imf1 0
002
-002
imf2 0
005
-005
imf3 0
01
-01
imf4 0
01
-01
imf5 0
02
-02
imf6 0
01
-01
imf7 0
01
-01
imf8 0
02
0 2000 4000 6000 8000 10000 12000 14000 16000 18000-02
0
imf9
(c) IMF components (plug flow)
Fig3 IMF componen f different flow pattern 422 Ener
In this study the energy distribution Hj of different frequency bands is defined a
ts of pressure fluctuation signal ogy distribution of IMF
s EE
H jj =
(j
gy of the
energy each frequency band of local energy and the energy
gy distribution of the signal taken and literature published the IMF
= 1 2 3) where jE (measured by Standard Deviation) stands for the local ener different frequency bands (j=1 denotes the high-frequency band j=2 the middle-frequency band and j=3 the low-frequency band) and E is the total energy(measured by Standard Deviation also) The energy distribution Hj is selected as the characteristics of the pressure fluctuation signal In this study a number of logical steps were followed (1) Acquire the pressure fluctuation signal (2) Apply EMD to the signal (3) Calculate the total signaldistribution (4) Determine the enerAs per the extensive experimental work undercomponents are divided into three frequency bands in terms of their inherent frequencies for quantitative analysis of the energy distribution high-frequency band H1 with IMF components of IMF1 IMF 2 and IMF 3 middle-frequency band H2 with IMF components of IMF 4 IMF 5 and IMF 6 and low-frequency band H3 with IMF components of IMF 7 and IMF 8 E1 represents the total energy of IMF 1 IMF 2 and IMF 3 E2 is the sum of the energy of IMF 4 IMF 5 and IMF 6 and E3 is the total energy of IMF7 and IMF8 Tab2 summarizes the variations of energy characteristics Hj with flow pattern
The 6th International Symposium on Measurement Techniques for Multiphase Flows IOP PublishingJournal of Physics Conference Series 147 (2009) 012078 doi1010881742-65961471012078
6
Tab 2 Conveying condition and energy distribution with quartz eristics Hj ()Energy charactP (MPa) ΔPT (MPa) μ (kgm3) Vg (ms) Flow pattern
H1 H2 H3 101 94 Stratified flow 5 1 4 469 261 269146 56 Dune flow 479 5523 3998 36 28 348 17 Plug flow 314 5485 4202
ab2 illustrates the variation of energy distribution in different frequency bands With
characteristic Hj changes with the flow pattern and can
3 Energy distribution of IMF with pulverized coal 2μm was conveyed in the experimental
aracteristic Hj with the deceasing gas velocity was
tion method three flow patterns can be classified
Tab 3 Conveying condition and energy distribution with pulverized coal
Tdecreasing gas velocity the flow pattern of solid-gas flow is continually changing and the energy characteristics Hj changes too According to Table2 I1 I2 and I3 carry almost half of the embedded energy for the dilute stratified flow In the case of dune flow the energy diverts from the high-frequency band to the lower-frequency band Consequently the ratio of energy embedded in the high-frequency band decreases dramatically and the ratio of energy embedded in the middle and low-frequency band increases As for plug flow the ratio of energy embedded in the high-frequency band decreases further and the ratio of energy embedded in the low-frequency band increases slightly The above results imply that the energytherefore be regarded as an indicator for the identification of the flow pattern of high-pressure and dense-phase solid-gas flow The result also demonstrates that EMD is suitable for analyzing the pressure fluctuation signal However it has to be pointed out that Hj changes from dune flow to plug flow not as evidently as from stratified flow to dune flow 4Inner Mongolia pulverized coal with mean diameter of 5facility Conveying condition is shown in Tab3 Because of the high stickiness and electrostatic attraction of pulverized coal to the pipe wall it is very difficult to recognize the flow regimes in the conveying pipe through visualization method Itrsquos also unclear and impossible to identify the flow pattern through the pressure signal trace alone Through the preceding results EMD is considered as an effective method to analyze the pressure fluctuation signal in order to identify the flow regime in the pipeline indirectly Similar varying tendency of the energy chfound With decreasing gas velocity the energy characteristics Hj changes obviously According to Tab3 H1 carry more than 70 of the embedded energy at the relatively high Vg which is 111ms When Vg changes from 62ms to 102ms the energy diverts from the high-frequency band to the lower-frequency band Consequently the ratio of energy embedded in the high-frequency band decreases to about 60 and the ratio of energy embedded in the middle and low-frequency band increases Further decreasing Vg to 41ms or below the ratio of energy embedded in the high-frequency band decreases and the ratio of energy embedded in the low-frequency band increases significantly As a result though impossible by visualizaapproximately according to the energy characteristics Hj when conveying pulverized coal
Energy characteristics Hj () P (MPa)
ΔPT (MPa) μ (kgm3) Vg (ms) H1 H2 H3
102 111 7 4 9 701 150 147126 102 5628 1152 3220 166 9 5860 1171 2969 213 79 34 04 6185 1300 2515 309 62 6117 1601 2281 531 41 2860 1451 5689
The 6th International Symposium on Measurement Techniques for Multiphase Flows IOP PublishingJournal of Physics Conference Series 147 (2009) 012078 doi1010881742-65961471012078
7
5 CONCLUSIONS ble flow regimes dilute stratified flow dune flow and plug flow were
the characteristics of pressure traces acquired by high
deeply EMD has been applied in
identify the flow pattern through the pressure signal
CKNOWLEDGMENT supported by the National Key Basic Research Program of China
OMENCLATURE ocity [mmiddots-1]
solid-gas ratio [kgmiddotm-3]
ending pressure (pressure in the sending hopper) [MPa]
PT total conveying differential pressure [MPa]
EFERENCES and et al (2006) ldquoHigh solids loading pneumatic conveying of pulverized
W Wypych and J Yi(2003) ldquoMinimum transport boundary for horizontal dense-phase
Li and Y Tomita(2000) ldquoParticle velocity and concentration characteristics in a horizontal
J Masona A Lev(2001) ldquoA model for non-suspension gas-solids flow of fine powders in
Laouar Y Molodtsof (1998)rdquoExperimental drop in dense phase pneumatic transport at very
Molerus(1996) ldquoOverview pneumatic transport of solidsrdquo Powder technology Vol88
(1) Three distinguishaobserved visually when conveying quartz powder under high-pressure and dense-phase pneumatic conveying (2) When conveying quartz powderfrequency response pressure transmitter were correlated closely with the flow regimes When superficial gas velocity was relatively high flow pattern was dilute stratified flow and pressure signal fluctuated more quickly than that of the other flow regimes As superficial gas velocity diminished flow pattern transited to dune flow and pressure signal fluctuated like sine wave Further decrease in superficial gas velocity yielded plug flow meanwhile sine-like pressure signal fluctuated with lower frequency and higher amplitude (3) In order to investigate the characteristics of pressure morethe analysis of a pressure fluctuation signal Results have demonstrated that the extracted energy characteristics reflect the energy shift with the variation of flow pattern The energy characteristic Hj changes with the flow regimes and can therefore be regarded as an indicator for the identification of the flow regimes (4) Itrsquos unclear and almost impossible to trace alone Using EMD analysis on the pressure signal the flow regime in the pipeline can be identified indirectly AThis work was financially (No 2004CB217702) NVg superficial gas vel μ P ∆ RX Gong X Guocoalrdquo Journal of Chemical Industry and Engineering (china)Vol57 pp640-644 Ppneumatic conveying of granular materialsrdquo Powder technology Vol129 pp111-121 Hdilute swirling flow pneumatic conveyingrdquopowder technology Vol107 pp144-152 Dpipesrdquo International Journal of Multiphase Flow Vol27 pp415-435 Slow velocity ldquoPowder Technology Vol95 pp165-173 Opp309-321
The 6th International Symposium on Measurement Techniques for Multiphase Flows IOP PublishingJournal of Physics Conference Series 147 (2009) 012078 doi1010881742-65961471012078
8
Pavol Rajniak Kumar Dhanasekharan Csaba Sinka et al(2008) ldquoModeling and measurement
antiago Laiacuten Martin Sommerfeld (2008) ldquoEulerLagrange computations of pneumatic
J Azzopardi K Jackson JP Robinson et al (2008) ldquoFluctuations in dense phase pneumatic
A Woods RB Thorpe SE Johnson (2008) ldquoHorizontal pneumatic conveying from a
Shen and Y Xiong (2005) ldquoExperimental study on dense-phase pneumatic conveying of
hen Xiaoping Fan Chunlei Liang Cai et al (2006) ldquoInvestigation on Characteristics of
ao Ding Zhiyao Huang Zhihuan Song et al (2007) ldquoHilbert-Huang transform based signal
ouzid A Ellouze N (2004) ldquoEmpirica mode decompostion of voiced speech signalrdquo In First
landrin P Rilling G Goncalves P (2004) ldquoEmpirical mode decompostion as a filter bankrdquo
uang NE Shen Z Long SR (1999) ldquoA new view of nonliner water waves The Hilbert
of granule attrition during pneumatic conveying in a laboratory scale systemrdquoPowder Technology 185(3) pp202-210 Sconveying in a horizontal channel with different wall roughnessrdquo Powder Technology 184(1) pp76-88 Bconveying of pulverised coal measured using electrical capacitance tomographyrdquo Chemical Engineering Science 63(9)pp2548-2558 Jfluidized bedrdquo Chemical Engineering Science 63(7) pp1741-1760 Xpulverized coal at high pressuresrdquo Proceedings of the CSEE Vol25 pp103-107 CPulverized Coal Dense-phase Pneumatic Conveying under High PressurerdquoKorean Journal of Chemical Engineering 24(3) pp499-502 Hanalysis for the characterization of gas-liquid two-phase flowrdquoFlow Measurement and Instrumentation 18 pp37-46 Binternational symposium on control communications and signal processing pp603-606 FIEEE Signal Prcocessing Letters 11(2) pp112-114 HsprectrumrdquoAnnual Review of Fluid Mechanis 31 pp417-457
The 6th International Symposium on Measurement Techniques for Multiphase Flows IOP PublishingJournal of Physics Conference Series 147 (2009) 012078 doi1010881742-65961471012078
9