studies on the removal of cu(ii) from aqueous solutions ... · solutions using modified acacia...
TRANSCRIPT

PEER-REVIEWED ARTICLE bioresources.com
Thilagavathy et al. (2014). “Cu(II) sorption by Acacia,” BioResources 9(3), 3805-3824. 3805
Studies on the Removal of Cu(II) from Aqueous Solutions using Modified Acacia nilotica Leaf
Palanisamy Thilagavathy a,* and Thirumalaisamy Santhi
b
In this work, sustainable and biodegradable Acacia nilotica leaf (AN) was chemically modified to remove Cu(II) from aqueous solutions, which is considered a versatile approach to clean contaminated aquatic environments. Zinc chloride-modified Acacia nilotica leaf (ZAN) was characterized by scanning electron microscopy (SEM) and other physico-chemical parameters like pHZPC. The aim was to assess the efficiency and mechanism of adsorption on Acacia nilotica via isotherm models (Langmuir, Freundlich, Temkin, Dubinin-Radushkevich, Harkin-Jura, and Frenkel-Halsey-Hill), kinetic models, and thermodynamic parameters. To optimize the removal efficiency, parameters such as effect of initial concentration, effect of pH, dosage, initial concentration, and contact time were studied by batch and column methods. Desorption studies illustrated that about 73% of the metal ions could be removed using 0.2N HCl. The results of the present investigation indicated that ZAN has a high potential for the removal of Cu(II) from aqueous solutions, and the resultant data can serve as a base line for designing treatment plants on an industrial scale.
Keywords: Acacia nilotica; Copper(II); Batch; Column; Adsorption; Desorption; Isotherms; Kinetics;
Thermodynamics; Binary metal; Wastewater
Contact information: a: Department of Chemistry, Professional Group of Institutions, Palladam 641 662,
India; b: Department of Chemistry, Karpagam University, Coimbatore 641 021, India.
* Corresponding author: [email protected]
INTRODUCTION
There are large amounts of heavy metals released into the environment. The
pollution of water resources due to the disposal of heavy metals has been an increasing
worldwide concern for the last few decades. Unlike organic pollutants, heavy metals are
essentially non-biodegradable and accumulate in living organisms. Metals such as Cd,
Hg, Ag, Cr(VI), and Pb are extremely toxic to living beings; others, such as Cu, Zn, Mn,
Fe, Ni, and Co, although essential for plants and animals, can be very harmful to living
organisms when present above certain limits. In recent years, increasing concern about
the effect of toxic metals in the environment has resulted in stricter environmental
regulations for industries that discharge metal-bearing effluents (Kadirvelu et al. 2001;
Algarra et al. 2005). One heavy metal that is toxic to humans and widely studied by many
researchers is copper. Copper is considered a micronutrient but is extremely toxic to
living organisms at high concentrations.
The main sources of copper pollution are metal cleaning and plating baths, paper
board mills, wood pulp production, and the fertilizer industry, as well as brass materials,
boiler pipe, cooking utensils, and copper from metalworking, which requires periodic
oxide removal by immersing the metal in a strong acid bath. Solution adhering to the
cleaned metal surface is rinsed from the metal and contaminates the waste rinse water.
PEER-REVIEWED ARTICLE bioresources.com
Thilagavathy et al. (2014). “Cu(II) sorption by Acacia,” BioResources 9(3), 3805-3824. 3806
Similarly, plated metal parts are rinsed and produce wastewater (Ho and McKay 2004).
Copper may also be found as a contaminant in food, especially shellfish, liver,
mushrooms, nuts, and chocolate. The World Health Organization (WHO) recommends a
maximum acceptable concentration of Cu(II) of 1.5 mg/L in drinking water (Dundar et
al. 2008). It has been reported that excessive copper intake by humans may lead to
hepatic and renal damage, capillary damage, gastrointestinal irritation, and central
nervous system irritation (Larous et al. 2005).
Copper can be removed from aqueous solutions by a precipitation method as
copper hydroxide, but this method is only efficient at high pH values. Conventional
methods include chemical precipitation, chemical oxidation or reduction, filtration, ion
exchange, application of membrane technology, and evaporation recovery. However,
these processes have considerable disadvantages including incomplete metal removal,
expensive equipment and monitoring systems, large reagent or energy requirements, or
generation of toxic sludge or other waste products that require disposal. Adsorption, an
alternative technology for conventional wastewater treatment, has received considerable
attention for the development of an efficient, clean, and cheap technology. In recent
years, this attention has been focused on the removal of copper from aqueous solutions
using adsorbents derived from low-cost materials (Kalavathy et al. 2005). Many
researchers have investigated low-cost materials as viable adsorbents for heavy metal
removal, namely rice husk (Wong et al. 2003), barks (Reddy et al. 1997), teak leaves
powder (King et al. 2006), tree fern (Ho et al. 2002), groundnut shells (Shukla and Pai
2005), macadamia nutshell (Ahmadpour and Do 1997), holly oak (Prasad and Freitas
2000), paper mill sludge (Khalili et al. 2000), and Ipomoea carnea (Nadeem et al. 2006).
Activated carbon has been extensively used as an adsorbent in a variety of
industrial and environmental applications. The type of precursor and the method
employed for activation are the key factors that determine the quality of the carbon
produced. Its adsorption capabilities have been shown to be largely determined by its
surface characteristics. Two methods, physical and chemical activation, are used for the
preparation of activated carbon. During physical activation, the raw material is
carbonized at a high temperature. Then, it is activated by CO2 or steam under pressure to
increase the porosity and surface area of the activated carbon. In chemical activation,
both carbonization and activation takes place simultaneously, in which the raw material is
first impregnated with activating chemical and then carbonized at the desired
temperature, which varies according to activating chemical used (Hayashi et al. 2008).
The development of a porous structure is better in the case of chemical activation (Karim
et al. 2006). Chemical activation is held in the presence of dehydrating reagents such as
KOH, K2CO3, NaOH, ZnCl2, H2SO4, and H3PO4, which influence pyrolytic
decomposition and inhibit tar formation. The carbon yield is higher and the temperature
used in chemical activation is lower than that of physical activation. Behaviors of the
reagents during chemical activation have different effects on the final product. Zinc
chloride is widely used as an activating reagent, since it results in high surface area and
high yield. In the use of ZnCl2, the activated carbons have large surface areas and more
extensive micropore structure. To prepare activated carbon, a conventional heating
method is usually adapted, in which the energy is produced by an electrical furnace.
Essentially, vacant interstices in the carbon matrix are formed upon extensive post-
heating and washing of the pores. The extent of chemical activation can significantly alter
the characteristics of the produced carbons.

PEER-REVIEWED ARTICLE bioresources.com
Thilagavathy et al. (2014). “Cu(II) sorption by Acacia,” BioResources 9(3), 3805-3824. 3807
Modification of AN was carried out to enhance the adsorption efficiency of
adsorbent for Cu(II) ions. The removal efficiency of the adsorbent was investigated and
compared using both batch and column adsorption experiments. Various important
parameters were studied for the optimization of the copper removal process. Kinetic,
thermodynamic, and equilibrium studies were also carried out to gain a better
understanding of the removal process.
EXPERIMENTAL Materials Collection and preparation of adsorbent
The leaves of Acacia nilotica used in this work were collected locally. They were
shade-dried and powdered in a grinder. Six grams of dried Acacia nilotica were mixed
with 30 mL of ZnCl2. The slurry was kept at room temperature for 24 h to ensure the
access of the ZnCl2 to the Acacia nilotica. Then, the material was washed with 0.5 N
HCl, hot water, and cold distilled water until the pH of the washing solution reached 6 to
7. The material was filtered and dried at varying temperatures (50, 100, 150, 200, 250,
300 and 350°C) in a hot air oven for and time (1 to 8 h). The adsorption results were
found to be good at 300°C and 6 h, so these conditions were fixed for further
experiments, and the adsorbent was labeled as “ZAN”. The prepared material was
preserved in an air-tight container for later experimental use. Later, it was characterized
by sophisticated techniques such as scanning electron microscopy (SEM).
Preparation of adsorbate
An accurate weight of 1.000 g CuSO4.5H2O (Aldrich) was dissolved in 1 L of
distilled water to produce the stock solutions of Cu(II). These stock solutions were then
diluted to the required concentrations using distilled water when necessary. The stock and
standard solutions were prepared freshly for all experiments.
Methods Batch adsorption experiments
To study the effect of parameters such as adsorbent dose, initial metal ion
concentration, and solution pH for the removal of Cu(II) by adsorption onto ZAN, batch
experiments were performed. Stock solutions of Cu(II) in single (S) and binary (B)
systems were prepared by dissolving Cu(II) (S) and Cu(II)+Co(II),Cu(II)+Cr(VI) (B) in
deionized water and further diluting to 50 to 200 mg/L concentrations for the
experiments. The pH was adjusted by adding 0.5 N HCl or 0.5N NaOH to the solutions
with known initial Cu(II) ion concentrations. Batch adsorption experiments were
conducted in 250 mL stoppered flasks containing 0.2 g of ZAN and 50 mL of Cu(II)
solutions of differing concentrations (50, 100, 150, and 200 mg/L) at pH 5. The flasks
were agitated using a mechanical orbital shaker and maintained at room temperature for 2
h until equilibrium was reached. The suspensions were filtered, and metal concentrations
in the supernatant solutions were measured using a UV-Visible spectrophotometer
(Shimadzu UV-2450) at 324nm (λmax). All of the experiments were done in duplicates.
The objective of the study was to investigate the adsorption of Cu(II) ions onto modified
Acacia nilotica (ZAN). The uptake of Cu(II) by ZAN at equilibrium (qe) was calculated
by the following mass balance relationship,
PEER-REVIEWED ARTICLE bioresources.com
Thilagavathy et al. (2014). “Cu(II) sorption by Acacia,” BioResources 9(3), 3805-3824. 3808
–
(1)
where Co and Ce (mg/L) are the liquid phase concentrations of metal at initial and
equilibrium, respectively, V (L) is the volume of the solution, and W (g) is the mass of
adsorbent used.
Surface acidity and basicity
Surface acidity was estimated by mixing 0.2 g of ZAN with 25 mL of 0.5N NaOH
in a closed flask. The flask was then agitated for 48 h at room temperature. The
suspension was decanted, and the remaining NaOH was titrated with 0.5 N HCl. The
surface basicity was measured by titration with 0.5 N NaOH after agitation of 0.2 g of
ZAN with 0.5 N HCl. The ZAN had a surface acidity of 1.891 mmol/g and surface
basicity of 3.35 mmol/g. Acidity and basicity were confirmed by the Boehm titration
method, which quantifies the basic and oxygenated acidic surface groups on activated
carbons (Boehm 2002).
Zero surface charges
The zero point charge of ZAN was determined by using the solid addition method
(Kumar et al. 2008). The experiment was conducted in a series of 250 mL stoppered
glass flasks. Each flask was filled with 50 mL of a NaNO3 solution with a different initial
pH value and 0.2 g of ZAN. The pH values of the NaNO3 solutions were adjusted
between 2 and 9 by adding either 0.1 N HNO3 or 0.1 N NaOH. The suspensions were
then sealed and shaken for 2 h at 160 rpm. The final pH values of the supernatant liquid
were noted.
RESULTS AND DISCUSSION
Characterization of Adsorbents Zero surface charges
The influence of the solution pH on the metal uptake can be explained on the
basis of the pH zero point charge of the adsorbent. The pH value necessary to affect a net
zero point charge on a solid surface in the absence of specific sorption is called the point
of zero point charge (pHZPC). The difference between the initial pH (pH0) and final pH
(pHf) values (pH = pH0 − pHf) was plotted against the values of pH0. The point of
intersection between the resulting curve and the abscissa provides the pHZPC. The zero
point charge was 4.10 for ZAN, which was below the solution pH (pH 5).Therefore, the
negative charge density on the surface of ZAN increased, which favors the adsorption of
cationic metal ions (Janos et al. 2003). This result indicates that the pHZPC of ZAN
depends on the raw material and the activated carbon.
Scanning electron microscopy (SEM) studies
Scanning electron micrographs (Jeol jsm-6390 model at an accelerating voltage of
20KV) with a magnification of ×1000, ×3000, ×1500 of RAN (Raw Acacia nilotica i.e.,
without any modification with ZnCl2), ZAN, and ZAN with Cu respectively are shown in
Figs. 1a, b, and c. It is clear from the SEM images that the external surfaces of three

PEER-REVIEWED ARTICLE bioresources.com
Thilagavathy et al. (2014). “Cu(II) sorption by Acacia,” BioResources 9(3), 3805-3824. 3809
samples were rough and contained abundant porous structures of different sizes and
shapes. Additionally, the pore walls of the carbon contained narrow pores, which are
responsible for high surface area and high adsorption capacity. The micrographs showed
that, during carbonization of the Acacia nilotica leaf impregnated with ZnCl2, the volatile
matter developed high pressure, which burst the cellular structure of the particle and
created cavities on the surfaces of the carbon samples shown by arrows in the Figs. It also
caused the evaporation of ZnCl2 during carbonization, leaving open space that was
previously occupied by ZnCl2. During impregnation, the molecules of the chemical
impregnating agent diffused into the lignocellulosic material. During carbonization at the
desired temperature, the chemical impregnating agent evaporated, rendering the
remaining carbon porous.
Table 1. Physico-chemical Characteristics of Activated Acacia nilotica Leaves
Parameters Values Parameters Values
Moisture content (%) 8.992 Water-soluble matter (%) 13.04
Ash content (%) 9.125 Conductivity (µS cm-1
) 0.259
pH 7.034 Zero point charge (pHZPC) 4.10
Decolorizing power (mg g-1
) 1.243 Apparent density (gm L-1
) 0.389
Specific gravity 1.278
a b c
Fig. 1. SEM images of (a) RAN,(b) ZAN without Cu(II), and (c) ZAN with Cu(II)
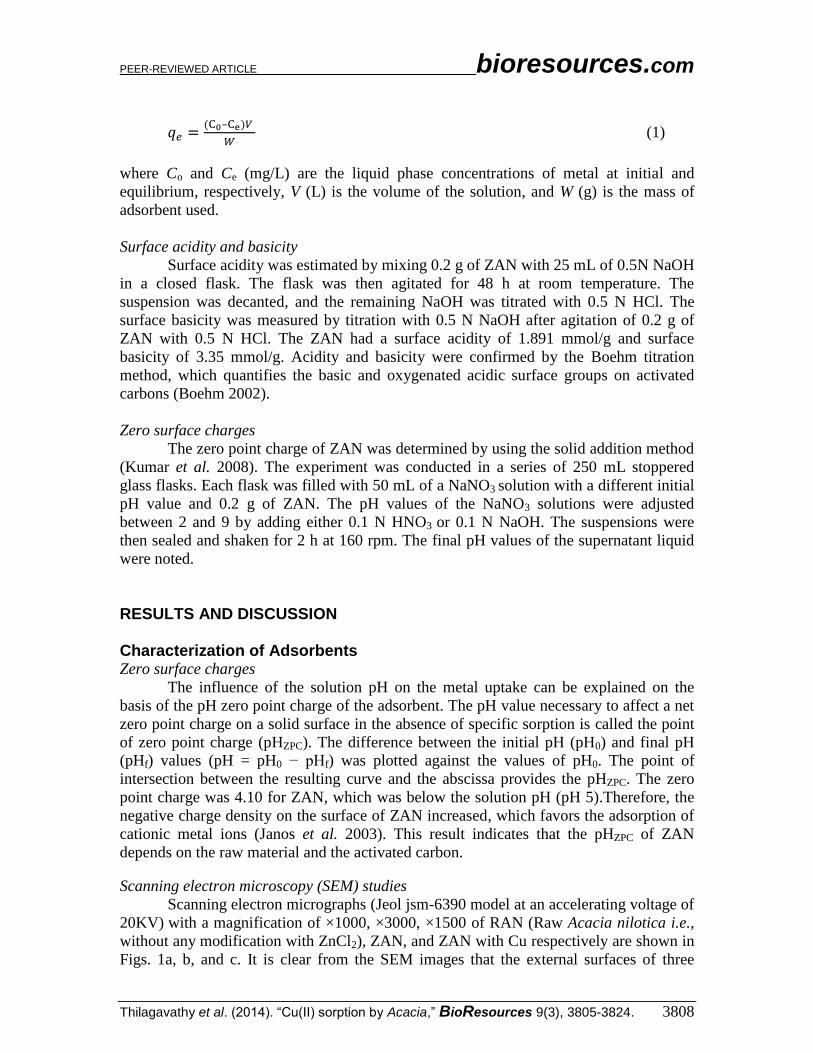
Effect of pH The solution pH affected the surface charge of the adsorbent and the degree of
ionization and speciation of the adsorbate. The influence of pH on the adsorption of
Cu(II) is presented in Fig. 2. These results indicated that an increase in pH had a positive
effect on the metal uptake up to pH 5, since the competition between protons and metal
cations for the active sites of the biomass decreased. The maximum adsorption of Cu(II)
ions on ZAN was observed at pH 5. Above pH 5, Cu(II) adsorption significantly
decreased and Cu(II) was precipitated as its hydroxide complexes (Ho et al. 2002). At
very low pH values, copper adsorption was very low due to competition between H3O+
and Cu(II) ions for adsorption sites. As pH increased, more adsorbent surface was
exposed and carried negative charges, which resulted in less repulsion of Cu(II) ions.
The effect of pH can be explained in terms of pH at the zero point charge (pHZPC)
and Cu(II) speciation in the solution. The pH at which the charge of the solid surface is
zero is referred to as the pHZPC. Above pHZPC, the surface charge of the adsorbent is
negative, and below it, the surface charge is positive. The amount of adsorption above
pHZPC was maximum because of the interaction of Cu2+
and Cu(OH)+ with the positively
PEER-REVIEWED ARTICLE bioresources.com
Thilagavathy et al. (2014). “Cu(II) sorption by Acacia,” BioResources 9(3), 3805-3824. 3810
charged ZAN. At a low pH, particularly below pHZPC, the positively charged Cu2+
and
Cu(OH)+ species may repel adsorbent surfaces carrying an equal charge and thereby
decrease the Cu(II) adsorption. Earlier works have reported a similar pattern for the
influence of pH on the adsorption of heavy metals (Krishnan and Anirudhan 2002).
Fig. 2. Effect of pH on ZAN Fig. 3. Effect of dosage on ZAN
Effect of Dosage Different amounts of both of the adsorbents varying from 0.2 to 1 g/50mL of
solution with a copper concentration of 50 mg/L were used to optimize the required
amount of adsorbent under the prescribed conditions for maximum uptake. It is shown in
Fig. 3 that adsorption capacity increased with an increase in dosage of the adsorbent. This
is due to the fact that more adsorbent creates more active sites onto which more copper is
adsorbed onto ZAN. The difference in adsorption capacity (qe (mg/g)) at the same initial
metal ion concentration, adsorbent dose, and contact time may also be attributed to the
difference in their chemical affinities and ion exchange capacity with respect to the
chemical functional group on the surface of the adsorbent.
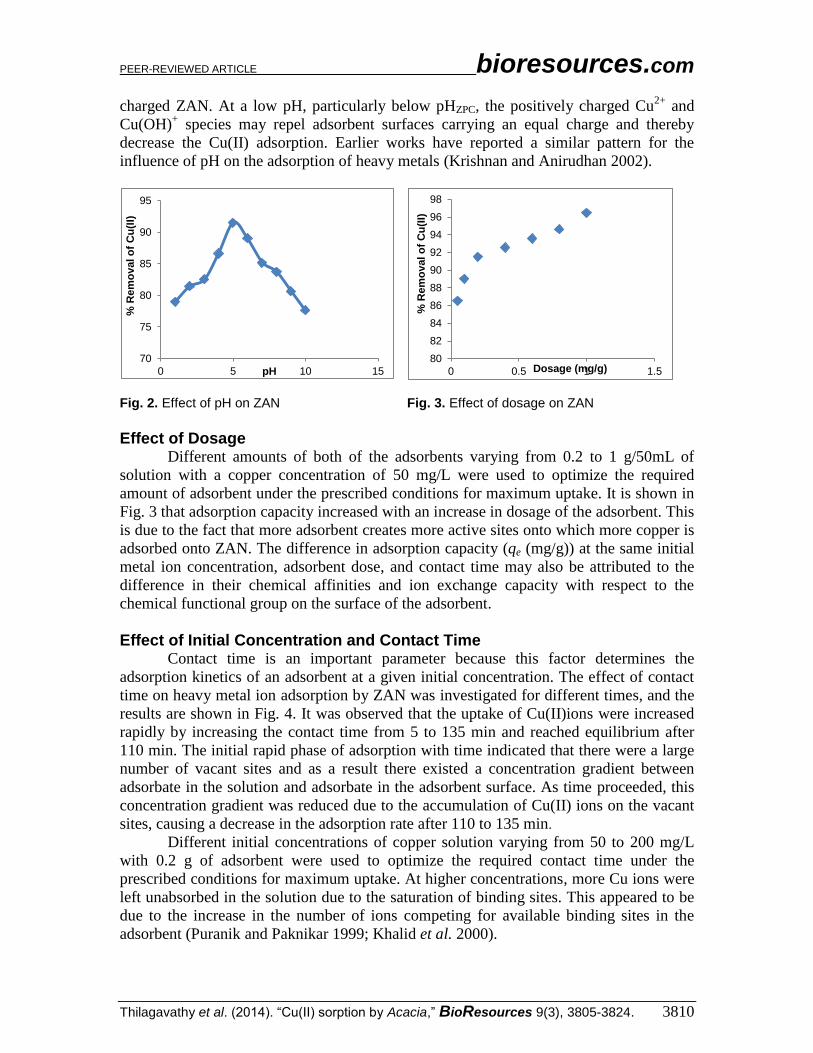
Effect of Initial Concentration and Contact Time Contact time is an important parameter because this factor determines the
adsorption kinetics of an adsorbent at a given initial concentration. The effect of contact
time on heavy metal ion adsorption by ZAN was investigated for different times, and the
results are shown in Fig. 4. It was observed that the uptake of Cu(II)ions were increased
rapidly by increasing the contact time from 5 to 135 min and reached equilibrium after
110 min. The initial rapid phase of adsorption with time indicated that there were a large
number of vacant sites and as a result there existed a concentration gradient between
adsorbate in the solution and adsorbate in the adsorbent surface. As time proceeded, this
concentration gradient was reduced due to the accumulation of Cu(II) ions on the vacant
sites, causing a decrease in the adsorption rate after 110 to 135 min.
Different initial concentrations of copper solution varying from 50 to 200 mg/L
with 0.2 g of adsorbent were used to optimize the required contact time under the
prescribed conditions for maximum uptake. At higher concentrations, more Cu ions were
left unabsorbed in the solution due to the saturation of binding sites. This appeared to be
due to the increase in the number of ions competing for available binding sites in the
adsorbent (Puranik and Paknikar 1999; Khalid et al. 2000).
70
75
80
85
90
95
0 5 10 15
% R
em
ov
al o
f C
u(I
I)
pH
80
82
84
86
88
90
92
94
96
98
0 0.5 1 1.5
% R
em
ov
al o
f C
u(I
I)
Dosage (mg/g)
PEER-REVIEWED ARTICLE bioresources.com
Thilagavathy et al. (2014). “Cu(II) sorption by Acacia,” BioResources 9(3), 3805-3824. 3811
Effect of Temperature on the Uptake of Copper To investigate the effect of temperature on ZAN, experiments were carried out
with five different concentrations of the Cu(II) ion 50, 100, 150, and 200 mg/L at four
different temperatures (283, 293, 313, and 323 K). As shown in Fig. 5, the adsorption
capacity of the adsorbents increased with increasing temperature, consistent with an
endothermic process. The highest capacity was observed on ZAN at 323K (39.21 mg/g).
A possible chemical explanation for this finding is that deprotonation reaction occurred
readily at high temperatures, which made more positive groups (amino and carboxyl
groups) available for metal removal. The increasing temperature likely influenced the
internal structure of the adsorbent and simplified the ion distribution in the adsorbent’s
interspatial structure.
Fig. 4. Effect of contact time and initial Fig. 5. Effect of temperature on ZAN concentration on ZAN
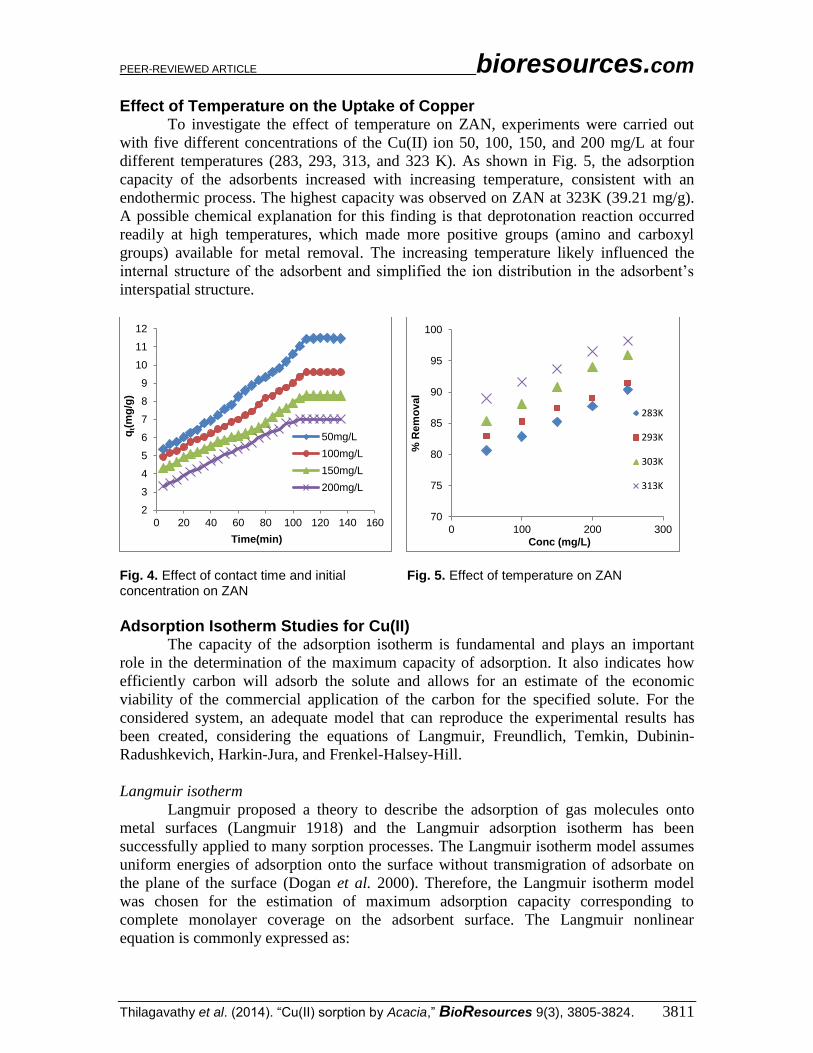
Adsorption Isotherm Studies for Cu(II) The capacity of the adsorption isotherm is fundamental and plays an important
role in the determination of the maximum capacity of adsorption. It also indicates how
efficiently carbon will adsorb the solute and allows for an estimate of the economic
viability of the commercial application of the carbon for the specified solute. For the
considered system, an adequate model that can reproduce the experimental results has
been created, considering the equations of Langmuir, Freundlich, Temkin, Dubinin-
Radushkevich, Harkin-Jura, and Frenkel-Halsey-Hill.
Langmuir isotherm
Langmuir proposed a theory to describe the adsorption of gas molecules onto
metal surfaces (Langmuir 1918) and the Langmuir adsorption isotherm has been
successfully applied to many sorption processes. The Langmuir isotherm model assumes
uniform energies of adsorption onto the surface without transmigration of adsorbate on
the plane of the surface (Dogan et al. 2000). Therefore, the Langmuir isotherm model
was chosen for the estimation of maximum adsorption capacity corresponding to
complete monolayer coverage on the adsorbent surface. The Langmuir nonlinear
equation is commonly expressed as:
2
3
4
5
6
7
8
9
10
11
12
0 20 40 60 80 100 120 140 160
qt(m
g/g
)
Time(min)
50mg/L
100mg/L
150mg/L
200mg/L
70
75
80
85
90
95
100
0 100 200 300
% R
em
ov
al
Conc (mg/L)
283K
293K
303K
313K

PEER-REVIEWED ARTICLE bioresources.com
Thilagavathy et al. (2014). “Cu(II) sorption by Acacia,” BioResources 9(3), 3805-3824. 3812
(2)
In Eq. 2, Ce and qe are defined as in Eq. 1, Qm is a constant and reflects complete
monolayer coverage (mg/g), and Ka is an adsorption equilibrium constant (L/mg) that is
related to the apparent energy of sorption. The Langmuir isotherm (Langmuir 1916)
assumes monolayer adsorption onto a surface containing a finite number of adsorption
sites. The Langmuir isotherm (Eq. 2) can be linearized into the following form
(Kinniburgh 1986; Longhinotti et al. 1998):
(3)
A plot of Ce/qe versus Ce should indicate a straight-line slope of 1/Qm and an
intercept of 1/KaQm. Table 2 shows the values of the coefficient of determination (R2),
sorption capacity (Qm), and sorption energy (n) calculated from the plot. The obtained
value of Qm was equal to 38.31mg/g. This sorption capacity of adsorbent is high
compared to recorded sorbents (Table 5). The correlation coefficient (R2) was 0.9746,
which is slightly less than that of the Freundlich isotherm (0.9955).
Freundlich isotherm
The Freundlich isotherm is an empirical equation assuming that the adsorption
process takes place on a heterogeneous surface or possibly through a multilayer
adsorption mechanism, and the adsorption capacity is related to the concentration of
metal ions at equilibrium (Freundlich 1906). The Freundlich equation can be given as,
(4)
where qe is the amount of adsorbate at equilibrium (mg/g), Ce is the equilibrium
concentration of the adsorbate (mg/L), Kf is the Freundlich adsorption constant related to
adsorption capacity of the adsorbent, and 1/n is the adsorption intensity. A linear form of
the Freundlich equation is generally expressed as follows:
(5)
The values of Kf and 1/n were calculated from the intercept and slope of the plot of lnqe
versus lnCe. Table 2 shows the calculated Freundlich parameters.
Temkin isotherm
Temkin and Pyzhev considered the effects of some indirect sorbate/adsorbate
interactions on adsorption isotherms, and suggested that the heat of adsorption of all the
molecules in the layer would decrease linearly with coverage due to these interactions
(Temkin and Pyzhev 1940). The Temkin isotherm has been used in the following form,
(6)

PEER-REVIEWED ARTICLE bioresources.com
Thilagavathy et al. (2014). “Cu(II) sorption by Acacia,” BioResources 9(3), 3805-3824. 3813
where A is the equilibrium binding constant (L/g), b is related to the heat of adsorption
(J/mol), R is the universal gas constant (8.314 J/mol K), and T is the absolute temperature
(K). Equation 6 can be written in the following form:
(7)
(8)
The Temkin isotherm was found to fit quite well with the experimental data, as
evident from the values of coefficients of determination. For ion-exchange mechanism,
the bonding energy range is reported to be 8 to 16 KJ/mol, and physiosorption processes
are reported to have adsorption energy less than −40 KJ/mol. In our study, the value of b
showed that the adsorption process involved physiosorption. The Temkin adsorption
isotherm parameters were calculated, and the values are summarized in Table 2.
Dubinin-Radushkevich isotherm
The Dubinin-Radushkevich(D-R) equation can be expressed (Acemioglu 2004)
as,
(9)
where ε (the Polanyi potential) is equal to RT ln (1 + 1/Ce), qe is the amount of the dye
adsorbed per unit activated carbon (mol/g), qm is the theoretical monolayer saturation
capacity (mol/g), Ce is the equilibrium concentration of the dye solution (mol/L), K is the
constant of the adsorption energy (mol2/kJ
2), R is the gas constant (8.314 KJ/mol K), and
T is the temperature (K). The linear form of the D-R isotherm is:
(10)
The term K is related to the mean adsorption energy E (kJ/mol), as discussed by (Hobson
1969). The apparent energy of adsorption E can be used to judge the adsorption
mechanism as physical or chemical ion exchange. A sorption process is generally
considered as physical if E<8 KJ/mol and as chemical when the E value lies between 8
and 16 KJ/mol. The apparent energy of adsorption E for Cu(II) ion was 0.3853 J/mol,
indicating a physiosorption process. The value of the coefficient of determination was
0.8788, indicating that the Dubinin–Radushkevich isotherm gave a good fit to the
sorption process. The mean free energy of sorption (E) was calculated from the following
equation:
√ (11)
The calculated D-R adsorption isotherm parameters are summarized in Table 2.
Harkin-Jura adsorption
The Harkin-Jura adsorption isotherm can be expressed as,

PEER-REVIEWED ARTICLE bioresources.com
Thilagavathy et al. (2014). “Cu(II) sorption by Acacia,” BioResources 9(3), 3805-3824. 3814
(
)
(12)
where B2 is the isotherm constant and 1/qe2
is plotted versus log Ce. This isotherm
explains the multilayer adsorption by the existence of a heterogeneous pore distribution.
Frenkel-Halsey-Hill isotherm
The Frenkel-Halsey-Hill isotherm can be expressed as,
(13)
where qe is plotted versus ln Ce. This isotherm describes multilayer adsorption by the
existence of a heterogeneous pore distribution in the adsorbent.
Adsorption isotherms describe the interaction of adsorbate with adsorbent
materials, and are critical for optimization of the adsorption mechanism pathways (Foo
and Hameed 2010). Therefore, the correlation of equilibrium data by empirical equations
is essential to the practical design and operation of adsorption systems (Carrasquero-
Duran and Flores 2009). The experimental data were modeled using Langmuir,
Freundlich, Temkin, Dubinin-Radushkevich, Harkin-Jura, and Frenkel-Halsey-Hill
isotherm models. Isotherm parameters for the adsorption of Cu(II) onto ZAN are
summarized in Table 2. The applicability of Freundlich and Frenkel-Halsey-Hill isotherm
models suggests that the adsorption takes place on heterogeneous surfaces.
Table 2. Isotherm Constants for Cu(II) Adsorption onto ZAN
Isotherm Model Constants and Correlations Experimental Values
Langmuir
Qm (mg g-1
) 38.3142
b (L mg-1
) 0.08463
R2 0.9746
Freundlich
1/n 0.3088
Kf (mg g-1
) 1.1542
R2 0.9955
Dubinin-Radushkevich
Qm (mg g-1
) 185.42
K (×10-5
mol2KJ
-2) 3.3684
E (KJ mol-1
) 0.3853
R2 0.8788
Temkin
α (L mg-1
) 4.9725
β (mg L-1
) 0.1573
b 15856.3
R2 0.9624
Harkin-Jura A 204.1
B 2.1151
R2 0.9418
Frenkel-Halsey-Hill 1/n 3.2235
K 6.4141×10⁻³
R2 0.9955
Adsorption Kinetics
Kinetic models describe the rate of adsorbate uptake on activated carbon. In order
to identify the potential rate-controlling steps involved in the process of adsorption, four
kinetic models were studied and used to fit the experimental data from the adsorption of

PEER-REVIEWED ARTICLE bioresources.com
Thilagavathy et al. (2014). “Cu(II) sorption by Acacia,” BioResources 9(3), 3805-3824. 3815
Cu(II)ion onto ZAN. These models are the pseudo-first-order, pseudo-second-order,
Elovich, and intra-particle kinetic models.
Pseudo-first-order kinetic model
The pseudo-first-order equation of Lagergren is generally expressed as follows
(Crini et al. 2007; Ozacar and Sengil 2005):
(14)
After integration and applying boundary conditions, t = 0 to t = t and qt = 0 to qt = qt; the
integrated form of the above equation becomes:
(
) (15)
However, Eq.15 transformed into its linear form for use in kinetic analyses of data can be
expressed as,
(16)
where qe (mg/g) and qt (mg/g) are the amount of adsorbed adsorbate at equilibrium and at
time t, respectively, and k1 (1/min) is the rate constant of pseudo-first-order adsorption.
Straight-line plots of log (qe − qt) against t of Eq.16 were created.
The data for the pseudo-first-order kinetic model of Cu(II) onto ZAN are
summarized in Table 3. To obtain the rate constants, the values of log (qe − qt) were
linearly correlated with time. The plots of log (qe-qt) versus time (t) indicated that the
data did not fit well to the first-order rate expression for Cu(II) ion since the coefficient of
determination was 0.4608. As presented in Table 3, the experimental value qe (exp) 11.44
mg/g for Cu(II) was not in agreement with the calculated qe value of 20.6395 mg/g,
indicating that the metal ion adsorption onto the AN cannot be represented by a first-
order kinetics.
Pseudo-second-order kinetic model
The rate of sorption was found to be consistent with a second-order model, and
the pseudo-second-order chemisorptions kinetic rate equation can be expressed as,
(17)
where qe and qt (mg/g) are the sorption capacities at equilibrium and at time t,
respectively, and k2 is the rate constant of pseudo-second-order sorption (g/mg/min). In
this equation, h can be regarded as the initial sorption rate as qt/t tends to zero, hence:
(18)
Equation 18 can be written as:

PEER-REVIEWED ARTICLE bioresources.com
Thilagavathy et al. (2014). “Cu(II) sorption by Acacia,” BioResources 9(3), 3805-3824. 3816
(19)
Equation 18 does not have the problem of assigning an effective qe. If pseudo-second-
order kinetics is applicable, then the plot of t/qt against t of Eq.19 should give a linear
relationship, from which qe, k, and h can be determined from the slope and intercept of
the plot, and there is no need to know any parameter. The qe and k2 values were estimated
from the slope (1/qe) and intercept (1/k2qe2) of the linear plot of t/qt versus t.
The data for the pseudo-second-order kinetic model of Cu(II) onto ZAN are
summarized in Table 3. The correlation coefficient for pseudo-second-order kinetic
model obtained was 0.9955, which was greater than for pseudo first- order model. In
addition, the experimental qe(exp) 11.44 mg/g values also agreed well with the calculated
qe value of 13.422 mg/g (see Table 4). This indicates that the adsorption system studied
belongs to the second-order kinetic model.
Intra-particle diffusion model
The adsorption of Cu(II) onto ZAN may be controlled via external film diffusion
at earlier stages and later by particle diffusion. The possibility of intra-particle diffusion
resistance was identified using the following intra-particle diffusion model (Weber and
Morris 1963),
√ (20)
where Kdiff is the intra-particle diffusion rate constant (mg/g.min1/2
) and C is the intercept.
The values of qt correlated linearly with the values of t1/2
and the rate constant Kdiff
directly calculated from the slope of the regression line. The data for the intra-particle
kinetic model of Cu(II) onto ZAN are summarized in Table 3.
The linearity of the plots demonstrated that intra-particle diffusion played a
significant role in the uptake of Cu(II) onto ZAN. The coefficient of determination was
0.9593, which indicates the linearity for the adsorption of Cu(II); however, Ho (2003) has
shown that if intra-particle diffusion is the sole rate-limiting step, it is essential for the
plot of qt versus t1/2
to pass through the origin, which was not the case. It may be
concluded that surface adsorption and intra-particle diffusion were concurrently operating
during the ZAN interactions. Hence, intra-particle diffusion is not a fully operative
mechanism in the sorption of Cu(II) onto ZAN.
Elovich kinetics
Elovich kinetics is another rate equation based on the adsorption capacity
generally expressed as follows,
(21)
where BE is the initial adsorption rate constant (mg (g/min)) and AE is the desorption
constant (g/mg) during any experiment. The expression can be simplified by assuming
AEBE>>t. By applying the boundary conditions qt = 0 at t = 0 and qt = t at t = t, Eq. 21
becomes:

PEER-REVIEWED ARTICLE bioresources.com
Thilagavathy et al. (2014). “Cu(II) sorption by Acacia,” BioResources 9(3), 3805-3824. 3817
(22)
If Cu(II) adsorption by ZAN fits the Elovich model, then a plot of qt versus ln(t)
should yield a linear relationship with a slope of (1/AE) and an intercept of (1/AE) ln
(AEBE). Thus, the constants can be obtained from the slope and intercept of the straight
line.
The constants obtained from the slope and intercept are shown in Table 3. The
parameter 1/AE is related to the number of sites available for adsorption, while (1/AE) ln
(AEBE) is the adsorption quantity when ln(t) is equal to zero, i.e., the adsorption quantity
when t is 1 min. This value is helpful in understanding the adsorption behavior of ZAN
(Weber 1963). In the case of using the Elovich equation, the coefficients of determination
were lower than those of the pseudo-second-order equation. The Elovich equation does
not predict any definite mechanism, but it is useful in describing adsorption on highly
heterogeneous adsorbents.
Fig. 6. Freunlich Isotherm of Cu(II) on ZAN Fig. 7. Pseudo second order kinetic model of
Cu(II) onto ZAN
Table 3. Kinetic Parameters for the Adsorption of Cu(II) onto ZAN
Kinetic Models Constants and Correlations Experimental Values
Pseudo-first-order
K1 (min) 0.0193
qe (mg g-1
) 20.6395
R2 0.3696
Pseudo-second-order
K2 (g mg-1
min-1
) 0.012
qe (mg g-1
) 13.422
R2 0.9458
Elovich equation
AE 2.1944
BE 8.8125
R2 0.8310
Intra-particle diffusion
Kdiff 1.2121
C 2.6771
R2 0.9554
y = 0.3088x + 0.8663 R² = 0.9955
0.0
0.2
0.4
0.6
0.8
1.0
1.2
1.4
1.6
0.0 0.5 1.0 1.5 2.0 2.5
logq
e
log ce
y = 0.0745x + 2.1508 R² = 0.9458
0
2
4
6
8
10
12
14
0 50 100 150
t/q
t
Time (min)
PEER-REVIEWED ARTICLE bioresources.com
Thilagavathy et al. (2014). “Cu(II) sorption by Acacia,” BioResources 9(3), 3805-3824. 3818
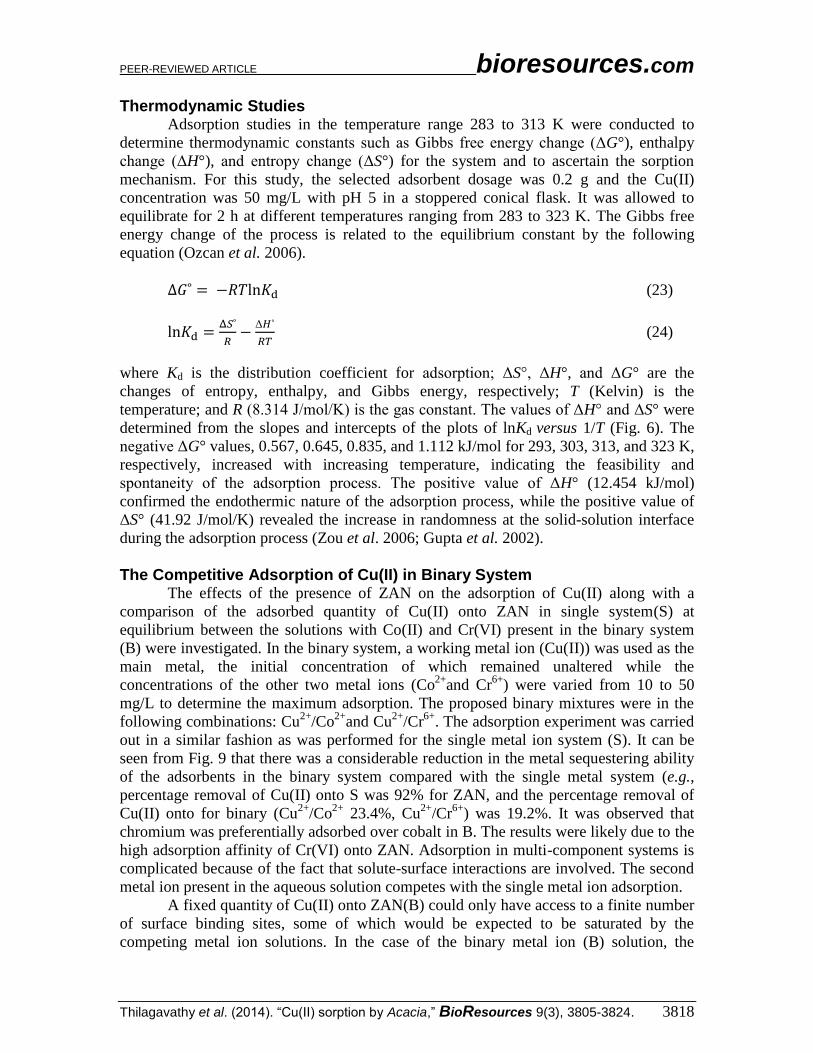
Thermodynamic Studies
Adsorption studies in the temperature range 283 to 313 K were conducted to
determine thermodynamic constants such as Gibbs free energy change (ΔG°), enthalpy
change (ΔH°), and entropy change (ΔS°) for the system and to ascertain the sorption
mechanism. For this study, the selected adsorbent dosage was 0.2 g and the Cu(II)
concentration was 50 mg/L with pH 5 in a stoppered conical flask. It was allowed to
equilibrate for 2 h at different temperatures ranging from 283 to 323 K. The Gibbs free
energy change of the process is related to the equilibrium constant by the following
equation (Ozcan et al. 2006).
(23)
Δ
(24)
where Kd is the distribution coefficient for adsorption; ΔS°, ΔH°, and ΔG° are the
changes of entropy, enthalpy, and Gibbs energy, respectively; T (Kelvin) is the
temperature; and R (8.314 J/mol/K) is the gas constant. The values of ΔH° and ΔS° were
determined from the slopes and intercepts of the plots of lnKd versus 1/T (Fig. 6). The
negative ΔG° values, 0.567, 0.645, 0.835, and 1.112 kJ/mol for 293, 303, 313, and 323 K,
respectively, increased with increasing temperature, indicating the feasibility and
spontaneity of the adsorption process. The positive value of ΔH° (12.454 kJ/mol)
confirmed the endothermic nature of the adsorption process, while the positive value of
ΔS° (41.92 J/mol/K) revealed the increase in randomness at the solid-solution interface
during the adsorption process (Zou et al. 2006; Gupta et al. 2002).
The Competitive Adsorption of Cu(II) in Binary System The effects of the presence of ZAN on the adsorption of Cu(II) along with a
comparison of the adsorbed quantity of Cu(II) onto ZAN in single system(S) at
equilibrium between the solutions with Co(II) and Cr(VI) present in the binary system
(B) were investigated. In the binary system, a working metal ion (Cu(II)) was used as the
main metal, the initial concentration of which remained unaltered while the
concentrations of the other two metal ions (Co2+
and Cr6+
) were varied from 10 to 50
mg/L to determine the maximum adsorption. The proposed binary mixtures were in the
following combinations: Cu2+
/Co2+
and Cu2+
/Cr6+
. The adsorption experiment was carried
out in a similar fashion as was performed for the single metal ion system (S). It can be
seen from Fig. 9 that there was a considerable reduction in the metal sequestering ability
of the adsorbents in the binary system compared with the single metal system (e.g.,
percentage removal of Cu(II) onto S was 92% for ZAN, and the percentage removal of
Cu(II) onto for binary (Cu2+
/Co2+
23.4%, Cu2+
/Cr6+
) was 19.2%. It was observed that
chromium was preferentially adsorbed over cobalt in B. The results were likely due to the
high adsorption affinity of Cr(VI) onto ZAN. Adsorption in multi-component systems is
complicated because of the fact that solute-surface interactions are involved. The second
metal ion present in the aqueous solution competes with the single metal ion adsorption.
A fixed quantity of Cu(II) onto ZAN(B) could only have access to a finite number
of surface binding sites, some of which would be expected to be saturated by the
competing metal ion solutions. In the case of the binary metal ion (B) solution, the

PEER-REVIEWED ARTICLE bioresources.com
Thilagavathy et al. (2014). “Cu(II) sorption by Acacia,” BioResources 9(3), 3805-3824. 3819
binding sites were competitively divided among the various metal solutions (Filipovic-
Kovacevic et al. 2000; Sheng et al. 2007).
Fig. 8. Effect of temperature of Cu(II) on Fig. 9. Adsorption of Cu(II) onto ZAN in binary ZAN metal systems
Results of Column Experiment Effect of flow rate
Experiments were performed where the flow rates were 1 to 5 mL/min and the
thickness of the adsorbent was 3 mm. As depicted in Fig. 10, the lower the flow rate, the
higher the Cu(II) removal. This is due to the greater contact time when the flow rate is
low.
Effect of bed thickness
The removal of Cu(II) by Acacia nilotica was in a fixed bed composite of
different thickness of ZAN (amount) at a constant flow rate of 1 mL/min. As shown in
Fig. 11, increasing the thickness of the fixed bed layer increased the uptake of Cu(II)
ions.
Fig. 10. The effect of flow rate (mL/min) on Fig. 11. The effect of layer thickness on amount of Cu(II) adsorbed onto ZAN amount of Cu(II) on adsorbed onto ZAN
0.0
0.1
0.2
0.3
0.4
0.5
0.6
0.7
0.8
0.9
1.0
0.0031 0.0032 0.0033 0.0034 0.0035 0.0036
Ko
1/T (Kelvin)-1
0
10
20
30
40
50
60
70
80
90
100
0 2 4 6
% A
dso
rpti
on
conc (mg/L)
Cu- Cr Cu-Co
0
10
20
30
40
50
60
70
80
90
100
0 1 2 3 4 5 6
% R
em
ov
al
Flow rate (mL/min)
0
10
20
30
40
50
60
70
80
90
100
0 1 2 3 4
% R
em
ov
al
Layer thickness (mm)

PEER-REVIEWED ARTICLE bioresources.com
Thilagavathy et al. (2014). “Cu(II) sorption by Acacia,” BioResources 9(3), 3805-3824. 3820
Increasing the fixed bed layer increased the amount of available interaction sites
for adsorption of Cu(II) ions on the composite and provided a thicker layer. The
efficiency was increased by allowing sufficient time for the adsorbate to diffuse into the
adsorbent. When the thickness of the layer of the composite was increased from 0.5 mm
to 3 mm, the percentage removal increased from 36% to 76%. Compared with its
efficiency in batch mode, the prepared adsorbent displayed the advantage of separation
convenience when a fixed bed column was used. This is because the chromium anions
were forced to interact with the active adsorbing sites on the large surface area during
penetration.
Suitability of ZAN in Industrial Wastewater
Industrial wastewater was collected locally from a metal finishing factory in
Vangepalayam (India). Adsorption was carried out in the wastewater with ZAN to
remove the toxic metal from water. The effect of pH, adsorption dosage, and desorption
were investigated. The initial pH values were adjusted in the range of 1 to 10 before the
addition of the adsorbent. Figure 12 shows that the adsorption was highly pH dependent.
The maximum uptake was obtained at pH 5 (80%) and decreased gradually. The
optimum pH value (5) was adjusted for further experiments.
The effect of changing the adsorbent dosage on the adsorption rate of industrial
wastewater was studied by varying the concentration of the sorbent from 0.4 to 1 g, while
keeping the other experimental conditions constant. The percentage removal versus
adsorbent dosage is shown in Fig. 13. An increase in the percentage of adsorption with
increasing adsorbent dosage was observed. Desorption studies help to elucidate one
mechanism of adsorption as well as recovery of the adsorbate and adsorbent. The
maximum desorption of ZAN from industrial wastewater is shown in Fig. 12. The results
suggest that the recovery of metal from the adsorbent was possible and that a packed bed
system made the process more feasible.
Fig. 12. Percentage of adsorption and Fig. 13. Effect of sorbent dose on the desorption adsorption of industrial wastewater onto ZAN
Desorption and Regeneration Studies Sorption of solute on any sorbent can either be by physical bonding, ion
exchange, or a combination of both. If the adsorption is by physical bonding, then the
loosely bound solute can be easily desorbed with distilled water in most cases. However,
if the mode of sorption is by chemical bonding, ion exchange, or a combination of both,
then desorption can be affected by stronger desorbents such as acid or alkali solutions. In
0
10
20
30
40
50
60
70
80
90
0 5 10 15
% R
em
ova
l of(
Cu
II)
pH
% Adsorption
% desorption
0
5
10
15
20
25
30
35
0.2 0.4 0.6 0.8 1 1.2
% R
em
ov
al o
f C
u(I
I)
Adsorbent Dose (mg/g)

PEER-REVIEWED ARTICLE bioresources.com
Thilagavathy et al. (2014). “Cu(II) sorption by Acacia,” BioResources 9(3), 3805-3824. 3821
order to investigate adsorption of Cu(II) ions from metal-loaded ZAN, the metal-loaded
adsorbent was treated with HCl. Desorption studies were performed with different
hydrochloric acid concentrations. The recovery percentage was obtained from the
following equation (Zhao et al. 1999; Arica et al. 2003; Johnson et al. 2008):
(25)
where the “desorbed” is the concentration and/or the mass of metal ions after desorption
and the “adsorbed” is equal to (Co–Ce) and/or (mo–me) for each recovery process; mo and
me are the masses of heavy metals in the aqueous solution before and after adsorption,
respectively. Maximum desorption of Cu(II) from the spent adsorbent was 73%, which
was achieved using 0.2 N HCl. These results indicate that ZAN adsorbent can be used
repeatedly in Cu(II) adsorption to keep the process costs down.
Table 4. Desorption Data of Cu(II)
Adsorbent
Initial conc. Cu(II)(mg/L)
Removal efficiency
Desorption
a with HCl
0.05 Nb 0.1 N
b 0.2 N
b 0.3 N
b
ZAN
50
81 59
65
73
67
100
79 54
50
67
53
150
67
43
36
46
42
200
59
35
31
42
37
a All values are percent recovery of copper;
b Concentration of HCl
Comparison of Different Adsorbents for Cu(II) Adsorption Table 5 presents a comparison of several adsorbents employed for Cu(II)
adsorption. As can be seen, the adsorbent ZAN employed in this work presented very
high adsorption capacities for Cu(II) when compared with several other adsorbents. Out
of 11 different adsorbents, ZAN presented a higher sorption capacity for Cu(II) than the
remaining 10. It should be stressed that Table 5 is not a comprehensive table, in that there
is a possibility of a non-listed adsorbent presenting a higher sorption capacity than those
reported in this work. On the other hand, the outstanding sorption capacities for Cu(II)
places Acacia nilotica as one of the best adsorbents for copper ion removal from aqueous
solutions.
Table 5. Maximum Capacities of Copper(II) Ions Adsorption by Various Biosorbents*
Adsorbents qm (mg/g) Adsorbents qm (mg/g) Bengal gram husk 25.73 Sugar beet pulp 30.90 Banana peel 4.75 Coconut husk 3.07 Coir pith 10.22 Sago industry waste 12.40 Coco shell 2.87 Cassava tuber bark waste 54.21 Tea wastes(binary system) 6.65 Orange peel 3.65
Raw Acacia nilotica leaf 27.2 Treated Acacia nilotica (this study) 35.46
*Johnson et al. 2008
PEER-REVIEWED ARTICLE bioresources.com
Thilagavathy et al. (2014). “Cu(II) sorption by Acacia,” BioResources 9(3), 3805-3824. 3822
CONCLUSIONS
1. The present study showed that activated carbon prepared from Acacia nilotica leaf
can be an effective adsorbent for the removal of Cu(II) from aqueous solutions. The
adsorption process is dependent on the initial time, pH, dose, concentration, and
temperature.
2. The Freundlich isotherm model gave a better fit than other isotherms for interpreting
the adsorption phenomenon of Cu(II). The Cu(II) adsorption system followed a
pseudo-second-order kinetic model.
3. The Cu(II) adsorption rate onto ZAN was greater in a single system (S) than in a
binary system (B), due to the competitive adsorption of metal ion onto the active sites
of the activated carbon.
4. In column studies, the removal efficiency of Cu(II) ions was lower than batch mode
studies for ZAN, but the time taken for adsorption was less.
5. Desorption of Cu(II) from the spent adsorbent was achieved with 0.2 N HCl. The use
of Acacia nilotica as an adsorbent seems to be an economical and worthwhile
alternative compared to conventional methods for the removal of Cu(II) from aqueous
solutions and industrial wastewater.
REFERENCES CITED Acemioglu, B. (2004). “Adsorption of congo red from aqueous solution onto calcium-
rich fly ash,” J. Colloid Inter. Sci. 274(2), 371-379.
Ahmadpour, A., and Do, D. D. (1997). “The preparation of activated carbon from
macadamia nutshell by chemical activation,” Carbon 35(12), 1723-1732.
Algarra, M., Victoria Jiménez, M., Rodriguez-Castellón, E., Jiménez-López, A., and
Jiménez-Jiménez, J. (2005). “Heavy metals removal from electroplating wastewater
by aminopropyl-Si MCM-41,” Chemosphere 59(6), 779-786.
Arica, M. Y., Arpa, C., Kaya, B., Bektaş, S., Denizli, A., and Genç, O. (2003).
“Comparative biosorption of mercuric ions from aquatic systems by immobilized live
and heat-inactivated Trametes versicolor and Pleurotussajur-caju,” Bioresour.
Technol. 89(2), 145-154.
Boehm, H. P. (2002). “Surface oxides on carbon and their analysis: A critical
assessment,” Carbon 40(2), 145-149.
Carrasquero-Duran, A., and Flores, I. (2009). “Evaluation of lead (II) immobilization by
a vermicomposting adsorption isotherms and IR spectroscopy,” Biores. Technol.
100(4), 1691-1694.
Crini, G., Peindy, H. N., Gimbert, F., and Robert, C. (2007). “Removal of C.I. Basic
Green 4 (Malachite Green) from aqueous solutions by adsorption using cyclodextrin-
based adsorbent: Kinetic and equilibrium studies,” Sep. Purif. Technol. 53(1), 97-110.
Dogan, M., Alkan, M., and Onganer, Y. (2000). “Adsorption of methylene blue from
aqueous solution onto perlite,” Water, Air and Soil Poll. 120(3-4), 229-249.
Dundar, M., Nuhoglu, C., and Nuhoglu, Y. (2008). “Biosorption of Cu(II) ions onto the
litter of natural trembling poplar forest,” J. Hazard. Mater. 151(1), 86-95.

PEER-REVIEWED ARTICLE bioresources.com
Thilagavathy et al. (2014). “Cu(II) sorption by Acacia,” BioResources 9(3), 3805-3824. 3823
Foo, K. Y., and Hameed, B. H. (2010). “Insights into the modeling of adsorption
isotherm systems,” Chem. Eng. J. 156(1), 2-10.
Freundlich, H. (1906). “Über die Adsorption in Lösungen (Adsorption in solutions),” J.
Phys. Chem. 57, 384-470.
Gupta, V. K., Mangla, R., and Agarwal, S. (2002). “Pb(II) selective potentiometric sensor
based on 4-tert-butylcalix[4]arene in PVC matrix,” Electroanalysis 14(15-16), 1127-
1132.
Hayashi, J., Kazehaya, A., Muroyama, K., and Watkinson, A. P. (2008). “Preparation of
activated carbon from lignin by chemical activation,” Carbon 38(13), 1873-1878.
Ho, Y. S. (2003). “Removal of copper ions from aqueous solution by tree fern,” Water
Res. 37(10), 2323-2330.
Ho, Y. S., and McKay, G. (2004). “Sorption of copper(II) from aqueous solution by
peat,” Water, Air, and Soil Pollution 158(1), 77-97.
Ho, Y. S., Huang, C. T., and Huang, H. W. (2002). “Equilibrium sorption isotherm for
metal ions on tree fern,” Process Biochem. 37(12), 1421-1430.
Hobson, J. P. (1969). “Physical adsorption isotherms extending from ultrahigh vacuum to
vapor pressure,” J. Phys. Chem. 73(8), 2720-2727.
Janos, P., Buchtova, H., and Ryznarova, M. (2003). “Sorption of dye from aqueous
solution onto fly ash,” Water Res. 37(20), 4938-4944.
Johnson, T. A., Jain, N., Joshi, H. C., and Prasad, S. (2008).“Agricultural and agro
processing wastes as low cost adsorbents for metal removal from waste water: A
review,” J. Sci. Ind. Res. 67, 647-658.
Kadirvelu, K., Thamaraiselvi, K., and Namasivayam, C. (2001). “Removal of heavy
metal from industrial wastewaters by adsorption onto activated carbon prepared from
an agricultural solid waste,” Biores. Technol. 76(1), 63-65.
Kalavathy, M. H., Karthikeyan, T., Rajgopal, S., and Miranda, L. R. (2005). “Kinetic and
isotherm studies of Cu(II) adsorption onto H3PO4-activated rubber wood sawdust,” J.
Colloid Interface Sci. 292(2), 354-362.
Karim, M. M., Das, A. K., and Lee, S. H. (2006). “Treatment of colored effluent of the
textile industry in Bangladesh using zinc chloride treated indigenous activated
carbons,” J. Analitica Chimica Acta 576(1), 37-42.
Khalid, N., Ahmad, S., Toheed, A., and Ahmed, J. (2000). “Potential of rice husks for
antimony removal,” Appl. Radiat. Isot. 52(1), 31-38.
Khalili, N. R., Campbell, M., Sandi, G., and Golas, J. (2000). “Production of micro- and
mesoporous activated carbon from paper mill sludge: I. Effect of zinc chloride
activation,” Carbon 38(14), 1905-1915.
King, P., Srivinas, P., Prasanna Kumar, Y., and Prasad, V. S. R. K. (2006). “Sorption of
copper(II) ion from aqueous solution by Tectona grandis l.f. (teak leaves powder),” J.
Hazard. Mater. 136(3), 560-566.
Kinniburgh, D. G. (1986). “General purpose adsorption isotherms,” Environ. Sci.
Technol. 20(9), 895-904.
Krishnan, K. A., and Anirudhan, T. S. (2002). “Removal of mercury(II) from aqueous
solutions and chlor-alkali industry effluent by steam activated and sulphurised
activated carbons prepared from bagasse pith: Kinetics and equilibrium studies,” J.
Hazard. Mater. 92(2), 161-183.
Kumar, A., Prasad, B., and Mishra, I. M. (2008). “Adsorptive removal of acryloinitrile by
commercial grade activated carbon: Kinetics, equilibrium and thermodynamics,” J.
Hazard. Mater. 152(2), 589-600.

PEER-REVIEWED ARTICLE bioresources.com
Thilagavathy et al. (2014). “Cu(II) sorption by Acacia,” BioResources 9(3), 3805-3824. 3824
Langmuir, I. (1918). “The adsorption of gases on plane surfaces of glass, mica and
platinum,” J. Am. Chem. Soc. 40(9), 1361-1403.
Langmuir, I. (1916). “The constitution and fundamental properties of solids and liquids.
Part 1. Solids,” J. Am. Chem. Soc. 38(11), 2221-2295.
Larous, S., Meniai, A. H., and Bencheikh Lehocine, M. (2005). “Experimental study of
the removal of copper from aqueous solutions by adsorption using sawdust,”
Desalination 185(1-3), 483-490.
Longhinotti, E., Pozza, F., Furlan, L., Sanchez, M. N. M., Klug, M., Laranjeira, M. C.
M., and Favere, V. T. (1998). “Adsorption of anionic dyes on the biopolymer chitin,”
J. Braz. Chem. Soc. 9(5), 435-440.
Nadeem, M., Mahmood, A., Shahid, S. A., Shah, S. S., Khalid, A. M., and McKay, G.
(2006). “Sorption of lead from aqueous solution by chemically modified carbon
adsorbents,” J. Hazard. Mater. 138(3), 604-613.
Ozacar, M., and Sengil, I. A. (2005). “A kinetic study of metal complex dye sorption onto
pine sawdust,” Process Biochem. 40(2), 565-572.
Ozcan, A., Oncu, E. M., and Ozcan, A. S. (2006). “Kinetics, isotherm and
thermodynamic studies of adsorption of acid blue 193 from aqueous solutions onto
natural sepiolite,” Colloids Surf. A 277(1-3), 90-97.
Prasad, M. N. V., and Freitas, H. (2000). “Removal of toxic metals from solution by leaf,
stem and root phytomass of Quercus ilex L. (holly oak),” Environ. Pollut. 110(2),
277-283.
Puranik, P. R., and Paknikar, K. M. (1999). “Biosorption of lead, cadmium and zinc by
citrobacter strain MCMB-181: Characterization studies,” Biotechnol. Progress. 15(2),
228-237.
Reddy, B. R., Mirghaffari, N., and Gaballah, I. (1997). “Removal and recycling of copper
from aqueous solutions using treated Indian barks,” Resour. Conserv. Recycl. 21(4),
227-245.
Sheng, P. X., Ting, Y. P., and Chen, J. P. (2007). “Biosorption of heavy metal ions (Pb,
Cu, and Cd) from aqueous solution by the marine alga Sargassum sp. in single- and
multiple-metal systems,” Ind. Eng. Chem. Res. 46(8), 2438-2444.
Shukla, S. R., and Pai, R. S. (2005). “Adsorption of Cu(II), Ni(II) and Zn(II) on dye
loaded groundnut shells and sawdust,” Sep. Purif. Technol. 43(1), 1-8.
Temkin, M. J., and Pyzhev, V. (1940). “Recent modifications to Langmuir isotherms,”
Acta Physiochim. URSS 12, 217-222.
Weber, W. J., and Morris, J. C. (1963). “Kinetics of adsorption on carbon from solution,”
J. Sanity Eng. Divi. Amer. Soc. Civil Eng. 89(2), 31-59.
Wong, K. K., Lee, C. K., Low, K. S., and Haron, M. J. (2003). “Removal of Cu and Pb
by tartaric acid modified rice husk from aqueous solutions,” Chemosphere 50(1), 23-
28.
Zhao, M., Duncan, J. R., and van Hille, R. P. (1999). “Removal and recovery of zinc
from solution and electroplating effluent using Azolla filiculoides,” Wat. Res. 33(6),
1516-1522.
Zou, W. H., Han, R. P., Chen, Z. Z., Shi, J., and Liu, H. M. (2006). “Characterization and
properties of manganese oxide coated zeolite as adsorbent for removal of copper(II)
and lead(II) ions from solution,” J. Chem. Eng. Data. 51(2), 534-541.
Article submitted: January 21, 2014; Peer review completed: April 22, 2014; Revised
version received: April 24, 2014; Accepted: April 30, 2014; Published: May 7, 2014.