studies on filtration of fermentation wastewater using …€¦ · · 2012-05-02studies on...
TRANSCRIPT
Studies on Filtration of Fermentation Wastewater Using Sand-Carbon Filter
George Munyori, Gbekeloluwa Oguntimein
Department of Civil Engineering, Morgan State University Abstract Biofuels production from cellulosic materials as carbohydrate source is being investigated as one
of the alternatives to the solution of the energy problem. One of the potential processes involves
simultaneous hydrolysis and fermentation. The wastewater from such process must be treated
before being released to the environment. In order to make the process even more economical
and environmentally friendly, the wastewater needs to be treated and recycled. This study is
investigating the use of rapid sand -carbon filter in the reduction of organic materials and salt in
the wastewater from a fermentation process. The filtration rate, conductivity and absorbance
were monitored as wastewater was run through the system. The rate of filtration dropped as more
wastewater was filtered. This suggests that clogging was taking place in the system as more
wastewater was filtered. The absorbance at 570nm and 280nm of the filtrate decreased which
suggests that the system was able to filter the wastewater and achieve a significant treatment
level. Different filter setups and filter media will be studied in order to improve the filtration
efficiency and filtrate quality.
Introduction With oil and gas prices fluctuating, there is a need to reduce the dependence on fossil fuels.
Environmental issues related to fossil fuels also add another dimension to the problem and hence
alternative sources to these fuels are being explored. One of the alternative sources coming up is
ethanol. Ethanol is produced by microbial fermentation of sugar. Two major components of
plants, starch and cellulose, are both made up of sugars, and can in principle be converted to
sugars for fermentation. Currently, only the sugar (e.g. sugar cane) and starch (e.g. corn) portions
can be economically converted.
C6H12O6 2CH3CH2OH + 2CO2 (yeast) under anaerobic conditions
Fermentation by microorganism
In order to produce adequate ethanol to meet the fuel needs, much corn will be needed and this
will tend to hurt food and feed supply and prices. Therefore the need for research into alternative
carbohydrate sources. A microorganism has been discovered from Chesapeake Bay that is
capable of metabolizing almost a variety of organic material. This microbe S. degradan is being
investigated to degrade biomass in a bio-reactor to produce ethanol by a start-up company on the
University of Maryland College Park campus, Zymetis Inc. Various biomass including
newsprint, agriculture byproducts such as corn stover are being studied as feed in a bioreactor
with nutrients in form of salts for their growth. The products of the process are sugars, ethanol,
metabolites, water and nutrients. Ethanol is separated through distillation and degraded solids
(trash) through centrifuge. The remaining solution contains water, dissolved organics (proteins,
sugars), salts (nutrients) and small amount of suspended solids (trash). In order to make the
process of ethanol production even more economical and environmentally friendly, the
wastewater needs to be treated recycled.
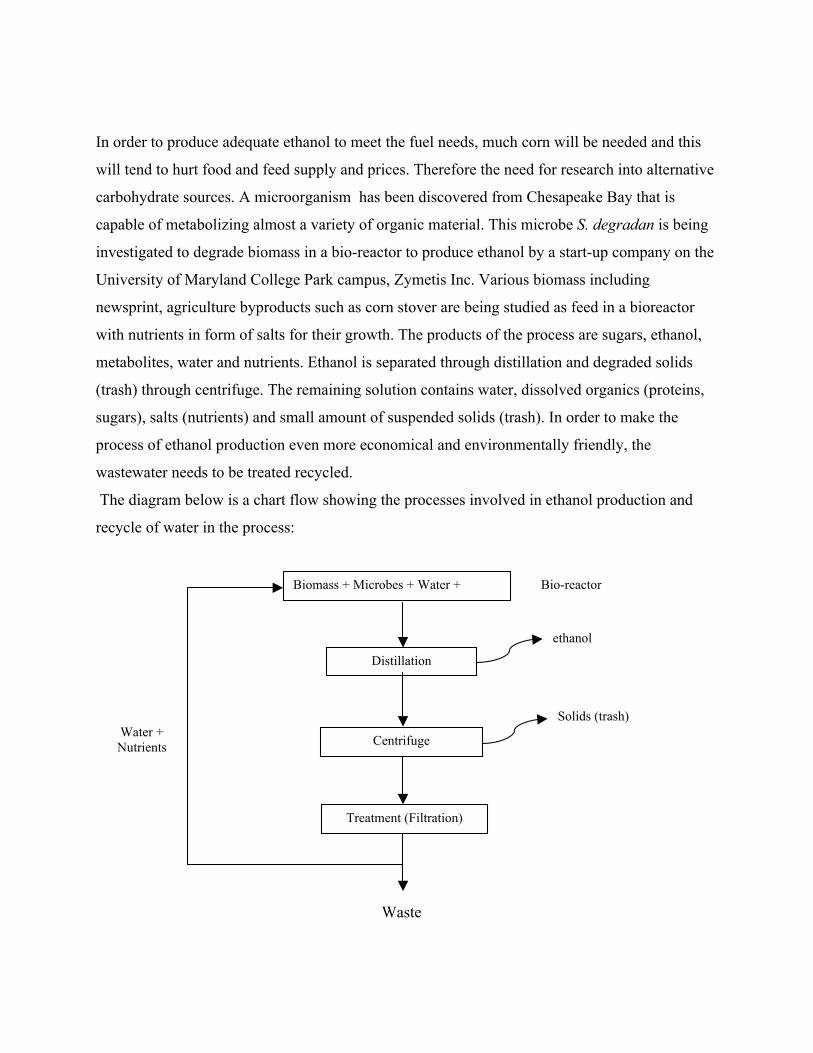
The diagram below is a chart flow showing the processes involved in ethanol production and
recycle of water in the process:
Biomass + Microbes + Water + Nutrients
Distillation
Centrifuge
Treatment (Filtration)
Waste
Bio-reactor
Water + Nutrients
ethanol
Solids (trash)
The objective of this study is to investigate the use of a sand filter in treating the wastewater
(fermentation effluent) in order to recycle the water to the process. In other words, the system
should be able to remove a significant amount of dissolved organics (proteins) so that the filtrate
contains only salts (nutrients).
Background
Sand Filters
Sand filters are generally easy to design and construct and also easy to maintain. Most energy is
only required in cleaning (backwashing) process.
Slow sand filters have the capability to achieve a certain level of organic removal but have
limitations in their design and operation:
• Due to the low loading rates, significantly large areas for filtration are required
• The biofilm formed on top of the filter, poses an environmental challenge when it
comes to disposal
• Slow sand filters need to be enclosed during winter to maintain conducive
temperatures and also need to be covered during sunny seasons to avoid excessive
growth of the biofilm.
Rapid sand filters prove superior over slow sand filters in that:
• the can treat more capacity at a time
• they have no weather or season restrictions
They however cannot remove dissolved organics since their mode of treatment is primarily
physical. Incorporating activated carbon in the system makes removal of some degree of
organics and odor possible. Such a system may achieve the kind of treatment level required to
recycle the wastewater from ethanol production.
Sand as a filter medium is characterized by the particle size and uniformity coefficient which
influence the porosity and hence filtration rate through the filter. Particle size and uniformity
coefficient are both established through a sieve analysis process. The particle size is the effective
size (ES) which is defined by the size of screen opening where 90 % of a sample of granular
media is retained on the screen and 10 % passes through the screen, and is referred to as D10. The
larger the grain size, the faster the wastewater moves through the sand and the more wastewater
that can be filtered. However, if the grain size is too large, treatment efficiency will be reduced
due to short retention times.
Uniformity coefficient (Uc) is a numeric estimate of how sand is graded and is dimensionless.
Sand with all the particles in two size ranges would have a low Uc while sand with near equal
proportions in all the fractions would have a high Uc value. The Uc is calculated by dividing D60
(the size of screen opening where 60% of a sample passes and 40% is retained) by D10. The idea
is that the sand grains should be about the same size i.e. relatively uniform. A uniformity
coefficient of 1.5 or less is recommended, the intention being to avoid clogging at higher loading
rates. If the grain sizes vary greatly, the smaller ones will fill the spaces between the larger
particles and clogging will easily occur.
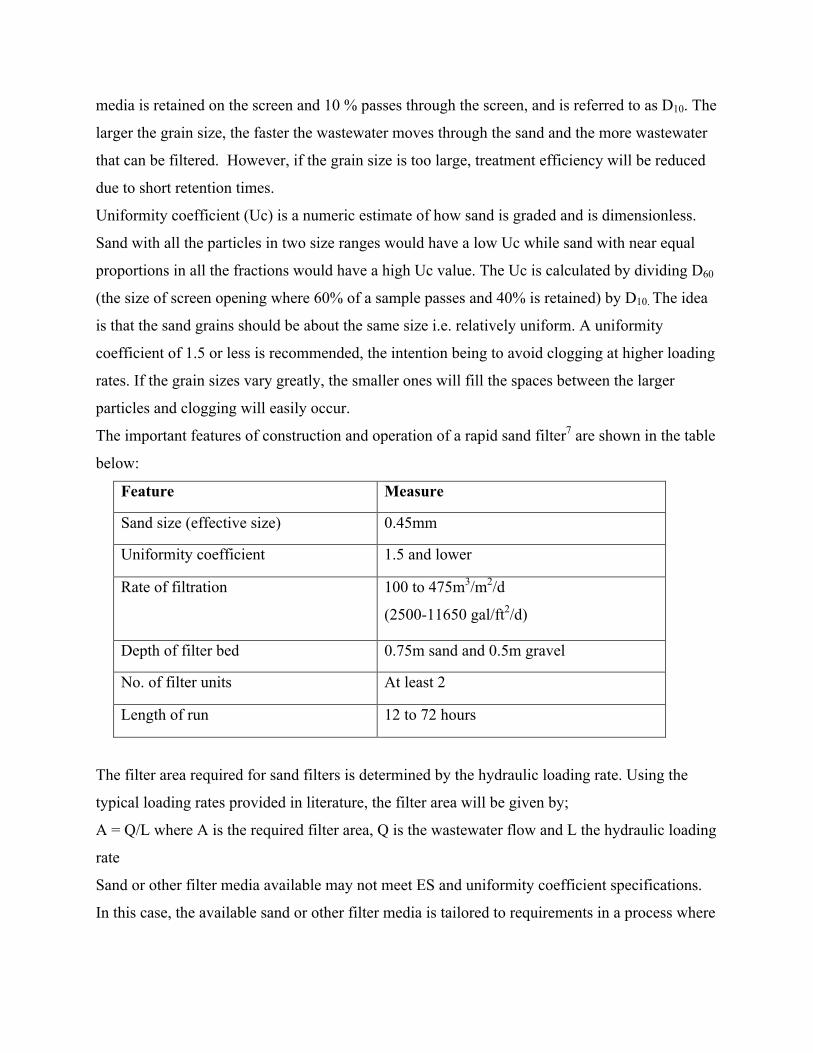
The important features of construction and operation of a rapid sand filter7 are shown in the table
below:
Feature Measure
Sand size (effective size) 0.45mm
Uniformity coefficient 1.5 and lower
Rate of filtration 100 to 475m3/m2/d
(2500-11650 gal/ft2/d)
Depth of filter bed 0.75m sand and 0.5m gravel
No. of filter units At least 2
Length of run 12 to 72 hours
The filter area required for sand filters is determined by the hydraulic loading rate. Using the
typical loading rates provided in literature, the filter area will be given by;
A = Q/L where A is the required filter area, Q is the wastewater flow and L the hydraulic loading
rate
Sand or other filter media available may not meet ES and uniformity coefficient specifications.
In this case, the available sand or other filter media is tailored to requirements in a process where
unacceptable particle sizes (too fine and too coarse) are removed through sieving and passing
water in an upflow direction.
Activated Carbon
Activated carbon is produced by burning carbon rich materials such as coal, wood or nut shells. .
It is either steam or chemically activated to further develop its internal pore structure. The idea is
to make it make it extremely porous and thus to have a very large surface area available for
adsorption or chemical reactions. There are two principal mechanisms by which activated carbon
removes contaminants from water; adsorption, and catalytic reduction, a process involving the
attraction of negatively-charged contaminant ions to the positively-charged activated carbon.
Organic compounds are removed by adsorption. Activated carbon filters require very little
maintenance, however, it is very important to ensure that filter replacement schedules are
followed to ensure proper filtration at all times. The two most important factors affecting the
efficiency of activated carbon filtration are the amount of activated carbon in a unit and the
amount of time the contaminant spends in contact with it. The more carbon there is, the better the
efficiency. Particle size also affects contaminant removal rates.
The effectiveness of activated carbon is measured by the adsorbing ability offered by the degree
of microporosity. The size of a granular activated carbon system is based on the contact time,
hydraulic loading rate, carbon depth and number of units. Some typical design values7 are as
follows;
Contact time 2-10 min Hydraulic loading rate 8-10m/h Carbon depth 2-3m No. of contactors ≥2 in parallel
Materials and Methods
Theactivatedcarbon,Sand–quartz(0.6‐1.2mmsize),Peagravel(5mmsize)andfilterwoolwereall
commercialgradeobtainedfromalocalpetstore.AbsorbancewasmeasuredwithaSpectronicGenesys
5spectrometerandconductivitywasmeasuredwithAccumetAR20pH/conductivitymeter.
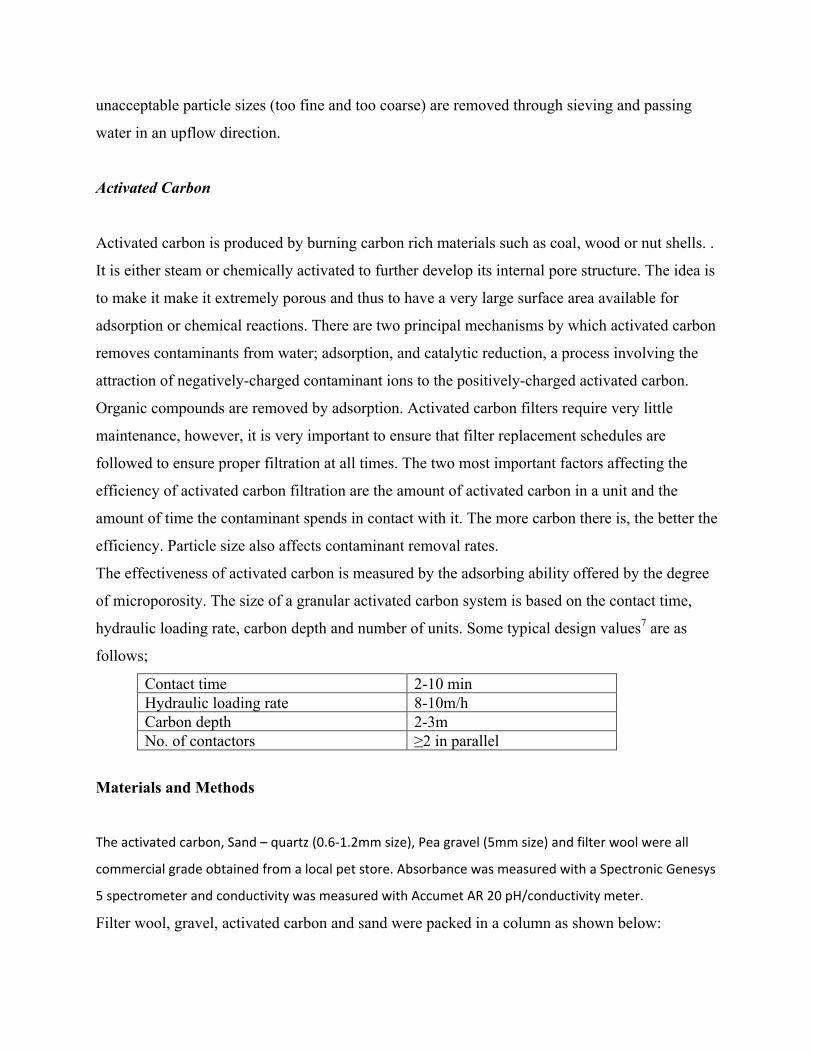
Filter wool, gravel, activated carbon and sand were packed in a column as shown below:
There column contained 80mm sand, 60mm activated carbon and 50mm gravel
These measurements were derived from typical design values for sand and activated carbon
beds7. The filtration area was 2826mm2. Wastewater was run through the column in 300ml
portions. A constant head of 20mm was maintained above the sand. The filtration rate was
estimated by collecting known volume at 5minute interval.
The spectrometer was zeroed with distilled water and the absorbance for each of the filtrate
collected for each run was measured, at 570nm and 280nm wavelength. The absorbance of the
original wastewater was also measured.
The conductivity for the filtrates and wastewater was measured using KCl as the standard
Results
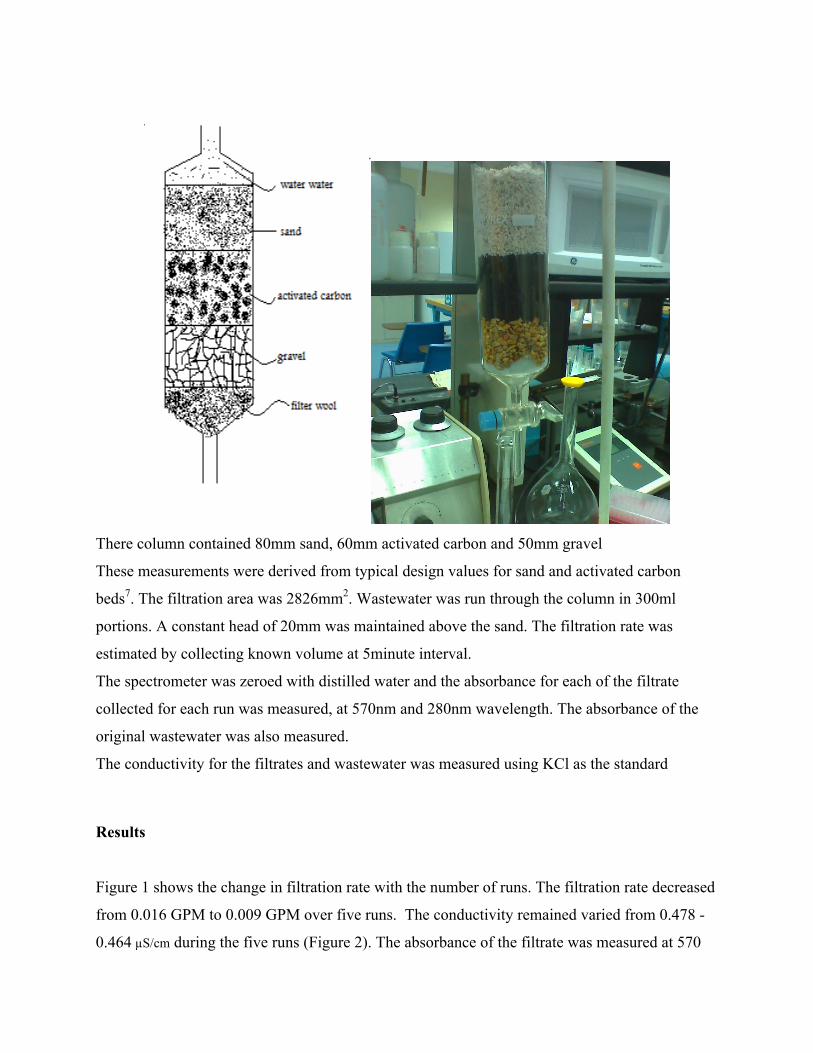
Figure 1 shows the change in filtration rate with the number of runs. The filtration rate decreased
from 0.016 GPM to 0.009 GPM over five runs. The conductivity remained varied from 0.478 -
0.464 µS/cm during the five runs (Figure 2). The absorbance of the filtrate was measured at 570
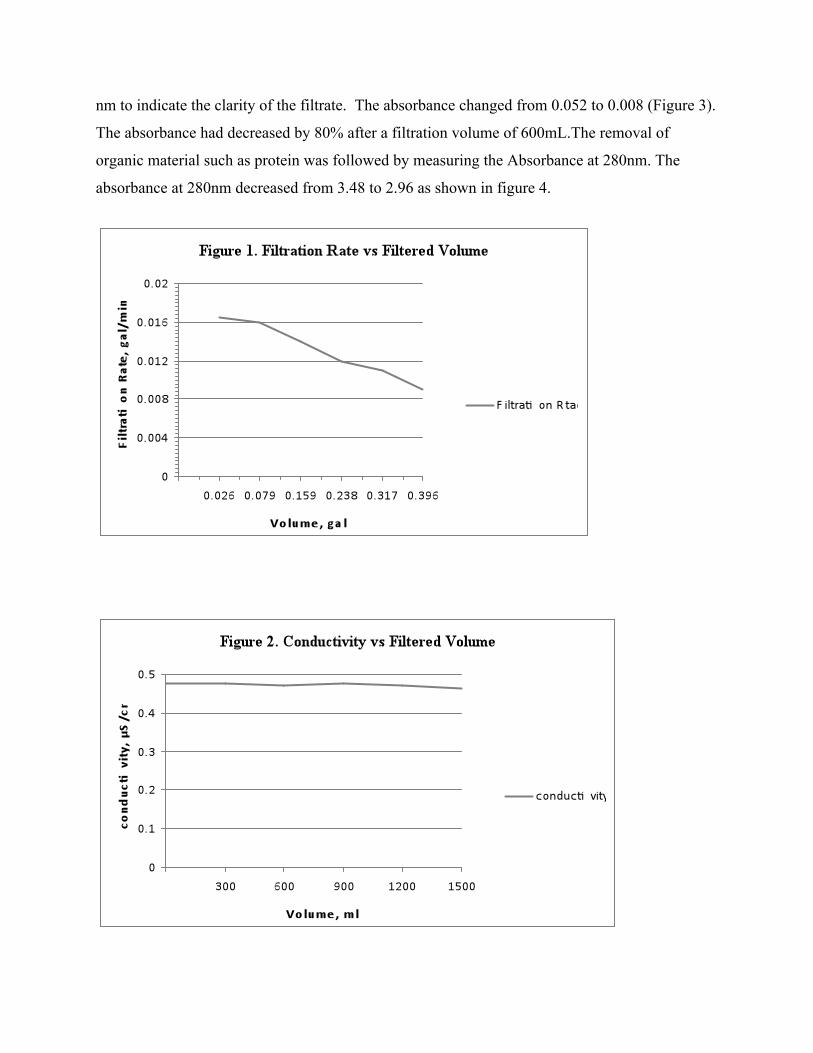
nm to indicate the clarity of the filtrate. The absorbance changed from 0.052 to 0.008 (Figure 3).
The absorbance had decreased by 80% after a filtration volume of 600mL.The removal of
organic material such as protein was followed by measuring the Absorbance at 280nm. The
absorbance at 280nm decreased from 3.48 to 2.96 as shown in figure 4.
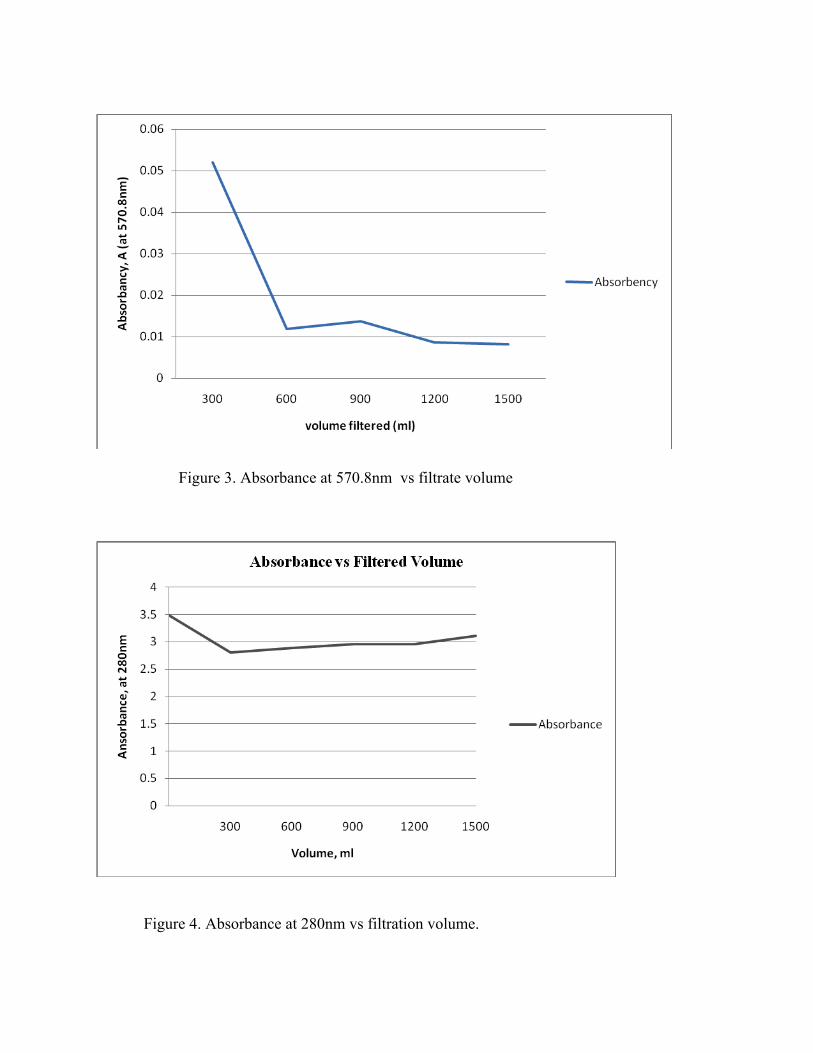
Figure 3. Absorbance at 570.8nm vs filtrate volume
Figure 4. Absorbance at 280nm vs filtration volume.
Discussion
By visual observation, the filtrate collected was clearer than the wastewater. The odor had also
been greatly reduced to unobjectionable levels. The filtration rate tends to decrease as more
wastewater goes through the filter media. This is an indication of clogging taking place as more
solids are trapped within the sand and therefore backwashing is required at the point when rate is
too low. Conductivity does not show significant difference as filtration progresses. Conductivity
is a measure of ionic compounds dissolved in water. In view of this, the interpretation is that the
filtrate contains almost the same amount of dissolved salts as the original wastewater.
The absorbance of the filtrate from each run and for the wastewater shows a significant
difference. Absorbance at 280nm measures the concentration of protein in a solution. Proteins in
solution absorb ultraviolet light with absorbance maxima at 280 and 200 nm. Amino acids with
aromatic rings are the primary reason for the absorbance peak at 280 nm. Peptide bonds are
primarily responsible for the peak at 200 nm. As filtration began, the filtrates’ absorbance
displayed a significant decrease from the wastewater’s absorbance. As filtration progressed, the
absorbance gradually increased but even after filtering 1500ml, it was still below the measure of
the wastewater.
Conclusion
From analysis of the results, the system displays a significant achievement of treatment. More
wastewater should be run through the system to establish the point at which backwashing is
necessary. The point of exhaustion of the activated carbon will also be established when the
absorbance of the filtrate is or nears the absorbance of the wastewater. At this point, replacement
or regeneration of activated carbon is necessary. In practice, activated carbon is incorporated in a
separate unit from the sand but follow the same sequence as the setup. This is in order to allow
for replacement of activated carbon when it gets exhausted. Another reason is that backwashing
does not work well with activated carbon. The backwashing process mixes the activated carbon
during which compounds adsorbed located at the top may end up lower into the media where
desorption is likely to occur. To improve the efficiency of the systems, different setups in terms
of depth, sizes of the filter media, configurations and setups should be explored. A recent study
in China10 found that two carbon adsorbers in series mode of operation often constitute the most
cost effective treatment process. The lead adsorber allows a high utilization of carbon’s
adsorptive capacity, whereas the polish adsorber ensures excellent treatment performance.
Alternative filter materials such as anthracite and lightweight aggregate to substitute sand and
activated carbon respectively should also be experimented. Materials used in the filter should be
easy to acquire and relatively cheap. Gravel for example, may be substituted by pumice such as
broken glass. In another recent study in China9, corn cob was impregnated with phosphoric acid
(H3PO4) used to produce activated carbon.
The practicability of any filter system will be determined by its efficiency in terms of treatment
capability (quality and quantity), environmental and economic friendliness (cost of
maintenance).
Reference:
1. Graham N. J. D., Slow Sand Filtration: Recent developments in water treatment technology, Ellis Horwood Ltd., 1988.
2. Robert M. Clark and Benjamin W. Lykins, Granular Activated Carbon, Lewis publisher Inc., 1989.
3. Sontheimer, Crittenden, Summers, Activated Carbon for Water Treatment, 1988.
4. Bansel Roop C., Goyal Meenakshi, Activated Carbon Adsorption, CRC Press: Taylor and Francis Group, 2005.
5. Patrick John W., Porosity in Carbons: Characterization and Applications, Halsted press, 1995.
6. Tchobanoglous George, Burton L. Franklin, Wastewater Engineering: treatment, disposal and reuse, Irwin McGraw-Hill;Metcalf & Eddy, Inc.
7. Ronald L. Droste, Theory and Practice of Water and Wastewater Treatment, John Wiley & Sons, Inc. 1997.
8. Alan C. Twort, Don D. Ratnayaka and Malcolm J. Brandt, Water Supply, Eliane Wigzell, 2000.
9. Yong Sung, Jin-Ping Zhang, Gang Yang and Zuo-Hu Li, “Production of Activated Carbon by H3PO4 Activation Treatment of Corncob and its Performance in Removing Nitrobenzene from Water.” Environmental Progress 26 (April 2007): 78-85.
10. Wei-chi, Wei Zhang, Qi-gang Chang, Wen-xin Jiang and Guang-hua Li, “Improved Methods for Carbon Adsorption Studies for Water and Wastewater Treatment.” Environmental Progress 25 (July 2006): 110-120.