direct membrane filtration of municipal wastewater
TRANSCRIPT

Direct Membrane Filtration of Municipal Wastewater: Linking Periodical Physical
Cleaning with Fouling Mechanisms
Selina Hube
Faculty of Environmental and Civil Engineering
University of Iceland
2020

Direct Membrane Filtration of Municipal Wastewater: Linking Periodical Physical
Cleaning with Fouling Mechanisms
Selina Hube
60 ECTS thesis submitted in partial fulfillment of a Magister Scientiarum degree in Environmental Engineering
MS Committee
Bing Wu (University of Iceland) Hrund Ólöf Andradóttir (University of Iceland)
Tzyy Haur Chong (Nanyang Technological University)
Master’s Examiner Ragnhildur Gunnarsdóttir (EFLA)
Faculty of Civil and Environmental Engineering School of Engineering and Natural Sciences
University of Iceland Reykjavik, May 2020

Direct Membrane Filtration of Municipal Wastewater: Linking Periodical Physical
Cleaning with Fouling Mechanisms Optimization of DMF for an Icelandic Scenario
60 ECTS thesis submitted in partial fulfillment of a Magister Scientiarum degree in
Environmental Engineering
Copyright © 2020 Selina Hube
All rights reserved
Faculty of Civil and Environmental Engineering
School of Engineering and Natural Sciences
University of Iceland
Tæknigarður - Dunhagi 5
107 Reykjavík
Iceland
Telephone: 525 4000
Bibliographic information:
Selina Hube, 2020, Direct Membrane Filtration of Municipal Wastewater: Linking
Periodical Physical Cleaning with Fouling Mechanisms, Master’s thesis, Faculty of Civil
and Environmental Engineering, University of Iceland, pp. 73.
Printing: Hàskòlaprent
Reykjavik, Iceland, May 2020


Abstract
Direct membrane filtration (DMF) of municipal wastewater offers an alternative solution for
centralized and decentralized wastewater treatment in Iceland. The efficiency of biological-
based wastewater treatment is restricted in Iceland, due to low temperatures and high
wastewater inflow rates with extremely low concentration of organics. This study aims to
investigate membrane fouling mechanisms and mitigation approaches during DMF of
municipal wastewater. The DMF experiments were performed using a crossflow flat sheet
membrane filtration cell integrated with an optical coherence tomography (OCT) imaging
system. The effects of membrane material, operation conditions and cleaning protocol on
DMF performance and foulant composition were examined. The threshold flux testing
results indicated that a PVDF membrane (0.08 μm) was suitable for DMF of wastewater.
Increasing crossflow velocity, physical flushing frequency and flushing water temperature
contributed greatly to mitigate fouling. During a continuous DMF process, reversible fouling
was predominant, while during intermittent DMF with periodical physical cleaning,
irreversible/ irremovable fouling was dominant. A possible shift of tightly attached cake
layer to irreversible/ irremovable fouling was revealed by the direct observation of fouling
via OCT. The foulants autopsy indicated that a combination of organic and inorganic
foulants was attributed to membrane fouling, instead of biological fouling. Under the
optimized filtration condition, sustainable long-term DMF operation (~230 h) was achieved
by employing a combination of periodical physical flushing with chemical-enhanced
flushing. The water quality analysis showed that the DMF process could efficiently remove
solids and greater-sized soluble organics, allowing the treated water to meet wastewater
discharge standards.
Útdráttur
Bein himnusíun (DMF) á heimilisskólpi er mögulegur valkostur fyrir miðlæga og dreifða
skólphreinsun á Íslandi þar sem skilvirkni líffræðilegrar skólphreinsiaðferða líður fyrir lágt
hitastig og hátt rennsli skólps með lágum styrkleika lífrænna efna. Rannsóknin miðar að því
að kanna örveruvöxtur á himnur og aðferðir við DMF heimilisskólps. DMF-tilraunir voru
framkvæmdar með því að nota krossflæði flatar himnusíunarfrumu samþætt við
sjónkerfisljósmyndatökukerfi (OCT). Áhrif himnunnar, rekstrarskilyrða og hreinsunarferlis
á frammistöðu DMF og samsetningu fyrirstöðunnar voru skoðuð. Prófanir á
viðmiðunarrennslismörkum bentu til þess að PVDF himna (0,08 μm) væri hentugt fyrir DMF
skólp. Hækkun hraða þvert á rennsli, vélrænnar skolunartíðni og hitastigs skolaðs vatns
stuðlaði stórlega að því að draga úr himnufóðringu. Meðan á stöðugu DMF-ferli stóð var
jafngeng fyrirstaða ríkjandi en á meðan DMF gekk í lotum með reglubundinni hreinsun var
óafturkræf / óhreyfanleg mengun ríkjandi. Hugsanleg breyting á þéttu áföstu lögunum yfir í
óafturkræfa / óhreyfanlega mengun kom í ljós með beinni athugun á himnufóðrun í gegnum
OCT. Krufning fyrirstaðanna benti til þess að sambland af lífrænum og ólífrænum
fyrirstöðum væri rakin til himnufúðar, í stað líffræðilegrar fyrirstöðu. Undir hámörkuðu
síunarástandi var sjálfbærri langtíma DMF-aðgerð (~ 230 klst.) náð með því að nota blöndu
af reglubundinni vélrænni skolun og efnafræðilegri skolun. Greining á vatnsgæðum sýna í
inn- og útrennsli sýndi að DMF-ferlið gæti með skilvirkum hætti fjarlægt föst efni og stærri
uppleysanleg og lífræn efni, svo að meðhöndlað vatn uppfylli staðla losun frárennslisvatns.


ix
Table of Contents
List of Figures ..................................................................................................................... xi
List of Tables ..................................................................................................................... xiii
Abbreviations .................................................................................................................... xiv
Acknowledgements .......................................................................................................... xvii
1 Introduction ..................................................................................................................... 1 1.1. Importance and Status of Wastewater Treatment.................................................... 1 1.1 Secondary Wastewater Treatment Technologies .................................................... 3
1.1.1 Conventional Activated Sludge Method ........................................................ 3 1.1.2 Membrane Bioreactor (MBR) ........................................................................ 4
1.1.3 Direct Membrane Filtration (DMF) ............................................................... 5 1.2 Research Goals ........................................................................................................ 6
1.3 Thesis Organization ................................................................................................. 7
2 Technological Background............................................................................................. 9
2.1 Membrane Filtration ................................................................................................ 9 2.2 Membrane Fouling ................................................................................................ 10
2.3 Treatment Performance of DMF ........................................................................... 12 2.4 DMF Performance Improvement Strategies.......................................................... 12
2.5 Frontiers of Research and Gaps in Knowledge of DMF ....................................... 14
3 Materials and Methods ................................................................................................. 17 3.1 Materials ................................................................................................................ 17
3.2 Laboratory Experiments ........................................................................................ 17 3.2.1 Experimental Setup ...................................................................................... 17
3.2.2 Operation...................................................................................................... 20 3.3 Threshold Flux Determination .............................................................................. 20 3.4 Membrane Resistance Analysis............................................................................. 21
3.5 Fouling Observation via OCT ............................................................................... 22
3.6 Analysis of Water Quality and Foulants Characteristics ...................................... 23 3.6.1 Samples ........................................................................................................ 23 3.6.2 Feed and Permeate Strength (COD, TSS, TOC).......................................... 23
3.6.3 Liquid Chromatography – Organic Carbon Detection (LC-OCD) .............. 23 3.6.4 Inductively Coupled Plasma – Optical Emission Spectroscopy (ICP-
OES) ............................................................................................................. 23 3.6.5 Fluorescence Spectrophotometer ................................................................. 23 3.6.6 Flow Cytometer ........................................................................................... 24
3.6.7 Adenosin Triphosphate (ATP) ..................................................................... 24 3.6.8 Ion Chromatography (IC) ............................................................................ 24 3.6.9 Goniometer .................................................................................................. 24 3.6.10 Fourier-Transform Infrared Spectroscopy (FTIR) ....................................... 24

x
3.6.11 Scanning Electron Microscopy (SEM) ........................................................ 24
4 Results and Discussion ................................................................................................. 25 4.1 Threshold Flux Determination .............................................................................. 25
4.2 Effect of Operation Conditions on DMF Performance ......................................... 28 4.2.1 Feed Pressure under Continuous and Intermittent Filtration ....................... 28 4.2.2 Crossflow Velocity ...................................................................................... 30 4.2.3 Cleaning Protocol ........................................................................................ 32 4.2.4 Direct Observation of Fouling via OCT ...................................................... 40
4.3 Long-term Performance of DMF .......................................................................... 49 4.4 Water Quality and Foulants Analysis ................................................................... 52
4.4.1 Permeate Water Quality ............................................................................... 52 4.4.2 Membrane Foulants Analysis ...................................................................... 54
5 General Discussion and Outlook ................................................................................. 61
6 Conclusions ................................................................................................................... 63
References .......................................................................................................................... 65
Appendix ............................................................................................................................ 71

xi
List of Figures
Figure 1. Changes in urban wastewater treatment in northern European countries
(European Environment Agency, 2017). ............................................................ 1
Figure 2. Wastewater treatment shown as percentage of the population with secondary
treatment, primary treatment and septic tank with infiltration system both
in rural and urban areas (Umhverfisstofnun, 2013). ........................................... 2
Figure 3. Wastewater treatment methods in different regions in Iceland in percentage
for agglomerations >500 inhabitants (Umhverfisstofnun, 2013). ...................... 3
Figure 4. Conventional wastewater treatment process with activated sludge treatment.
............................................................................................................................ 4
Figure 5. Advanced wastewater treatment: a) MBR process, b) submerged MBR............... 5
Figure 6. A schematic diagram of dead-end (a) and crossflow (b) filtration (Crittenden
et al., 2012). ...................................................................................................... 10
Figure 7. Fouling mechanisms: (a) Pore blocking, (b) pore constriction and (c) cake
layer formation (Crittenden et al., 2012) .......................................................... 11
Figure 8. Batch-scale DMF setup ........................................................................................ 18
Figure 9. Filtration cell used in DMF setup ........................................................................ 18
Figure 10. Batch-scale DMF setup with an auto-controlled cleaning system. .................... 19
Figure 11. Basic principle of Fourier-domain OCT of fouling process in a membrane
filtration cell (Sim and Fane, 2017) .................................................................. 22
Figure 12. The dTMP/dt profiles for threshold flux determination (at a feed pressure
of 50 kPa) .......................................................................................................... 26
Figure 13. The dTMP/dt profiles for threshold flux determination (at a feed pressure
of 8 kPa) ............................................................................................................ 27
Figure 14. TMP evolution of PVDF (a) and RC membranes (b) at different feed
pressures with clean water flushing and chemical cleaning after filtration ...... 28
Figure 15. Filtration resistances at different feed pressures ................................................ 29
Figure 16. Membrane fouling rate (dTMP/dt) during intermittent filtration with
wastewater flushing at different flow rates ....................................................... 31
Figure 17. Cake layer (a) and irreversible and irremovable (b) fouling resistances at
various flow velocities during intermittent filtration with wastewater
flushing (25 °C, 0.1 m/s). ................................................................................. 32

xii
Figure 18. Membrane fouling rate (dTMP/dt) at varying temperatures during
intermittent filtration with tap water flushing (0.1 m/s). .................................. 33
Figure 19. Membrane fouling rate (dTMP/dt) at varying filtration and flushing flow
velocities (50 °C tap water) . ............................................................................ 34
Figure 20. Cake layer (a) and irreversible and irremovable (b) resistance at varying
temperatures during intermittent filtration with tap water flushing (0.1
m/s). .................................................................................................................. 35
Figure 21. Cake layer (a) and irreversible and irremovable (b) fouling resistances at
1.25 h filtration interval and varying filtration and flushing flow velocities
(rates with 50 °C tap water). ............................................................................. 36
Figure 22. Membrane fouling rate (dTMP/dt) during intermittent filtration with heated
tap water flushing ............................................................................................. 38
Figure 23. Resistances during intermittent filtration with heated tap water ....................... 40
Figure 24. OCT images of the cake layer evolution – PVDF (left) and RC (right) at 8
kPa feed pressure, 0.1 m/s filtration, clean water flushing and chemical
cleaning with 0.5 % NaOCl. ............................................................................. 42
Figure 25. OCT images of the cake layer evolution – PVDF (left) and RC (right) at 50
kPa feed pressure, 0.1 m/s filtration, clean water flushing and chemical
cleaning with 0.5 % NaOCl. ............................................................................. 44
Figure 26. Cake layer thickness during filtration with RC (a) and PVDF (b) membrane
.......................................................................................................................... 45
Figure 27. Cake layer evolution during clean water at varying flow velocities flushing
of the PVDF membrane after filtration at 50 kPa feed pressure and 0.1 m/s
flow velocity. .................................................................................................... 47
Figure 28. TMP curve during intermittent long-term filtration with heated tap water
flushing and chemical cleanings (red lines) ..................................................... 51
Figure 29. dTMP/dt during long-term intermittent filtration with heated tap water
flushing and chemical cleanings (red lines) ..................................................... 51
Figure 30. SEM images of the cake layer foulants after filtration at different conditions
(×3000 magnification; 1,25 h-filtration with 10 min flushing) ........................ 55
Figure 31. FTIR profiles of virgin and fouled membranes ................................................. 59
xiii
List of Tables
Table 1. The flat sheet membranes used in this study ......................................................... 17
Table 2. Operation conditions in this study ......................................................................... 20
Table 3. A summary of threshold fluxes of the tested membranes ..................................... 27
Table 4. Membrane fouling rate (dTMP/dt) and membrane resistance during
intermittent filtration with wastewater flushing at different feed pressures
and filtration intervals. ...................................................................................... 30
Table 5. Membrane fouling rate (dTMP/dt) and resistance values during intermittent
filtration with heated tap water flushing ........................................................... 39
Table 6. Averaged cake layer thickness data for different operation conditions during
intermittent filtration ......................................................................................... 49
Table 7. Feed and permeate water characteristics ............................................................... 53
Table 8. Analysis of soluble foulant and microbial foulant characteristics......................... 57
Table 9. Contact angles of the clean and fouled membranes .............................................. 58
xiv
Abbreviations
A Area
ATP Adenosine triphosphate
BOD5 Biochemical Oxygen demand
C Computer
CDOC Hydrophilic organic Carbon
CEB Chemical enhanced backwash
CV Check valve
DMF Direct membrane filtration
DOC Dissolved organic Carbon
DON Dissolved organic Nitrogen
dTMP/dt TMP increase over time
EEM Excitation emission matrix
Em Emission
Ex Excitation
F Feed tank
FP Feed pump
FlT Flushing tank
FTIR Fourier-transform infrared spectroscopy
HOC Hydrophobic organic Carbon
HP Heating plate
IC Ion chromatography
ICP-OES Inductively coupled plasma – optical emission spectroscopy
J Flux
LC-OCD Liquid chromatography – organic Carbon detection
LMH L/m2h
xv
LMW Low molecular weight
µ Viscosity of water
MBR Membrane bioreactor
MF Microfiltration
MM Membrane module
MW Molecular weight
NA Non applicable
ND Not determined
NEWRI Nanyang environment and research institute
NF Nanofiltration
OCT Optical coherence tomography
P Permeate tank
P1/2 Pressure gauge
PES Polyethersulfone
PP Permeate pump
PV Pressure valve
PVDF Polyvinylidene fluoride
Q Flow rate
RC Regenerated cellulose
Rc Cake layer resistance
Rir Irreversible resistance
Rim Irremovable resistance
Rm Membrane resistance
RO Reverse osmosis
S Scale
SAC Spectral absorption
SEM Scanning electron microscope

xvi
SMTC Singapore membrane technology center
SS Suspended solids
ST Stirrer
SUVA Specific UV absorbance
SV Solenoid valve
TMP Trans-membrane pressure
TN Total Nitrogen
TOC Total organic Carbon
TP Total Phosphorus
TSS Total suspended solids

xvii
Acknowledgements
First, I would like to thank A/Prof. Bing Wu for trusting me and making this project possible,
for her mentorship, guidance, encouragement and sharing her knowledge with me. I would
also like to thank Prof. Hrund Ólöf Andradóttir for her help as a member of the MS
committee and Ragnhildur Gunnarsdóttir for her review of the thesis.
I would like to thank the Singapore Membrane Technology Center (SMTC) for welcoming
me, providing and introducing me to the equipment, their guidance and always being there
for my questions. My sincere thanks go to A/Prof. Chong Tzzy Haur, Dr. Jingwei Wang and
Dr. Lee Nuang Sim and the Analytics team of Nanyang Environment and Research Institute
(NEWRI).
I am thanking the University of Iceland Research Fund for sponsoring this project.
Last, I would like to express my profound gratitude to my family for their immense support
and encouragement.


1
1 Introduction
1.1. Importance and Status of Wastewater
Treatment The release of untreated wastewater to the natural environment leads to potential risks, such
as eutrophication, occurrence of micropollutants and microplastics or waterborne pathogens.
Therefore, wastewater treatment is not only extremely important for the quality of our
environment, but also for maintaining public health (European Environment Agency, 2017).
Especially, the release of micropollutants (pharmaceuticals, endocrine disruptors, pesticides,
heavy metals and viruses/pathogens) is expected to be strictly regulated in order to protect
the environment and the inhabitant’s health (Hey et al., 2018).
Recent studies have shown that in high-income countries about 70 % of the wastewater is
treated, while it is only 38 % and 28 % in upper- and lower-middle-income countries
respectively and 8 % in low-income countries (Sato et al., 2013). More, while the European
discharge standards are met in over 80 % of the cases in the European Union, only below
20 % of effluents in other parts of the world meet the discharge standards (World Health
Organization and United Nations, 2018). The United Nations Sustainable Development Goal
number 6 aims to improve water quality and protect water related ecosystems globally. The
target is to halve the proportion of untreated wastewater before 2030 (United Nations, 2015).
Wastewater treatment in Iceland is not very developed and direct discharge is still common.
Compared to other countries in northern Europe, Iceland has a very low percentage of treated
wastewater. Of particular notice is the very low ratio of wastewater that undergoes secondary
(biological) or tertiary treatment for nutrient removal (Figure 1) (European Environment
Agency, 2017).
Figure 1. Changes in urban wastewater treatment in northern European countries
(European Environment Agency, 2017).

2
In Reykjavík, the capital and largest municipality in the country, wastewater only undergoes
primary treatment, which aims to remove coarse material, sand and fat. According to the
Icelandic regulation on wastewater systems nr. 798/1999 (Reglugerð um fráveitur og skólp
nr. 798/1999), primary treatment requires minimum 50 % removal of Total Suspended
Solids (TSS) and at least 20 % removal of Biochemical Oxygen Demand (BOD5). The
treated wastewater is discharged into the sea (~4 to 5 km away from the coastal area).
Primary treatment can only remove ~10 (screen) to 50 % (settling basin) of suspended solids
(mainly greater than 1 mm) and ~10 (screen) to 20 % (settling basin) of the BOD5
(Sævarsson, 2018). Although the discharged wastewater effluent does not or only slightly
influence the water quality in the sea (Veitur, 2019), the treated wastewater quality cannot
meet the EU discharge standards. In other large municipalities (Akureyri, Selfoss,
Egilsstadir), very limited wastewater treatment facilities are available (EFLA Engineering,
2019; Iceland Review, 2017). In small communities, the wastewater is generally treated by
septic tanks or directly discharged into the ocean or large water bodies (Figure 2 and Figure
3). This practice can increase the risk of waterborne outbreaks in rural areas, and harm the
country’s tourism industry that has grown steadily in the past decade
Figure 2. Wastewater treatment shown as percentage of the population with secondary
treatment, primary treatment and septic tank with infiltration system both in rural and urban
areas (Umhverfisstofnun, 2013).

3
Figure 3. Wastewater treatment methods in different regions in Iceland in percentage for
agglomerations >500 inhabitants (Umhverfisstofnun, 2013).
1.1 Secondary Wastewater Treatment
Technologies
1.1.1 Conventional Activated Sludge Method
A conventional wastewater treatment process usually combines a primary and a secondary
process (Figure 4). In detail, a bar screen removes large objects, followed by a grit chamber
that facilitates the settling of higher-density solids (sand and stones). After that, a settling
process further removes particulate organics and inorganics (collected as waste sludge). In
the following activated sludge process, microorganisms degrade organics/ inorganics and
produce new cells. The activated sludge is separated from the flow in a secondary settling
tank, one part of which is recirculated back to the aeration tank and another part is collected
as waste sludge. Additionally, most treatment plants have a tertiary treatment step, which
serves as disinfection or nutrient removal before releasing the water into a receiving water
body (Tchobanoglous et al., 2003).
This process shows satisfying treatment efficiencies. However, the high energy consumption
of aeration in the activated sludge system leads to an increase in operation costs. The mean
energy consumption of a conventional wastewater treatment plant ranges between 0.1-
1.89 kWh/m3 (Hey et al., 2018; Kimura et al., 2017; L. Luo et al., 2019; Mizuta and Shimada,
2010; Plappally and Lienhard V, 2012; Wan et al., 2016; Zhang et al., 2016). Biological
treatment in general is not always practicable as it demands a constant feed water flow and
stable climatic conditions in preferably warm temperatures (20 to 25 °C). The biological
treatment needs long start-up periods to adapt to a new or changed feed. Therefore, extreme
climatic conditions, a discontinuous water flow or small wastewater quantities can lead to
cost and management issues (Hedaoo et al., 2012; Ravazzini et al., 2005).
4
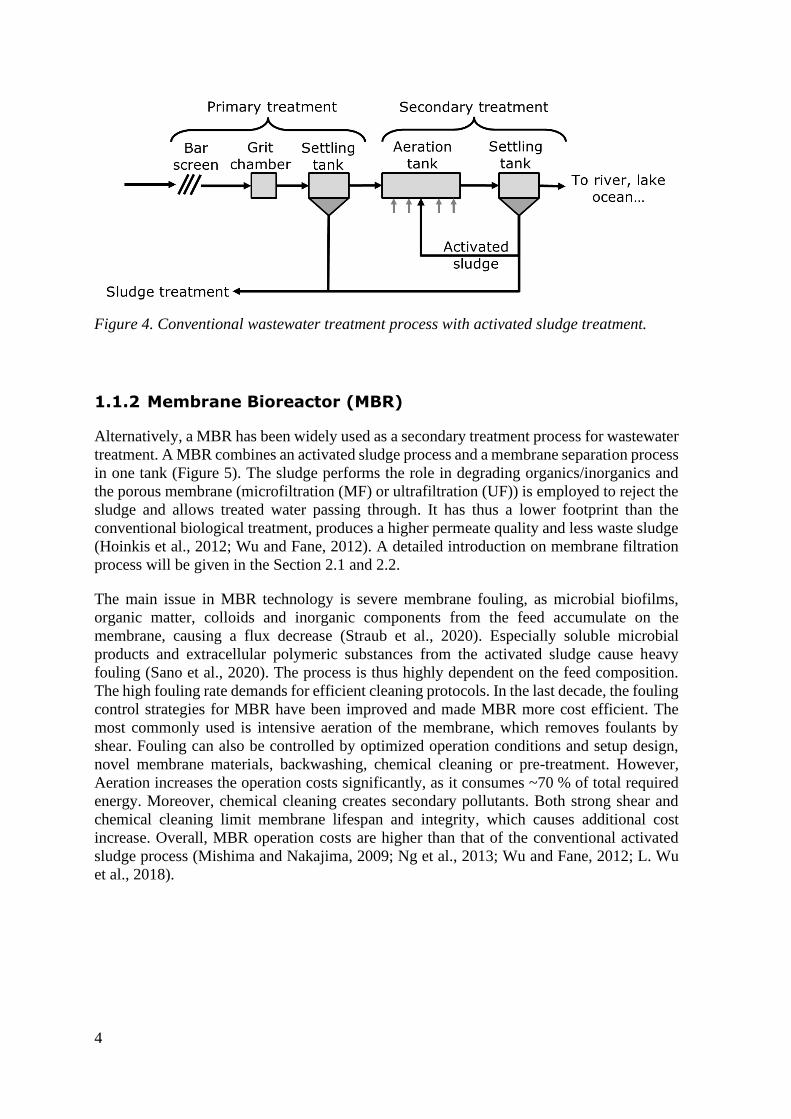
1.1.2 Membrane Bioreactor (MBR)
Alternatively, a MBR has been widely used as a secondary treatment process for wastewater
treatment. A MBR combines an activated sludge process and a membrane separation process
in one tank (Figure 5). The sludge performs the role in degrading organics/inorganics and
the porous membrane (microfiltration (MF) or ultrafiltration (UF)) is employed to reject the
sludge and allows treated water passing through. It has thus a lower footprint than the
conventional biological treatment, produces a higher permeate quality and less waste sludge
(Hoinkis et al., 2012; Wu and Fane, 2012). A detailed introduction on membrane filtration
process will be given in the Section 2.1 and 2.2.
The main issue in MBR technology is severe membrane fouling, as microbial biofilms,
organic matter, colloids and inorganic components from the feed accumulate on the
membrane, causing a flux decrease (Straub et al., 2020). Especially soluble microbial
products and extracellular polymeric substances from the activated sludge cause heavy
fouling (Sano et al., 2020). The process is thus highly dependent on the feed composition.
The high fouling rate demands for efficient cleaning protocols. In the last decade, the fouling
control strategies for MBR have been improved and made MBR more cost efficient. The
most commonly used is intensive aeration of the membrane, which removes foulants by
shear. Fouling can also be controlled by optimized operation conditions and setup design,
novel membrane materials, backwashing, chemical cleaning or pre-treatment. However,
Aeration increases the operation costs significantly, as it consumes ~70 % of total required
energy. Moreover, chemical cleaning creates secondary pollutants. Both strong shear and
chemical cleaning limit membrane lifespan and integrity, which causes additional cost
increase. Overall, MBR operation costs are higher than that of the conventional activated
sludge process (Mishima and Nakajima, 2009; Ng et al., 2013; Wu and Fane, 2012; L. Wu
et al., 2018).
Figure 4. Conventional wastewater treatment process with activated sludge treatment.

5
1.1.3 Direct Membrane Filtration (DMF)
Recently, DMF has received great attention, providing an alternative promising solution for
secondary wastewater treatment. In DMF, the wastewater is directly filtered by a porous
membrane, without a prior biological step and thus it is a completely physical process (Hey
et al., 2017; Mezohegyi et al., 2012; Ravazzini et al., 2005). DMF can serve two purposes in
a wastewater treatment process: (1) the membrane filtration is employed to produce high
quality permeate water, and (2) DMF can be used as a pre-concentration step for organic
matter and thus energy recovery (Hey et al., 2017; Ravazzini et al., 2005). The key
operational constraint of DMF is membrane fouling, which refers to the deposition of feed
components on or inside the membrane. Compared to a conventional biological treatment
process and MBR, DMF has several advantages. (1) DMF has a relatively simple system
configuration, requiring less capital cost and footprint (as no biological tank is needed). (2)
Figure 5. Advanced wastewater treatment: a) MBR process, b) submerged MBR
a)
b)
6
The operation and maintenance of DMF are much simpler, especially without requiring a
long start-up period, as no complicated biological process is involved. (3) DMF presents a
high modularity, which allows resizing or up-scaling. (4) The process can be operated in
discontinuous mode, therefore it can be easily adapted to seasonal flow changes of feed
wastewater as well as feed composition. (5) DMF can produce superior permeate quality that
meets EU water discharge or reuse standards, as it can efficiently reject micropollutants and
microplastics. Therefore, DMF is especially interesting for wastewater treatment in order to
recover water, nutrients and energy. The interest in DMF is growing because the
conventional wastewater treatment process faces challenges in terms of global sustainability
on energy consumption and greenhouse gas emission. In contrast, DMF can achieve
wastewater treatment with emphasizing minimization of energy consumption and CO2
emission. The rejected organics/ nutrients can be collected for further energy production
(such as methane, hydrogen), nutrients (N and P) recovery, or valuable product
commercialization (such as fertilizer). Overall, the DMF-based wastewater treatment system
could potentially gain net energy and additional profits, achieving self-sufficient municipal
wastewater treatment (Butler and MacCormick, 1996; Guilbaud et al., 2010; Hey et al.,
2017; Ravazzini et al., 2005).
1.2 Research Goals
Achieving the secondary treatment goals in Iceland is hindered by several factors. First,
Iceland has a very small population with a scattered distribution pattern, especially in rural
areas. This creates a challenge to employ centralized wastewater treatment facilities in terms
of implementation and economic feasibility. Second, the climatic conditions also present a
challenge. Iceland is located just under the Arctic circle and therefore presents a cold climate
with mean annual temperatures under 6 °C, even during the warmest summer months the
mean monthly temperatures remain under 14 °C (IMO, 2019). It is well known that
secondary biological treatment is highly dependent on the temperature and the activated
sludge prefers a temperature in the range of 20 to 25 °C. In addition, a biological treatment
step has a longer start-up period and therefore a continuous feed flow is preferred (Hedaoo
et al., 2012). This however, is not always feasible in remote areas in Iceland, as some regions
are completely deserted during the winter months while busy with tourists in summer. Third,
the wastewater has a relatively high inflow rate, specifically 1000-2500 L/capita/day in
Iceland vs. < 400 L/capita/day in Europe (Sævarsson, 2018). This, in turn, leads to extremely
low organic concentrations which limits the secondary wastewater treatment efficiency.
Fourth, conventional wastewater treatment for small communities is cost-intensive.
There is an urgent need to find a cost effective, flexible technology that can efficiently treat
diluted municipal wastewater in small municipalities (1000 - 300000 habitations) in cold
climate. This study, therefore, aims to develop a sustainable DMF system for wastewater
treatment in Iceland by analyzing the technical feasibility on a lab-scale. DMF membrane
fouling mechanisms will be explored and DMF fouling control strategies with less chemical
usage and energy consumption will be proposed.
The experimental research includes three key components:
(1) Which membrane is most applicable for Icelandic high volume, low organic
concentration wastewater?

7
Different commercial membranes display different characteristics, which could lead to
dissimilar DMF performance and water quality. Several commercial membranes were
selected and tested based on threshold flux determination method under identical operation
conditions. The membrane showing the best performance was selected for further study.
(2) Which operation conditions are most important and how can they be optimized?
To optimize DMF operation, the effects of different operation conditions on DMF
performance were studied, including feed pressure, crossflow velocity, filtration mode, and
physical/chemical membrane cleaning protocols. Finally, a long-term operation of DMF was
conducted under the optimal operation conditions. To explore membrane fouling
mechanisms, the membrane fouling rate and membrane fouling resistance distribution were
analyzed. Meanwhile, direct observation of in-situ DMF membrane fouling via optical
coherence tomography (OCT) was performed.
(3) Which components are removed by filtration and which fouling type is dominant?
To examine permeate water quality and identify major foulants, their detailed component
compositions were analyzed by a series of advanced analytical equipment. This allows to
further assess the effect of operation conditions of DMF on the permeate water quality and
membrane fouling mechanisms.
1.3 Thesis Organization
First, the technological background of membrane filtration and recent developments in DMF
will be explained. Next, methods for the experimental part of the research will be presented.
The practical part will begin with the threshold flux determination to find a suitable
membrane for the simulated Icelandic wastewater. The chosen membranes will further be
used for short-term continuous filtrations with physical and chemical cleaning for resistance
and fouling analysis. In a next step, the effect of feed pressure, flow velocity, flushing type
and intervals on filtration performance will be studied during intermittent filtration. Fouling
will be observed during filtrations with OCT. Feed, permeate and fouling samples taken
during intermittent filtration will be analyzed to determine fouling mechanisms. The
conclusions will summarise the results and discuss future research.


9
2 Technological Background
2.1 Membrane Filtration
Membrane filtration is a separation process through size exclusion. Certain components pass
through a thin and semipermeable membrane, while others presenting greater sizes than the
membrane pore sizes are rejected (Crittenden et al., 2012; Singh and Hankins, 2016). The
driving force in pressure-driven membrane filtration is the pressure difference between feed
side and permeate side, also called the transmembrane pressure (TMP). Depending on the
pore size, membranes are sorted into four different categories: MF, UF, nanofiltration (NF)
and reverse osmosis (RO), where MF has the largest pore size, followed by UF, NF and RO
(Singh and Hankins, 2016). These membranes produce different permeate qualities, which
makes the technique favorable for water reuse (Ravazzini et al., 2005). Generally, MF and
UF membranes are widely used in wastewater treatment processes.
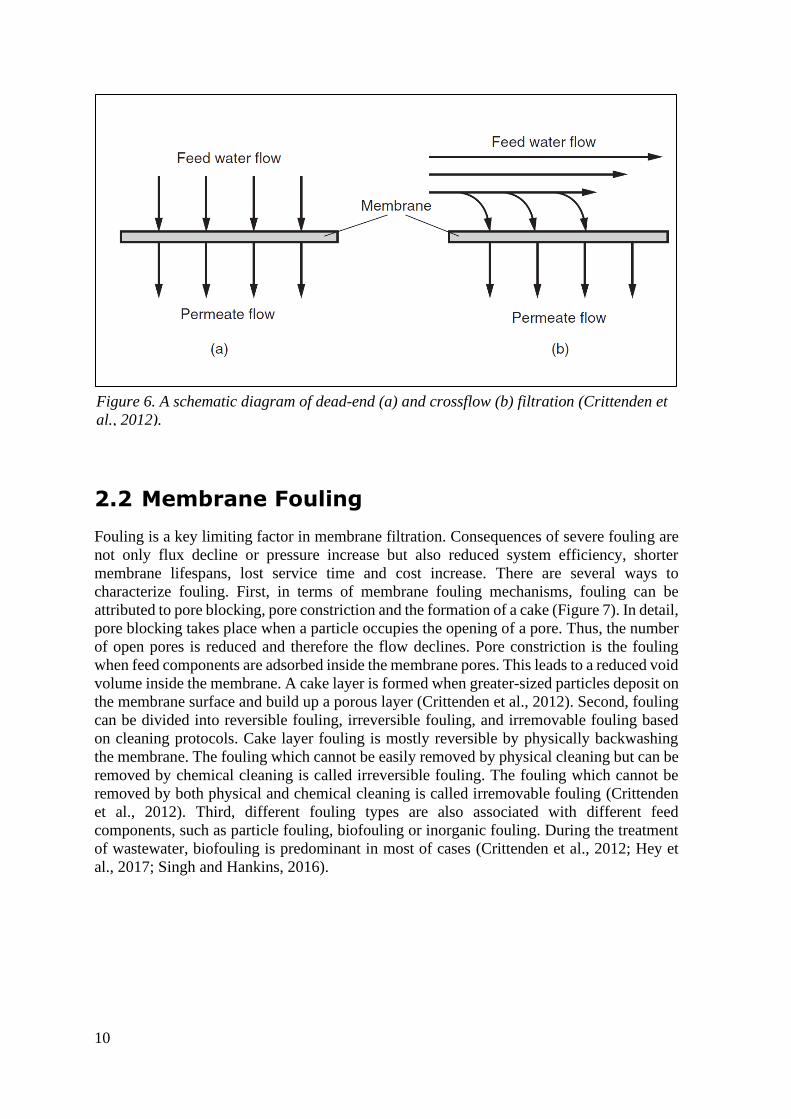
The MF/ UF filtration process can be conducted under two different filtration modes: dead-
end and crossflow, as depicted in Figure 6. During dead-end filtration, the flow is
perpendicular to the membrane and there is no crossflow velocity along the membrane
surface. Thus, the rejected components are drawn towards the membrane and build-up on
the surface. The accumulated components on the membrane tend to reduce the permeate
flux. During crossflow operation, the feed flows in parallel to the membrane. The shear force
created by the crossflow velocity reduces depositions of components on the membrane and
therefore decreases the building-up and the thickness of a cake layer. This allows longer
operation with less cleaning or operation at a higher flux (Crittenden et al., 2012; Singh and
Hankins, 2016).
There are two different operation modes: constant flux and constant TMP. When the
filtration is performed at a constant flux, the TMP increases continuously in order to maintain
the flux over the filtration time. On the other hand, when operating in a constant TMP mode,
the flux decreases over time due to continuous accumulation of foulants on the membrane
surface and inside the membrane. Usually, large-scale systems are operated at constant flux
mode to maintain the water production at a constant level. (Crittenden et al., 2012; Singh
and Hankins, 2016)
10
2.2 Membrane Fouling
Fouling is a key limiting factor in membrane filtration. Consequences of severe fouling are
not only flux decline or pressure increase but also reduced system efficiency, shorter
membrane lifespans, lost service time and cost increase. There are several ways to
characterize fouling. First, in terms of membrane fouling mechanisms, fouling can be
attributed to pore blocking, pore constriction and the formation of a cake (Figure 7). In detail,
pore blocking takes place when a particle occupies the opening of a pore. Thus, the number
of open pores is reduced and therefore the flow declines. Pore constriction is the fouling
when feed components are adsorbed inside the membrane pores. This leads to a reduced void
volume inside the membrane. A cake layer is formed when greater-sized particles deposit on
the membrane surface and build up a porous layer (Crittenden et al., 2012). Second, fouling
can be divided into reversible fouling, irreversible fouling, and irremovable fouling based
on cleaning protocols. Cake layer fouling is mostly reversible by physically backwashing
the membrane. The fouling which cannot be easily removed by physical cleaning but can be
removed by chemical cleaning is called irreversible fouling. The fouling which cannot be
removed by both physical and chemical cleaning is called irremovable fouling (Crittenden
et al., 2012). Third, different fouling types are also associated with different feed
components, such as particle fouling, biofouling or inorganic fouling. During the treatment
of wastewater, biofouling is predominant in most of cases (Crittenden et al., 2012; Hey et
al., 2017; Singh and Hankins, 2016).
Figure 6. A schematic diagram of dead-end (a) and crossflow (b) filtration (Crittenden et
al., 2012).

11
To alleviate membrane fouling, fouling control measures are critically important during
membrane filtration (Singh and Hankins, 2016). The first option is to optimize operational
parameters, such as flux, temperature, shear force, pressure, pH and intermittent filtration
could be beneficial for better membrane performance (Crittenden et al., 2012; Shi et al.,
2014; Singh and Hankins, 2016). The second option is to perform optimized physical and
chemical cleaning. For example, the most commonly-used physical cleaning procedures are
flushing/ backflushing and air sparging (Crittenden et al., 2012; Saleh and Gupta, 2016;
Singh and Hankins, 2016). Other physical cleaning methods also include particle scouring,
membrane vibration, and spacer vibration (Tan et al., 2019; Wu, 2019; Wu et al., 2019). In
these approaches, the crossflow velocity creates shear to prevent depositions of foulants on
the membrane. Furthermore, chemical cleaning is combined with physical cleaning to
enhance cleaning efficiency by regularly adding chemicals to a flushing or backwash water
flow. To increase the cleaning efficiency, cleaning solutions at a higher temperature could
be adopted. It should be noted that employing chemicals can lead to an increase of capital
costs, a shortened membrane lifetime and the creation of secondary pollutants (Saleh and
Gupta, 2016). The third option is to pre-treat the feed water to remove potential foulants by
sedimentation or pre-filtration, coagulation and flocculation (Crittenden et al., 2012; Singh
and Hankins, 2016; Šostar-Turk et al., 2005). The fourth option is to select a suitable
membrane. Membrane types are manifold and differ in material, pore sizes, hydrophobicity,
porosity, surface roughness and chemistry, stability against mechanical stress, chemicals and
high temperatures, biological stability, internal structure and tortuosity. The choice of
membrane greatly influences the filtration process, due to its compatibility with the feed
solution. The optimal membrane offers a high selectivity and permeability and low fouling,
is physically and chemically stable over a long time operation and available at low costs
(Crittenden et al., 2012; Singh and Hankins, 2016).
Figure 7. Fouling mechanisms: (a) Pore blocking, (b) pore constriction and (c) cake layer
formation (Crittenden et al., 2012)

12
2.3 Treatment Performance of DMF
The application of DMF in treating various types of wastewater has been well documented
in the literature (Akbari et al., 2002; Guilbaud et al., 2010; Hey et al., 2018; Kim et al.,
2007a; Kim et al., 2007b; Koyuncu, 2003; Lin et al., 2016; Lòpez Zavala et al., 2014; Oh et
al., 2016; Ramona et al., 2004; Ravazzini et al., 2005; Šostar-Turk et al., 2005; Woźniak and
Prochaska, 2014; Zhao et al., 2019) (See Appendix 1). It is noted that lab-scale research
work on this field is greatly progressing, but very limited pilot or full-scale practical
application have been reported.
In activated sludge + MF/ UF or MBR processes, the factors influencing permeate quality
and membrane performance have been elaborately investigated at various scale sizes and
summarized in several review articles (Drews, 2010; Meng et al., 2017; Wu and Fane, 2012).
However, during DMF of wastewater, the factors influencing the permeate quality and
membrane performance are rarely explained in the literature. A limited number of reported
lab-scale studies pointed out that the membrane type and material, pore size, pretreatment of
feed water, and fouling control methods have affected the permeate quality and membrane
performance (Guilbaud et al., 2010; Kim et al., 2007b; Ravazzini et al., 2005; Wu, 2019),
but such evaluation was based on observations during short filtration periods (a few hours
to a few days). For example, NF and RO processes can produce treated wastewater with
better quality than MF/ UF due to their relatively smaller pore size (NF) or dense membrane
(RO) natures. However, the effect of membrane pore size on membrane performance was
not conclusive as different types of wastewaters and different operation conditions (flux,
pressure, filtration time, etc.) were employed in these reported studies.
During the DMF of wastewater, membrane fouling is a major challenge due to the relatively
higher organic matter in the feed. It has been reported that cake layer fouling was potentially
predominant, which’s reversibility could be achieved by physical membrane cleaning
(Akbari et al., 2002; Kim et al., 2007a; Li et al., 2008; Ravazzini et al., 2005). Other research
work also highlighted the potential of irreversible fouling in affecting membrane
performance (Kimura et al., 2017; Lateef et al., 2013). Nevertheless, serious membrane
fouling could lead to an increase in DMF operation costs due to higher feed pressures,
decreased membrane lifetime and more frequent cleanings (Anis et al., 2019). Therefore,
proper membrane fouling control strategies are necessary to improve DMF performance.
2.4 DMF Performance Improvement Strategies
Enhanced Physical and Chemical Cleaning
Aeration is widely used as an effective physical membrane fouling control method, however,
it requires a great amount of energy (> 0.2 to 0.3 kWh/m3water) (Judd, 2006) and the
dissolved oxygen could facilitate aerobic degradation of organic matter (i.e., loss of
recoverable organic matter). Thus, alternative physical cleaning approaches with less energy
consumption, such as membrane vibration and particle scouring were proposed in DMF
processes. In a hollow fiber membrane filtration system, compared to particle scouring,
membrane vibration appeared to have greater fouling control potential (Kimura et al., 2017).
In another study, the vibrated membrane also showed less serious membrane fouling than
aerated membrane, therefore, leading to less membrane cleaning requirements for DMF
system (Mezohegyi et al., 2012).

13
The chemical enhanced backwash (CEB) is commonly applied to alleviate membrane
fouling in order to achieve sustainable membrane operation. Not surprisingly, it was also a
promising strategy to improve DMF performance as cleaning chemicals could remove both
organic matter and inorganic matter involved in the development of membrane fouling.
Previous studies have shown that in a DMF system, CEB using NaOCl and/ or citric acid
(e.g., 0.1% NaOCl and 0.2% of citric acid, 30 s every 12 h-filtration; or 1% of citric acid, 30
s every 6 h-filtration) could lead to considerately less membrane fouling compared to
periodical water backwash (Kimura et al., 2017; Lateef et al., 2013). Accordingly, a higher
concentration factor (i.e., a higher organic recovery ratio, up to 75%) of feed water could be
achieved during long-term DMF of wastewater (Lateef et al., 2013).
After such CEB, the discharge of the used chemicals into environments could have a
negative environmental impact. Alternatively, ozonated water (ozone concentration at 0.2 to
0.8 mg/L) was adopted for backwashing a metal membrane (0.1 μm) during filtrating
municipal wastewater (Kim et al., 2007a). It was found that intermittent backwash with the
ozonated water could improve flux recovery (92 %) compared to air backwashing (47 %),
due to more effective removal of small foulants attached on the surface and in the membrane
pore structure by ozonated water. Due to the robust nature of the metal membrane, short-
term exploration (1 min per 30 min filtration) to ozonation did not cause membrane integrity
loss. Nevertheless, the CEB process was cost-intensive and could lead to shortening of the
membrane lifespan, especially for organic membranes (Jin et al., 2017; Kimura et al., 2017).
Optimization of CEB frequency and intensity during DMF is of importance (Kimura et al.,
2017).
Pretreatment of Feed Water
Wastewater generally contains great amounts of suspended solids and dissolved organic and
inorganic matter, which could be potential membrane foulants in DMF (Lateef et al., 2013).
Pretreatment of feed water before it was fed to the direct membrane system was suggested
as a fouling control method, aiming to remove potential membrane foulants.
For example, Lòpez Zavala et al. (Lòpez Zavala et al., 2014) employed low-cost felt and
compressed polyester filters to remove total solids and organics from the powder detergent
greywater, which’s removal ratios reached >30 %. Accordingly, the flux decline of the
following direct UF filtration was significantly alleviated (improved almost 5 times). For
high-pressure NF/ RO membrane processes, pretreatment of feed water by low-pressure
cartridges or MF/ UF membranes was applied (Boddu et al., 2016; Koyuncu, 2003; Šostar-
Turk et al., 2005), which aimed to remove part of potential particulate and colloidal foulants.
This could benefit to achieve long-term sustainable operation of NF/RO processes and
reduce chemical usage for membrane cleaning. Notably, the additional capital and
maintenance costs of the pretreatment systems are required, which have rarely been reported
in the literature. Whether pretreatment could benefit to minimize the overall costs of DMF
system needs to be further carefully illustrated.
Integration with Coagulation/ Adsorption
The dissolved or colloidal organics and inorganics in wastewater can potentially contribute
to irreversible fouling of direct MF/ UF processes, which required intensive chemical
cleaning (Kimura et al., 2017; Lateef et al., 2013). Shifting such irreversible fouling to cake
layer fouling could be achieved by adding coagulants into the feed water, aiming to build
greater-sized flocs (i.e., decreasing dissolved and colloidal substances). Such flocs tend to

14
form a cake layer on the MF/ UF membrane surface, which could be readily removed by
proper physical cleaning (Huang et al., 2017). In addition, coagulation/ flocculation also
performed roles in enhancing retention of smaller-sized soluble organics, nutrients,
micropollutants by promoting particle formation, which allowed improving permeate quality
to meet stricter discharge or reuse standards (Hey et al., 2018).
Different types of inorganic (Al2(SO4)3 and FeCl3) and organic (polyacrylamide) coagulants
have been attempted for lab-scale direct MF/ UF of municipal wastewater (Gong et al., 2017;
Huang et al., 2017; Jin et al., 2016; Jin et al., 2017). The research findings highlighted that
the use of all tested coagulants in direct MF/ UF processes led to an increase in membrane
performance, compared to those without coagulants. However, the inorganic and organic
coagulants showed different behaviors in influencing membrane performance. Researchers
observed that the organic coagulant, such as polyacrylamide, was found to have an optimal
dosing concentration, above or below which the membrane performance decreased. While,
the dosed amount of inorganic coagulants, such as Al2(SO4)3 and FeCl3, appeared to be
positively linear to the membrane flux improvement; even when they were dosed at high
concentrations (60 mg/L), membrane performance was not negatively affected (Huang et al.,
2017). As municipal wastewater varies significantly in its composition, the inorganic
coagulants seemed to be more suitable for fouling alleviation. In addition, FeCl3 could
interact with phosphorus in wastewater, thus it could be a favorable option for
simultaneously treating wastewater and recovering nutrients during DMF (Huang et al.,
2017).
To further improve the membrane performance in coagulation enhanced DMF processes,
combining coagulation with other processes is recommended in several studies. For
example, the coagulation effectiveness in improving membrane performance could be
further enhanced by adding adsorbents such as powder activated carbon (Gong et al., 2017).
The addition of these adsorbents aimed to further improve the removal of colloid and soluble
foulants. Although a stronger cake layer containing adsorbents increased the filtration
resistance, it tended to significantly decrease the irreversible fouling, thus leading to a
reduced overall fouling (Gong et al., 2017). The coupling of intermittent aeration and
coagulation was also attempted (Jin et al., 2016). In this combination, the coagulant helped
produce loose and porous flocs and intermittent aeration helped control the thickness of such
a porous cake layer on the membrane, therefore achieving a slower decline of membrane
permeability. Apparently, compared to continuous aeration, intermittent aeration would
require less energy consumption, benefiting to sustainable long-term operation.
Alternatively, periodical air-backflushing was proposed to implement with a coagulation
process (Jin et al., 2017). The coagulation process mainly contributed to the reduction of
both cake layer resistance and irreversible resistance, while periodical air-backflushing not
only benefitted to maintain sustainable long-term filtration by maximizing membrane
filterability, but also improved organic matter recovery ratio (> 90 % vs. 70 % under
coagulation with intermittent aeration condition) (Jin et al., 2016; Jin et al., 2017).
2.5 Frontiers of Research and Gaps in
Knowledge of DMF
So far, very limited full-scale plants involving DMF have been reported. It is thought to be
associated with several challenges that need to be solved before scaling-up. Membrane

15
fouling is a major issue and limiting factor. In conventional MBRs, microbial relevant
fouling has been identified as predominant membrane fouling (Meng et al., 2017; Wu and
Fane, 2012). While, in DMF processes, the components (such as organics, inorganics,
suspended solids) in wastewater are potential foulants, which could contribute to severe
membrane fouling. However, the membrane fouling mechanisms of DMF processes are
seldom studied in detail, which require a comprehensive investigation, especially in real
application cases. The different membrane fouling mechanisms may require specific
membrane fouling control strategies for DMF processes compared to those applied in MBRs
(Jin et al., 2017).
For instance, it has been reported that periodical chemical cleaning was efficient in reducing
irreversible fouling, which helped achieve sustainable membrane operation (Kimura et al.,
2017; Lateef et al., 2013; Tran et al., 2015). However, the use of a great amount of chemicals
could increase operation costs and produce secondary pollutants. More, it would shorten the
lifespan of membranes, especially for organic membranes (Jin et al., 2017; Kimura et al.,
2017; Sajjad et al., 2019; Xiao et al., 2018). Similarly, the use of chemicals (coagulants,
flocculants, activated carbon) in DMF processes could contribute to membrane fouling
alleviation by maintaining cake layer filterability and reversibility, but this also led to
increased capital costs and chemical wastes (Huang et al., 2017; Jin et al., 2017; Wu, 2019).
More, whether the presence of these chemicals in the concentrated resource stream could
influence subsequent biological resource recovery processes (such as anaerobic digestion) is
also not well illustrated. Nevertheless, it is suggested to reduce the usage of chemicals in
DMF by optimizing the cleaning procedure (pressure, temperature) as well as by reducing
the free volume of the system (Guilbaud et al., 2010).
In contrast, physical pretreatment of wastewater appears to be more desirable due to
relatively less negative environmental impacts, such as the use of low-pressure cartridge or
mesh filters for low-pressure MF/ UF processes (López Zavala et al., 2014). However,
pretreatment processes require not only additional capital and maintenance costs, but also
additional space. Thus, further optimization of feed water pretreatment and membrane
cleaning methods in DMF is of paramount significance, especially during a long-term
operation period with variation of feed water composition.
An alternative solution for improvement of DMF performance is to develop new membranes
with increased antifouling properties. One reported study focused on developing novel anti-
fouling membranes and the lab-scale testing findings displayed their good performances in
membrane fouling alleviation (Oh et al., 2016). However, long-term filtration testing for
these novel membranes are still lacking, which indeed is necessary in order to achieve
sustainable membrane operation and promote their commercialization. Towards fabricating
less fouling-sensitive membranes, identification of membrane fouling mechanisms (cake
layer fouling predominant or irreversible fouling predominant; dominant fouling
components) is crucially important, requiring intensive investigation (Akbari et al., 2002).
In view of the absence of large-scale DMF processes on the market, further research needs
to be emphasized on (1) membrane fouling control technologies of DMF, especially towards
low energy consumption, less chemical usage, and easier operation and maintenance; (2)
development of novel membranes, especially having mechanically robust nature with low-
cost environmental-friendly materials and self-cleaning properties; (3) comprehensive
economic analysis, life cycle assessment, and carbon footprint analysis of different DMF
processes in order to identify the most suitable system configuration for further scale-up.


17
3 Materials and Methods
3.1 Materials
The feed water was collected weekly at the Ulu Pandan wastewater reclamation plant in
Singapore and stored at 4 °C. Before use, the wastewater was warmed up to room
temperature (22 °C). The wastewater in Singapore had a higher organic level than that in
Iceland, therefore the wastewater was diluted with tap water to simulate Icelandic
wastewater (COD of ~70 mg/L).
Several flat sheet membranes with different characteristics were selected and tested in order
to identify a suitable membrane for DMF of wastewater. The membranes used in this study
and their characteristics are listed in Table 1.
Table 1. The flat sheet membranes used in this study
Material Pore size MF/ UF Brand (Country)
PVDF 0.45 µm MF Merck Millipore (USA)
PVDF 0.2 µm MF Merck Millipore (USA)
PVDF 0.08 µm MF Toray (Japan)
PVDF 250 kDa UF Synder Filtration (USA)
RC 100 kDa UF Amicon Bioseparation (USA)
PES 100 kDa UF Pall Corporation (USA)
PAN 100 kDa UF Synder Filtration (USA)
3.2 Laboratory Experiments
3.2.1 Experimental Setup
The setup of the DMF system is shown in Figure 8. Two identical batch-scale membrane
modules (Figure 9) with different membrane areas were used (A1 = 0.001643 m2 and
A2 = 0.002178 m2). The setups were built for this study in the SMTC laboratory at the
Nanyang Technological University (Singapore).

18
The feed wastewater was stored in a feed tank, in which the stirrer maintained the feed well-
mixed. The feed was delivered to the filtration cell by a gear pump and the pressure valve
was applied to regulate the feed flowrate and feed pressure. The filtrations were run at a
flowrate of 0.2, 0.4 or 0.8 L/min (LPM), which correspond to a flow velocity of 0.1, 0.2 and
0.4 m/s respectively. During the filtration, the permeate water was driven through the
membrane by a peristaltic pump at a constant flow and the collected permeate water was
measured by a balance. The rejected water flow was returned back to the feed tank. Both
balance and pressure gauges were connected to a computer, which recorded data via a
LabView software (National Instruments, USA).
Figure 9. Filtration cell used in DMF setup
Figure 8. Batch-scale DMF setup

19
The DMF setup with an auto-controlled cleaning system is shown in Figure 10. A cleaning
system with auto-controlled functions were installed in the DMF setup. During membrane
filtration, the check valve 1 (CV1) and solenoid valve (SV1) were turned-on, but the check
valve 2 (CV2) and solenoid valve 2 (SV2) were turned off, which prevented the feed water
flowing into the cleaning system and vice versa during the cleaning. A heating plate was
located under the cleaning water tank to heat the cleaning water if necessary.
The membrane flux J (L/m2h, LMH), referring to the volumetric water flux across the
membrane, was calculated as Eq. 1 (Crittenden et al., 2012).
𝐽 =𝑄
𝐴 [𝐸𝑞. 1]
J = Flux [LMH]
Q = Flow rate [L/h]
A = Membrane area [m2]
Figure 10. Batch-scale DMF setup with an auto-controlled cleaning system.

20
3.2.2 Operation
The operation conditions in this study are summarized in Table 2. For each test, before
filtration of wastewater, distilled water filtration was performed for 30 min in order to
evaluate clean membrane permeability.
Table 2. Operation conditions in this study
Conditions Membrane
Feed
Pressure
(kPa)
Crossflow
Velocity
(m/s)
Permeate
Flux
(LMH)
Cleaning
protocol
Stage I (Threshold Flux
Determination)
PVDF
(0.45, 0.2,
0.08 µm
and
250 kDa)
RC
(100 kDa)
PES
(100 kDa)
8 and
50
0.1 5 to 40 None
Stage II
(Optimization
of DMF)
Resistance
Analysis
PVDF
(0.08 µm)
RC
(100 kDa)
8 and
50
0.1 25 Distilled
water and
0.5 %
NaOCl
flushing
(25 °C)
Inter-
mittent
Filtration
PVDF
(0.08 µm)
8 and
50
0.1, 0.2
and 0.4
25 Wastewater
and tap
water
flushing
(25 and
50 °C)
Stage III (Long-Term
Operation)
PVDF
(0.08 µm)
8 0.4 25 Tap water
(50 °C) and
periodical
0.5 %
NaOCl
flushing
(50 °C)
*NaOCl is widely used membrane cleaning chemical and the applied concentration of
NaOCl referred to the manufacturer’s manual.
3.3 Threshold Flux Determination
The concept of ‘critical flux’ is defined as the maximum flux below which, no fouling occurs
whereas above the critical flux fouling builds up. As the critical flux concept is proposed
based on a single component feed, it is not strictly applicable for multiple-component feeds,

21
such as wastewater. Because each component has its own critical flux, the multiple-
component feed has instead a range of critical fluxes. In such cases, it is more meaningful to
determine a ‘threshold flux’, which is the flux value that distinguish a region of low fouling
rate from a high fouling rate (Field and Pearce, 2011; Luo et al., 2013). The threshold flux
of the wastewater was determined using the following protocol: (1) the flux was
incrementally increased at 15 min intervals, (2) the slope of the TMP profile (dTMP/dt) was
calculated at each flux step (see Eq. 2) and (3) the threshold flux, at which the regression
lines of the low fouling region and the high fouling region intersects, was determined.
ⅆ𝑇𝑀𝑃
ⅆ𝑡=
𝑇𝑀𝑃𝑛 − 𝑇𝑀𝑃𝑛−1
15 𝑚𝑖𝑛 [𝐸𝑞. 2]
ⅆ𝑇𝑀𝑃
ⅆ𝑡 = TMP increase over time [
𝑘𝑃𝑎
ℎ]
TMPn = TMP at time of 15 min [kPa]
TMPn-1 = TMP at time of 0 min [kPa]
3.4 Membrane Resistance Analysis
The fouling resistances in a membrane filtration can be calculated using Eq. 3 (Crittenden et
al., 2012).
𝐽 =𝛥𝑃
𝜇(R𝑚 + R𝑖𝑚 + R𝑖𝑟 + R𝑐) [𝐸𝑞. 3]
J = Flux [LMH]
ΔP = TMP [kPa]
µ = Viscosity of permeate water at filtration temperature [mPa s]
Rm = Membrane resistance [1/m]
Rim = Irremovable fouling resistance [1/m]
Rir = Irreversible fouling resistance [1/m]
Rc = Cake layer resistance [1/m]
The membrane resistance was calculated based on the data during filtration of the clean
water. The cake layer resistance was calculated based on the resistance difference before and
after physical flushing. The irreversible resistance was calculated based on the resistance

22
difference before and after chemical cleaning. The remaining irremovable resistance was
calculated based on the resistance difference after the chemical cleaning and the membrane
resistance (Wu et al., 2017).
3.5 Fouling Observation via OCT
OCT is a 3D imaging technique, which allows high resolutions on micron scale. The
diagnostic is carried out with ultrashort pulses or near-infrared light. Long wavelength light
is used, which can penetrate deep into the examined medium while photodetectors capture
the reflected signal. The basic principle is shown in Figure 11 (Brezinski, 2006; Sim and
Fane, 2017). As OCT can be conducted in situ, it allows direct observation of membrane
filtration in a non-invasive and non-destructive mode (Dreszer et al., 2014). The scans
provide information on the dynamic thickness and structure of the fouling layer (growth and
detachment of the biofilm) during the filtration. Thus, precise information about cake layer
properties can be attained, such as coverage or specific depositions, without disturbing the
process (Dreszer et al., 2014; Sim and Fane, 2017).
In this study, an OCT equipment (Thorlabs, USA) was integrated with the DMF system and
a quartz plate on the upper part of the filtration cell functioned as an optical window for
performing OCT scans. The OCT images were collected at a certain time interval and the
collected images were processed by Thorimaging software (Thorlabs, USA).
Figure 11. Basic principle of Fourier-domain OCT of fouling process in a membrane
filtration cell (Sim and Fane, 2017)

23
3.6 Analysis of Water Quality and Foulants
Characteristics
3.6.1 Samples
The feed and permeate samples were periodically collected from the DMF system. The cake
layer foulant samples were collected by putting the fouled membrane in a beaker with 30 mL
of distilled water and then sonicating it for 3 to 6 min.
3.6.2 Feed and Permeate Strength (COD, TSS, TOC)
The Chemical Oxygen Demand (COD) was measured using the COD measurement kit
(Hach, USA) according to the manufacturer’s manual and a spectrophotometer (DR3900,
Hach, USA). The resulting COD represented mostly colloidal and soluble organics. As their
size is comparable to MF/ UF pores, they are considered as major foulants. Next, TSS were
analyzed using standard methods (APHA, 1998). Third, the Total Organic Carbon (TOC)
was measured using a TOC/ TN analyzer (Shimadzu, Japan) after filtering the samples with
a 0.45 µm filter.
3.6.3 Liquid Chromatography – Organic Carbon Detection (LC-
OCD)
LC-OCD analysis was employed to quantify the soluble organic fraction in the samples. A
LC-OCD analyzer (DOC-Labor, Germany) with an automated size-exclusion
chromatography integrated with an organic Carbon detector and organic Nitrogen detector
was used. After filtration (0.45 μm), the collected filtrate was further separated according to
molecular weight (MW), e.g. biopolymers (typically MW > 20 kDa), humic substances
(MW ∼ 1000 Da), building blocks (MW ∼ 300-500 Da), low molecular weight (LMW)
organics acids (MW < 300 Da), and neutrals (MW < 300 Da) (Huber et al., 2011).
3.6.4 Inductively Coupled Plasma – Optical Emission
Spectroscopy (ICP-OES)
The cations (Na, Mg, and Ca) in the sample were analyzed by ICP-OES (Perkin Elmer, USA)
after filtration (0.45 µm) and acidification (with a 1% HNO3 solution) of the sample.
3.6.5 Fluorescence Spectrophotometer
A fluorescence spectrophotometer (Agilent Technologies, USA) was used for obtaining an
excitation-emission matrix (EEM) fluorescence spectra in the wavelength range of 280 to
550 nm. Excitation and emission slits were set at 10 nm with a scanning speed of
1000 nm/min. Fluorescence regional integration was applied to describe the volumetric
percentage of a given component with the following relationships between the organic
components and the EEM spectra regions: (I) for aromatic proteins I - like substances,
excitation wavelength (Ex) < 250 nm and emission wavelength (Em) < 330 nm; (II) for
aromatic protein II - like substances, Ex < 250 nm, and Em between 330 nm and 380 nm;
(III) for fulvic acid-like substances, Ex < 250 nm and Em > 380 nm; (IV) for soluble

24
microbial by-product-like substances, Ex between 250 and 280 nm, and Em < 380 nm; and
(V) for humic acid-like substances, Ex > 280 nm and Em > 380 nm (Chen et al., 2003).
3.6.6 Flow Cytometer
After the sample was taken, 1 mL of unfiltered sample was immediately treated with
LIVE/DEAD® BacLightTM bacterial viability kit (Invitrogen, USA) according to the
manufacturer’s instructions. The analysis in a flow cytometer (BD Bioscience, USA)
resulted in the dead and live cell count.
3.6.7 Adenosin Triphosphate (ATP)
For ATP measurements, the Kit CheckLite 250 Plus (Kikkoman, Japan) was used. After the
sample was taken, the unfiltered sample was immediately mixed with ATP-releasing agent
and luciferin-luciferase and its bioluminescence was measured in a luminometer (Lumitester
C-110 by Kikkoman, Japan).
3.6.8 Ion Chromatography (IC)
The concentrations of anions (F, Cl, NO2, Br, NO3, PO4 and SO4) in the sample were
analyzed by the Dionex ICS 1100 (Thermo Fisher Scientific, USA) after filtering (0.45 µm)
the sample.
3.6.9 Goniometer
The contact angles of the physically cleaned (by sonication) and dried membrane samples
were examined by a contact angle analyzer (Data Physics Instruments, Germany).
3.6.10 Fourier-Transform Infrared Spectroscopy (FTIR)
The transmittance spectrum of the function groups on the physically cleaned (by sonication)
and dried membrane samples were examined by a FTIR (Shimadzu, Japan).
3.6.11 Scanning Electron Microscopy (SEM)
After filtration, the membrane was carefully removed from the filtration cell and pre-treated
using a Heraeus vacuum oven (Thermo Scientific, USA) at 40 °C for 15 h to remove the
moisture content. After the dried membrane was sputter-coated with platinum, a field
emission scanning electronic microscope (JEOL, Japan) was used to characterize the
membrane surface morphology.
25
4 Results and Discussion
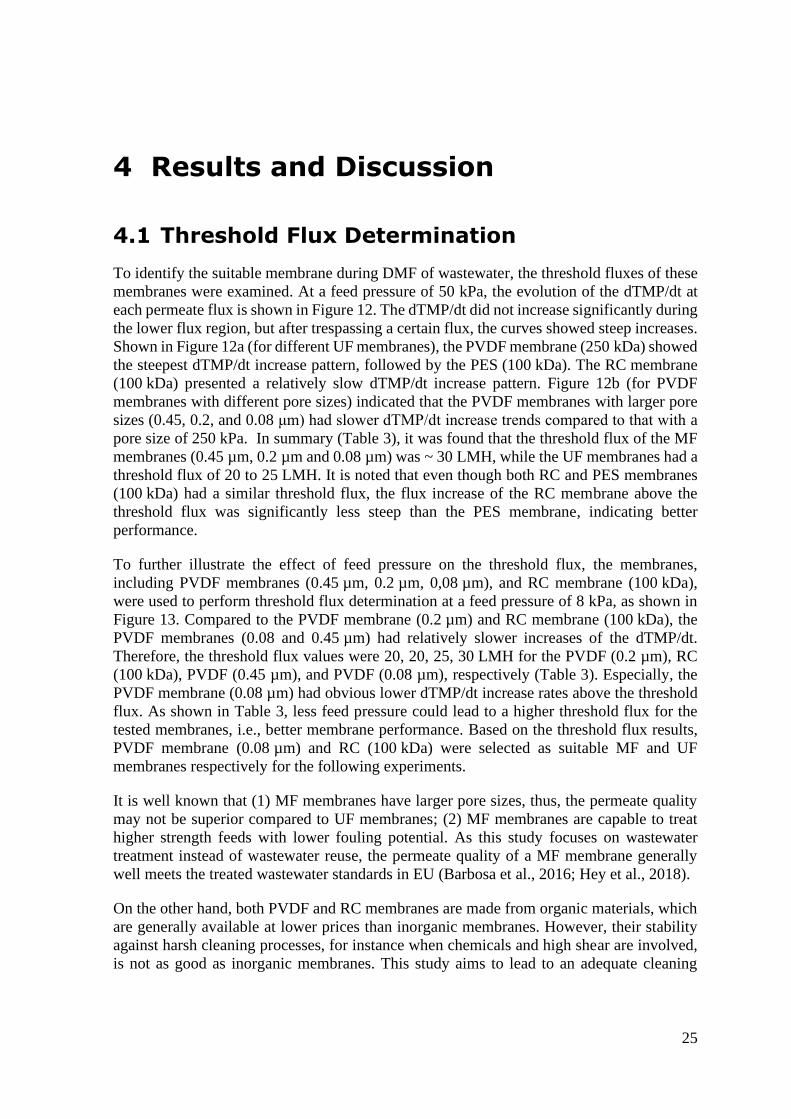
4.1 Threshold Flux Determination
To identify the suitable membrane during DMF of wastewater, the threshold fluxes of these
membranes were examined. At a feed pressure of 50 kPa, the evolution of the dTMP/dt at
each permeate flux is shown in Figure 12. The dTMP/dt did not increase significantly during
the lower flux region, but after trespassing a certain flux, the curves showed steep increases.
Shown in Figure 12a (for different UF membranes), the PVDF membrane (250 kDa) showed
the steepest dTMP/dt increase pattern, followed by the PES (100 kDa). The RC membrane
(100 kDa) presented a relatively slow dTMP/dt increase pattern. Figure 12b (for PVDF
membranes with different pore sizes) indicated that the PVDF membranes with larger pore
sizes (0.45, 0.2, and 0.08 μm) had slower dTMP/dt increase trends compared to that with a
pore size of 250 kPa. In summary (Table 3), it was found that the threshold flux of the MF
membranes (0.45 µm, 0.2 µm and 0.08 µm) was ~ 30 LMH, while the UF membranes had a
threshold flux of 20 to 25 LMH. It is noted that even though both RC and PES membranes
(100 kDa) had a similar threshold flux, the flux increase of the RC membrane above the
threshold flux was significantly less steep than the PES membrane, indicating better
performance.
To further illustrate the effect of feed pressure on the threshold flux, the membranes,
including PVDF membranes (0.45 µm, 0.2 µm, 0,08 µm), and RC membrane (100 kDa),
were used to perform threshold flux determination at a feed pressure of 8 kPa, as shown in
Figure 13. Compared to the PVDF membrane (0.2 µm) and RC membrane (100 kDa), the
PVDF membranes (0.08 and 0.45 µm) had relatively slower increases of the dTMP/dt.
Therefore, the threshold flux values were 20, 20, 25, 30 LMH for the PVDF (0.2 µm), RC
(100 kDa), PVDF (0.45 µm), and PVDF (0.08 µm), respectively (Table 3). Especially, the
PVDF membrane (0.08 µm) had obvious lower dTMP/dt increase rates above the threshold
flux. As shown in Table 3, less feed pressure could lead to a higher threshold flux for the
tested membranes, i.e., better membrane performance. Based on the threshold flux results,
PVDF membrane (0.08 µm) and RC (100 kDa) were selected as suitable MF and UF
membranes respectively for the following experiments.
It is well known that (1) MF membranes have larger pore sizes, thus, the permeate quality
may not be superior compared to UF membranes; (2) MF membranes are capable to treat
higher strength feeds with lower fouling potential. As this study focuses on wastewater
treatment instead of wastewater reuse, the permeate quality of a MF membrane generally
well meets the treated wastewater standards in EU (Barbosa et al., 2016; Hey et al., 2018).
On the other hand, both PVDF and RC membranes are made from organic materials, which
are generally available at lower prices than inorganic membranes. However, their stability
against harsh cleaning processes, for instance when chemicals and high shear are involved,
is not as good as inorganic membranes. This study aims to lead to an adequate cleaning

26
protocol, which reduces chemical usage compared to other membrane processes. Therefore,
the chosen membranes promise to be compatible with the protocol.
Figure 12. The dTMP/dt profiles for threshold flux determination (at a feed pressure of
50 kPa)

27
Table 3. A summary of threshold fluxes of the tested membranes
Feed
pressure Membrane
material Pore size
Clean water
permeability
Membrane
resistance
Threshold
flux
LMH/ kPa ×1012/ m LMH
50 kPa
PVDF 0.45 µm 1.27 2.8 30
PVDF 0.2 µm 1.47 2.5 30
PVDF 0.08 µm 1.83 2.0 30
PVDF 250 kDa 1.12 3.2 20
RC 100 kDa 1.39 2.6 25
PES 100 kDa 0.83 4.4 25
8 kPa
PVDF 0.45 µm 2.15 1.7 25
PVDF 0.2 µm 1.75 2.1 20
PVDF 0.08 µm 4.36 0.8 30
RC 100 kDa 3.07 1.2 20
Figure 13. The dTMP/dt profiles for threshold flux determination (at a feed pressure of 8
kPa)

28
4.2 Effect of Operation Conditions on DMF
Performance
4.2.1 Feed Pressure under Continuous and Intermittent
Filtration
The TMP evolution profiles of the PVDF and RC membranes during DMF of wastewater at
different feed pressures is shown in Figure 14. First, during the lower feed pressure
operation, the TMP of the PVDF filtration started at about 5 kPa and stayed mostly constant
during the first hour, which was similar to that of the RC membrane. After that, their TMP
levels increased constantly with extending filtration time. Next, in the operation with the
higher feed pressure condition, the initial TMPs were in similar ranges as those in the low-
pressure operation. After that, the TMP increased faster for the RC membrane than the PVDF
membrane.
The results clearly showed that the filtrations at the lower feed pressure were more
sustainable due to their lower TMP increases. The influence of feed pressure on the PVDF
membrane filtration was less significant compared to that on the RC membrane filtration.
This result leads to the assumption that the dependence of the fouling on feed pressure is
closely linked to the membrane characteristics. The interactions between foulants and RC
membrane were stronger at the higher feed pressure than at the lower feed pressure, whereas
such interactions with PVDF membranes may not be strongly associated with feed pressure.
Figure 14. TMP evolution of PVDF (a) and RC membranes (b) at different feed pressures
with clean water flushing and chemical cleaning after filtration
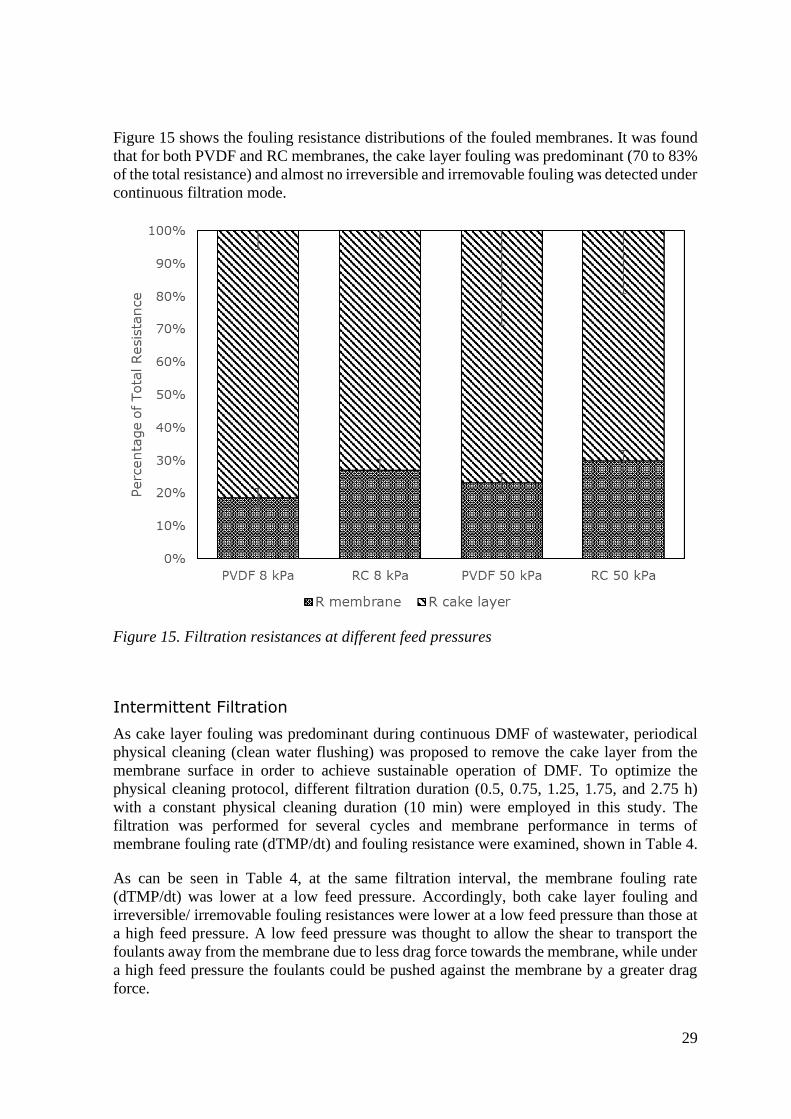
29
Figure 15 shows the fouling resistance distributions of the fouled membranes. It was found
that for both PVDF and RC membranes, the cake layer fouling was predominant (70 to 83%
of the total resistance) and almost no irreversible and irremovable fouling was detected under
continuous filtration mode.
Intermittent Filtration
As cake layer fouling was predominant during continuous DMF of wastewater, periodical
physical cleaning (clean water flushing) was proposed to remove the cake layer from the
membrane surface in order to achieve sustainable operation of DMF. To optimize the
physical cleaning protocol, different filtration duration (0.5, 0.75, 1.25, 1.75, and 2.75 h)
with a constant physical cleaning duration (10 min) were employed in this study. The
filtration was performed for several cycles and membrane performance in terms of
membrane fouling rate (dTMP/dt) and fouling resistance were examined, shown in Table 4.
As can be seen in Table 4, at the same filtration interval, the membrane fouling rate
(dTMP/dt) was lower at a low feed pressure. Accordingly, both cake layer fouling and
irreversible/ irremovable fouling resistances were lower at a low feed pressure than those at
a high feed pressure. A low feed pressure was thought to allow the shear to transport the
foulants away from the membrane due to less drag force towards the membrane, while under
a high feed pressure the foulants could be pushed against the membrane by a greater drag
force.
Figure 15. Filtration resistances at different feed pressures
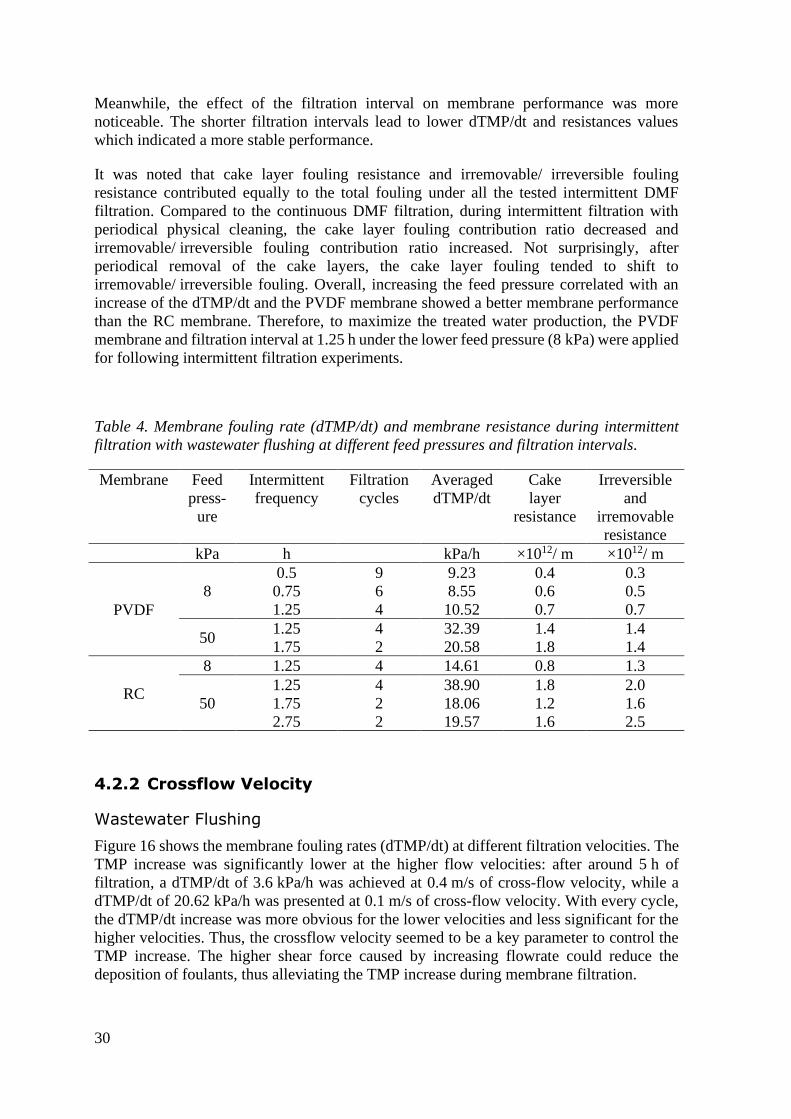
30
Meanwhile, the effect of the filtration interval on membrane performance was more
noticeable. The shorter filtration intervals lead to lower dTMP/dt and resistances values
which indicated a more stable performance.
It was noted that cake layer fouling resistance and irremovable/ irreversible fouling
resistance contributed equally to the total fouling under all the tested intermittent DMF
filtration. Compared to the continuous DMF filtration, during intermittent filtration with
periodical physical cleaning, the cake layer fouling contribution ratio decreased and
irremovable/ irreversible fouling contribution ratio increased. Not surprisingly, after
periodical removal of the cake layers, the cake layer fouling tended to shift to
irremovable/ irreversible fouling. Overall, increasing the feed pressure correlated with an
increase of the dTMP/dt and the PVDF membrane showed a better membrane performance
than the RC membrane. Therefore, to maximize the treated water production, the PVDF
membrane and filtration interval at 1.25 h under the lower feed pressure (8 kPa) were applied
for following intermittent filtration experiments.
Table 4. Membrane fouling rate (dTMP/dt) and membrane resistance during intermittent
filtration with wastewater flushing at different feed pressures and filtration intervals.
Membrane Feed
press-
ure
Intermittent
frequency
Filtration
cycles
Averaged
dTMP/dt
Cake
layer
resistance
Irreversible
and
irremovable
resistance
kPa h kPa/h ×1012/ m ×1012/ m
PVDF
8
0.5 9 9.23 0.4 0.3
0.75 6 8.55 0.6 0.5
1.25 4 10.52 0.7 0.7
50 1.25 4 32.39 1.4 1.4
1.75 2 20.58 1.8 1.4
RC
8 1.25 4 14.61 0.8 1.3
50
1.25 4 38.90 1.8 2.0
1.75 2 18.06 1.2 1.6
2.75 2 19.57 1.6 2.5
4.2.2 Crossflow Velocity
Wastewater Flushing
Figure 16 shows the membrane fouling rates (dTMP/dt) at different filtration velocities. The
TMP increase was significantly lower at the higher flow velocities: after around 5 h of
filtration, a dTMP/dt of 3.6 kPa/h was achieved at 0.4 m/s of cross-flow velocity, while a
dTMP/dt of 20.62 kPa/h was presented at 0.1 m/s of cross-flow velocity. With every cycle,
the dTMP/dt increase was more obvious for the lower velocities and less significant for the
higher velocities. Thus, the crossflow velocity seemed to be a key parameter to control the
TMP increase. The higher shear force caused by increasing flowrate could reduce the
deposition of foulants, thus alleviating the TMP increase during membrane filtration.

31
Figure 17 depicts the resistance of the intermittent filtrations with the PVDF membrane at
different flow velocities. Clearly, increasing flow velocity led to decreased cake layer
resistance. The cake layer resistance at 0.4 m/s of velocity (mean: 1.2*1011 1/m) was
considerately lower than that at 0.1 m/s of velocity (mean: 6.9*1011 1/m). The irreversible
and irremovable fouling resistances at a higher flow velocity were significantly lower than
those at 0.1 m/s of velocity. Even though the irreversible and irremovable fouling resistances
at 0.4 m/s of velocity started at a higher level than that at 0.2 m/s of velocity, the increase
was less steep throughout the filtration. These observations confirmed the dTMP/dt data,
that the filtration was significantly more stable when the flow velocity was increased.
Figure 16. Membrane fouling rate (dTMP/dt) during intermittent filtration with wastewater
flushing at different flow rates

32
4.2.3 Cleaning Protocol
Tap Water Flushing
The PVDF membranes were further tested for intermittent filtration with tap water flushing
at 25 and 50 °C, which is shown in Figure 18. The dTMP/dt of the filtration with wastewater
flushing was clearly higher than those when cold or heated tap water were used (after
approximately 5. With extending filtration time, the differences between these conditions
Figure 17. Cake layer (a) and irreversible and irremovable (b) fouling resistances at
various flow velocities during intermittent filtration with wastewater flushing (25 °C, 0.1
m/s).

33
appeared to be significant. Further, the flushing with heated tap water led to a significantly
lower dTMP/dt increase than flushing with cold tap water or wastewater. The results of the
wastewater flushing filtration suggested a greater tendency of foulant accumulation on or in
the membrane. Based on the experimental data, using heated tap water for flushing could be
a crucial factor for stable operation. Besides the mechanical scrubbing of the membrane, the
higher temperatures increase the solubility of fouling substances and thus favor their removal
from the membrane.
Figure 19 shows the dTMP/dt results of intermittent filtrations with 50 °C tap water flushing
at various flushing and filtration flow velocities (0.1, 0.2 and 0.4 m/s). During the filtrations
run at the lower flow rate (0.1 m/s) which was increased to 0.2 and 0.4 m/s during flushing,
the TMP increased faster (mean dTMP/dt: 6.01 and 9.48 kPa/h respectively) than at the
filtrations at a constant flowrate for filtration and flushing. On the other hand, when the
filtration and flushing was run at the same flowrate, the filtrations with higher flow velocities
showed a lower TMP increase, compared to that at 0.1 m/s (0.1 m/s: 3.62 kPa/h, 0.2 m/s:
2.94 kPa/h and 0.4 m/s: 0.54 kPa/h). This phenomenon can be explained by the relation
between flow velocity and TMP. When the flow velocity was increased, the TMP also
increased. The higher TMP prevented membrane relaxation for foulant removal and
potentially compressed the cake layer on the membrane. The tightly attached cake layer
foulants thus turned into irreversible fouling. However, the TMP after flushing was still
lower than that before flushing. This indicates that loosely attached cake layer foulants were
removed during flushing. On the other hand, when filtration and flushing were performed at
the same flow velocity, the filtration stability was improved. These results indicate the
importance of high shear for long-term filtration.
Figure 18. Membrane fouling rate (dTMP/dt) at varying temperatures during intermittent
filtration with tap water flushing (0.1 m/s).
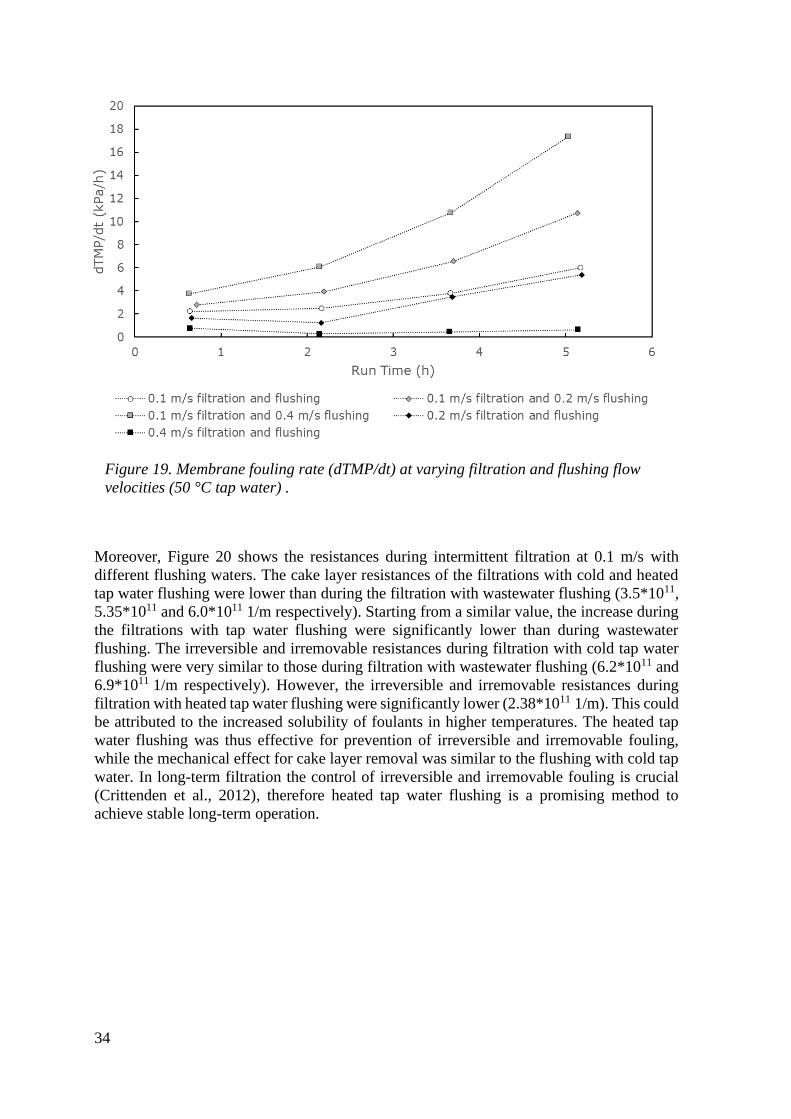
34
Moreover, Figure 20 shows the resistances during intermittent filtration at 0.1 m/s with
different flushing waters. The cake layer resistances of the filtrations with cold and heated
tap water flushing were lower than during the filtration with wastewater flushing (3.5*1011,
5.35*1011 and 6.0*1011 1/m respectively). Starting from a similar value, the increase during
the filtrations with tap water flushing were significantly lower than during wastewater
flushing. The irreversible and irremovable resistances during filtration with cold tap water
flushing were very similar to those during filtration with wastewater flushing (6.2*1011 and
6.9*1011 1/m respectively). However, the irreversible and irremovable resistances during
filtration with heated tap water flushing were significantly lower (2.38*1011 1/m). This could
be attributed to the increased solubility of foulants in higher temperatures. The heated tap
water flushing was thus effective for prevention of irreversible and irremovable fouling,
while the mechanical effect for cake layer removal was similar to the flushing with cold tap
water. In long-term filtration the control of irreversible and irremovable fouling is crucial
(Crittenden et al., 2012), therefore heated tap water flushing is a promising method to
achieve stable long-term operation.
Figure 19. Membrane fouling rate (dTMP/dt) at varying filtration and flushing flow
velocities (50 °C tap water) .

35
Figure 21 shows the resistances during intermittent crossflow filtrations with hot tap water
flushing at different flow and flushing velocities. The resistances of the filtration where the
flow velocity was only increased during flushing (mean, cake layer: 6.85*1011 and 8.4*1011
1/m; mean irreversible and irremovable: 4.68*1011 and 5.5*1011 1/m) were clearly higher
than during filtration with constant flow velocity (mean cake layer: 5.35*1011, 3.23*1011 and
1.12*1011 1/m; mean irreversible and irremovable: 2.38*1011, 1.86*1011 and 0.00 1/m).
Especially the irremovable and irreversible resistances showed steep increases when the flow
velocity was only increased during flushing. The increase of the cake layer resistances was
similar throughout all filtrations, but the starting value was lower for the ones with a constant
flow velocity through filtration and flushing. The constant 0.4 m/s filtration did not show
Figure 20. Cake layer (a) and irreversible and irremovable (b) resistance at varying
temperatures during intermittent filtration with tap water flushing (0.1 m/s).

36
any increase in the cake layer resistance and all irremovable and irreversible fouling values
were zero. These observations implied that by increasing the flow velocity only during
flushing, the cake layer was compressed and tightly attached foulants shifted to irreversible
fouling.
Figure 21. Cake layer (a) and irreversible and irremovable (b) fouling resistances at
1.25 h filtration interval and varying filtration and flushing flow velocities (rates with
50 °C tap water).
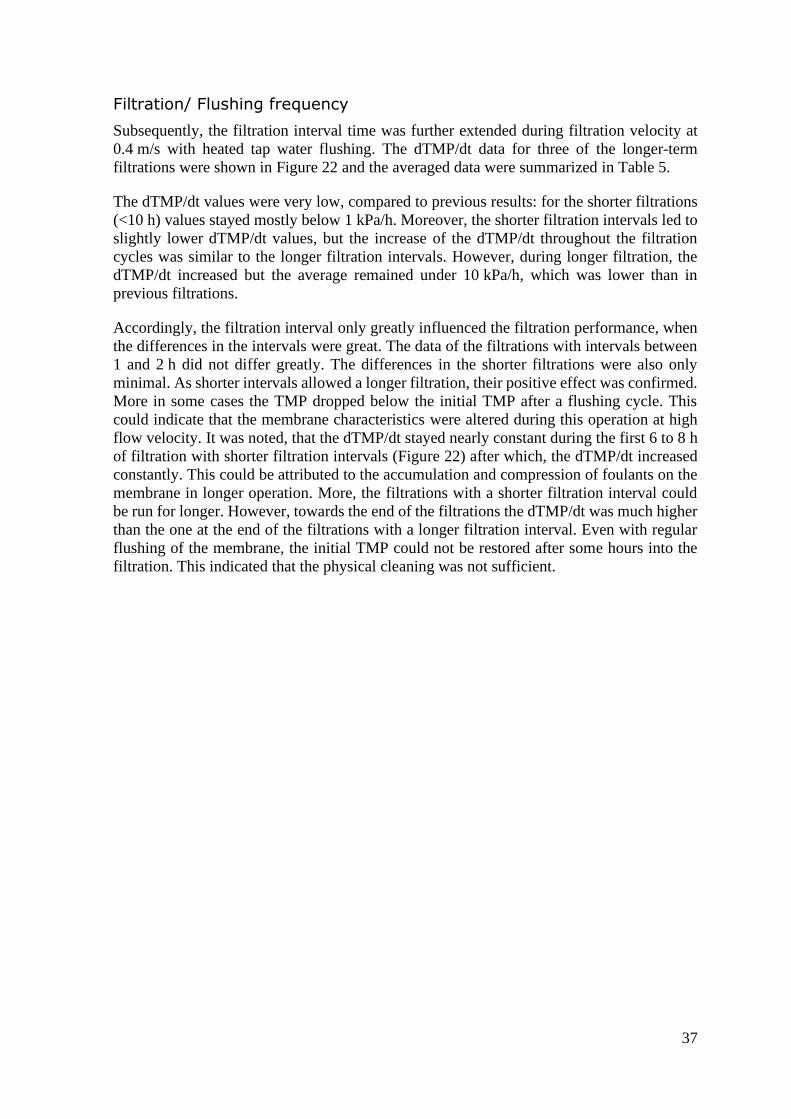
37
Filtration/ Flushing frequency
Subsequently, the filtration interval time was further extended during filtration velocity at
0.4 m/s with heated tap water flushing. The dTMP/dt data for three of the longer-term
filtrations were shown in Figure 22 and the averaged data were summarized in Table 5.
The dTMP/dt values were very low, compared to previous results: for the shorter filtrations
(<10 h) values stayed mostly below 1 kPa/h. Moreover, the shorter filtration intervals led to
slightly lower dTMP/dt values, but the increase of the dTMP/dt throughout the filtration
cycles was similar to the longer filtration intervals. However, during longer filtration, the
dTMP/dt increased but the average remained under 10 kPa/h, which was lower than in
previous filtrations.
Accordingly, the filtration interval only greatly influenced the filtration performance, when
the differences in the intervals were great. The data of the filtrations with intervals between
1 and 2 h did not differ greatly. The differences in the shorter filtrations were also only
minimal. As shorter intervals allowed a longer filtration, their positive effect was confirmed.
More in some cases the TMP dropped below the initial TMP after a flushing cycle. This
could indicate that the membrane characteristics were altered during this operation at high
flow velocity. It was noted, that the dTMP/dt stayed nearly constant during the first 6 to 8 h
of filtration with shorter filtration intervals (Figure 22) after which, the dTMP/dt increased
constantly. This could be attributed to the accumulation and compression of foulants on the
membrane in longer operation. More, the filtrations with a shorter filtration interval could
be run for longer. However, towards the end of the filtrations the dTMP/dt was much higher
than the one at the end of the filtrations with a longer filtration interval. Even with regular
flushing of the membrane, the initial TMP could not be restored after some hours into the
filtration. This indicated that the physical cleaning was not sufficient.

38
Figure 22. Membrane fouling rate (dTMP/dt) during intermittent filtration with heated tap water flushing

39
Table 5. Membrane fouling rate (dTMP/dt) and resistance values during intermittent
filtration with heated tap water flushing
Intermittent
frequency
Filtration
cycles
Averaged
dTMP/dt
Cake
layer
resistance
Irreversible
and
irremovable
resistance
h kPa/h ×1011/ m ×1011/ m
1.25 4 0.54 1.12 0.00
2.0 3 0.46 1.74 0.00
4.0 2 0.74 4.86 0.20
5.5 1 1.01 8.26 0.31
1.0 15 8.61 8.83 7.00
1.5 11 5.35 7.24 3.34
2.0 9 4.13 6.86 5.05
4.0 4 3.57 9.34 7.32
6.0 3 3.35 13.92 4.96
Based on the experimental results shown in Table 5, cake layer fouling resistance and
irreversible and irremovable fouling resistance appeared to increase with extending filtration
cycles. During the shorter filtration period (up to 4 filtrations cycles), irreversible and
irremovable resistance was close to zero, thus cake layer resistance was dominant. However,
with extending filtration cycles, the cake layer fouling resistance and irreversible and
irremovable resistance were comparable. This was caused by the steep increase of
irreversible and irremovable resistance after 8 to 10 h of filtration (Figure 23), which
correlated with the dTMP/dt increase. This suggested that under current operation
conditions, fouling could be only mostly controlled during the first 8-10 h of operation. This
could be attributed to the accumulation of foulants and compression of the cake layer during
longer filtration. This indicated that a long-term operation needed additional measures as
intermittent heated tap water flushing and an increased flow velocity did not mitigate
fouling.

40
4.2.4 Direct Observation of Fouling via OCT
The OCT scans taken during the filtration and cleaning processes at 8 kPa and 50 kPa feed
pressure are presented in Figure 24 and Figure 25 respectively. The red lines were manually
added to emphasize the position of the membrane surface. The thickness data is further
shown in Figure 26.
Figure 23. Resistances during intermittent filtration with heated tap water
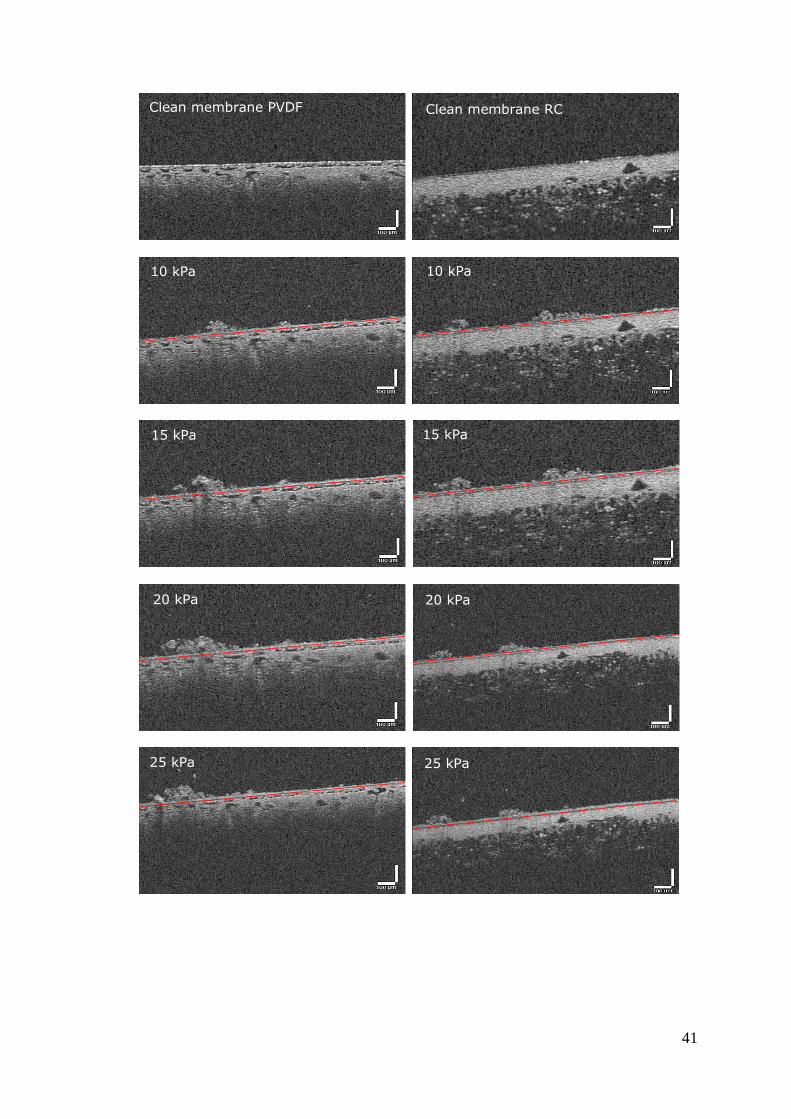
41
Clean membrane PVDF
10 kPa
15 kPa
20 kPa
25 kPa
Clean membrane RC
10 kPa
15 kPa
20 kPa
25 kPa

42
Figure 24. OCT images of the cake layer evolution – PVDF (left) and RC (right) at 8 kPa
feed pressure, 0.1 m/s filtration, clean water flushing and chemical cleaning with 0.5 %
NaOCl.
During flushing
(1 min)
After flushing
During flushing
(1 min)
After flushing
After chemical cleaning After chemical cleaning
During flushing
(5 min)
During flushing
(4 min)

43
Clean membrane
10 kPa
15 kPa
20 kPa
25 kPa
Clean membrane
10 kPa
15 kPa
25 kPa
20 kPa

44
Figure 25. OCT images of the cake layer evolution – PVDF (left) and RC (right) at 50 kPa
feed pressure, 0.1 m/s filtration, clean water flushing and chemical cleaning with 0.5 %
NaOCl.
As shown in the Figure 26, the building up of the cake layer followed the same pattern for
all conducted filtrations. When the TMP reached 10 kPa, a thin cake layer could be seen
with some additional small mushroom-like depositions. With the increase of the TMP, the
cake layer did not grow significantly. Instead the number and size of mushroom-like
depositions increased. This suggested that the density of the cake layer increased.
Concerning the RC membrane, the cake layer kept growing slightly until a TMP of 20 kPa
was reached. In this case, the cake layer density and thickness both increased, which
corresponded to an increase of TMP. The evolution of the cake layer on the RC membranes
was very similar at the two different feed pressures. However, the PVDF filtration showed
a slight trend: the 50 kPa feed pressure filtration created a thicker cake layer, than the 8 kPa
feed pressure filtration. The evolution however was similar after the initial divergence.
After flushing
After chemical cleaning After chemical cleaning
After flushing
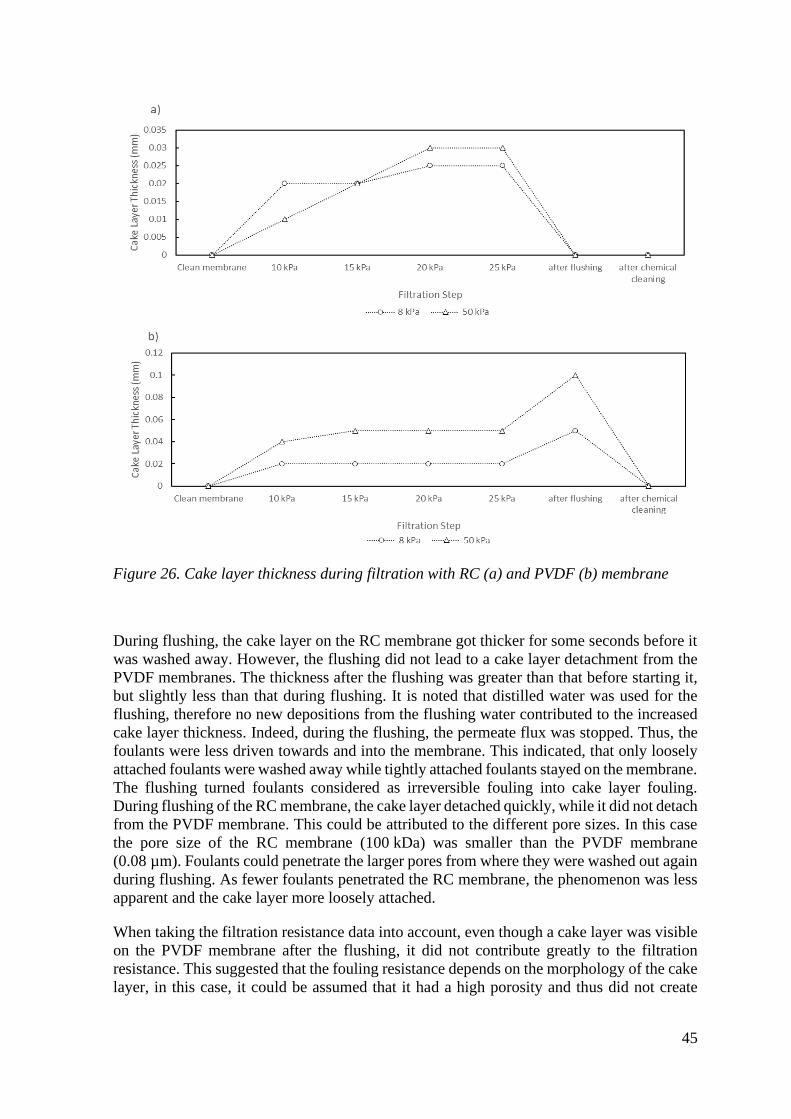
45
During flushing, the cake layer on the RC membrane got thicker for some seconds before it
was washed away. However, the flushing did not lead to a cake layer detachment from the
PVDF membranes. The thickness after the flushing was greater than that before starting it,
but slightly less than that during flushing. It is noted that distilled water was used for the
flushing, therefore no new depositions from the flushing water contributed to the increased
cake layer thickness. Indeed, during the flushing, the permeate flux was stopped. Thus, the
foulants were less driven towards and into the membrane. This indicated, that only loosely
attached foulants were washed away while tightly attached foulants stayed on the membrane.
The flushing turned foulants considered as irreversible fouling into cake layer fouling.
During flushing of the RC membrane, the cake layer detached quickly, while it did not detach
from the PVDF membrane. This could be attributed to the different pore sizes. In this case
the pore size of the RC membrane (100 kDa) was smaller than the PVDF membrane
(0.08 µm). Foulants could penetrate the larger pores from where they were washed out again
during flushing. As fewer foulants penetrated the RC membrane, the phenomenon was less
apparent and the cake layer more loosely attached.
When taking the filtration resistance data into account, even though a cake layer was visible
on the PVDF membrane after the flushing, it did not contribute greatly to the filtration
resistance. This suggested that the fouling resistance depends on the morphology of the cake
layer, in this case, it could be assumed that it had a high porosity and thus did not create
Figure 26. Cake layer thickness during filtration with RC (a) and PVDF (b) membrane

46
significant resistance. However, in longer filtration these converted foulants could be
compressed during the following filtration step and thus contributed to the increases of
resistance and TMP.
To investigate the cake layer behavior during flushing, the 50 kPa feed pressure filtration
was repeated and the flow velocity was changed during flushing. The corresponding scans
are shown in Figure 27.
During flushing (0.25 m/s)
During flushing (after 15 min at 0.2 m/s)
During flushing (0.2 m/s)
25 kPa

47
Figure 27. Cake layer evolution during clean water at varying flow velocities flushing of
the PVDF membrane after filtration at 50 kPa feed pressure and 0.1 m/s flow velocity.
After flushing
During flushing (after relaxation from 0.4 to 0.1 to 0.4 m/s)
During flushing (0.4 m/s)
During flushing (0.35 m/s)
During flushing (0.3 m/s)

48
The increase of the flow velocity during flushing only had little effect on the cake layer
thickness. At the beginning of each increase step, the thickness reduced slightly, but after 5
more minutes of flushing, no more changes could be detected. At a flow velocity of 0.4 m/s,
a feed pressure of 25 kPa was reached. In order to relax the membrane during the flushing,
it was tested to reduce the flow velocity back to 0.1 m/s before increasing it to 0.4 m/s again.
This also slightly reduced the cake layer but failed to remove it as efficiently as the flushing
did on the RC membrane. In addition, the structure of the cake layer changed during the
flushing. The cake layer thickness varied in the beginning, before some of the thicker parts
were washed away. After only a few minutes, the cake layer thickness looked homogenous
throughout the scanned line. These observations implied, that the tightly attached foulants
can partly be removed by an increased flow velocity but failed to be removed completely.
Nevertheless, an increased flow velocity could be beneficial for more stable operation, as
less foulants remain on the membrane.
The averaged cake layer thicknesses of the intermittent filtrations with the PVDF membrane
are shown in Table 6. It could clearly be seen that the cake layers built up more significantly
during the higher feed pressure filtration. Moreover, in average the flushing lead to an
increase in the cake layer thickness. This indicated that the higher feed pressure prevented
foulants from being removed by the shear during both filtration and flushing. This confirms
the TMP results, as the filtration at 50 kPa feed pressure showed steeper TMP increases,
indicating that lower feed pressure was the preferred operation condition.
The filtrations with increased flow velocities as well as flushing with tap water led to an
increased cake layer thickness. However, as the TMP results showed more stable operation
under these conditions, it is suggested that the cake layer is less dense and thus creates less
resistance. In addition, when flushing was conducted at an increased flow velocity, the total
thickness was slightly lower than during constant low flow velocity and no increase in cake
layer thickness during flushing could be detected. This suggested that due to the higher TMP
caused by the increased flow velocity, the tightly attached foulants were compressed during
flushing and only loosely attached foulants could be washed away. In contrast, when the
constant increased flow velocity was coupled with hot tap water flushing, the cake layers
were mostly thinner than under the previous conditions and did not show increases during
flushing. This correlated with the TMP results as these conditions created the most stable
operation. Moreover, for longer filtration intervals, the thickness was slightly higher than for
shorter filtration intervals. Therefore, the shorter filtration intervals were proposed for
further filtration experiments as the compression of remaining foulants after flushing was
prevented.

49
Table 6. Averaged cake layer thickness data for different operation conditions during
intermittent filtration
Feed
press-
ure
Fil-
tration
interval
Filtration
crossflow
velocity
Flushing
crossflow
velocity
Flushing
water
Cy-
cles
Averaged
thickness
after
filtration
Averaged
thickness
after
cleaning
h m/s m/s µm µm
50 1.75 0.1 0.1 Wastewater 2 25 30
50 1.25 0.1 0.1 Wastewater 4 21 26
8 1.25 0.1 0.1 Wastewater 4 8 5
8 0.75 0.1 0.1 Wastewater 6 3 5
8 0.5 0.1 0.1 Wastewater 8 6 5
8 1.25 0.2 0.2 Wastewater 4 16 15
30 1.25 0.4 0.4 Wastewater 3 10 10
8 1.25 0.1 0.1 Tap water
(25 °C) 4 18 18
8 1.25 0.1 0.1 Tap water
(50 °C) 4 13 20
8 1.0 0.1 0.1 Tap water
(50 °C) 5 18 22
8 1.25 0.1 0.2 Tap water
(50 °C) 4 13 13
8 1.25 0.1 0.4 Tap water
(50 °C) 4 10 8
8 1.25 0.2 0.2 Tap water
(50 °C) 4 1 3
30 1.25 0.4 0.4 Tap water
(50 °C) 4 0 0
30 2.0 0.4 0.4 Tap water
(50 °C) 3 5 5
30 4.0 0.4 0.4 Tap water
(50 °C) 2 20 20
30 5.5 0.4 0.4 Tap water
(50 °C) 1 5 5
4.3 Long-term Performance of DMF
As irreversible and irremovable fouling were found to be an important factor during longer-
term filtration, chemical-enhanced physical cleaning was implemented with periodical
physical cleaning to control membrane fouling in order to achieve sustainable DMF
operation. The resulting TMP curve during 230 h-filtration is shown in Figure 28 and the
corresponding dTMP/dt values in Figure 29. It is noted that between 182 and 191 h of
filtration (in yellow), the feed pump turned off due to electricity supply issues. In
consequence, there was no collected data for this interval.
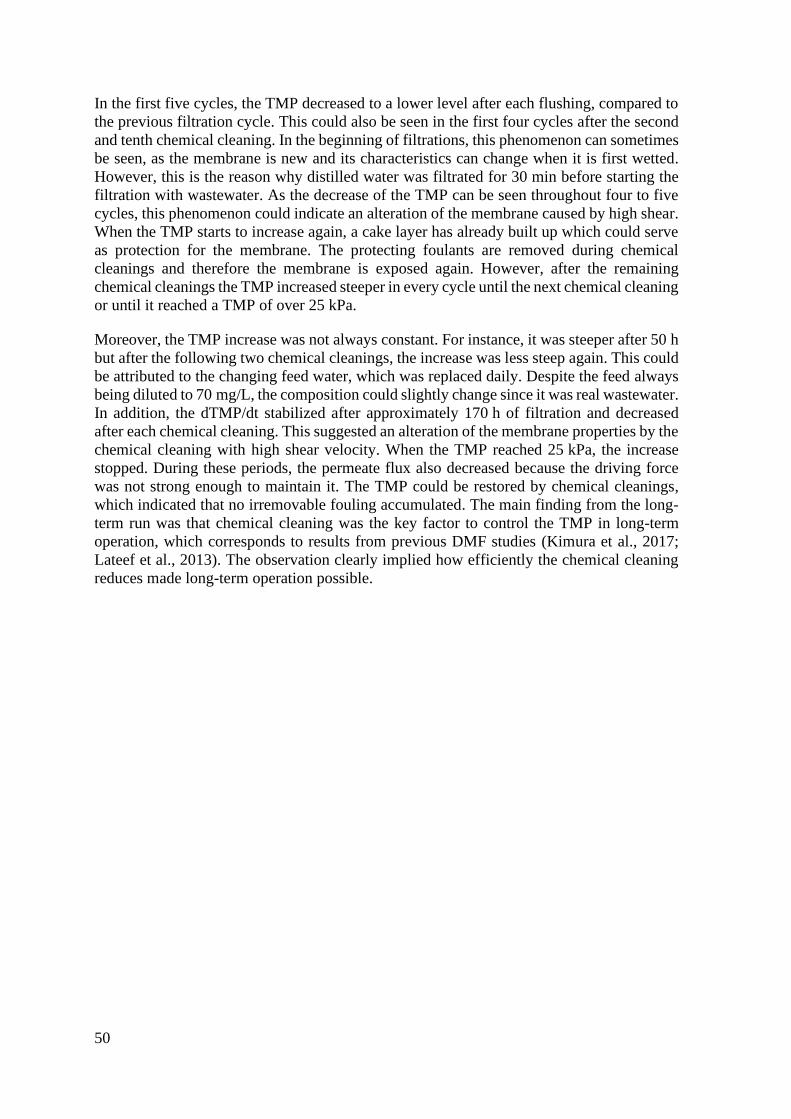
50
In the first five cycles, the TMP decreased to a lower level after each flushing, compared to
the previous filtration cycle. This could also be seen in the first four cycles after the second
and tenth chemical cleaning. In the beginning of filtrations, this phenomenon can sometimes
be seen, as the membrane is new and its characteristics can change when it is first wetted.
However, this is the reason why distilled water was filtrated for 30 min before starting the
filtration with wastewater. As the decrease of the TMP can be seen throughout four to five
cycles, this phenomenon could indicate an alteration of the membrane caused by high shear.
When the TMP starts to increase again, a cake layer has already built up which could serve
as protection for the membrane. The protecting foulants are removed during chemical
cleanings and therefore the membrane is exposed again. However, after the remaining
chemical cleanings the TMP increased steeper in every cycle until the next chemical cleaning
or until it reached a TMP of over 25 kPa.
Moreover, the TMP increase was not always constant. For instance, it was steeper after 50 h
but after the following two chemical cleanings, the increase was less steep again. This could
be attributed to the changing feed water, which was replaced daily. Despite the feed always
being diluted to 70 mg/L, the composition could slightly change since it was real wastewater.
In addition, the dTMP/dt stabilized after approximately 170 h of filtration and decreased
after each chemical cleaning. This suggested an alteration of the membrane properties by the
chemical cleaning with high shear velocity. When the TMP reached 25 kPa, the increase
stopped. During these periods, the permeate flux also decreased because the driving force
was not strong enough to maintain it. The TMP could be restored by chemical cleanings,
which indicated that no irremovable fouling accumulated. The main finding from the long-
term run was that chemical cleaning was the key factor to control the TMP in long-term
operation, which corresponds to results from previous DMF studies (Kimura et al., 2017;
Lateef et al., 2013). The observation clearly implied how efficiently the chemical cleaning
reduces made long-term operation possible.

51
Figure 28. TMP curve during intermittent long-term filtration with heated tap water flushing and chemical cleanings (red lines)
Figure 29. dTMP/dt during long-term intermittent filtration with heated tap water flushing and
chemical cleanings (red lines)
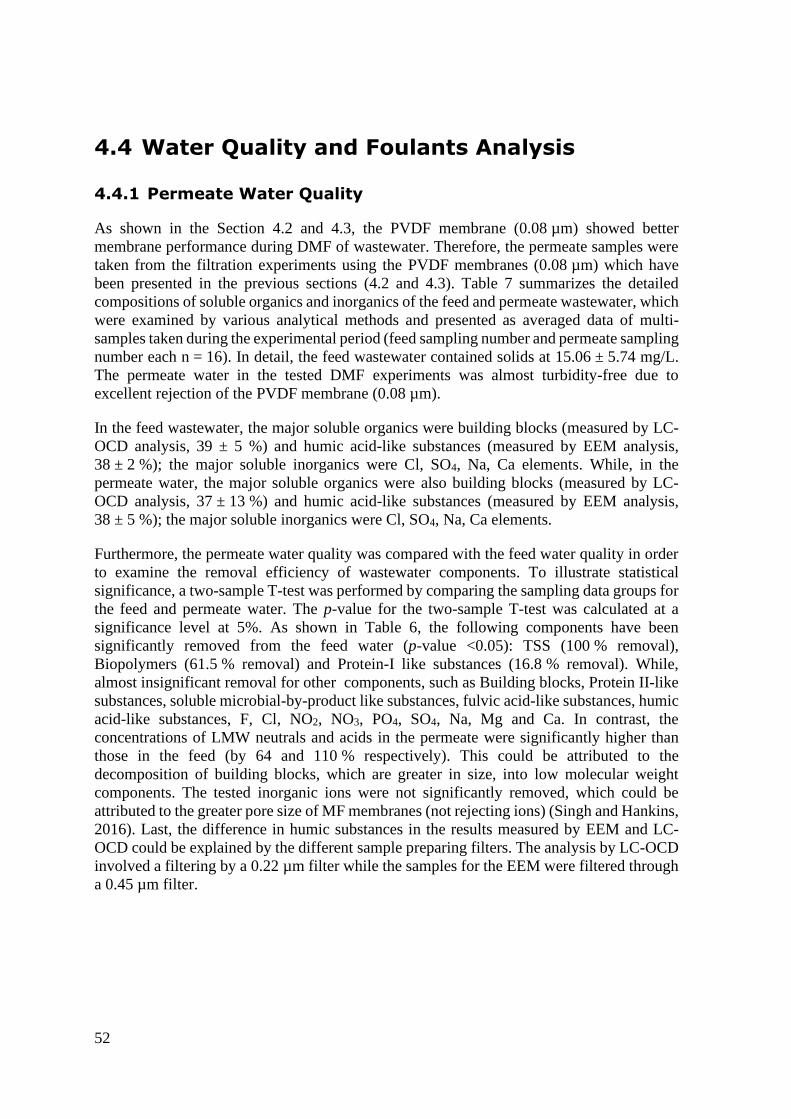
52
4.4 Water Quality and Foulants Analysis
4.4.1 Permeate Water Quality
As shown in the Section 4.2 and 4.3, the PVDF membrane (0.08 µm) showed better
membrane performance during DMF of wastewater. Therefore, the permeate samples were
taken from the filtration experiments using the PVDF membranes (0.08 µm) which have
been presented in the previous sections (4.2 and 4.3). Table 7 summarizes the detailed
compositions of soluble organics and inorganics of the feed and permeate wastewater, which
were examined by various analytical methods and presented as averaged data of multi-
samples taken during the experimental period (feed sampling number and permeate sampling
number each n = 16). In detail, the feed wastewater contained solids at 15.06 ± 5.74 mg/L.
The permeate water in the tested DMF experiments was almost turbidity-free due to
excellent rejection of the PVDF membrane (0.08 µm).
In the feed wastewater, the major soluble organics were building blocks (measured by LC-
OCD analysis, 39 ± 5 %) and humic acid-like substances (measured by EEM analysis,
38 ± 2 %); the major soluble inorganics were Cl, SO4, Na, Ca elements. While, in the
permeate water, the major soluble organics were also building blocks (measured by LC-
OCD analysis, 37 ± 13 %) and humic acid-like substances (measured by EEM analysis,
38 ± 5 %); the major soluble inorganics were Cl, SO4, Na, Ca elements.
Furthermore, the permeate water quality was compared with the feed water quality in order
to examine the removal efficiency of wastewater components. To illustrate statistical
significance, a two-sample T-test was performed by comparing the sampling data groups for
the feed and permeate water. The p-value for the two-sample T-test was calculated at a
significance level at 5%. As shown in Table 6, the following components have been
significantly removed from the feed water (p-value <0.05): TSS (100 % removal),
Biopolymers (61.5 % removal) and Protein-I like substances (16.8 % removal). While,
almost insignificant removal for other components, such as Building blocks, Protein II-like
substances, soluble microbial-by-product like substances, fulvic acid-like substances, humic
acid-like substances, F, Cl, NO2, NO3, PO4, SO4, Na, Mg and Ca. In contrast, the
concentrations of LMW neutrals and acids in the permeate were significantly higher than
those in the feed (by 64 and 110 % respectively). This could be attributed to the
decomposition of building blocks, which are greater in size, into low molecular weight
components. The tested inorganic ions were not significantly removed, which could be
attributed to the greater pore size of MF membranes (not rejecting ions) (Singh and Hankins,
2016). Last, the difference in humic substances in the results measured by EEM and LC-
OCD could be explained by the different sample preparing filters. The analysis by LC-OCD
involved a filtering by a 0.22 µm filter while the samples for the EEM were filtered through
a 0.45 µm filter.

53
Table 7. Feed and permeate water characteristics
Measurement
method Parameter Unit
Feed
wastewater
(n = 16)
Permeate water
(n = 16)
p-
value
Remo-
val ratio
(%) TSS mg/L 15.06 ± 5.74 0.00 ± 0.00 0.00 100
TOC (filtered
through 0.45 µm) DOC mg/L 10.88 ± 2.89 13.45 ± 4.53 0.08 0
LC-OCD (filtered
through 0.22 µm)
Biopolymers mg/L 1.63 ± 0.63 0.63 ± 0.22 0.00 61.5
Humic acid mg/L 0.00 ± 0.00 0.00 ± 0.00 - -
Building
blocks mg/L 4.44 ± 0.75 4.95 ± 1.01 0.13 0
LMW
Neutrals mg/L 3.38 ± 0.59 5.53 ± 3.57 0.04 0
LMW Acids mg/L 0.57 ± 0.13 1.19 ± 0.54 0.00 0
EEM (filtered
through 0.45 µm)
Protein I -
like
substances
(a.u.) 76782 ±
11481 63888 ± 13125 0.01 16.8
Protein II-
like
substances
(a.u.) 109615 ±
16481 111503 ±16784 0.76 0
Soluble
microbial-
by-product
like
substances
(a.u.) 74519 ±
14556 73440 ± 13358 0.84 1.4
Fulvic acid-
like
substances
(a.u.) 183705 ±
23176 176294 ± 27232 0.44 4.0
Humic acid-
like
substances
(a.u.) 268701 ±
39320 255163 ± 36929 0.35 5.0
IC (filtered
through 0.45 µm)
F mg/L 1.95 ± 1.0 2.51 ± 1.87 0.32 0
Cl mg/L 125.08 ±
19.93 135.93 ± 56.35 0.49 0
NO2 mg/L 0.00 ± 0.00 0.09 ± 0.36 0.97 0
Br mg/L 0.00 ± 0.00 0.00 ± 0.00 0.33 -
NO3 mg/L 1.18 ± 0.49 0.98 ± 0.85 0.44 16.8
PO4 mg/L 7.10 ± 3.27 6.32 ± 2.27 0.53 10.9
SO4 mg/L 46.50 ± 3.30 48.51 ± 14.29 0.60 0
ICP-OES (filtered
through 0.45 µm)
Na mg/L 78.91 ± 0.90 77.77 ± 1.09 0.83 1.4
Mg mg/L 8.42 ± 0.08 8.14 ± 0.08 0.51 3.3
Ca mg/L 24.89 ± 0.13 23.48 ± 0.14 0.29 5.7

54
4.4.2 Membrane Foulants Analysis
Foulants Morphology
During intermittent filtration (PVDF membrane (0.08 μm) for 1.25 h filtration), different
physical cleaning protocols were employed. The filtrations were stopped during a filtration
cycle, after which the fouled membranes were carefully taken from the filtration cells and
the cake layer foulant morphology was observed by SEM (Figure 30). In contrast to the clean
membrane (Figure 30 a), the foulants on the membrane surface were obviously observed
during DMF filtration of wastewater with periodical physical flushing (Figure 30 b-e).
In addition, the operation and physical cleaning conditions could influence the morphology.
In detail, the more heterogeneous foulants (especially depositions of larger fragments) were
abundant on the membrane surface during DMF with wastewater flushing (Figure 30 b).
Similar SEM images of foulants morphologies under cleaning conditions with tap water
flushing at different temperatures (25 °C, Figure 30 c; 50 °C, Figure 30 d) were observed, in
both of which more uniform depositions with greater number of rod-shaped bacteria were
visible. While, after multi-cycle intermittent filtration (with 50 °C tap water at a crossflow
velocity of 0.4 m/s), the coverage of the homogenous depositions on the membrane was
uneven, i.e., some areas of the membrane were not covered by foulants.
(a) Clean Membrane (b) Wastewater flushing
(25 °C, v=0.1 m/s)

55
Figure 30. SEM images of the cake layer foulants after filtration at different conditions
(×3000 magnification; 1,25 h-filtration with 10 min flushing)
Soluble Foulant Characteristics
In order to examine the membrane foulants under different filtration operation conditions,
the membranes were taken out of the filtration cells at the end of filtration experiments (after
a filtration cycle). The foulants were then carefully removed from the membrane by
sonication and the foulant characteristics were examined. The analytical results are presented
in Table 8.
(c) Tap water flushing
(25 °C, v=0.1 m/s)
(d) Tap water flushing
(50 °C, v=0.1 m/s)
(e) Tap water flushing
(50 °C, v=0.4 m/s)

56
The foulants on the membrane with wastewater flushing at 0.1 m/s and with heated tap water
flushing at 0.4 m/s had comparable DOC levels, which were lower than that with cold and
heated tap water flushing at 0.1 m/s. This implied that increasing the flow velocity reduces
organic fouling more efficiently than changing cleaning water types. In detail, the
concentration of Biopolymers was especially low in the foulants from wastewater flushing,
however, the standard deviation was significantly higher for the other foulants. This could
be attributed to a high variation of Biopolymers when tap water was used for flushing. The
main differences of organic foulants can be seen in the Building Block concentration, where
foulants from the heated tap water operation at 0.4 m/s showed the lowest concentration.
Nevertheless, all foulant groups presented most abundantly fulvic acid-like substances (29
to 38 %) followed by Protein I-like substances (21 to 34 %). However, the total volumetric
intensity was the lowest for the foulants from operation with heated tap water flushing at
0.4 m/s.
In addition, Cl and Ca were the abundant inorganic anion and cation components (~49 ± 4 %
and ~59 ± 1 % respectively) present in the cake layer foulants, regardless of the physical
cleaning condition (Table 8). The foulants from the filtration with wastewater flushing
contained more NO3 and PO4, possibly due to the nature of wastewater (containing NO3 and
PO4, Table 7) and their potential deposition on the formed cake layer during the filtration
period. Nevertheless, the total amounts of the tested inorganic foulants were almost
comparable in the cake layers foulants under the four physical cleaning conditions. However,
the F concentration in the foulants from tap water flushing, especially heated, was
significantly higher than in the foulants from wastewater flushing. This may be attributed to
a changing membrane integrity caused by the operation conditions or the presence of F
element in the tap water.
Microbial Foulant Characteristics
To illustrate microbial foulant depositions on the membrane, the cell density was described
in terms of live and dead cell numbers detected by flow cytometry and ATP measurement,
shown in Table 8. Overall, compared to live cells, more dead cells were found on the
membrane surface after physical cleaning, regardless of the physical cleaning protocols. The
number of live cells in the foulants from the filtration with wastewater flushing was slightly
higher than those with tap water flushing, which corresponded to the ATP trend. This
phenomenon was associated with the nature of wastewater that contains a great number of
bacteria.
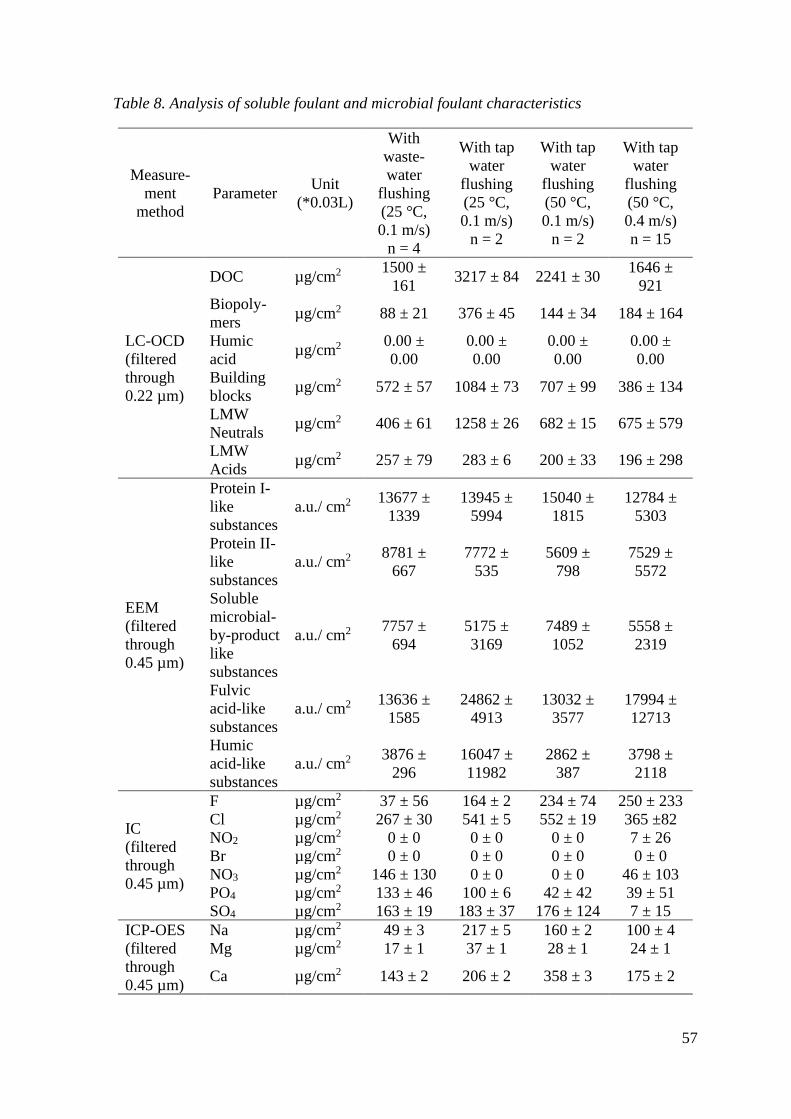
57
Table 8. Analysis of soluble foulant and microbial foulant characteristics
Measure-
ment
method
Parameter Unit
(*0.03L)
With
waste-
water
flushing
(25 °C,
0.1 m/s)
n = 4
With tap
water
flushing
(25 °C,
0.1 m/s)
n = 2
With tap
water
flushing
(50 °C,
0.1 m/s)
n = 2
With tap
water
flushing
(50 °C,
0.4 m/s)
n = 15
LC-OCD
(filtered
through
0.22 µm)
DOC µg/cm2 1500 ±
161 3217 ± 84 2241 ± 30
1646 ±
921
Biopoly-
mers µg/cm2 88 ± 21 376 ± 45 144 ± 34 184 ± 164
Humic
acid µg/cm2
0.00 ±
0.00
0.00 ±
0.00
0.00 ±
0.00
0.00 ±
0.00
Building
blocks µg/cm2 572 ± 57 1084 ± 73 707 ± 99 386 ± 134
LMW
Neutrals µg/cm2 406 ± 61 1258 ± 26 682 ± 15 675 ± 579
LMW
Acids µg/cm2 257 ± 79 283 ± 6 200 ± 33 196 ± 298
EEM
(filtered
through
0.45 µm)
Protein I-
like
substances
a.u./ cm2 13677 ±
1339
13945 ±
5994
15040 ±
1815
12784 ±
5303
Protein II-
like
substances
a.u./ cm2 8781 ±
667
7772 ±
535
5609 ±
798
7529 ±
5572
Soluble
microbial-
by-product
like
substances
a.u./ cm2 7757 ±
694
5175 ±
3169
7489 ±
1052
5558 ±
2319
Fulvic
acid-like
substances
a.u./ cm2 13636 ±
1585
24862 ±
4913
13032 ±
3577
17994 ±
12713
Humic
acid-like
substances
a.u./ cm2 3876 ±
296
16047 ±
11982
2862 ±
387
3798 ±
2118
IC
(filtered
through
0.45 µm)
F µg/cm2 37 ± 56 164 ± 2 234 ± 74 250 ± 233
Cl µg/cm2 267 ± 30 541 ± 5 552 ± 19 365 ±82
NO2 µg/cm2 0 ± 0 0 ± 0 0 ± 0 7 ± 26
Br µg/cm2 0 ± 0 0 ± 0 0 ± 0 0 ± 0
NO3 µg/cm2 146 ± 130 0 ± 0 0 ± 0 46 ± 103
PO4 µg/cm2 133 ± 46 100 ± 6 42 ± 42 39 ± 51
SO4 µg/cm2 163 ± 19 183 ± 37 176 ± 124 7 ± 15
ICP-OES
(filtered
through
0.45 µm)
Na µg/cm2 49 ± 3 217 ± 5 160 ± 2 100 ± 4
Mg µg/cm2 17 ± 1 37 ± 1 28 ± 1 24 ± 1
Ca µg/cm2 143 ± 2 206 ± 2 358 ± 3 175 ± 2
58
Flow
Cytometer
ATP Kit
Live cells ×107/cm2 10.1 ± 2.2 6.3 ± 0.3 0.8 ± 0.3 2.9 ± 3.1
Dead cells ×107/cm2 10.4 ± 4.6 39.4 ± 1.4 42.8 ± 1.0 12.8 ±
14.4
ATP pg/cm2 1877 ±
255
1642
±100 251 ± 13 650 ± 832
Characteristics of Membranes after Cleaning
In order to examine the effects of irreversible and irremovable foulants on membrane
properties, the membranes were taken out of the filtration cells at the end of filtration
experiments with different cleaning conditions. The foulants were then removed from the
membrane by sonication. The residual membranes were then dried before contact angle and
FTIR analysis.
The contact angles of the virgin and fouled membranes after different physical cleaning are
shown in Table 9. The virgin PVDF membrane had a lower contact angle at ~32 °, indicating
a more hydrophilic nature. Almost no significant differences among the membranes used in
filtrations with wastewater and tap water flushing were observed. These membranes
appeared to be more hydrophobic (> 90 °), indicating the residual foulants had a more
hydrophobic nature. However, the membrane after long-term filtration operation showed a
slightly lower contact angle (~85°). As chemical-enhanced physical cleaning was employed
during long-term operation, it was suggested that the chemical cleaning removed part of the
physically irreversible foulants, leading to less hydrophobicity.
Table 9. Contact angles of the clean and fouled membranes
Membrane Contact angle (°)
Virgin membrane 32
1.25 h filtration + wastewater (25 °C) flushing (0.1 m/s) 101± 4
1.25 h filtration + tap water (25 °C) flushing (0.1 m/s) 97
1.25 h filtration + tap water (50 °C) flushing (0.1 m/s) 95
1.25 h filtration + tap water (50 °C) flushing (0.4 m/s) 95± 6
Long-term operation (1.25 h filtration + tap water (50 °C)
flushing (0.4 m/s) + periodical chemical cleaning)
85
In addition, FTIR profiles of the virgin PVDF membrane and the physically cleaned
membranes were examined, as indicated in Figure 31. For a typical virgin PVDF membrane,
the major peaks associated with chemical components include: (1) C-H bending, aliphatic
(variable strength), (2) Skeletal vibration, (3) C-H bending C=C-H (medium to strong) and
skeletal vibration (weak) and (4) ring in and out of plane bending (variable strength).
Obviously, after 1.25 h filtrations and tap water flushing, the FTIR pattern of the membrane
was similar to that of the virgin membrane. This suggests that the presence of irreversible
and irremovable foulants did not fully cover the membrane surface or block the membrane
pores during short-term operation.

59
However, after a long-term DMF with periodically physical and chemical cleaning, it was
observed that the peaks 1, 2 and 3 were not present and the intensity of peak 4 increased on
the physically cleaned membrane. In addition, a new peak 5 associated with skeletal
vibration (weak) and C-O stretch (variable strength) appeared. This could be associated with
two possibilities, (1) more accumulation of irremovable foulants in the membrane with
extending filtration cycles, which led to a fully covered membrane surface or blocked
membrane pores to modify the membrane surface property; (2) the partial loss of membrane
integrity, which contributed to the disappearance of key function groups.
Figure 31. FTIR profiles of virgin and fouled membranes


61
5 General Discussion and Outlook
The experimental results showed that the application of DMF on simulated Icelandic
wastewater was possible by applying a limited cleaning protocol. More, no major pre-
treatments are required to ensure a stable operation. The cleaning protocol was thus reduced
compared to previously reported studies (presented in 2.3 to 2.5). This could be attributed to
the low strength feed. On the one hand, the heating of the flushing water is energy-intensive
and could cause a rise in costs. In Iceland, however, the availability of low-cost renewable
energy makes this cleaning protocol favorable. In particular, geothermal water, readily
available in many parts of the country could potentially be used directly for flushing, which
has to be analyzed in further studies.
As DMF can be used for wastewater treatment with varying influent rates it could be
especially suitable for decentralized wastewater treatment systems. The demography in
Iceland varies significantly over the year, as the high tourist season is limited to the summer.
The touristic hotspots are mostly located in rural communities, which often have limited
wastewater treatment systems. Therefore, DMF could be implemented in these places to
ensure sufficient wastewater treatment throughout the year and ensure the environment is
not harmed by the high number of tourists (Icelandic Tourist Board, 2019). In general, DMF
is a good solution for decentralized wastewater treatment, as previously reported in the
literature (Guilbaud et al., 2010). Besides the good treatment efficiency, DMF also requires
low maintenance (operation can be easily auto-controlled by the commercial programme)
and presents high adaptability (membrane modules and fluxes can be regulated based on
treatment capacity) (Guilbaud et al., 2010; Hey et al., 2017; Ravazzini et al., 2005).
DMF could also be adapted to the existing wastewater treatment system in the capital area.
The current treatment consists of grit and fat removal. This is similar to the simulated
wastewater used in this study and could therefore be a sufficient pre-treatment for DMF. In
addition, the removal efficiency of DMF greatly depends on the pore size of the employed
membranes. For instance, a MF membrane doesn’t show efficient removals for soluble
components, therefore micropollutants such as pharmaceuticals, microplastics, and toxic
detergents could be present in the permeate. When targeting the removal of these
components specifically, for example in hospital wastewater treatment, ultrafiltration or
nanofiltration is suggested to be added as a secondary filtration process followed by
microfiltration.
In this study, however, the experimental study is limited by the small-scale setup and
laboratory conditions. The presented results must be confirmed by long-term operation.
Moreover, the cleaning protocol should be further optimized with a membrane suitable for
regular chemical cleaning, high temperatures and high shear. Especially, future studies on
pilot-scale setups should be conducted using real Icelandic wastewater under Icelandic
climatic conditions. Finally, the concept of implementing DMF in Iceland should be further
studied by conducting life cycle and cost assessments.


63
6 Conclusions
In this study, six major findings are summarized:
(1) Recent studies show that DMF is a promising alternative for the treatment of low-strength
Icelandic wastewater and other decentralized wastewater treatment systems, due to its high
modularity and high adaptability to wastewater characteristics and varying volume.
(2) PVDF MF membrane (0.08 μm) was identified as a suitable membrane for DMF
operation in terms of membrane performance and permeate water quality.
(3) During short-term continuous filtration, physically reversible cake layer fouling was
predominant and almost no irreversible/ irremovable fouling could be detected. Physical
cleaning benefitted to remove loosely attached cake layer and caused an expansion of the
tightly attached cake layer, which was observed by OCT. After multi-cycle intermittent
filtration with periodical physical cleaning, the contribution of irreversible/ irremovable
fouling to the total fouling was apparent because the compactness of such tightly attached
cake layer allowed it shifting to irreversible/ irremovable fouling.
(4) A combination of chemical-enhanced physical cleaning with periodical physical cleaning
(hot water flushing at a high flow velocity) was found to be effective in membrane fouling
control during long-term DMF operation. As spring hot water is naturally available in
Iceland, DMF for Icelandic wastewater treatment is economically feasible.
(5) During DMF of wastewater, a combination of organic and inorganic foulants was
attributed to membrane fouling, while biological fouling is less prominent, especially
employing periodically tap water flushing.
(6) Compared to MBRs, a relatively higher frequency chemical-enhanced physical cleaning
was employed in DMF processes. Therefore, the organic membrane integrity loss needs to
be paid more attention to, especially during real operation. Inorganic membranes could be
an alternative, which requires future study.
To conclude, the findings in this study showed that DMF could be a promising solution to
improve the situation of wastewater treatment in Iceland. However, further studies need to
be conducted, in detail, (1) designing DMF system and scaling-up DMF operation; (2)
optimizing long-term filtration conditions and analyzing fouling characteristics; (3)
economic analysis and life cycle assessment of DMF in an Icelandic scenario and developing
countries (such as in Africa and South Asia) in areas where no centralized wastewater
treatment facilities are available.


65
References
Akbari, A., Remigy, J. C., and Aptel, P. (2002). Treatment of textile dye effluent using a
polyamide-based nanofiltration membrane. Chemical Engineering and Processing-
Process Intensification, 41(7), 601-609. doi:Pii S0255-2701(01)00181-7
Anis, S. F., Hashaikeh, R., and Hilal, N. (2019). Reverse osmosis pretreatment technologies
and future trends: A comprehensive review. Desalination, 452, 159-195. doi
10.1016/S0255-2701(01)00181-7
APHA, A. P. H. A. (1998). Standard Methods for the examination of water and wastewater,
20th ed. Washington DC.
Barbosa, M. O., Moreira, N. F. F., Ribeiro, A. R., Pereira, M. F. R., and Silva, A. M. T.
(2016). Occurrence and removal of organic micropollutants: An overview of the
watch list of EU Decision 2015/495. Water Res, 94, 257-279.
doi:10.1016/j.watres.2016.02.047
Boddu, V. M., Paul, T., Page, M. A., Byl, C., Ward, L., and Ruan, J. (2016). Gray water
recycle: Effect of pretreatment technologies on low pressure reverse osmosis
treatment. Journal of Environmental Chemical Engineering, 4(4), 4435-4443.
doi:10.1016/j.jece.2016.09.031
Brezinski, M. (2006). Optical Coherence Tomography. Optical Coherence Tomography, 4.
doi:10.1016/B978-0-444-53632-7.00416-0
Butler, R., and MacCormick, T. (1996). Opportunities for decentralized treatment, sewer
mining and effluent re-use. Desalination, 106(1-3), 273-283.
Chen, W., Westerhoff, P., Leenheer, J. A., and Booksh, K. (2003). Fluorescence
Excitation−Emission Matrix Regional Integration to Quantify Spectra for Dissolved
Organic Matter. Environmental Science and Technology, 37(24), 5701-5710.
doi:10.1021/es034354c
Crittenden, J. C., Rhode Trussell, R., Hand, D. W., Howe, K. J., and Tchobanoglous, G.
(2012). MWH's Water Treatment: Principles and Design, Third Edition: John Wiley
and Sons, Inc.
Dreszer, C., Wexler, A. D., Drusova, S., Overdijk, T., Zwijnenburg, A., Flemming, H. C., .
. . Vrouwenvelder, J. S. (2014). In-situ biofilm characterization in membrane systems
using Optical Coherence Tomography: formation, structure, detachment and impact
of flux change. Water Res, 67, 243-254. doi:10.1016/j.watres.2014.09.006
Drews, A. (2010). Membrane fouling in membrane bioreactors-Characterisation,
contradictions, cause and cures. Journal of Membrane Science, 363(1-2), 1-28.
doi:10.1016/j.memsci.2010.06.046
EFLA Engineering. (2019). Retrieved from https://www.efla-
engineers.com/projects/environment/wastewater-treatment-plant
European Environment Agency. (2017, 21.01.19). Urban waste water treatment. Retrieved
from https://www.eea.europa.eu/data-and-maps/indicators/urban-waste-water-
treatment/urban-waste-water-treatment-assessment-4
Field, R. W., and Pearce, G. K. (2011). Critical, sustainable and threshold fluxes for
membrane filtration with water industry applications. Adv Colloid Interface Sci,
164(1-2), 38-44. doi:10.1016/j.cis.2010.12.008
Gong, H., Jin, Z., Wang, Q., Zuo, J., Wu, J., and Wang, K. (2017). Effects of adsorbent cake
layer on membrane fouling during hybrid coagulation/adsorption microfiltration for
66
sewage organic recovery. Chemical Engineering Journal, 317, 751-757.
doi:10.1016/j.cej.2017.02.122
Guilbaud, J., Massé, A., Andrès, Y., Combe, F., and Jaouen, P. (2010). Laundry water
recycling in ship by direct nanofiltration with tubular membranes. Resour. Conserv.
Recy., 55(2), 148-154. doi:10.1016/j.resconrec.2010.09.001
Hedaoo, M. N., Bhole, A. G., Ingole, N. W., and Hung, Y.-T. (2012). BIOLOGICAL
WASTEWATER TREATMENT. In Handbook of Environment and Waste
Management (pp. 431-473).
Hey, T., Bajraktari, N., Davidsson, A., Vogel, J., Madsen, H. T., Helix-Nielsen, C., . . .
Jonsson, K. (2018). Evaluation of direct membrane filtration and direct forward
osmosis as concepts for compact and energy-positive municipal wastewater
treatment. Environ Technol, 39(3), 264-276. doi:10.1080/09593330.2017.1298677
Hey, T., Vaananen, J., Heinen, N., la Cour Jansen, J., and Jonsson, K. (2017). Potential of
combining mechanical and physicochemical municipal wastewater pre-treatment
with direct membrane filtration. Environ Technol, 38(1), 108-115.
doi:10.1080/09593330.2016.1186746
Hoinkis, J., Deowan, S. A., Panten, V., Figoli, A., Huang, R. R., and Drioli, E. (2012).
Membrane Bioreactor (MBR) Technology – a Promising Approach for Industrial
Water Reuse. Procedia Engineering, 33, 234-241.
doi:https://doi.org/10.1016/j.proeng.2012.01.1199
Huang, B. C., Guan, Y. F., Chen, W., and Yu, H. Q. (2017). Membrane fouling
characteristics and mitigation in a coagulation-assisted microfiltration process for
municipal wastewater pretreatment. Water Res, 123, 216-223.
doi:10.1016/j.watres.2017.06.080
Huber, S. A., Balz, A., Abert, M., & Pronk, W. (2011). Characterisation of aquatic humic
and non-humic matter with size-exclusion chromatography-organic carbon
detection-organic nitrogen detection (LC-OCD-OND). Water Res, 45(2), 879-885.
doi:10.1016/j.watres.2010.09.023
Iceland Review. (2017). Sewage Treatment Lacking in Iceland. Retrieved from
https://www.icelandreview.com/news/sewage-treatment-lacking-iceland/
Icelandic Tourist Board. (2019). Environmental Issues. Retrieved from
https://www.ferdamalastofa.is/en/quality-and-environment/environmental-issues
IMO, I. M. O. (2019). Climatological Data. Retrieved from
https://en.vedur.is/climatology/data/
Jin, Z., Gong, H., Temmink, H., Nie, H., Wu, J., Zuo, J., and Wang, K. (2016). Efficient
sewage pre-concentration with combined coagulation microfiltration for organic
matter recovery. Chemical Engineering Journal, 292, 130-138.
doi:10.1016/j.cej.2016.02.024
Jin, Z., Meng, F., Gong, H., Wang, C., and Wang, K. (2017). Improved low-carbon-
consuming fouling control in long-term membrane-based sewage pre-concentration:
The role of enhanced coagulation process and air backflushing in sustainable sewage
treatment. Journal of Membrane Science, 529, 252-262.
doi:10.1016/j.memsci.2017.02.009
Judd, S. (2006). The MBR Book: Principles and Applications of Membrane Bioreactors,.
Elsevier, Boston, MA.
Kim, J.-O., Jung, J.-T., and Chung, J. (2007a). Treatment performance of metal membrane
microfiltration and electrodialysis integrated system for wastewater reclamation.
Desalination, 202(1-3), 343-350. doi:10.1016/j.desal.2005.12.073

67
Kim, R.-H., Lee, S., Jeong, J., Lee, J.-H., and Kim, Y.-K. (2007b). Reuse of greywater and
rainwater using fiber filter media and metal membrane. Desalination, 202(1-3), 326-
332. doi:10.1016/j.desal.2005.12.071
Kimura, K., Honoki, D., and Sato, T. (2017). Effective physical cleaning and adequate
membrane flux for direct membrane filtration (DMF) of municipal wastewater: Up-
concentration of organic matter for efficient energy recovery. Separation and
Purification Technology, 181, 37-43. doi:10.1016/j.seppur.2017.03.005
Koyuncu, I. (2003). Direct filtration of Procion dye bath wastewaters by nanofiltration
membranes: flux and removal characteristics. Journal of Chemical Technology and
Biotechnology, 78(12), 1219-1224. doi:10.1002/jctb.924
Lateef, S. K., Soh, B. Z., and Kimura, K. (2013). Direct membrane filtration of municipal
wastewater with chemically enhanced backwash for recovery of organic matter.
Bioresour Technol, 150, 149-155. doi:10.1016/j.biortech.2013.09.111
Li, F., Behrendt, J., Wichmann, K., and Otterpohl, R. (2008). Resources and nutrients
oriented greywater treatment for non-potable reuses. Water Sci Technol, 57(12),
1901-1907. doi:10.2166/wst.2008.601
Lin, J., Ye, W., Baltaru, M.-C., Tang, Y. P., Bernstein, N. J., Gao, P., . . . Van der Bruggen,
B. (2016). Tight ultrafiltration membranes for enhanced separation of dyes and
Na2SO4 during textile wastewater treatment. J. Membr. Sci., 514, 217-228.
doi:10.1016/j.memsci.2016.04.057
López Zavala, M. Á., Suárez Pérez, L. B., Reynoso-Cuevas, L., and Funamizu, N. (2014).
Pre-filtration for enhancing direct membrane filtration of graywater from washing
machine discharges. Ecological Engineering, 64, 116-119.
doi:10.1016/j.ecoleng.2013.12.049
Luo, J., Zhu, Z., Ding, L., Bals, O., Wan, Y., Jaffrin, M. Y., and Vorobiev, E. (2013). Flux
behavior in clarification of chicory juice by high-shear membrane filtration:
Evidence for threshold flux. Journal of Membrane Science, 435, 120-129.
doi:10.1016/j.memsci.2013.01.057
Luo, L., Dzakpasu, M., Yang, B., Zhang, W., Yang, Y., and Wang, X. C. (2019). A novel
index of total oxygen demand for the comprehensive evaluation of energy
consumption for urban wastewater treatment. Applied Energy, 236, 253-261.
doi:10.1016/j.apenergy.2018.11.101
Meng, F. G., Zhang, S. Q., Oh, Y., Zhou, Z. B., Shin, H. S., and Chae, S. R. (2017). Fouling
in membrane bioreactors: An updated review. Water Research, 114, 151-180.
doi:10.1016/j.watres.2017.02.006
Mezohegyi, G., Bilad, M. R., and Vankelecom, I. F. (2012). Direct sewage up-concentration
by submerged aerated and vibrated membranes. Bioresour Technol, 118, 1-7.
doi:10.1016/j.biortech.2012.05.022
Mishima, I., and Nakajima, J. (2009). Control of membrane fouling in membrane bioreactor
process by coagulant addition. Water Science and Technology, 59(7), 1255-1262.
doi:10.2166/wst.2009.090
Mizuta, K., and Shimada, M. (2010). Benchmarking energy consumption in municipal
wastewater treatment plants in Japan. Water Science and Technology, 62(10), 2256-
2262. doi:10.2166/wst.2010.510
Ng, C. A., Sun, D., Bashir, M. J., Wai, S. H., Wong, L. Y., Nisar, H., . . . Fane, A. G. (2013).
Optimization of membrane bioreactors by the addition of powdered activated carbon.
Bioresour Technol, 138, 38-47. doi:10.1016/j.biortech.2013.03.129
Oh, K. S., Poh, P. E., Chong, M. N., Chan, E. S., Lau, E. V., and Saint, C. P. (2016).
Bathroom greywater recycling using polyelectrolyte-complex bilayer membrane:

68
Advanced study of membrane structure and treatment efficiency. Carbohydr.
Polym., 148, 161-170. doi:10.1016/j.carbpol.2016.04.039
Plappally, A. K., and Lienhard V, J. H. (2012). Energy requirements for water production,
treatment, end use, reclamation, and disposal. Renewable and Sustainable Energy
Reviews, 16(7), 4818-4848. doi:10.1016/j.rser.2012.05.022
Ramona, G., Green, M., Semiat, R., and Dosoretz, C. (2004). Low strength graywater
characterization and treatmentby direct membrane filtration. Desalination, 170(3),
241-250. doi:10.1016/j.desal.2004.02.100
Ravazzini, A. M., van Nieuwenhuijzen, A. F., and van der Graaf, J. H. M. J. (2005). Direct
ultrafiltration of municipal wastewater: comparison between filtration of raw sewage
and primary clarifier effluent. Desalination, 178(1-3), 51-62.
doi:10.1016/j.desal.2004.11.028
Regulation nr.798/1999 on wastewater systems (Reglugerð nr. 798/1999 um fráveitur og
skólp) (1999). Retrieved from:
https://www.reglugerd.is/reglugerdir/eftir-raduneytum/umhverfisraduneyti/nr/4323
Sajjad, A.-A., Yunus, M. Y. B. M., Azoddein, A. A. M., Hassell, D. G., Dakhil, I. H., and
Hasan, H. A. (2019). Electrodialysis Desalination for Water and Wastewater: A
Review. Chemical Engineering Journal. doi:10.1016/j.cej.2019.122231
Saleh, T. A., and Gupta, V. K. (2016). Chapter 2 - Membrane Fouling and Strategies
for Cleaning and Fouling Control. In T. A. Saleh and V. K. Gupta (Eds.),
Nanomaterial and Polymer Membranes (pp. 25-53): Elsevier.
Sano, T., Koga, Y., Ito, H., Duc, L. V., Hama, T., and Kawagoshi, Y. (2020). Effects of
structural vulnerability of flat-sheet membranes on fouling development in
continuous submerged membrane bioreactors. Bioresour Technol, 304, 123015.
doi:10.1016/j.biortech.2020.123015
Sato, T., Qadir, M., Yamamoto, S., Endo, T., and Zahoor, A. (2013). Global, regional, and
country level need for data on wastewater generation, treatment, and use.
Agricultural Water Management, 130, 1-13. doi:10.1016/j.agwat.2013.08.007
Shi, X., Tal, G., Hankins, N. P., and Gitis, V. (2014). Fouling and cleaning of ultrafiltration
membranes: A review. Journal of Water Process Engineering, 1, 121-138.
doi:10.1016/j.jwpe.2014.04.003
Sim, L. N., and Fane, A. G. (2017). 4.4 Advanced Monitoring of Membrane Fouling and
Control Strategies. In Comprehensive Membrane Science and Engineering (pp. 72-
103).
Singh, R., and Hankins, N. P. (2016). Chapter 2 - Introduction to Membrane Processes for
Water Treatment. In N. P. Hankins and R. Singh (Eds.), Emerging Membrane
Technology for Sustainable Water Treatment (pp. 15-52). Boston: Elsevier.
Šostar-Turk, S., Petrinić, I., and Simonič, M. (2005). Laundry wastewater treatment using
coagulation and membrane filtration. Resour. Conserv. Recy., 44(2), 185-196.
doi:10.1016/j.resconrec.2004.11.002
Straub, A. P., Asa, E., Zhang, W., Nguyen, T. H., and Herzberg, M. (2020). In-situ graft-
polymerization modification of commercial ultrafiltration membranes for long-term
fouling resistance in a pilot-scale membrane bioreactor. Chemical Engineering
Journal, 382. doi:10.1016/j.cej.2019.122865
Sævarsson, R. (2018). Mechanical Sewage Treatment. Presented at Vatns- og fráveitufélag
Íslands; Himnur (membranes). Retrieved from http://www.vafri.hi.is/?page_id=1202
Tan, Y. Z., Mao, Z., Zhang, Y., Tan, W. S., Chong, T. H., Wu, B., and Chew, J. W. (2019).
Enhancing fouling mitigation of submerged flat-sheet membranes by vibrating 3D-

69
spacers. Separation and Purification Technology, 215, 70-80.
doi:10.1016/j.seppur.2018.12.085
Tchobanoglous, G., Burton, F. L., Stensel, H. D., Metcalf, Eddy, I., and Burton, F. (2003).
Wastewater Engineering: Treatment and Reuse: McGraw-Hill Education.
Tran, A. T. K., Zhang, Y., Lin, J., Mondal, P., Ye, W., Meesschaert, B., . . . Van der Bruggen,
B. (2015). Phosphate pre-concentration from municipal wastewater by
selectrodialysis: Effect of competing components. Separation and Purification
Technology, 141, 38-47. doi:10.1016/j.seppur.2014.11.017
Umhverfisstofnun. (2013). Report to the EFTA Surveillance Authority regarding the
implementation of Directive 91/271/EU on the treatment of wastewater from
agglomerations. Retrieved from https://www.ust.is/umhverfisstofnun/utgefid-
efni/annad-utgefid-efni/
United Nations, G. A. (2015). Transforming our World: Agenda 2030 for Sustainable
Development A/RES/70/1. Retrieved from
https://sustainabledevelopment.un.org/content/documents/21252030%20Agenda%2
0for%20Sustainable%20Development%20web.pdf
Veitur. (2019). Wastewater. Retrieved from https://www.veitur.is/en/wastewater
Wan, J., Gu, J., Zhao, Q., and Liu, Y. (2016). COD capture: a feasible option towards energy
self-sufficient domestic wastewater treatment. Scientific Reports, 6(1), 25054.
doi:10.1038/srep25054
WHO, and UN-HABITAT. (2018). Progress on safe treatment and use of wastewater:
piloting the monitoring methodology and initial findings for SDG indicator 6.3.1.
Geneva.
Woźniak, M. J., and Prochaska, K. (2014). Fumaric acid separation from fermentation broth
using nanofiltration (NF) and bipolar electrodialysis (EDBM). Sep. Purif. Technol.,
125, 179-186. doi:10.1016/j.seppur.2014.01.051
Wu, B. (2019). Membrane-based technology in greywater reclamation: A review. Sci Total
Environ, 656, 184-200. doi:10.1016/j.scitotenv.2018.11.347
Wu, B., and Fane, A. G. (2012). Microbial relevant fouling in membrane bioreactors:
influencing factors, characterization, and fouling control. Membranes, 2(3), 565-584.
Wu, B., Li, Y., Lim, W., Lee, S. L., Guo, Q., Fane, A. G., and Liu, Y. (2017). Single-stage
versus two-stage anaerobic fluidized bed bioreactors in treating municipal
wastewater: Performance, foulant characteristics, and microbial community.
Chemosphere, 171, 158-167. doi:10.1016/j.chemosphere.2016.12.069
Wu, B., Zhang, Y., Mao, Z., Tan, W. S., Tan, Y. Z., Chew, J. W., . . . Fane, A. G. (2019).
Spacer vibration for fouling control of submerged flat sheet membranes. Separation
and Purification Technology, 210, 719-728. doi:10.1016/j.seppur.2018.08.062
Wu, L., Tang, B., Bin, L., Chen, G., Huang, S., Li, P., and Fu, F. (2018). Heterogeneity of
the diverse aerobic sludge granules self-cultivated in a membrane bioreactor with
enhanced internal circulation. Bioresour Technol, 263, 297-305.
doi:10.1016/j.biortech.2018.05.004
Xiao, T., Dou, P., Wang, J., Song, J., Wang, Y., Li, X.-M., and He, T. (2018). Concentrating
greywater using hollow fiber thin film composite forward osmosis membranes:
Fouling and process optimization. Chemical Engineering Science, 190, 140-148.
doi:10.1016/j.ces.2018.06.028
Zhang, Q. H., Yang, W. N., Ngo, H. H., Guo, W. S., Jin, P. K., Dzakpasu, M., Ao, D. (2016).
Current status of urban wastewater treatment plants in China. Environ Int, 92-93, 11-
22. doi:10.1016/j.envint.2016.03.024

70
Zhao, Y. X., Li, P., Li, R. H., and Li, X. Y. (2019). Characterization and mitigation of the
fouling of flat-sheet ceramic membranes for direct filtration of the coagulated
domestic wastewater. J. Hazard. Mater., 121557.
doi:10.1016/j.jhazmat.2019.121557

71
Appendix
Appendix 1. DMF for wastewater treatment
Membrane
process
Waste-
water type
Wastewater characteristics Membrane
performance
Reference
Feed Permeate
Lab-scale NF operated at a
constant pressure
of 10 bar
Synthetic dye wastewater
1 g/L dye solution including Direct red 80,
Disperse blue 56, Acid
red 4, Basic blue 3
Direct red 80: 99-100% removal
Disperse blue 56: 99.4-
100% removal Acid red 4: 83-96.5%
removal
Basic blue 3: 21.2-41% removal
Permeability ratio decreased from 1
to 0.6-0.75 within
140 min
(Akbari et al., 2002)
Lab-scale NF
(Tubular) operated at a constant
pressure of 35 bar
Greywater
(from washing
machine)
Conductivity: 1080±73
μS/cm Turbidity: 120±17 NTU
TSS: 78±18 mg/L
TOC: 503±49 mg/L COD: 1340±46 mg/L
Total flora: 5.7±1.4 log
E. coli: 3.3±0.2 log Ca2+: 128±20 mg/L
Mg2+: 32±5 mg/L
Conductivity: 59-329
μS/cm COD: 25-134 mg/L
TOC: 9-50 mg/L
Turbidity: ND TSS: ND
Total flora: ND
E. coli: ND
Flux decreased
from 90 to 49 LMH within 2 h
(Guilbaud et
al., 2010)
Bench-scale MF (flat sheet)
Municipal wastewater
NA NA Flux achieved at 6.1 LMH
(Hey et al., 2018)
Lab-scale UF
operated at a
constant pressure of 4 bar
Synthetic dye
wastewater
1 g/L direct red 80 or 2
g/L congo red, direct red
23 or reactive blue 2 Different salt
concentrations (Na2SO4/
NaCl): 5, 10, 20, 30, 40 and 60 g/L
>98% rejection of dyes
<0.5% rejection of
salts
Flux decreases
from 70-100 to 0-
45 LMH within 275 min
(Lin et al.,
2016)
MF (0.1µm)
operated at a constant pressure
of 34 kPa
Municipal
wastewater
SS: 83 mg/L
Turbidity: 42 NTU Color: 112 mg/L
NH4+-N: 26 mg/L
PO43--P: 5.4 mg/L
BOD: 102 mg/L
Bacteria: 7×10⁷ cells/mL
SS: 0 mg/L
Turbidity: 1.7 NTU Color: 13 mg/L
NH4+-N: 21 mg/L
PO43--P: 4.9 mg/L
BOD: 10 mg/L
Bacteria: ND
Flux decline at 47-
92% within 200 h
(Kim et al.,
2007a)
Lab-scale MF
(5, 1, 0.5 µm)
Greywater
and
rainwater
Greywater:
Conductivity: 194 µS/cm
Turbidity: 12.6 NTU
Color: 49
COD: 22.9 mg/L Particle count (2-15µm):
22495 Total count: 60 mL–1
Total coliform: 0
MPN/100 mL
Greywater+ Rainwater:
Conductivity: 181 µS/cm Turbidity: 5.9 NTU
Color: 25
COD: 12.5 mg/L Particle count (2-15µm):
17708
Total count: 33 mL–1
Greywater:
Conductivity:163.8-
187.1 µS/cm
Turbidity: 3.2-5.9
NTU Color: 13-25
COD: 6.8-12.6 mg/L,
Greywater+
Rainwater: Conductivity:124.2-
140.6 µS/cm
Turbidity: 1.36-2.78 NTU
Color: 11-14
COD: 5.4-5.6 mg/L
Rainwater:
Conductivity: 82.4-87.0 µS/cm
Permeability
decreased from
220 to 0 LMH/kPa
within 30 min
(Greywater), from 300 to 0
LMH/kPa within 30 min (Greywater
+ rainwater), from
310 to 240 LMH/kPa
(rainwater) within
30 min
(Kim et al.,
2007b)

72
Total coliform: 0 MPN/100 mL
Rainwater: Conductivity: 187.1
mS/cm
Turbidity: 4.76 NTU Color: 24
COD: 12.6 mg/L
Particle count (2-15µm): 2570
Total count: 49 mL–1
Total coliform:>2419 MPN/100 mL
Turbidity: 0.55-0.98 NTU
Color: 11-12
COD: 2.0-2.7 mg/L
Lab scale NF
(150-300 Da) operated at a
constant pressure
of 800-2400 kPa
Industrial and
synthetic dye wastewater
Synthetic:
Reactive Navy HEXL: 0.2 g/L
NaCl: 30 g/L
Na2CO3: 15 g/L
Acetic acid: 0.3 g/L
Verolan NBO: 0.5 g/L
Slipper: 1 g/L
Industrial:
Reactive Navy HEXL: 0.2 g/L
Reactive Blue HEGN:
0.2 g/L NaCl: 30 g/L
Na2CO3: 15 g/L
Acetic acid: 0.3 g/L
Verolan NBO: 0.5 g/L
Slipper: 1 g/L
Synthetic:
Color removal: >99% Cl- rejection: 27-44%
Industrial:
Cl- rejection: 15%
Synthetic:
Steady state flux at 34-73 LMH during
2 h
Industrial:
Flux at 37.5-47 LMH
(Koyuncu,
2003)
Lab-scale UF
(2.71-3.08 kDa)
operated at a
constant pressure
of 1-4bar
Greywater
(Bathroom)
Turbidity: 70.7-160.3
NTU
TSS: 101.3-206 mg/L
COD: 251-507.5 mg/L
BOD5: 81-270.8 mg/L
E. coli: 2.5 × 10⁴-6.1 × 10⁵ cfu/100 mL
Other coliforms: 8.5-53.2
× 104 cfu/100 mL Pathogenic bacteria: 5-
34.1 × 10⁵ cfu/100 mL
Turbidity: 94.7-99.9 %
removal
TSS: 100.0-100.0 %
removal
COD: 60.9-85.5 %
removal BOD5: 61.5-86.6 %
removal
E. coli: 100.0-99.9 % removal
Other coliforms: 99.8-
100 % removal Pathogenic bacteria:
99-100 % removal
Flux decreased
from 135 to 50
LMH within
28 h
(Oh et al.,
2016)
Lab-scale UF
(30, 400 and 200 kDa) operated at a
constant pressure of 1-2 bar
Lab-scale NF (200
Da) operated at a
constant pressure
of 6-10 bar
Greywater
(from public showers)
TCOD: 170 ± 49 mg/L
Soluble COD: 106 ± 42 mg/L
TSS: 29.8 ± 11.3 mg/L BOD5: 78 ± 26 mg/L
Turbidity: 23 ± 8.5 NTU
Conductivity:1241 ± 143
μS/cm
TDS: 599 ± 43 mg/L
TOC: 37.7 mg/L
TCOD: 40–103.4
mg/L (UF); 15 mg/L (NF)
Turbidity: 0.5–1.9 NTU (UF), 0.6 NTU
(NF)
Conductivity:1130–
1600 μS/cm (UF), 700
μS/cm (NF)
TSS: 0 mg/L (NF) TOC: 6.2 mg/L (NF)
NF:
Average steady-state flux: 15 LMH
(6 bar) / 35 LMH (10 bar)
(Ramona et
al., 2004)
Lab-scale UF
operated at a
constant pressure of 0.3, 0.5 and 1.0
bar
Municipal
wastewater:
raw and after primary
clarifier, pre-
filtered (0.56 mm)
Raw sewage:
Conductivity: 1340
µS/cm Turbidity: 110.02 NTU
TSS: 63 mg/L
COD: 218 mg/L TN: 32.3 mgN/L
NH4+: 38.4 mgN/L
TP: 5.4 mgP/L PO3-
4: 4.1 mgP/L
Primary effluent: Conductivity: 1042
µS/cm
Turbidity: 54.62 NTU
Raw sewage:
Conductivity: 1276
µS/cm Turbidity: 0.15 NTU
COD: 138 mg/L
TN: 29.0 mgN/L NH4
+: 39.4 mgN/L
TP: 4.4 mgP/L
PO3-4: 4.0 mgP/L
Primary effluent:
Conductivity: 1036 µS/cm
Turbidity: 0.10 NTU
COD: 78 mg/l
Short-term: Flux
decreased from
230-700 to 40-100 LMH within 30
min
Long-term:
Average Flux
above 120 L/m2h (raw sewage) and
above 160 L/m2h
(primary effluent)
(Ravazzini et
al., 2005)

73
TSS: 46 mg/l COD: 135 mg/l
TN: 32.8 mgN/L
NH4+: 29.9 mgN/L
TP: 5.0 mgP/L
PO3-4: 3.6 mgP/L
TN: 28.1 mgN/L NH4
+: 30.3 mgN/L
TP: 4.1 mgP/L
PO3-4: 3.4 mgP/L
Pilot-scale UF (0.05 µm)
operated at a
constant pressure of 3-5 bar
Pilot-scale RO (spiral wound),
operated at a
constant pressure of 20-30 bar
Greywater (Hospital
laundry)
TSS: 35 mg/L TN: 2.75 mg/L
Ammonia N: 2.45 mg/L
TP: 9.92 mg/L COD: 280 mg/L
BOD5: 195 mg/L
Mineral oil: 4.8 mg/L Anionic surfactant: 10.06
mg/L
AOX: 0.12 mg/L
UF permeate Temperature: 53.8 °C
pH: 8.3
TSS: 18 mg/L TN: 0.03 mg/L
Ammonia N: 0.03
mg/L TP: 0.46 mg/L
COD: 130 mg/L
BOD5: 86 mg/L Mineral oil: 4.4 mg/L
Anionic surfactant:
7.20 mg/L
AOX: 0.11 mg/L
RO permeate TSS: 8 mg/L
TN: 0.03 mg/L
Ammonia N: 0.03 mg/L
TP: 0.14 mg/L
COD: 3 mg/L BOD5: 1.5 mg/L
Mineral oil: 1.2 mg/L
Anionic surfactant: 0.91 mg/L
AOX: 0.11 mg/L
UF: Flux stable between 110-145
LMH within 150
min RO: Flux stable
around 36 LMH
within 150 min
(Šostar-Turk et al., 2005)
Pilot-scale NF (450 Da) operated
at a constant
pressure of 0.4-1.4
MPa
Synthetic and real
fermentation
broth
Fumaric acid: 2-2.9 g/L Glycerol: 0-2.5 g/L
Succinic acid: 0-0.05 g/L
Citric acid: 0-0.2 g/L
Cl-: 0-0.32 g/L
Fumaric acid: 2.3-80% retention
Glycerol: 5.2-6%
retention
Citric acid: 45%
retention
Succinic acid: 80% retention
Cl-: 10% retention
Stable flux between 100 and
600 LMH during
0.45-
1.8 h
(Woźniak and Prochaska,
2014)
Lab-scale MF (0.1 µm) operated
at a constant
pressure of 0.025 MPa; lab-scale UF
(1000 Da),
operated at a constant pressure
of 0.5 MPa
Greywater (from
washing
machine)
NA TS: 18.2-31% removal TCOD: 7-32 %
removal
TOC: 14-20 removal LAS: 5.7-8.8%
removal
Flux decreased from 1.5-2 to 0.3-
0.5 LMH within
about 4-10 h
(Zavala et al., 2014)
Lab-scale MF (Flat sheet, 100
nm) operated at a
constant flux of 41.7 LMH
Municipal wastewater
Turbidity: 66.7±15.0 NTU
COD: 233.0±30.0 mg/L
DOC: 20.2±1.95 mg/L UV254: 0.185±0.002 cm-1
TP: 4.2±1.8 mg/L
PO4-P: 1.5±1.7 mg/L NH4-N: 24.9±0.5 mg/L
pH: 7.0 ± 0.1
COD: 24 mg/L, 76.4-90% removal
TP: 0.02 mg/L, 99.5%
removal Turbidity: < 1.0 NTU
TMP increased from 4-8 to 20 kPa
within 3 to 14 h
(Zhao et al., 2019)