studies on distribution and persistence of halquinol … · i wish to record my gratitude to mr....
TRANSCRIPT
i
STUDIES ON DISTRIBUTION AND PERSISTENCE
OF HALQUINOL AND ITS METABOLITES IN
VARIOUS TISSUES OF CHICKEN
INDU TRIPATHI
DEPARTMENT OF PHARMACOLOGY AND TOXICOLOGY
VETERINARY COLLEGE, BANGALORE
KARNATAKA VETERINARY ANIMAL AND FISHERIES
SCIENCES UNIVERSITY, BIDAR
MAY 2013

ii
STUDIES ON DISTRIBUTION AND PERSISTENCE
OF HALQUINOL AND ITS METABOLITES IN
VARIOUS TISSUES OF CHICKEN
Thesis submitted to the
KARNATAKA VETERINARY, ANIMAL AND FISHERIES
SCIENCES UNIVERSITY, BIDAR
in partial fulfillment of the requirements
for the award of the degree of
Doctor of Philosophy in
VETERINARY PHARMACOLOGY AND TOXICOLOGY
By
INDU TRIPATHI
DEPARTMENT OF PHARMACOLOGY AND TOXICOLOGY
VETERINARY COLLEGE, BANGALORE
KARNATAKA VETERINARY ANIMAL AND FISHERIES
SCIENCES UNIVERSITY, BIDAR
MAY 2013
iii
KARNATAKA VETERINARY ANIMAL AND FISHERIES
SCIENCES UNIVERSITY, BIDAR.
DEPARTMENT OF PHARMACOLOGY AND TOXICOLOGY
VETERINARY COLLEGE, HEBBAL, BANGALORE
CERTIFICATE
This is to certify that the thesis entitled “Studies on distribution and persistence
of halquinol and its metabolites in various tissues of chicken”.
submitted by Indu Tripathi I.D. No. DVHK 1018 in partial fulfillment of the
requirements for the award of Doctor of Philosophy in Veterinary Pharmacology
and Toxicology of the Karnataka Veterinary, Animal and Fisheries Sciences University
Bidar, is a bonafide record of research work done by her during the period of her study in
this University under my guidance and supervision, and that the thesis has not previously
formed the basis for the award of any degree, diploma, associate ship, fellowship or other
similar titles.
Place: Bangalore,
Date :May , 2013. (Dr. N.B. SHRIDHAR) Major advisor
APPROVED BY:
CHAIRMAN: ___________________________
(N.B. SHRIDHAR)
MEMBERS: ___________________________
(JAGADEESH SANGANAL)
___________________________
(H.D. NARAYANA SWAMY)
___________________________
(M. NARAYANA SWAMY)
___________________________
(S.G RAMACHANDRA)

iv
Dedicated to
My Param Pujya Guruji
My beloved Parents
and
Late Dr. K. Jayakumar
Whose incessant blessings has led me so far

v
ACKNOWLEDGEMENT
I avail this opportunity to express my deep sense of gratitude to
Dr. N.B. Shridhar, Associate Professor and Chairman of Advisory Committee for his
valuable guidance, steadfast encouragement, constant supervision and constructive
suggestions, without which this work would never have reached a fruitful end.
I wish to express my sincere gratitude to late Dr. K. Jayakumar, Professor and
Head, Department of Pharmacology and Toxicology, Veterinary College, Bangalore, for
providing me a favorable working environment and for his inspiring guidance and
constructive suggestions throughout my stay in the department.
I am greatly indebted to Dr.Jagadeesh Sanganal, Associate Professor and
Head, Department of Veterinary Pharmacology and Toxicology ,Veterinary College,
Bangalore, for his humane attitude, inspiring guidance and sincere interpretation.
I was fortunate to have advice, constructive suggestions, untiring help and
inspiring guidance from Dr. H.D. Narayana Swamy, Dr. M. Narayana Swamy and
Dr. S.G Ramachandra, Advisory Committee Members.
I wish to record my gratitude to Mr. Avinash Bhat, Research Associate for his
kind cooperation and generous help in carrying out analytical techniques.
I take pleasure in expressing gratitude to Prof.P.Kondaiah, MRDG IISC,
Bangalore for having helped in better understanding of techniques of tissue culture
required in carrying out my experiments. I thank the Society of Innovation and
Development Department (SID) Of IISC, Bangalore for metabolite identification from
the tissue samples .

vi
I wish to express profound gratitude and sincere respects to Mr. Muralidhar
Nayak SID, IISC, Bangalore for his kind help and co-operation rendered during
assaying LCMS data which was required for my research work.
My sincere thanks to the supporting staff Mr. Byra gowda , Mr.Subbarao and
Mrs. Akkayyamma of Department of Pharmacology and Toxicology.
It’s my privilege to extend my thanks to my fellow post graduate colleagues
Dr.Sunilchandra and Dr. Ravi Kumar my junior postgraduate colleagues
Drs.Prem, Manohar, Santosh, Mahesh, Jayashree and Suhasini. My MVSc friends
Drs. Nikhil, Swamy, Rekha, Seema, Swathi, Rekha Yadav, Basavarajendra, Rohit,
Melba , ViJay Kumar, Shivanand, Vishwanath Sushruth, Reshu,Siddharam for their
cordial help rendered during my stay in the department.
My heartfelt thanks to my dear friends Drs. Vinay Tikare, Kshipra
Chandrashekhar , Satish Mundas and Abirami for their timely help, moral support and
for making my stay in the college, a memorable one.
My Sincere thanks to Dr.Shivkumar, Assistant Manager, Provimi Animal
Nutrition Limited, Bangalore,India for his timely help and encouragement during the
course of my research.
I acknowledge my dad Mr. Shriniwas Tripathi mom Mrs. Usha Tripathi
Madhulika, Mr.Hari ,my little nephew Master prakhar and Santosh who stood all the
way long with me with their perpetual support even at times of despair and without
whom nothing would have been possible.
I owe my big thanks to my life partner Dr. Santosh K Misra who stood by me
throughout my research period and rendered his help whenever needed. My dictionary

vii
admits its failure in possessing words to describe the love and affection showered on me
by my parents in law and my little angel Stuti.
Last but not the least, I would like to express my heartfelt gratitude for my
Guruji Pandit Shri Ram Sharma Acharya without blessing of whom I would have
never been able to complete my work.
There are many others who in various ways, haves contributed to and assisted in
this work. I express my sincere thanks to them.
Bangalore
May, 2013 (INDU TRIPATHI)

viii
CONTENTS
CHAPTER TITLE PAGE No.
I INTRODUCTION 1
II REVIEW OF LITERATURE 7
III MATERIALS AND METHODS 25
IV RESULTS 66
V DISCUSSION 120
VI SUMMARY 131
VII BIBLIOGRAPHY 134
VIII ABSTRACT 146

ix
LIST OF TABLES
Table
No. Title
Page
No.
1. List of solvents used to dissolve Halquinol 29
2. Ultraviolet-visible parameters of 5,7-dichloroquinolin-8-ol in water 29
3. Ultraviolet-visible parameters of 5,7-dichloroquinolin-8-ol in acidic
medium 29
4. Ultraviolet-visible parameters of 5,7-dichloroquinolin-8-ol in basic
medium 30
5. Ultraviolet-visible parameters of 5,7-dichloroquinolin-8-ol in DMSO 30
6. The experimental design 44
7. Feed Ingredients and nutritional composition of the (i) Starter and (ii)
Finisher diets 47&48
8A. Percent recovery of 5,7-dichloroquinolin-8-ol from spiked (i) liver,
(ii) kidney and (iii) breast muscle tissue matrix 63
8B. Per cent recovery of 5-chloroquinolin-8-ol from spiked (i) liver, (ii)
kidney and (iii) breast muscle tissue matrix 64
9.
The principal wave numbers obtained in infrared spectrum and their
corresponding assignment (bond, compound type and functional
group) were characteristic for 5-chloro-8-quinolinol
72
10.
The principal wave numbers obtained in infrared spectrum and their
corresponding assignment of bond,compound type and functional
group were characteristic for 5,7-dichloroquinolin 8-ol
73
11.
The principal wave numbers obtained in infrared spectrum and their
corresponding assignment (bond, compound type and functional
group) were characteristic for halquinol
74
12. Tissue concentration (ng.g
-1) of halquinol* at different time intervals
during 40 days dietary exposure in broiler chickens 108
13.
Tissue concentrations (ng.g-1
) of 5-chloro-quinolin-8-ol glucuronide*
at different time intervals during 40 days dietary exposure in broiler
chickens
109

x
Table
No. Title
Page
No.
14.
Tissue concentration (ng.g-1
) of halquinol* at different time intervals
following withdrawal of halquinol exposure through feed in broiler
chickens
116
15.
Tissue concentration (ng.g-1
) 5-chloro-quinolin-8-ol glucuronide* at
different time intervals following withdrawal of halquinol exposure
through feed in broiler chickens
117

xi
LIST OF FIGURES
Fig.
No. Title
Page
No.
1. Functioning of Ultra-Violet spectroscopy 27
2. Functioning of Infrared spectroscopy 31
3. Functioning of NMR 33
4. LCMS Machinery 36
5A. Standard curve generated for detection of 5,7-dichloroquinolin-8-ol in (i)
Liver, (ii) Kidney and (iii) breast muscle tissues of broiler chicken 59-60
5B. Standard curve generated for detection of 5-chloroquinolin-8-ol in (i)
liver, (ii) kidney and (iii) breast muscle tissues of broiler chicken 61-62
6. Ultraviolet-visible spectrum of 5,7-dichloroquinolin-8-ol in different
solvent systems 68
7. Ultraviolet visible spectrum of 5,7-dichloroquinolin-8-ol 68
8. Ultraviolet-visible spectrum of 5,7-dichloroquinolin-8-ol in acidic
medium 68
9. Ultraviolet-visible spectrum of 5,7-dichloroquinolin-8-ol in basic media 69
10. Ultraviolet-visible spectrum of 5,7-dichloroquinolin-8-ol in DMSO 69
11. IR Spectrum of 5,7-dichloroquinolin-8-ol 70
12. IR Spectrum of 5-chloroquinolin-8-ol 71
13. IR Spectrum of halquinol 71
14. 1H-NMR Spectrum of 5-chloro-8-quinolinol 75
15. 1H-NMR Spectrum of 5,7-dichloro-8-quinolinol
76
16. 1H-NMR Spectrum of halquinol [Mix of 5-chloro-8-quinolinol: 5,7-
dichloro-8-quinolinol 76
17. 13
C-NMR Spectrum of 5-chloro-8-quinolinol
77
18. 13
C-NMR Spectrum of 5,7-dichloro-8-quinolinol
77

xii
Fig.
No. Title
Page
No.
19. 13
C-NMR Spectrum of halquinol [Mix of 5-chloro-8-quinolinol: 5,7-
dichloro-8-quinolinol (1:2.3)] 78
20. MS graph of 5 HAL standard 81
21. MS graph of 7 HAL Standard 82
22. MS graph of chicken liver tissue samples (T1) 83
23. MS graph of chicken breast tissue samples (T2) 84
24. MS graph of chicken liver tissue samples (T3) 85
25. MS graph of chicken breast tissue samples (T3) 86
26. MS graph of chicken liver tissue samples (T1) 87
27. MS graph of chicken breast tissue samples (T2) 88
28. MS graph of chicken liver samples (T3) 89
29. MS graph of chicken breast tissue samples (T1) 90
30. MS graph of chicken liver tissue samples (T1) 91
31. MS graph of chicken breast tissue samples (T2) 92
32. MS graph of chicken breast tissue samples (T2) 93
33. MS graph of chicken liver tissue samples (T3) 94
34. MS graph of chicken liver tissue samples (T3) 95
35. MS graph of chicken breast tissue samples (T1) 96
36. MS graph of chicken liver tissue samples (T1) 97
37. MS graph of chicken breast tissue samples (T1) 98
38.
Mean time-tissue concentration-time profile of halquinol (5,7-
dichloroquinolin-8-ol) in broiler chickens following withdrawal of
dietary exposure to halquinol @ 60 ppm x 40 days (n=6 birds sacrificed
at each time interval)
118

xiii
Fig.
No. Title
Page
No.
39.
Mean time-tissue concentration-time profile of halquinol (5,7-
dichloroquinolin-8-ol) in broiler chickens following withdrawal of
dietary exposure to halquinol @120 ppm x 40days (n=6 birds sacrificed
at each time interval)
118
40.
Mean time-tissue concentration-time profile of halquinol (5,7-
dichloroquinolin-8-ol) in broiler chickens following withdrawal of
dietary exposure to halquinol @ 240 ppm x 40days (n=6 birds sacrificed
at each time interval)
119
xiv
LIST OF PLATES
Plate
No. Title
Page
No.
1 LC-MS instrument 39
2 A representative photograph of day old broiler chicks on standard
poultry diet pre-mixed with halquinol 51
3 A representative photograph of twenty days old broiler birds on
standard poultry diet pre-mixed with halquinol 51
4 A representative photograph of forty days old broiler birds on
standard poultry diet pre-mixed with halquinol 52
5 Experimental birds maintained in a broiler house under deep litter
system 52
xv
LIST OF ABBREVIATIONS
ADI Acceptable daily intake
ALP Alkaline phosphatase
ALT Alanine aminotransferase
ATR Attenuated total reflectance
b. wt. Body weight
BUN Blood urea nitrogen
°C Degree Celsius
CVMP Committee for veterinary medicinal products
EDTA Ethylenediamine tetra acetic acid
EU MRL European union maximum residue limit
FAA Free amino acid
FCR Feed conversion ratio
Fig. Figure
FTIR Fourier transform infrared spectroscopy
g gram
H or h hour
HPTLC High Performance Thin Layer Chromatography
HPLC High Performance Liquid Chromatography
IR Infrared
JECFA Joint expert committee for food additives
KBr Potassium bromide
kg kilogram
L Litre

xvi
LD50 Lethal dose in 50 per cent of population
M Molarity
mM millimolar
ml millilitre
mm millimeter
min Minute
N Normality
MRL Maximum residue limit
NOEL No observed effect level
NOAEL No observed adverse effect level
OECD Organization for Economic Cooperation and Development
PVDF Polyvinylidene fluoride
rpm Rotations per minute
SE Standard Error
TLC Thin layer chromatography
MRL/MRLs Maximum residue limit/s
MRPL Minimum required performance limit
PDA Photodiode array
PFA Prevention of food adulteration
WP/WPs Withdrawal period/s
NMR Nuclear magnetic resonance
USFDA United States Food and Drug Administration
USDA United States Department of Agriculture

xvii
UV-Vis Ultraviolet visible
p Probability
ppm Parts per million
mg Milligram
μl microlitre
μ Micron
pH -log[H+]/ negative log of hydrogen ion concentration
% Per cent
r2 Regression coefficient
Rt Retention time
Rf Retention factor
nm nanometer
ng Nanogram
g gram
@ At the rate of
v/v Volume by volume
w/w Weight by weight
w/v Weight by volume
i/v intravenous

INTRODUCTION

I. INTRODUCTION
In recent years, concerns about the use of antimicrobials in food producing
animals have focused on human food safety because foods of animal origin are vehicles
of food borne disease in humans. The selection of drug-resistant bacteria populations is a
consequence of exposure to antimicrobial drugs and can occur from human and animal
uses. Hence the use of non-antibiotic growth promoter came into existence. Halquinol is
one such drug which is being extensively used in Asian as well as European countries to
promote growth in poultry and swine production.
Halquinol is a non-antibiotic antimicrobial mixture of chlorohydroxyquinolines.
Its powerful antimicrobial activity makes it a superior growth promoter in poultry. It is a
mixture obtained by chlorinating 8-hydroxy quinoline. It generally contains 5,7-
dichloroquinolin-8-ol (57 to 74%), 5-chloroquinolin-8-ol (23 to 40%), and 7-
chloroquinolin-8-ol (up to 4%) . Halquinol is used as an antibacterial, antifungal and
antiprotozoal feed additive for poultry and as a growth promoter in swine. It is known to
potentiate the effect of anticoccidial drugs in poultry. It is also useful to overcome
malabsorbtion syndrome as it has wide spectrum of activity and slows down peristalsis in
the gut ( Nischal et al ., 2012).
It has various advantages over other compounds used for similar purpose. It is
mainly a gut acting compound and not absorbed from the gastrointestinal tract. It is a
triple acting antidiarrheal product effective against bacteria, fungi and protozoa. Because
of its specificity in action against bacteria, it induces minimum or no resistance in
bacteria even on prolonged use.

2
It is a broad-spectrum antimicrobial having antibacterial, antifungal and
antiprotozoal activities, and is being used in India and other countries to overcome
several challenges in modern poultry and swine farming, like microbial infections, and
for growth promotional aspects, by incorporating it with feed at different levels. Besides,
halquinol bolus has been used in large animal practice to treat enteric
infections. Halquinol administration is found to be beneficial in controlling vibriosis in
fishes and acts as a growth promoter in fresh water aquaculture (Wojtowicz, 1984).
In the early 1960s, several antibiotics were used as growth promoters at low
doses, apart from being used to treat bacterial infections in man and animals. But soon
there was a concern that the practice of using as growth promoters, though helpful in
achieving higher meat production, may turn out to be a public health problem. This is
because continued use of any antibiotics at sub-therapeutic doses over a period of time
may lead to local bacterial populations acquiring resistance to the antibiotic (Sadanand et
al., 2006).
In the early 1970s, the UK banned the use of tetracycline and penicillin for
growth promotional purposes, spurring other European countries to take the same
precaution shortly after. In the mid 1970s, the Food and Drug Administration (FDA)
proposed a similar ban in the USA. Today, the organizations such as, the European
Commission, the World Health Organization, the centers for disease control and
prevention (CDC) and the American Public Health Association are supporting the
immediate prohibition of antibiotic growth promoters that are the same as, or closely
related to, antibiotics used in humans. In March 1999, Centre for Science in the public

3
interest, the Environmental Defense Fund, and others petitioned the FDA to ban, for
purposes of growth promotion, six antibiotics used in or related to those used in human
medicine, including penicillin, tetracycline, erythromycin, lincomycin, tylosin and
virginiamycin (FAO, 2005).
In considering phasing out or banning antibiotic growth promoters, other
alternatives are considered along with better security and hygiene on the farm. Thus, this
non-antibiotic growth promoter, halquinol is in use from 1960s and is still being used in
India and other Asian countries as well as Latin American countries to overcome
common challenges of modern poultry and swine farming. Halquinol is a broad spectrum
antimicrobial having weak antibacterial, antifungal and antiprotozoal activity (Ellenrieder
and Sensch, 1972; Fiedler and Kaben, 1966; Heseltine and Campbell, 1960; Lamy, 1964;
Cosgrove and Baines, 1978; Forster and Duggan, 1974).
Studies in rats indicated poor absorption after oral administration. But, further
investigations in man and other species showed that a substantial amount is excreted in
the urine after oral administration (Heseltine and Freeman, 1959). Bories and Tulliez
(1972) reported that the urinary and faecal elimination of halquinol was rapid, with more
than 90 per cent being eliminated within 48 h in the rats. They reported that urinary
elimination of halquinol was predominant in calves while faecal elimination in rats.
Halquinol is one of the popular molecules marketed in South American countries
and Asian countries including India, for use in poultry as growth promoter. However,
there is paucity of scientific data in poultry with respect to tissue distribution, its
metabolism and residue kinetics of halquinol and its metabolites in edible tissues. It was
4
realized that there was no simple and convenient analytical method for regular quality
control checks in any dosage form reported for this particular compound. In addition, the
pre-slaughter withdrawal time in poultry has not been specified. It is, therefore, of great
interest to develop analytical procedures capable of determining accurately animal tissue
concentrations of halquinol and its metabolites in edible animal products because of
demands from the EU to protect human health.
Metabolomics is the downstream complement to genomics, transcriptomics and
proteomics, offering a global assessment of the physiological state of a biological system.
Metabonomics is a systems approach for studying in vivo metabolic profiles, which
promises to provide information on drug toxicity, disease processes and gene function at
several stages in the discovery and development process. It represents the end point of
genetic regulation and its impact on the altered enzymatic activities and endogenous
biochemical reactions in a cell (Villas et al., 2005). Metabolomic profiling thus aims to
provide a comprehensive assessment of the alterations in the metabolite levels in blood,
urine, tissue, or cells (Dunn, 2008).
Recent technological advancements in NMR (Nuclear Magnetic Resonance)
spectroscopy and mass spectrometry (MS) have led to wide use of these technologies for
precise measurements of metabolites with improved sensitivity, resolution and mass
accuracy. Although the exact number of metabolites of any drug/compound is unknown,
they are estimated to range from thousands to tens of thousands. Several metabolic
pathways, including glucose, fatty acid, and lipid metabolism, have been reported to play
an important role in drug response (Vinayavekhin et al., 2009).
5
Extraction is the key step in the analysis of food samples, from either plant or
animal sources for residues of veterinary drugs and pesticides. Such residues pose an
unacceptable risk to the consumer and information is insufficient to allow a full safety
assessment.
Metabolomics is the comparative analysis of metabolites found in sets of similar
biological samples. Since metabolites play vital roles in biological systems,
metabolomics can be useful for finding and identifying biomarkers or for obtaining a
better understanding of the effects of drugs or diseases on both known and unexpected
biological pathways. Successful metabolomic research requires effective metabolite
extraction. For non-targeted metabolomics, extraction methods need to capture a broad
range of cellular and biofluid metabolites while excluding components such as proteins
that are not intended for analysis. Extraction is made more challenging by the physico-
chemical diversity of metabolites and by metabolite abundances that can vary by many
orders of magnitude.
Biphasic, liquid-liquid extraction by using advanced techniques like LCMS or
GC-MS are often used to extract metabolites. The nature of the organic and aqueous
solvents, their volumes, solvent ratios and aqueous solvent pH, however, must be
considered carefully. They can significantly affect the total number of metabolites
extracted and experimental reproducibility.
The comprehensive characterization of the metabolome, however, is a daunting
task, as the endogenous metabolites vary widely in their physical and chemical
properties, which in turn, makes their concurrent extraction, separation, and detection of a

6
major challenge (Aerts et al., 1995). Although a number of metabolite extraction
procedures have been described for microbial systems and human bio-fluids, currently,
there is a paucity of wide ranging metabolite extraction methodologies for growth
promoters. So, the present study aimed at studying the overall distribution of halquinol
and its metabolites in edible tissues of chicken and calculation of the time period when
the residual effect of the parent compound as well as its metabolites vanishes and when
the meat products would be safe for human consumption. It is therefore of great interest
to develop analytical procedures capable of determining accurately animal tissue
concentrations of halquinol and its metabolites in edible animal products because of
demands from the regulatory agencies to protect human health.
Keeping the above points in view, the present study was undertaken in broiler
chickens with the following objectives:
A. To determine the distribution of halquinol and its metabolites in various tissues
following dietary inclusion in chickens.
B. To study the halquinol as well as its metabolites in various tissues of chicken using
Nuclear Magnetic Resonance (NMR) and other advanced techniques.
C. To establish meat withdrawal period of halquinol and its metabolites in chicken.

REVIEW OF LITERATURE

II. REVIEW OF LITERATURE
Quinoline derivatives are a group of synthetic compounds derived from quinoline
nucleus. They are broadly classified into following groups diiodohydroxyquinoline,
iodochlorhydroxyquinoline, broxyquinoline and chlorhydroxyquinoline which are all
halogenated oxyquinolines, while chloroquine is a 4-aminoquinoline derivative. All the
halogenated oxyquinolines have weak antibacterial and antifungal properties (Satoskar
and Bhandarkar, 1988).
2.1 Halquinol
Halquinol, a chlorhydroxyquinoline compound is the mixture obtained by
chlorinating quinolin-8-ol. It is a broad spectrum antimicrobial agent used in veterinary
medicine to treat gastrointestinal tract infections and to augment growth in poultry and
swine. It possesses an antimicrobial activity greater than iodochlorhydroxyquinoline or
diiodohydroxyquinoline (Readett, 1965).
2.1.1 Nomenclature and chemistry
Halquinol is the approved name (British Pharmacopoeia Commission) for a
chemically controlled group of chlorinated derivatives of quinolin-8-ol.
Chlorinating quinolin-8-ol yields a mixture, generically called as halquinol which
contains not less than 57.0 per cent and not more than 74.0 per cent of 5,7-
dichloroquinolin-8-ol, not less than 23.0 per cent and not more than 40.0 per cent of 5-
chloroquinolin-8-ol and not more than 4.0 per cent of 7-chloroquinolin-8-ol, and the total
8
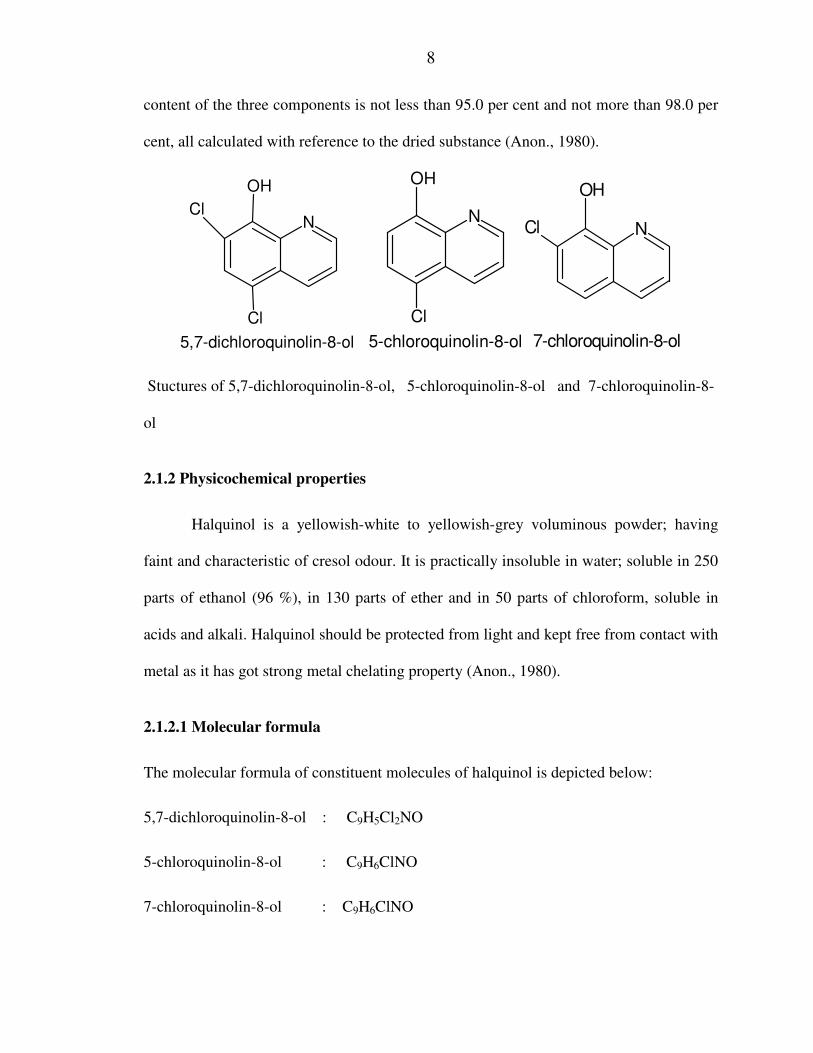
content of the three components is not less than 95.0 per cent and not more than 98.0 per
cent, all calculated with reference to the dried substance (Anon., 1980).
N
OH
Cl
Cl
5,7-dichloroquinolin-8-ol
N
OH
Cl
5-chloroquinolin-8-ol
N
OH
Cl
7-chloroquinolin-8-ol
Stuctures of 5,7-dichloroquinolin-8-ol, 5-chloroquinolin-8-ol and 7-chloroquinolin-8-
ol
2.1.2 Physicochemical properties
Halquinol is a yellowish-white to yellowish-grey voluminous powder; having
faint and characteristic of cresol odour. It is practically insoluble in water; soluble in 250
parts of ethanol (96 %), in 130 parts of ether and in 50 parts of chloroform, soluble in
acids and alkali. Halquinol should be protected from light and kept free from contact with
metal as it has got strong metal chelating property (Anon., 1980).
2.1.2.1 Molecular formula
The molecular formula of constituent molecules of halquinol is depicted below:
5,7-dichloroquinolin-8-ol : C9H5Cl2NO
5-chloroquinolin-8-ol : C9H6ClNO
7-chloroquinolin-8-ol : C9H6ClNO

9
2.1.2.2 Molecular weight
The molecular weight of three constituent molecules of halquinol is:
5,7-dicloroquinolin-8-ol : 212.9
5-chloroquinolin-8-ol : 179
7-chloroquinolin-8-ol : 179
2.1.3 Mechanism of action
Halquinol combines with metallic prosthetic group of respiratory enzymes in
cytoplasmic membrane of bacteria, fungi depriving the respiration and thus completely
destroying them (Stewart, 1958).
2.1.4. Metabolism
Clioquinol a member of quinoline compounds undergo conjugation reaction in the
process of metabolism. Halquinol also undergoes conjugation reaction in liver and their
major metabolic products are 5-chloro-quinolin-8-ol sulfate, 5-chloro-quinolin-8-ol
glucuronide, 5,7, dichloro-quinolin-8-ol sulfate, 5,7, dichloro-quinolin-8-ol glucuronide
(Verdon et al.,2005).
2.1.5 Spectrum of activity
Halquinol has activity against a wide variety of bacteria, fungi, protozoa and
mycoplasmal organisms (Heseltine and Campbell, 1960; Lamy, 1964; Fiedler and Kaben,
1966; Ellenrieder and Sensch, 1972; Forster and Duggan, 1974; Cosgrove and Baines,
1978; Cosgrove, 1977).

10
Halquinol was found to be active against a variety of pathogenic Gram-positive
and Gram-negative bacteria (Heseltine and Campbell, 1960). Among Gram-negative
bacteria, it is effective against Escherichia coli, Salmonella typhimurium, Proteus
vulgaris (Cosgrove and Forster, 1980; Cosgrove et al., 1981; Readett, 1965). Salmonella
typhi, Salmonella paratyphiA, Salmonella enteritidis, Shigella sonnei, Shigella flexneri,
Shigella dysenteriae were also found to be sensitive to chlorhydroxyquinoline (Heseltine
and Freeman, 1959). It has little or no effect on Pseudomonas aeruginosa (Heseltine and
Campbell, 1960). Halquinol has activity against Vibrio anguillarum, a Gram-negative
bacteria which is the casual agent of vibriosis in fishes and also effective against Vibrio
parahaemolyticus (Austin et al., 1982). Halquinol was found to be active against Vibrio
cholera as well, the causal agent of cholera in humans (Neogy and Nandy , 1965; Tranter,
1968).
Among Gram-positive bacteria, it has activity against Staphylococcus aureus,
Streptococcus faecalis, Streptococccus bovis (Cosgrove and Forster, 1980).
Halquinol has good activity against fungus Candida albicans (Swick, 1996;
Readett, 1965). Epidermophyton floccosum, Trichophyton mentagrophyte, Microsporum
gypseum were also found to be sensitive (Heseltine and Freeman, 1959). It was also
found to be effective against Aspergillus niger, Aspergillus terreus (Heseltine and
Campbell, 1960).
Halquinol has significant antimycoplasmal activity being active against different
species of mycoplasma, viz: Mycoplasma synoviae, Mycoplasma gallisepticum,

11
Mycoplasma agalactiae var bovis, Mycoplasma hyopneumoniae and Mycoplasma
hyorhinis (Cosgrove and Baines, 1978).
Among protozoa, halquinol has good activity against Cryptosporidium parvum
(Armson et al., 1999). Chlorhydroxyquinoline is also effective against protozoa,
Entamoeba histolytica (Heseltine and Campbell, 1960; Lamy, 1964).
2.1.6 Resistance to microbes
Halquinol inducing development of resistance against microbes was a rare
phenomenon. It has been shown that neither of the two organisms Escherichia coli and
Salmonella species developed resistance to halquinol in vitro (Forster and Duggan,
1974).
A study by Cosgrove et al. (1981) has established that addition of halquinol at
120 ppm in a standard grower diet, when fed to pigs over a period of six weeks, did not
induce the development of resistance to Escherichia coli. Similarly, halquinol
incorporation as feed additive did not alter the resistance pattern of Escherichia coli to
other commonly used therapeutic anti-bacterials, but on the contrary standard commercial
ration lacking halquinol changed the sensitivity patterns of Escherichia coli.
2.1.7 Therapeutic uses
As halquinol was found to be absorbable to little extent when given to animals by
the oral route (Heseltine and Freeman, 1959) and to exhibit activity against a variety of
bacteria and fungi, it has potential in the treatment of infections localized within the
intestinal tract.
12
2.1.7.1 Bovines
Halquinol has been proved to be effective in treating balantidiosis in bovines
(Singh, 1979).Verma (1982) has investigated the efficacy of halquinol in improving
symptoms of liver disorder and found halquinol to be effective in alleviating symptoms
of chronic hepatitis such as loss of appetite, vague digestive disturbances and progressive
emaciation.
Therapeutic trial by Kaur et al. (2002) has shown that halquinol was effective in
treating colibacillosis in neonatal calves.
2.1.7.2 Equines
Halquinol was found to be effective in treating chronic diarrhoea in equines
(Obrien, 1981). The beneficial effect was related to their action on colonic microbial
fermentative activity and by modifying volatile fatty acid production (Minder et al.,
1980).
2.1.7.3 Pigs
Halquinol was recommended for the prevention and treatment of scours in pigs
(Burrows, 1975). Halquinol in feed at 60 ppm was successful in curing Campylobacter
associated intestinal pathology in pigs (Pointon, 1989).

13
2.1.7.4 Caprines and ovines
Halquinol was found superior in combating acute clinical coccidiosis in goats and
effecting cure in two to four days (Baxi et al., 1973) where Eimeria arloingi was
predominant in the faeces of affected animals.
A clinical trial by Singh (1979) has reported that halquinol was efficacious in
treating non-specific diarrhoea in adult sheep, goat and kids.
2.1.7.5 Fishes
Vibriosis is a systemic bacterial infection of primarily marine and estuarine fishes,
caused by bacteria of the genus Vibrio, a major cause of mortality in Marine culture
operations. Vibrio anguillarum is regarded as the dominant species causing vibriosis.
Usefulness of substituted quinolines, in particular 5,7-dichloroquinolin-8-ol and
halquinol for the control of vibriosis in turbot was evident from the study by Austin et al.
(1982), where these chemicals inactivated rapidly the bacterial isolates in vitro and
controlled the manifestation of vibriosis in fishes. From a comparison of 121
antimicrobial agents, the usefulness of substituted quinolines, in particular halquinol, has
been indicated for the control of vibriosis in marine fish by Austin et al. (1981). In vitro
and in vivo experiments have deduced that halquinol controlled the disease manifestation
in turbot.
2.1.7.6 Poultry
The study by Mathew (1990) has proved the usefulness of chlorhydroxyquinoline
in diseases of poultry caused by mixed infections due to Escherichia coli and Salmonella;

14
Escherichia coli and Klebsiella; Escherichia coli and Proteus sps. which are complicated
with Aspergillus infection or Aflatoxicosis. Halquinol potentiates the effect of
anticoccidial drugs in poultry. Swick (1996) has observed that halquinol was useful in the
control of crop mycosis in poultry caused by Candida albicans. Of late, it has been
reported that halquinol potentiates the action of maduramycin in the control of Eimeria
acervulina infection in poultry (Cardoso et al., 2002).
Halquinol was found to be useful to combat conditions of malabsorption and
necrotic enteritis in poultry as it possesses wide spectrum of activity and slows down
peristalsis in the gut (Swick, 1996).
2.1.7.7 Humans
Normally 3 to 4 g of halquinol daily in divided doses for adults up to five days
has been recommended in humans in the control of amoebiasis. Further, halquinol has
also been administered in doses of 500 mg, 3 to 4 times daily up to a maximum total dose
of 7.5 g in the treatment of non-specific diarrhoea in humans (Riviere and Sundlof,
2001). Halquinol had been used for a long time in the treatment of human amoebic and
bacillary dysenteries (Heseltine and Campbell, 1960; Heseltine and Freeman, 1959).
Damayanthi et al. (1973) has undertaken a clinical trial to determine the efficacy of
Quixalin® tablets in children suffering from diarrhoea. They have observed that halquinol
(Quixalin®) was highly effective in 39 out of 45 cases when it was used @ 30 to 50 mg /
kg /day.
Halquinol was used as a topical anti-infective in man (Anon., 1976). Halquinol
was used in topical preparation containing 0.75% in conjunction with corticosteroids in
15
the treatment of skin disorders (Anon., 1994) and incorporated in shampoo (2 % w/v) in
the treatment of seborrhoeic dermatitis of the scalp (Anon., 1999). A clinical trial of
halquinol in impetigo suggests that halquinol cream (0.75%) has an effective antibacterial
activity (Readett, 1965).
2.1.8 Toxicological properties
2.1.8.1 Rat
Swetha et al. (2006) has reported that halquinol at high (1000 mg/kg) and
intermediate dose (450 mg/kg) was hepatotoxic and nephrotoxic in male rats. There was
significant increase (p ≤ 0.01) in ALP, ALT, BUN and creatinine, and increased (p ≤
0.01) organ to body weight ratio of liver and kidney. Histopathology of liver and kidney
revealed marked pathological alterations at high and intermediate doses. Swetha et al.
(2009) indicated that halquinol at high dose (1000 mg/kg, p.o.) and intermediate dose
(450 mg/kg, p.o.) exert hepatotoxic and nephrotoxic effect in female rats as well.
Swetha et al. (2005a) has also reported that halquinol did not result in any
immunotoxicity in female rats at low (150 mg/kg), intermediate (450 mg/kg) or high dose
(1000 mg/kg) in 28 days repeated dose oral toxicity study. However, halquinol
administration daily for 90 days at high dose @ 1000 mg/kg body weight (high dose) was
found to be thyrotoxic in rats (Swetha et al., 2005b).
Halquinol administered orally to rats @ 200 mg/kg for 97 days did not result in
any pathological changes in blood and other organs except for showing only moderate
diarrhoea (Freeman and Heseltine, 1963).

16
2.1.8.2 Mice
The oral LD50 of chlorhydroxyquinoline for mice was found to be approximately
800 mg/kg and the intraperitoneal LD50 in this species was about 300 mg/kg (Freeman
and Heseltine, 1963). LD50 (oral) in mice was reported to be 1220 mg/kg in 24 hours and
700 mg/kg in 48 hours by Clarke (1978).
2.1.8.3 Rabbit
Freeman and Heseltine (1963) have reported that when halquinol administered
orally and i.v. to rabbits at dose rate of 300 mg/kg body weight for seven days and 2.5-10
mg/kg body weight for four days respectively did not show any signs of toxicity.
2.1.8.4 Guinea pig
Freeman and Heseltine (1963) have reported that seven out of eight guinea pigs
were died when halquinol was administered orally @ 300 mg/kg body weight for three
days and those animals had gastric lesions and enteritis upon post-mortem examination.
Further, three out of nine guinea pigs administered with halquinol orally @ 150 mg/kg
body weight for a period of seven days died showing gastric and intestinal lesions upon
post-mortem examinations, while guinea pigs administered orally with halquinol @ 100
mg/kg body weight for five days did not show any signs of toxicity.
2.1.8.5 Poultry broilers
The oral median lethal dose (LD50) of halquinol in poultry broilers was reported
to be 2183.33 mg/kg with clinical signs of toxicity viz. inappetence, ruffling of feathers
and sleepy nature of birds which further manifested into anorexia, leg weakness and

17
weight loss. The post-mortem findings revealed evidence of death due to rupture of liver.
The other lesions were extensive subcutaneous hemorrhages on thighs, wings, clotted
blood in peritoneal cavity, ascites, rickets, pale musculature and fragile skeletal structures
(Shivakumar et al., 2004). A study by Kavitharani et al. (2004) in broiler birds has
indicated that halquinol administered as single dose @ 2100 ppm was non lethal, while
the dose at which 50 per cent mortality occurred was found to be between 1500 and 1700
ppm in 14 days feeding study.
2.1.8.6 Fish
A limit test performed with 200 mg/L concentration of halquinol as per OECD
guidelines revealed that halquinol was non toxic to fish at concentration used in the study
(Mushigeri et al., 2008).
2.1.8.7 Pig
Pigs administered with halquinol @ 200 mg/kg and 500 mg/kg body weight orally
for a period of three and seven days respectively did not show any signs of toxicity
(Freeman and Heseltine, 1963).
2.1.8.8 Human
Halquinol was reported to cause neurotoxicity in man (Hanson and Herxheimer,
1981). Halquinol administered to humans @ 70 mg/kg body weight orally for a period of
10 days did not result in any signs of toxicity (Freeman and Heseltine, 1963). Burrows
(1975) have reported three cases of contact dermatitis in animal feed workers due to
ethoxyquin and halquinol when used as feed additives.
18
2.2 Growth promoters in poultry industry
Growth promoters in general constitute a large group of substances that are added
to feed to improve feed conversion efficiency and increase the lean to fat ratio in animals.
Feed additive is defined as any substance or agent added to the basic feed mix for
continuous long term administration to livestock for specific purposes, for example,
enhancing production or maintenance of health above the levels obtained from the basic
feed, improvement of storage qualities and/or the palatability of the basic feed mix.
Antimicrobials and antibiotics are used by the poultry industry as feed additives to
enhance growth and feed efficiency and reduce disease. Antibiotic usage has facilitated
the efficient production of poultry, allowing the consumer to purchase at a reasonable
cost, high quality meat and eggs. Antibiotic usage has also enhanced the health and well
being of poultry by reducing the incidence of disease (Donoghue, 2003). Most countries
have banned sulfonamides and nitrofurans (furazolidone) as growth promotants because
of problems with tissue residue and suspected carcinogenicity (Swick, 1996).
The major benefit of feeding an antimicrobial is cost savings through improved
feed conversion. There are also savings from faster growth, reduced mortality, greater
resistance to disease challenge, improved pigmentation and improved manure or litter
quality. A review of literature on feeding studies by Rosen (1996) has indicated that
antimicrobial growth promoters gave positive responses 72 per cent of the time. The
magnitude of response depends on animal management, disinfection procedures, age of
the farm buildings and feed quality. Under normal practical conditions, savings from
improved FCR can be expected to return product cost between two and twelve fold.

19
Antimicrobial feed additives promote growth by altering the gut microflora to the
benefit of intestinal tissue. Swick (1996) has reported that feeding of sub therapeutic
levels of antibiotics and antimicrobials result in:
• Increased production of vitamins and other nutrients by beneficial microflora
• Reduced production of growth depressing toxins from microflora
• Lower immune stress resulting in a shift of protein synthesis toward muscle and away
from antibody production
• Suppression of bacteria responsible for mild but unrecognized infections
• A thinner gut wall capable of enhanced nutrient absorption
• Lower nutrient use by microflora leaving more for the animal
• Lower production of ammonia in the gut which reduces turnover of mucosal cells and
results in less energy consumption by the animal.
Since the mid-eighties of twentieth century, there has been much criticism and
concern over the use of growth promoting substances in feed. Regulation has increased
over time in most countries. Doses and specific products are now controlled. Use of drugs
important to human medicine is limited, as are those known to cause rapid development
of resistance in bacteria. USFDA has recently classified growth promoters into two
categories. “Category I” products require no withdrawal from feed when used at growth
promotant levels and include bacitracin, flavomycin, chlortetracycline, lincomycin,
penicillin, tiamulin, tylosin and virginiamycin. “Category II” products do require
withdrawal and include arsanilic acid, roxarsone (3-nitro), carbadox and oxytetracycline.
20
Although growth promoters benefit all involved, consumer’s perception is that edible
poultry tissues are contaminated with harmful concentrations of drug residues. In a
consumer survey, Resurreccion and Galvez (1999) reported that 77 per cent of the
consumers responding felt animal drug residues in meat to be an extreme health concern.
The use of antimicrobials is strictly regulated by the Food and Drug
Administration (FDA) and USDA to warrant their safety and efficacy. Prior to regulatory
approval, the pharmacokinetics and tissue tolerances of an antimicrobial are determined
to set the proper dosage. To ensure proper use both the FDA and USDA have research,
surveillance and compliance programs to develop detection methods and monitor
antimicrobials in poultry meat (Donoghue, 2003).
The selection of a growth promoter in poultry industry must be based on safety
and probability to give high economic returns. The most widely used are the
antimicrobial agents, including antibiotics. In recent years, there has been a flurry of
interest in the use of other non-nutritive substances such as acidifiers, probiotics,
enzymes, herbal products, beta-agonists, microflora enhancers and immune-modulators.
2.2.1 Halquinol as growth promoter
In tests on isolated smooth muscles, Kaul and Lewis (1965) noted that halquinol
markedly reduced peristalsis. They also observed that halquinol caused slowing of the
movement of the intestinal contents of intact animals. Halquinol reduces the tone and
motility of smooth muscle of intestine, thus help in enhancing nutrient absorption (Swick,
1996). These properties provide partial explanation of the improved feed conversion and

21
growth rates which occur from halquinol supplementation of the diet and for prompt
alleviation of the symptoms of diarrhoea.
2.2.1.1 Swine
Head (1974) has reported that pigs housed in a uncleaned pig house (after rearing
previous batch of pigs) and given feed containing 120 g halquinol/ton had a live weight
gain of 19.42 kg over a six week period which was higher than the pigs given untreated
feed (16.85 kg). Further, feed conversion efficiency was also higher with halquinol
treated feed. Halquinol is added to swine feeds @ 100 to 600 ppm for growth promotion
(Botsoglou and Fletouris, 2001).
2.2.1.2 Fishes
Fishes treated with 0.1 per cent halquinol in water showed a higher weight gain
compared to untreated control group. Synergistic increment in the free amino acid (FAA)
level and total protein concentration of fish musculature suggests enhanced anabolic
metabolism resulting in increased weight gain (Mushigeri et al., 2008).
2.2.1.3 Poultry
Halquinol is added to poultry feeds at 30 and 60 ppm for growth promotion
purpose (Botsoglou and Fletouris, 2001).

22
2.2.1.4 Lambs
Welch et al. (1965) has reported that there was a progressive decrease in feed
required per pound of body weight gain with increasing levels of chlorhydroxyquinoline
in feed of fattening lambs.
2.3 Drug residues in foods of animal origin
Administration of drugs to food producing animals requires not only
consideration of effects on the animal but also the effects on humans who ingest food
from these animals. In short, after food producing animals have been exposed to drugs in
order to cure or prevent disease or to promote growth, the effects of the residues of such
treatment may have on humans should be considered. These residues consist of the parent
compound and or compounds derived from the parent drug (or both) including
metabolites, and residues bound to macromolecules (Webber, 1979). Black (1984) has
opined that drugs used as growth promoters in food animals may cause harmful effects on
humans through several mechanisms, such as:
1. Increased microbial drug resistance,
2. Drug residues in food
3. Allergic reactions and sensitization to antimicrobials and
4. Drug toxicity
The important issue of growth promoters is that they may remain in all animal
treated derived foods and can constitute an important health risk for consumers. Some of
the reported effects in animals include genotoxic, immunotoxic, carcinogenic or adverse

23
endocrine effects and therefore pose a risk to consumers. Furthermore, when antibiotics
are used as growth promoters, they may give rise to allergic reactions and emergence of
drug resistant bacteria (Cinquina et al., 2003) and or selection of resistant bacteria in the
gastrointestinal tract and disruption of the colonization barrier of resident intestinal
microflora (Cerniglia and Kotarski, 2005), which can increase its susceptibility to
infection by pathogens like Salmonella spp. and Escherichia coli (Cerniglia and Kotarski,
1998). Thus, the residues of all growth promoters must be monitored in foods of animal
origin (Croubles et al., 2004).
2.4 Tissue distribution of halquinol
The 8-hydroxyquinolines and their derivatives like clioquinol, halquinol are stated
to be absorbed to very little extent from the gastrointestinal tract (Anon., 2005). Up to
five per cent of the total dosage of 5,7-dichloroquinolin-8-ol and 5-chloroquinoline-8-ol
and seven per cent of the total dosage of 7-chloroquinoline-8-ol were only absorbed in
laboratory animals (Clarke, 1978).
Studies in rats indicated slight absorption after oral administration and further
investigations in man and other species showed that substantial portions of oral doses of
the drug excreted through urine (Heseltine and Freeman, 1959).
Bories and Tulliez (1972) reported that the urinary and faecal elimination of
halquinol was rapid, with more than 90 per cent being eliminated within 48 h in the rat.
They reported that urinary elimination of halquinol was predominant in calves and faecal
elimination in rats.

24
In rabbits, administered with halquinol, orally at total dose of 200 mg, 39 mg that
is 19.5 per cent of the administered dose was found in urine collected at 0-24 h after
dosing (Freeman and Heseltine, 1963).
Following a total oral dose of 250 mg of halquinol in man, 26.0 mg was recovered
in urine which amounts to 10.4 per cent of dose administered (Freeman and Heseltine,
1963).
Further, Freeman and Heseltine (1963) also observed that substantial portions of
halquinol were found in urine in calves following oral doses. They recovered 2071 mg of
halquinol (25.9 %) in urine after a total dose of 8000 mg (p.o) in calves.

MATERIALS & METHODS

III. MATERIALS AND METHODS
The oxyquinoline derivative halquinol -HALQUINOL BP 80, composed of 71.39
% of 5,7-dichloroquinolin-8-ol, 26.61 % of 5-chloroquinolin-8-ol and 0 % of 7-
chloroquinolin-8-ol, the total content of the two components being 98 % w/w,
manufactured and supplied by M/s. Provimi Animal Nutrition India Pvt. Ltd., Bangalore
was used in the present experimental study. It was planned to examine the purity or
authentication of the procured halquinol before carrying out the tissue distribution study
of halquinol in broiler chickens. Therefore, various analytical techniques such as
Ultraviolet-visible (UV-Vis) spectroscopy, Fourier Transform Infrared Spectroscopy
(FTIR), Thin Layer Chromatography (TLC), Nuclear magnetic resonance (NMR), High
Performance Liquid Chromatography (HPLC) and Liquid chromatography mass
spectroscopy (LCMS) were performed. The genuineness of the procured halquinol was
assessed by UV-Vis double beam spectrophotometer and FTIR. The purity or presence of
any impurities in the procured halquinol was tested and confirmed by TLC method. All
chemicals or reagents used for UV-Vis spectroscopy, FTIR and TLC were of analytical
grade procured from Merck (E-Merck, India).
3.1 Spectroscopy
Most of what we know about the structure of atoms and molecules comes from
studying their interaction with light (electromagnetic radiation). Different regions of the
electromagnetic spectrum provide different kinds of information as a result of such
interactions. Realizing that light may be considered to have both wave-like and particle-
like characteristics, it is useful to consider that a given frequency or wavelength of light is
26
associated with a "light quanta" of energy we now call a photon. As noted in the
following equations, frequency and energy change proportionally, but wavelength has an
inverse relationship to these quantities.
ν = c/λ where ν = frequency; λ = wavelength and c = velocity of light (c = 3 x 10¹⁰
cm/sec)
∆E = hν where E = energy; h = planks constant and ν = frequency (h = 6.6 x 10⁻²⁷ erg sec)
In order to yield information about certain characteristic features of molecules,
interaction of light photons, energy levels, frequencies, wavelengths and magnetic
resonance are studied in a particular way, known as spectroscopy. Some of the major
spectroscopic techniques, their working principles and what do we decipher from that are
discussed here.
1. Ultra-violet and visible (UV-vis) spectroscopy
2. Infra-red (IR) spectroscopy
3. Nuclear magnetic resonance (NMR) spectroscopy
3.1.1 Ultraviolet visible spectroscopy
3.1.1.1 Principle
The visible region of the spectrum comprises photon energies of 36 to 72 kcal /
mole, and the near ultraviolet region, extends this energy range to 143 kcal / mole. The
energies noted above are sufficient to promote or excite a molecular electron to a higher
energy orbital. Consequently, absorption spectroscopy carried out in this region is
sometimes called "electronic spectroscopy". When sample molecules are exposed to light
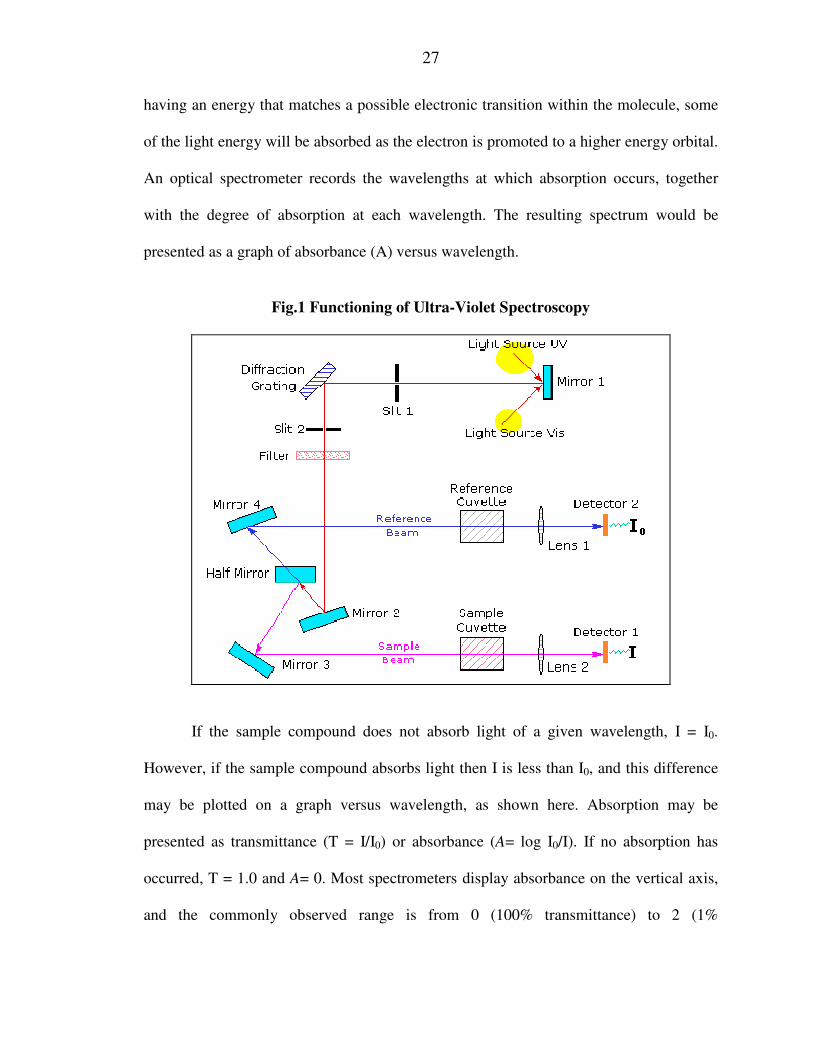
27
having an energy that matches a possible electronic transition within the molecule, some
of the light energy will be absorbed as the electron is promoted to a higher energy orbital.
An optical spectrometer records the wavelengths at which absorption occurs, together
with the degree of absorption at each wavelength. The resulting spectrum would be
presented as a graph of absorbance (A) versus wavelength.
Fig.1 Functioning of Ultra-Violet Spectroscopy
If the sample compound does not absorb light of a given wavelength, I = I0.
However, if the sample compound absorbs light then I is less than I0, and this difference
may be plotted on a graph versus wavelength, as shown here. Absorption may be
presented as transmittance (T = I/I0) or absorbance (A= log I0/I). If no absorption has
occurred, T = 1.0 and A= 0. Most spectrometers display absorbance on the vertical axis,
and the commonly observed range is from 0 (100% transmittance) to 2 (1%
28
transmittance). The wavelength of maximum absorbance is a characteristic value,
designated as λmax.
The UV visible absorption spectra (200 to 400 nm) of 5,7-dichloroquinolin-8-ol
and 5-chloroquinolin-8-ol standards and of halquinol were recorded using a double
beam UV-visible spectrophotometer (Owen, 2000), Evolution 300 (Thermo Fisher
Scientific, Madisson, WI, USA) operated by Vision Pro® software. Individual stock
(1mg/ml) solutions of 5,7-dichloroquinolin-8-ol and 5-chloroquinolin-8-ol and halquinol
in methanol were prepared. To find out the extent of the chemical solubility of halquinol
in various organic and aqueous solvents spectroscopy was performed on halquinol
solution of halquinol and acetonitrile (Table 1 to 5). Spectra were analysed for the
solubility of halquinol by considering 100% solubility of halquinol in DMSO. Six
solvents were used to determine the maximum solubility of halquinol. These stock
solutions were diluted in HCl (0.1M), NaOH (0.1N) and methanol and UV-visible spectra
were recorded (Fig 6 to 10).

29
Table 1. List of solvents used to dissolve Halquinol
Formulation Abs. λmax. Fold Solubility
HAL-Acetonitrile 0.6934 338.5 5.70
HAL-DCM 0.6119 338.5 5.00
HAL-Hexane 0.5234 338.5 4.32
HAL-Methanol 0.6689 338.5 5.53
HAL-Ethanol 0.6940 338.5 5.60
HAL-Water 0.1209 338.5 1.00
Table 2. Ultraviolet-visible parameters of 5,7-dichloroquinolin-8-ol in water
Formulation Abs. λmax. Fold Solubility
5-HAL-Water 0.3367 247 1.00
7-HAL-Water 0.2412 247 0.71
HAL-Water 0.5621 247 1.70
Table 3. Ultraviolet-visible parameters of 5,7-dichloroquinolin-8-ol in acidic
medium
Formulation Abs. λmax. Fold Solubility
5-HAL-ACID 0.2739 379.5 1.00
7-HAL-ACID 0.0346 368 0.13
HAL-ACID 0.3709 379.5 1.35
30
Table 4. Ultraviolet-visible parameters of 5,7-dichloroquinolin-8-ol in basic medium
Formulation Abs. λmax. Fold solubility
5-HAL-Base 0.6397 383.5 1.00
7-HAL-Base 0.6158 383.5 0.96
HAL-Base 0.5847 383.5 0.91
Table 5. Ultraviolet-visible parameters of 5,7-dichloroquinolin-8-ol in DMSO
Formulation Abs. λmax. Fold Solubility
5-HAL-DMSO 0.6831 341 1.00
7-HAL-DMSO 0.6657 341 0.97
HAL-DMSO 0.6589 341 0.96
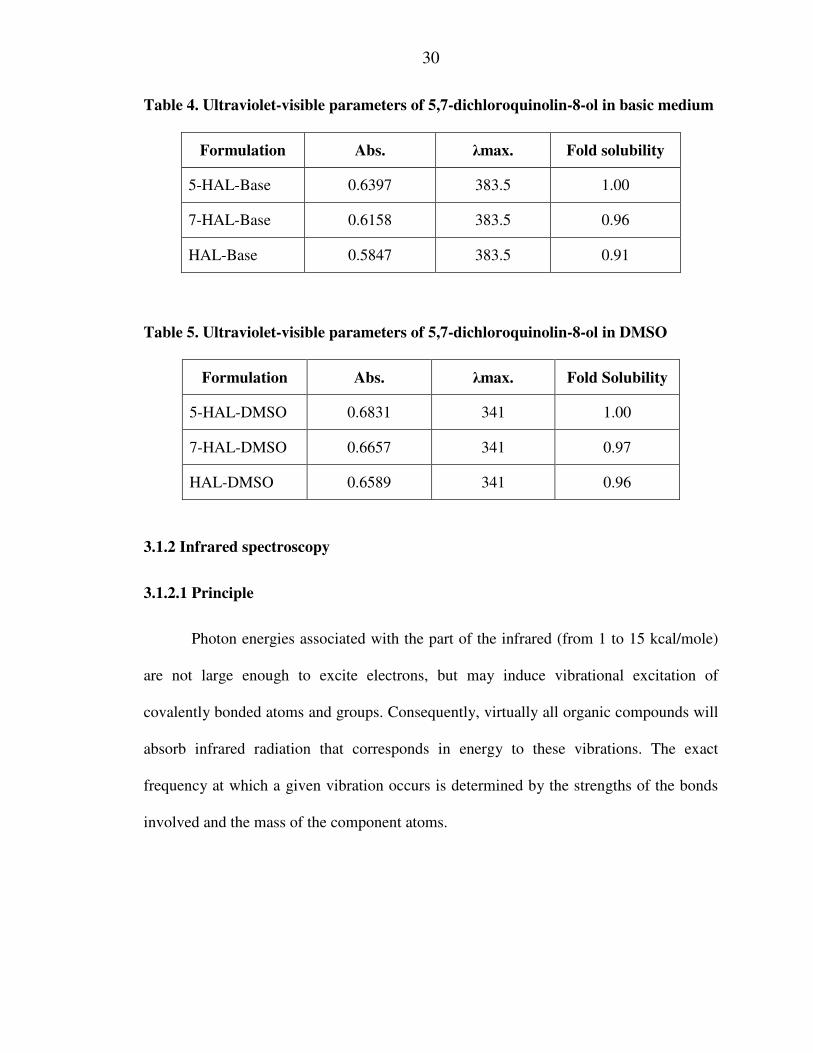
3.1.2 Infrared spectroscopy
3.1.2.1 Principle
Photon energies associated with the part of the infrared (from 1 to 15 kcal/mole)
are not large enough to excite electrons, but may induce vibrational excitation of
covalently bonded atoms and groups. Consequently, virtually all organic compounds will
absorb infrared radiation that corresponds in energy to these vibrations. The exact
frequency at which a given vibration occurs is determined by the strengths of the bonds
involved and the mass of the component atoms.
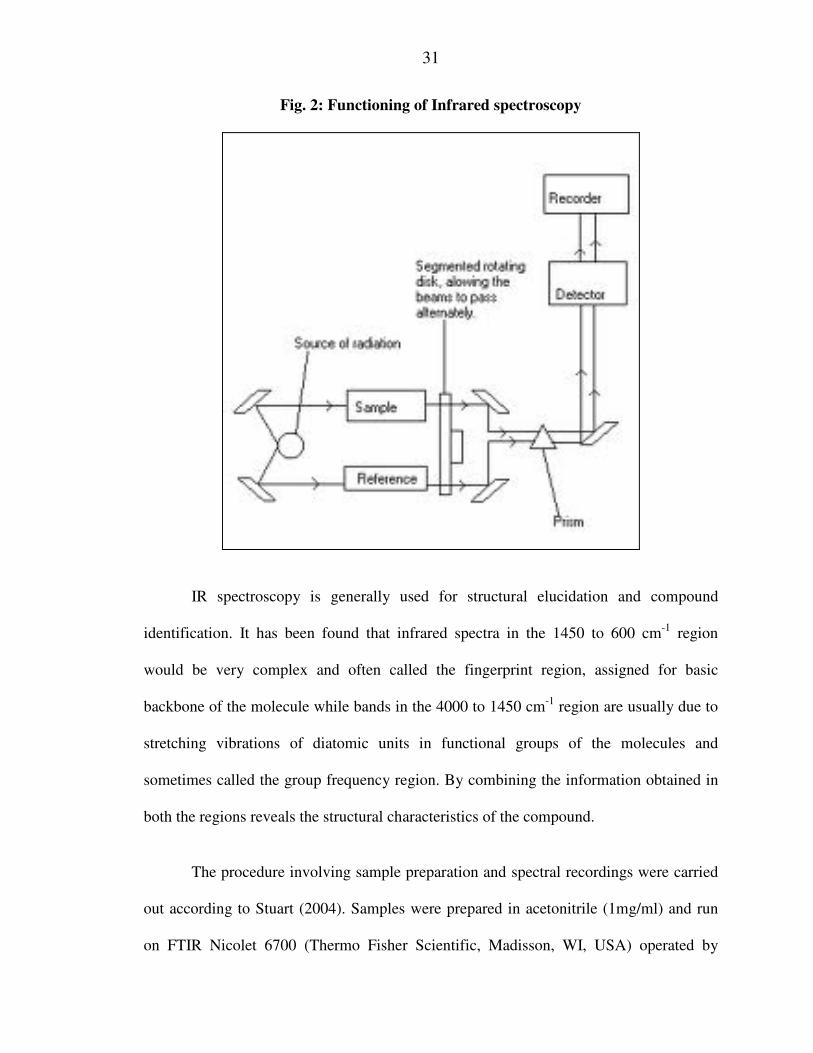
31
Fig. 2: Functioning of Infrared spectroscopy
IR spectroscopy is generally used for structural elucidation and compound
identification. It has been found that infrared spectra in the 1450 to 600 cm-1 region
would be very complex and often called the fingerprint region, assigned for basic
backbone of the molecule while bands in the 4000 to 1450 cm-1 region are usually due to
stretching vibrations of diatomic units in functional groups of the molecules and
sometimes called the group frequency region. By combining the information obtained in
both the regions reveals the structural characteristics of the compound.
The procedure involving sample preparation and spectral recordings were carried
out according to Stuart (2004). Samples were prepared in acetonitrile (1mg/ml) and run
on FTIR Nicolet 6700 (Thermo Fisher Scientific, Madisson, WI, USA) operated by

32
Omnic software 8.1.Data was analysed by mentioning by describing various vibrational
bands appeared in spectra because of the chemical nature of the halquinol and its
constituents .The infrared spectra of 5,7-dichloroquinolin-8-ol, 5-chloroquinolin-8-ol and
halquinol were recorded using two different modes:
1. A direct transmission mode using a KBr disk method and
2. By attenuated total reflectance (ATR) method using smart orbit diamond ATR.
Approximately one mg each of 5,7-dichloroquinolin-8-ol, 5-chloroquinolin-8-ol
and halquinol was grounded in potassium bromide (spectroscopy grade) using mortar and
pestle and pressed to a transparent disk . The KBr disks were then placed in the sample
holder to record infrared (IR) spectra. Similarly, few milligrams of aforesaid compounds
were placed individually on the sample plate of the smart orbit and screwed lightly to
record IR spectra in ATR mode. The IR spectra of 5,7-dichloroquinolin-8-ol, 5-
chloroquinolin-8-ol and halquinol mix are depicted in Fig 11,12 and 13 respectively The
details of functional groups obtained by IR spectra are given in Table 9, 10 and 11.
3.1.3 Nuclear Magnetic Resonance (NMR)
3.1.3.1 Principle
The principle behind NMR is that many nuclei have spin and all nuclei are
electrically charged. If an external magnetic field is applied, an energy transfer is possible
between the base energy to a higher energy level (generally a single energy gap). The
energy transfer takes place at a wavelength that corresponds to radio frequencies and
when the spin returns to its base level, energy is emitted at the same frequency. The
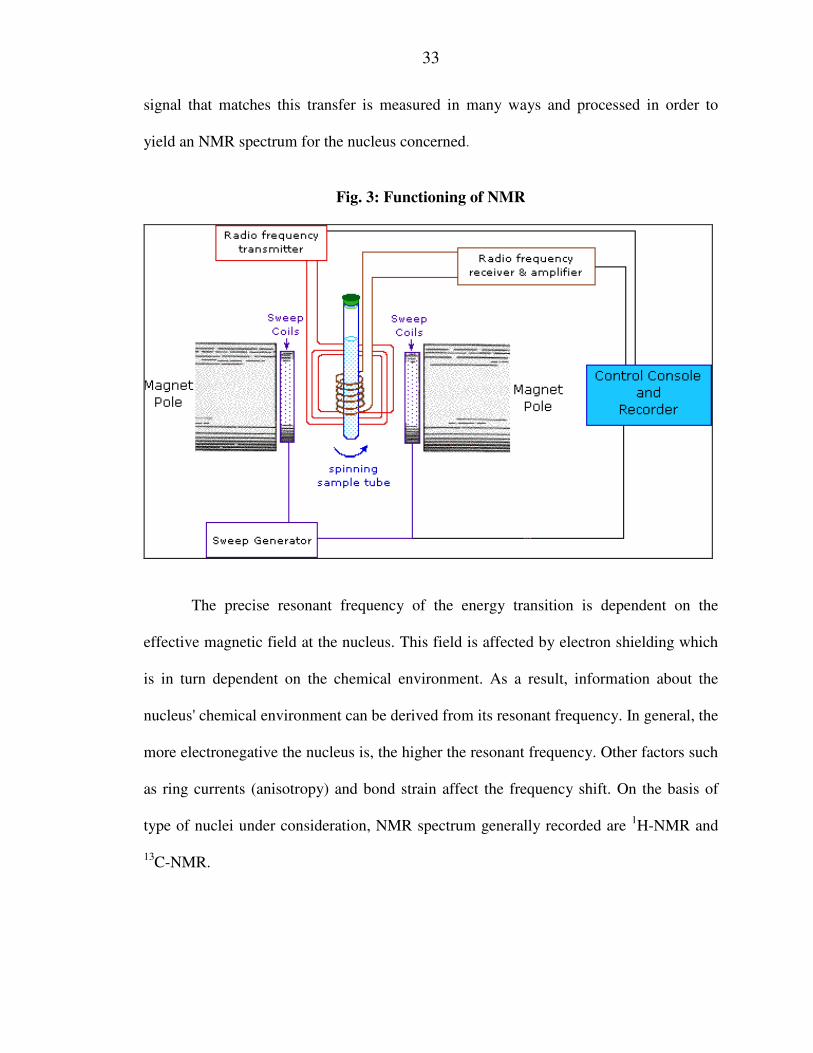
33
signal that matches this transfer is measured in many ways and processed in order to
yield an NMR spectrum for the nucleus concerned.
Fig. 3: Functioning of NMR
The precise resonant frequency of the energy transition is dependent on the
effective magnetic field at the nucleus. This field is affected by electron shielding which
is in turn dependent on the chemical environment. As a result, information about the
nucleus' chemical environment can be derived from its resonant frequency. In general, the
more electronegative the nucleus is, the higher the resonant frequency. Other factors such
as ring currents (anisotropy) and bond strain affect the frequency shift. On the basis of
type of nuclei under consideration, NMR spectrum generally recorded are 1H-NMR and
13C-NMR.

34
In 1H-NMR various parts of spectra reveal different information about the
compound as 1) number of signals indicates how many "different kinds" of protons are
present; 2) positions of the signals indicates something about magnetic (electronic)
environment of protons; 3) intensities (areas) of the signals proportional to number of
protons present; 4) splitting of a signal into several peaks indicates the number of nearby
nuclei having magnetic moments (usually protons, sometimes fluorine) and 5) The area
under a particular signal is proportional to the number of protons giving rise to the signal.
For looking at carbon using NMR, we have to look at carbon-13, which does have
a magnetic moment, but which is only about 1% of carbon as it occurs in nature. So, the
instrumentation required is more complex. But the analysis of 13C-NMR spectra is
considerably easier because the analysis of a C-13 spectrum involves noting the number
of signals and their chemical shift. Each carbon gives rise to a signal, but if two or more
carbons are equivalent, their signals will exactly overlap. Similar to proton NMR,
chemical shift may suggest the type of carbon that is giving rise to a particular signal.
Signal splitting and peak areas are not seen in these spectra. Furthermore, signal overlap
from non-equivalent atoms is much less common in C-13 spectra than in proton spectra.
It has since been used in an almost unlimited variety of ways in physics,
chemistry and biology. For the investigation of biological systems it is convenient to
distinguish between three types of applications:
(1) To study structure and function of macromolecules,
(2) To study metabolism, and
(3) To obtain in vivo images of anatomical structure and functional (physiological) states.

35
The use of 1H NMR for metabolic studies was described as early as 1977 by
(Gadian,1995) when it was shown that 1H signals could be observed from a range of
compounds in a suspension of red blood cells, including lactate, pyruvate, alanine and
creatine. A great deal of metabolic information can be derived from such metabolic
studies and it was soon recognized that 1H NMR of body fluids has a considerable role to
play in areas of pharmacology, toxicology and the investigations of inborn errors of
metabolism.
To find out the purity and composition of starting material halquinol and its
individual components 5-chloro-8-quinolinol and 5,7-dichloro-8-quinolinol 1H-NMR
(Proton nuclear magnetic resonance) and 13C-NMR (Proton nuclear magnetic resonance)
spectra were acquired. Tetramethylsilane (TMS) was used as internal standard
representing nuclear magnetic resonance shifts (δ) value 0.00.1H-NMR and 13C-NMR
were acquired at 400 and 100 MHz frequency, respectively. Scans were performed on 1
mg/mL concentration of halquinol and its components in CDCl3 (Deuterated chloroform).
Samples were acquired at 200 scans. Compounds were characterized by magnetic
resonance shifts (δ) of various protons (As shown and assigned in NMR spectra Fig
(Spectra 14, 15, 16, 17, 18 and 19).
3.1.4 Liquid Chromatography Mass Spectroscopy (LCMS)
3.1.4.1 Principle
Chromatography is the ability to separate molecules using partitioning
characteristics of molecule to remain in a stationary phase versus a mobile phase. High
performance liquid chromatography (HPLC) is about solvent being forced through under

36
high pressures of up to 400 atmospheres. That makes it much faster. It also allows to use
a very much smaller particle size for the column packing material which gives a much
greater surface area for interactions between the stationary phase and the molecules
flowing past it. This allows a much better separation of the components of the mixture.
HPLC separates things, but provides little extra information about what a
chemical might be. In fact, it is hard in HPLC to be certain that a particular peak is pure,
and contains only a single chemical. Adding a mass spectrometer to this tells the masses
of all the chemicals present in the peak, which can be a very good starting point for
identifying them, and an excellent method to check for purity.
Fig.4 Functioning of LC-MS
LC-MS provides superior specificity and sensitivity and can be used to develop
highly accurate and reproducible assays. The primary advantage LC-MS has that it is
capable of analysing a much wider range of components. Compounds that are thermally
labile, exhibit high polarity or have a high molecular mass may all be analysed using LC-

37
MS. Compounds are separated on the basis of their relative interaction with the chemical
coating of these particles (stationary phase) and the solvent eluting through the column
(mobile phase) and introduced to the mass spectrometer via a specialised interface to find
the accurate mass of the chemical. It gives the clear idea about the presence of the
chemical in starting mixture.
3.1.4.2 Chemicals and Materials
Halquinol and its constituents (5,7-dichloroquinolin-8-ol, 5-chloroquinolin-8-ol)
were obtained from Sigma Chemicals ltd. LC grade acetonitrile and methanol were
purchased. Reagent grade anhydrous disodium phosphate, citric acid, trifluoroacetic acid
(TFA), trichloroaceticacid (TCA), disodium ethylene diaminetetraacetate (Na2EDTA),
and sodium hydroxide were obtained from Merck. Distillation and passage were through
Milli-Q System (Millipore, Bedfore, United States) purified water. All solvents and
solutions used in this study were filtered through a 0.2 mm filter under vacuum and were
degassed by ultrasonication before LC analysis. LCMS assay was carried out by the
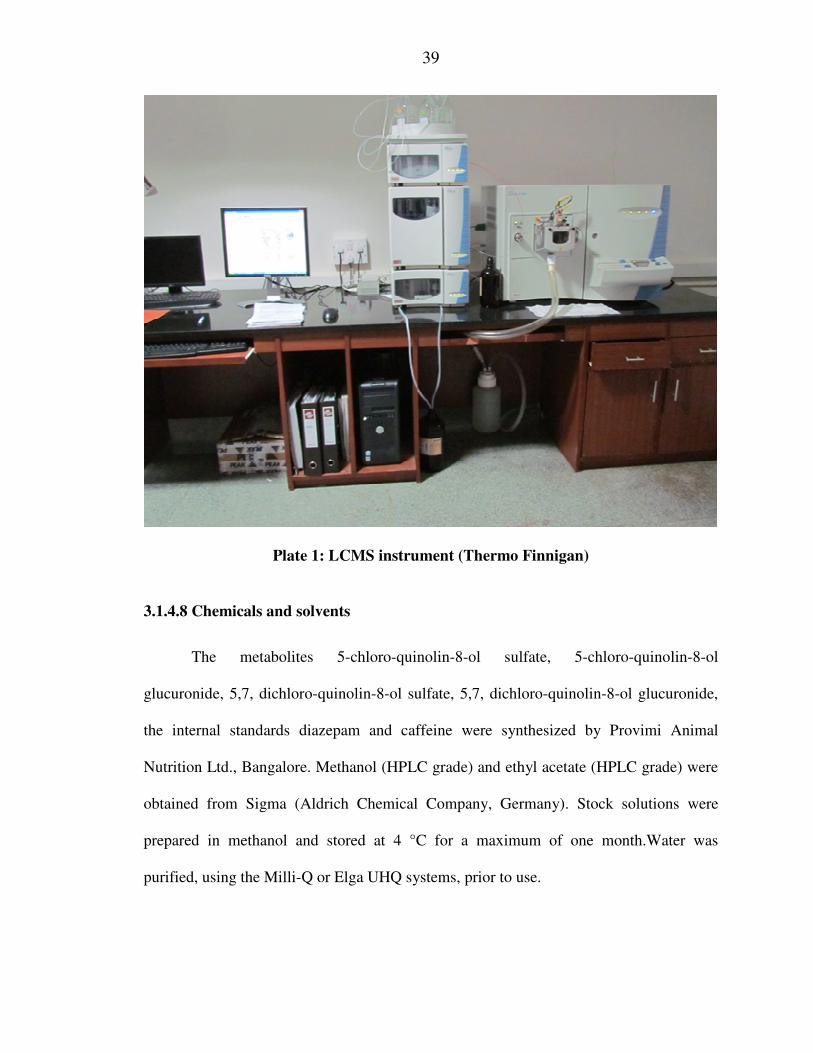
procedure as reported by (Jane et al ., 2005). The image of LCMS is depicted in Plate 1.
The representative LCMS graphs of halquinol and its metabolites are depicted in Fig. 20
to 37.
3.1.4 .3 HPLC-MS experimental details
3.1.4.4 Instrument:
HPLC: Thermo Finnigan Surveyor
MS: Thermo LCQ Deca XP MAX
Software: Xcalibur

38
3.1.4.5 Experimental Conditions:
Column: BDS HYPERSIL C18 (Reverse Phase)
Length (mm): 250
I.D. (mm): 4.6
Particle Size (um): 5
Detection: UV @ 220nm-Channel C for Samples GF.
Detector details: HPLC PDA / UV detector
Temperature: Ambient
Injection Volume: 10uL
3.1.4 .6 Solvents
A: Acetonitrile
B: Ethyl Acetate
C: Water
D: Methanol
Flow rate: 1 mL/min
Run Time (min): 30.00
3.1.4.7 MS Experimental Conditions:
Probe/ source voltage: 4.5kV
Mode of Ionization: +ve mode, -ve mode
Mass range: 100m/z to 700m/z
Source type: ESI (Electro Spray Ionization)
Nebulization gas flow: Helium at 1mL/min approx
39
Plate 1: LCMS instrument (Thermo Finnigan)
3.1.4.8 Chemicals and solvents
The metabolites 5-chloro-quinolin-8-ol sulfate, 5-chloro-quinolin-8-ol
glucuronide, 5,7, dichloro-quinolin-8-ol sulfate, 5,7, dichloro-quinolin-8-ol glucuronide,
the internal standards diazepam and caffeine were synthesized by Provimi Animal
Nutrition Ltd., Bangalore. Methanol (HPLC grade) and ethyl acetate (HPLC grade) were
obtained from Sigma (Aldrich Chemical Company, Germany). Stock solutions were
prepared in methanol and stored at 4 °C for a maximum of one month.Water was
purified, using the Milli-Q or Elga UHQ systems, prior to use.

40
3.1.4.9 LC–MS analysis
The LC–MS–MS system consisted of Liquid Chromatograph Thermo LCQ Deca
XP MAX Thermo TSQ Quantum connected to a triple quadruple mass spectrometer (PE
Sciex, Toronto, Canada) in electrospray positive ionization mode. ACTCHTSPAL auto
injector was connected to the system. The chromatography was performed in C18
(100mm×2.1 mm) Jones®, connected to a C18 (1 cm×4 mm) Jones® pre-column. The
mobile phase was composed by two solutions: A (water and 0.1% acetic acid) and B
(90% acetonitrile, 10% water and 0.1% acetic acid). The column was operated at room
temperature at a flow rate of 1ml / min.The ions were monitored by Multiple Reaction
Monitoring (MRM) according to the method described by Leitner et al. (2001).
3.1.4.10 Sample preparation
Breast muscle and liver samples were obtained from poultry shed. Samples were
homogenized using a domestic food blender and were stored at -20°C until analysis. To
5.0 g amount of homogenized sample, weighed into 50 ml polypropylene centrifuge tube
was added 20 mL of pH 4.0 Na2EDTA buffer solution, which was vortex-mixed for two
min. The tubes were then shaken for 10 min on a flatbed shaker at high speed and were
sonicated for 15 min in an ultra-sonication bath. The samples were immersed in an
ice/salt bath during ultrasonic processing. To this 10 ml of 0.1 M HCl was added and
sonicated for ten min in sonicator. Twenty five ml of ethyl acetate was added and again
sonicated for ten min and centrifuged at 4000 g for five min and the supernatants were
decanted carefully into a clean second centrifuge tube. Two more extractions were
effectuated with 20 mL and 10 mL of pH 4.0 Na2EDTA buffer solution, and all the steps

41
were repeated until the supernatants from all three extractions were collected in the
second tube.
The cartridges Oasis HLB were conditioned with methanol (3 mL) and water (2
mL). After extraction, the cartridges were flushed with 2 mL of 5% aqueous methanol
and were eluted using 2 mL of 1% TFA in methanol. The elutes were evaporated to 0.5
mL under gentle nitrogen stream in a water bath at 30°C and were kept at 4°C just before
injection into the chromatographic system to avoid degradation. A blank and one
fortification assay were included in each analytical run to check for interferences (e.g.,
coeluting substances) and to control the accuracy.
Phosphate disodium EDTA (3 %) buffer was added to each sample solutions to
prevent the metal ions Cu2+, Fe3+, Zn2+ being extracted into the organic phase
(acetonitrile fraction), thus a sharp chromatogram of 5,7-dichloroquinolin-8-ol and 5-
chloroqunolin-8-ol was obtained. Similar technique was adopted by Hayakawa et al.
(1982) for chromatography of clioquinol, a derivate of 8-hydroxyquinoline. Further,
previous report (Bondiolotti et al., 2006) indicates that addition of phosphate disodium
ethylendiaminotetraacetate (Na2EDTA) buffer prevents the formation of complexes that
may reduce recovery of clioquinol in plasma and tissue samples of hamsters quantified
by HPLC.
3.1.4.11 Standards, Buffer, and Mobile-Phase Preparation
Individual methanolic stock standard solutions of 5,7-dichloroquinolin-8-ol, 5-
chloroquinolin-8-ol and halquinol were prepared at a concentration of 1 mg/mL, into a
volumetric flask, and were stored at -20 °C in glass vials for a maximum period of one

42
month. The working solutions were a mixture of the halquinol prepared by serial
dilutions of the stock solution in methanol and were stored in glass vials at 4 °C. These
solutions were prepared daily immediately before use and were always kept at 4 °C
protected from light. The mobile phases used for spectrofluorometric and mass
spectrometric analysis were a mixture of acetonitrile 0.01 M and ethyl acetate (aq pH 2.0)
30:70 and acetonitrile 0.01 M and trifluoroacetic acid (aq pH 2.0) 20:80, respectively.
The buffer EDTA solution was prepared weekly by the method described by Mala et al.
(2010).
3.1.5 Experimental Conditions
3.1.5.1 Liquid chromatography-mass spectrometer.
Thermo TSQ Quantum triple quadrupole Access mass spectrometer coupled to
Thermo Accela LC pump and autosampler. LCQuan(V 2.5.6), Xcalibur Qualbrowser(V
2.0.7) software was used to obtain and process data.
3.1.5.2 Labware.
15 mL disposable, conical, graduated, polypropylene tubes with cap (#352097,
Becton Dickinson, Franklin Lakes, NJ) polypropylene LC sample vials 2 mL with conical
insert (#9301-0978, Agilent, Santa Clara, CA) with pre-scored snap caps.
3.1.5.3 Centrifuges.
(1) refrigerated to 5º C, capable of accelerating 15 mL tubes to 4,000 g
(2) Micro centrifuge capable of accelerating 1.5 mL tubes to 13,500 rpm
43
3.1.5.4 Organic solvents.
High purity chromatographic and spectrophotometric grade acetonitrile and
methanol, or equivalent.
3.1.5.5 LCMS Parameters.
Positive ion electrospray ionization was used for all residues. Instrument was
tuned by infusing a 10 µg mL-1 solution of ethyl acetate (10 µL min-1) into a stream of
50:50 0.1% formic acid: ACN (250 µL min-1) to optimize parameters such as spray
voltage and gas flows. Solutions were infused of each residue (at 10 µg mL-1) to
determine the optimal tube lens values and collision energies for the SRM transitions.
Following general MS parameters were used: spray voltage, 4 kV; capillary temperature,
220ºC; nitrogen sheath gas, 50 arbitrary units; nitrogen auxiliary gas, LC retention times
were adjusted to present experimental conditions.
3.1.5.6 Experimental birds
The study was conducted in unsexed Vencobb 400® broiler birds (M/s
Venkateshwara Hatcheries, Bangalore, India). Day old chicks were procured from
reputed breeder and were reared under deep litter system. Vaccination of broiler chicks
for New Castle disease and infectious bursal disease was carried out on 7th and 14th day
respectively. Standard poultry feed mixed with halquinol at different dose levels and free
of any other antibiotics and/or antimicrobials was used to feed the birds during the trial
and birds had free access to clean potable water. Standard vaccination and husbandry
conditions were set, but no anticoccidial or antibacterial drugs were administered.

44
Necessary approval from the Institutional Animal Ethics Committee (IAEC),
Veterinary College, Hebbal, Bangalore, India was obtained (No.38/LPM/IAEC/2010)
before conducting the present study.
3.1.5.7 Experimental design
Four hundred day-old broiler chicks obtained from a commercial hatchery were
divided into a control group and three treatment groups comprising of 100 chicks each.
The experimental design is presented in Table 6.
Table 6: The experimental design
Group Inclusion level of halquinol in feed (ppm)
Group I (Control C, n=100) -
Group II (Treated T1, n=100) 60 ppm
Group III (Treated T2, n=100) 120 ppm
Group IV (Treated T3, n=100) 240 ppm
The birds belonging to control group were fed on standard poultry feed ad libitum
free of halquinol or any other antimicrobials, while experimental birds in the treatment
groups (T1, T2 and T3) were fed ad libitum on standard poultry feed mixed with halquinol
at different levels for a period of 40 days (Table 6).
3.1.5.8 Drugs and chemicals
Pure reference standards of 5,7-dichloroquninolin-8-ol and 5-chloroquinolin-8-ol,
the two constituent molecules of halquinol were obtained from Sigma, St. Louis, USA.
Halquinol used in the present experimental study was procured from M/s. Provimi

45
Animal Nutrition India Pvt. Ltd., Bangalore, India. Halquinol and its constituent
molecules were kept free from metal contact and were protected from light to avoid
chelating and photo degradability respectively. For HPLC grade water, water was
obtained by using Milli-Q water purification system (Milli-Q gradient, Millipore). HPLC
grade acetonitrile and methanol were obtained from E. Merck, India. All other chemicals
used in study i.e., orthophosphoric acid, disodium EDTA were of analytical grade. All the
solvents and solutions were filtered through 0.45µ nylon membrane filters before using
them during HPLC analysis of halquinol.
3.1.5.9 Feed
Five hundred kilogram each of standard starter broiler feed and finisher broiler
feed were manufactured at poultry feed manufacturing facility of M/s Provimi Animal
Nutrition India Pvt. Ltd., Bangalore, containing no antimicrobial agents and/or growth
promoters. Halquinol was added to feed at different levels of 60, 120 and 240ppm and
mixed thoroughly using commercial poultry feed mixer. The halquinol pre-mixed feed
was then stored in plastic containers until used. Feed ingredients and nutritional
composition of the starter and finisher diet is presented in Table 7 (i) and (ii) respectively.
3.2 Analysis of halquinol in feed samples
3.2.1 Extraction procedure
Three necked round bottomed flask (500 ml-1L) with a reflux condenser in an oil
bath was set up. Ten gram of feed sample was weighed, and then transferred into 500 ml-
1L round bottomed flask. To this, 100 ml of 1% di-sodium EDTA solution and 200 ml of
chloroform was added. Contents of the flask were heated to 40°C and stirred for 180 min
46
(3 hours) at a speed of 300-400 rpm. Contents of the flask were cooled to 35°C, and then
filtered using muslin cloth under vacuum. Filtrate transferred into a separating funnel of
500 ml capacity. Residue in the flask was washed using 25 ml x 2 times of chloroform.
Washings were pooled and added to separating funnel. Organic layer from bottom was
collected. Aqueous layer was washed with 20 ml x 2 times chloroform and washings
were pooled and pooled organic layer was evaporated in a rotary evaporator (Heidolph,
Germany) under vacuum at 45°C. Residues was dissolved in one milliliter of HPLC
grade methanol and predetermined amount of it was injected into HPLC using auto
sampler unit.
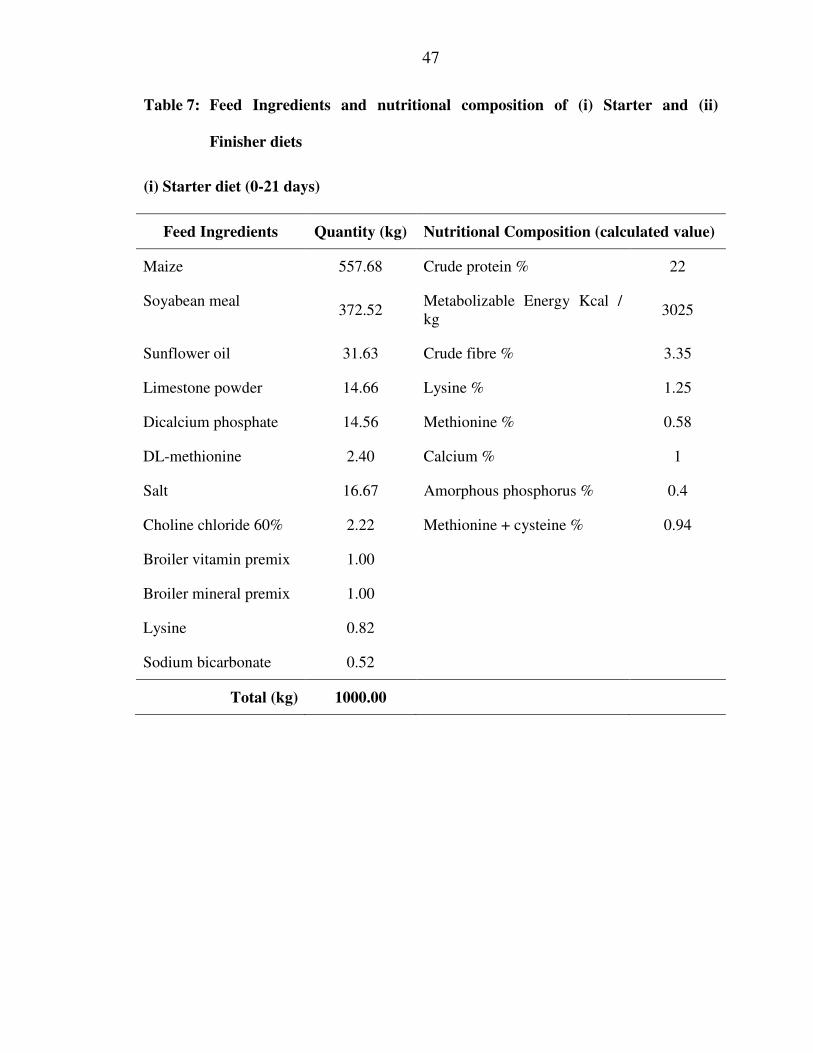
47
Table 7: Feed Ingredients and nutritional composition of (i) Starter and (ii)
Finisher diets
(i) Starter diet (0-21 days)
Feed Ingredients Quantity (kg) Nutritional Composition (calculated value)
Maize 557.68 Crude protein % 22
Soyabean meal 372.52
Metabolizable Energy Kcal / kg
3025
Sunflower oil 31.63 Crude fibre % 3.35
Limestone powder 14.66 Lysine % 1.25
Dicalcium phosphate 14.56 Methionine % 0.58
DL-methionine 2.40 Calcium % 1
Salt 16.67 Amorphous phosphorus % 0.4
Choline chloride 60% 2.22 Methionine + cysteine % 0.94
Broiler vitamin premix 1.00
Broiler mineral premix 1.00
Lysine 0.82
Sodium bicarbonate 0.52
Total (kg) 1000.00

48
(ii) Finisher diet (22-42 days)
Feed Ingredients Quantity (kg) Nutritional Composition (calculated value)
Maize 602.34 Crude protein % 19.5
Soyabean meal 310.75 Metabolizable energy Kcal/kg 3200
Sunflower oil 52.68 Crude fibre % 3.07
Limestone powder 11.98 Lysine % 1.03
Dicalcium phosphate 15.15 Methionine % 0.47
DL-methionine 1.62 Calcium % 0.9
Salt 2.48 Amorphous phosphorus % 0.45
Choline chloride 60% 1.00 Methionine+ cysteine % 0.8
Broiler vitamin premix 1.00
Broiler mineral premix 1.00
Total (kg) 1000.00
3.2.2 LC-MS analysis
The mobile phase consisted of 0.1% orthophosphoric acid and acetonitrile mixed
at a ratio of 1:1 volumes. The flow rate of mobile phase was one mL per minute. The
detection wavelength was set at 247 nm and the samples were analyzed for 30 min with
column oven temperature set at 40°C. A reverse phase C18 column (250 x 4.6 mm,
particle size 5µ, Purosper Star, E-Merck) and HPLC-Thermo Finnigan Surveyor was
used for analysis of halquinol in feed samples.
Representative feed samples containing halquinol @ 60, 120 and 240 ppm were
assayed using HPLC and the halquinol concentration was found to be at desired level.

49
3.2.3 Feeding halquinol mixed feed to broiler birds
Day old chicks were allocated to control and treatment groups on same day itself,
and from day 1 to day 20, standard poultry starter feed mixed with halquinol at 60, 120,
240 ppm was fed to chicks of T1, T2 and T3 treatment groups respectively and standard
poultry starter feed free of halquinol was fed to chicks of control group from day 1 to day
20. From day 21 to day 42, standard finisher poultry feed mixed with halquinol at 60,
120 and 240 ppm was fed to birds of T1, T2 and T3 treatment groups respectively and
standard finisher feed free of halquinol was fed to birds of control group from day 21 to
day 42. Chicks were housed under deep litter system with partitions in between to
separate control and different treatment groups apart. Birds had access to clean potable
water ad libitum throughout the trial. From day 41 both control and treatment groups
were fed standard poultry finisher ration free from halquinol for the rest of the period of
study.
3.3 Collection of samples
3.3.1 Collection of samples during period of halquinol exposure through diet
In order to determine tissue distribution of halquinol and its metabolites, upon
incorporating it with poultry feed in broilers, six birds from each group were sacrificed
on 5, 10, 20, 30 and 40 days during treatment and tissue samples viz. liver, kidney, breast
muscle of each bird were collected in separate labeled colorless self sealing polythene
bags and stored in deep freezer (-20 °C) until assayed.
50
3.3.2 Collection of samples after the withdrawal of halquinol exposure through diet
With a view to determine tissue depletion of halquinol that is tissue concentration
of halquinol after withdrawal of treatment in broilers, six birds from each group were
sacrificed at 2 h post-withdrawal of halquinol exposure through diet and on 1, 2, 3, 4, 5,
6, 7, 8, 9 and 10 days after withdrawal of treatment and tissue samples viz. liver, kidney,
breast muscle of each bird were collected in separate labeled self sealing polythene bags
and were kept in deep freezer until analyzed.

51
Plate 2. A representative photograph of day old broiler chicks on standard poultry
diet pre-mixed with halquinol
Plate 3. A representative photograph of twenty days old broiler birds on standard
poultry diet pre-mixed with halquinol

52
Plate 4. A representative photograph of forty days old broiler birds on standard
poultry diet pre-mixed with halquinol
Plate 5. Experimental birds maintained in a broiler house under deep litter system.

53
3.4 Assay of halquinol in tissue samples
The concentration of 5,7-dichloroquinolin-8-ol and 5-chloroquinolin-8-ol in tissue
samples was determined by high performance liquid chromatography (HPLC; Shimadzu
Prominence, Japan) with photodiode array detector set at a wavelength of 247 nm.
Necessary studies were carried out to confirm the stability of 5,7-dichloroquinolin-8-ol
and 5-chloroquinolin-8-ol under sample storage conditions. The standard procedures
were adopted to confirm the recovery per cent, repeatability and assay precision. All the
tissue samples were assayed in duplicate.
3.4.1 Assay of halquinol metabolites in tissue samples
The concentration of conjugated metabolites of halquinol viz, 5-chloro-quinolin-
8-ol sulfate, 5-chloro-quinolin-8-ol glucuronide, 5,7, dichloro-quinolin-8-ol sulfate, 5,7,
dichloro-quinolin-8-ol glucuronide were analysed by LCMS and the mass spectra was
performed by Microfocal Origin Pro analytical and Xcalibur softwares. The molecular
formulas of the metabolites were calculated using chemdraw software.
3.4.2 Experimental conditions
The HPLC system consists of single pump (LC-20AT), an auto sampler (SIL-
20A), photo diode array detector (SPD-M20A) and LC solution® software for data
analysis. A reverse phase C18 column (250 X 4.6 mm, particle size 5µm, pH:1.5-11,
Purospher Star RP-18e, Merck, Germany) served as stationary phase. The mobile phase
consisted of 0.1% v/v, orthophosphoric acid and acetonitrile mixed at a ratio of 1:1 v/v.

54
The flow rate of the mobile phase was one mL per minute and the injection
volume was 20 µl. The detection wavelength was set at 247 nm with scanning range of
200-400 nm and the samples were analyzed for 30 min with column oven temperature set
at 40°C. There were no interfering peaks in the chromatogram at the retention times of
14.8 min for 5,7-dichloroquinolin-8-ol and 5 min. for 5-chloroquinolin-8-ol. Extracted
tissue samples were injected into LCMS automatically through auto sampler unit of
LCMS system.
Due to the chelating effects of halquinol and its two constituent molecules: 5,7-
dichloroquinolin-8-ol and 5-chloroquinolin-8-ol with metallic cations, the existence of
even trace amount of metals on the packing material will cause peak tailing and/or
irreversible adsorption effects. Therefore, the column was treated with Na2EDTA to
remove all the traces of metals before use, following a procedure previously reported for
HPLC analysis of tetracycline by Lian et al. (1998).
Aqueous solution (0.1 M) of Na2EDTA was flushed through the column at a flow
rate of 1mL/min for 1 h before the first sample run. The column was then rinsed with
water for 30 min to remove all Na2EDTA residues and was reconditioned by flushing
with mobile phase for another 30 minute. No further treatment was necessary during the
experiments.
3.4.3 Liver
Frozen liver tissue samples were thawed and external fat and fascia was trimmed
off. Five gram of liver tissue was cut into two to three small pieces and then
homogenized using motor driven tissue homogenizer (Remi,India), equipped with a

55
ground glass cylinder and teflon pestle. The homogenate was decanted quantitatively into
screw capped polypropylene test tubes of 50 ml capacity. To it was added 0.5 ml of
0.02M phosphate disodium EDTA buffer (pH 6.5) and mixed by shaking. The mixture
thus obtained was subjected to extraction of 5,7-dichloroquinolin-8-ol and 5-
chloroqunolin-8-ol by adding 20 ml of ethyl acetate and then vortexed for three min.
After vortexing, the mixture was centrifuged (Eppendorf Centrifuge 5810R, Germany;
fixed angle rotor) at 10,000 rpm for 5 min. The supernatant was transferred into 50 ml
glass stoppered test tube. The extraction procedure was repeated with 10 ml ethyl acetate
and the supernatant was transferred in to same test tube. The pooled organic fraction was
evaporated to dryness in a gentle stream of nitrogen under water bath maintained at 50
°C. The residue left was reconstituted with one milliliter of methanol. This solution was
then filtered through a 0.45 µm PVDF syringe driven membrane filter into an auto
sampler vial. A 20 µl of this solution was injected into HPLC through auto sampler unit.
3.4.4 Kidney
Five gram of kidney tissue was cut into two to three small pieces and
homogenized using motor driven tissue homogenizer (Remi, India) equipped with a
ground glass cylinder and teflon pestle. Tissue homogenate was then transferred
quantitatively into 50 ml polypropylene screw capped centrifuge tube. To it was added
0.5 ml of 0.02 M phosphate Na2EDTA (3 %) buffer and mixed by shaking. The mixture
thus obtained was subjected to extraction of 5,7-dichloroquinolin-8-ol and 5-
chloroquinolin-8-ol by adding 20 ml of ethyl acetate and vortexing for three min. The
mixture was then centrifuged (Eppendorf Centrifuge 5810R, Germany; fixed angle rotor)
at 10,000 rpm for 5 min and the supernatant (organic phase) obtained was transferred into

56
50 ml glass stoppered test tubes. The extraction procedure was repeated with 10 ml ethyl
acetate to harvest 5,7-dichloroquinolin-8-ol and 5-chloroquinolin-8-ol residues left out.
The pooled supernatant (organic fraction) was evaporated to dryness by using gentle
stream of nitrogen in water bath maintained at 50°C. The residues left behind were
immediately reconstituted with one milliliter of methanol. This solution was then filtered
through 0.45µm PVDF syringe driven membrane filter into an auto sampler vial and 20
µl of this solution was injected into HPLC through the attached auto sampler unit.
3.4 .5 Muscle
One hundred gram of breast muscle was taken and cut into two to three pieces,
later ground using household mixer grinder. Five gram of this ground muscle tissues were
transferred to a 50 ml polypropylene screw capped centrifuge tubes. To this three ml of
0.02 M phosphate disodium EDTA buffer (pH adjusted to 6.5) was added and mixed by
shaking, mixture was then homogenized with 20 ml of ethyl acetate using tissue
homogenizer (Heidolph Silent Crucher M, Germany; dispersion tool is 18 F/M) at 10,000
rpm for 30 seconds which was then centrifuged (Eppendorf Centrifuge 5810 R, Germany;
fixed angle rotor) at 10,000 rpm for five min. The supernatant was then transferred into
50 mL glass stoppered test tube. The extraction procedure was repeated with 10 ml ethyl
acetate and the supernatant was transferred in to same test tube. The pooled organic
fraction was evaporated to dryness in a stream of nitrogen under water bath maintained at
50°C. The residue left behind was immediately reconstituted with one milliliter of
methanol. This solution was then filtered through 0.45 µm PVDF syringe driven
membrane filters and 20 µl of this was injected into HPLC through auto sampler unit.
57
3.5 Construction of standard curve
3.5.1 Liver
Drug free liver samples were obtained after sacrificing healthy broiler birds for
standardization of extraction procedures and construction of standard curves for 5,7-
dichloroquinolin-8-ol and 5-chloroquinolin-8-ol in liver matrix. The calibration curves
were constructed in the range of 22 to 642 ng/mL as described above. The standard
curves were linear in the range of 22 to 642 ng /mL with r2value of 0.999 and limit of
quantification of 20 ng/mL for a gram of tissue for both the constituent molecules.
3.5.2 Kidney
Drug free kidney tissue samples were obtained after sacrificing healthy birds for
standardization of extraction procedures and construction of standard curve for 5,7-
dichloroquinolin-8-ol and 5-chloroquinolin-8-ol in kidney matrix. The calibration curves
were constructed in the range of 22 to 642 ng/ml. The standard curves were linear in the
range of 22 to 642 ng/ml with r2 value of 0.999 for both the spiked molecules. The limit
of quantification of 5,7-dichloroquinolin-8-ol and 5-chloroquinolin-8-ol was 20 ng/ml for
a gram of tissue.
3.5.3 Muscle
Drug free breast muscle samples were obtained after sacrificing healthy birds for
standardization of extraction procedures and construction of standard curve for 5,7-
dichloroquinolin-8-ol and 5-chloroquinolin-8-ol in breast muscle matrix. The calibration
curves were constructed in the range of 22to 642ng/ml. The standard curves were linear
58
in the range of 22 to 642 ng/ml with r2 value of 0.999 for both the spiked molecules. The
limit of quantification was 20 ng/ml for a gram of muscle tissue in both the cases.
All the standard curves generated for detection of 5,7-dichloroquinolin-8-ol and
and 5-chloroquinolin-8-ol in (i) liver, (ii) kidney and (iii) breast muscle tissues of broiler
chicken are shown in Fig. 5A and 5B.
3.6 Quantification
The standard curves for 5,7-dichloroquinolin-8-ol and 5-chloroquinolin-8-ol were
prepared by plotting peak areas (x-axis) against concentration (y-axis) of respective
molecules. The linear regression formula obtained from calibration curves were used to
derive unknown concentration of 5,7-dichloroquinolin-8-ol and 5-chloroquinolin-8-ol in
plasma and tissue samples respectively using the equation:
X = a'+b'Y
Where, X = dependent variable
a' = intercept
b' = regression coefficient ‘X’ upon ‘Y’
Y = independent variable (peak area)
3.6.1 Analytical recovery
Analytical recovery for the method adopted was studied by using external
standard technique. Briefly, recovery was determined by adding 5,7-dichloroquinolin-8-
ol and 5-chloroquinolin-8-ol to drug free tissues viz: liver, kidney and muscle (pre-
extraction spiking) and to a fluid obtained after extraction from drug free tissue (post-

59
extraction spiking) at three concentration levels of 20, 80 and 320 ng/ml. Tissue samples
were subjected to liquid–liquid extraction. Both pre-extraction and post-extraction spiked
plasma or tissue standards were analyzed as described above. Recovery was calculated as
ratio of peak areas obtained for pre-extraction spiked plasma or tissue standards and those
obtained for post-extraction spiked plasma or tissue standards. For each concentration
two determinants were made. Table 8A and 8B respectively depicts per cent recovery of
5,7-dichloroquinolin-8-ol and 5-chloroquinolin-8-ol from spiked plasma or liver, kidney
and breast muscle tissue samples.
Fig 5A: Standard curve generated for detection of 5,7-dichloroquinolin-8-ol in (i)
Liver, (ii) Kidney and (iii) breast muscle tissues of broiler chicken (n= 5)
(i) Liver
A= Area, B= Concentration
300000 350000 400000 450000 500000 550000 600000 650000 700000
50
100
150
200
250
300
350
400
450
B
A
B

60
(ii) Kidney
(iii) Breast muscle
0 2 0 0 0 0 4 0 0 0 0 6 0 0 0 0 8 0 0 0 00
2 0 0
4 0 0
6 0 0
8 0 0
Ar e a
Co
ncen
tra
tio
n n
g/g
0 20000 40000 60000 800000
200
400
600
800
Area
Co
nce
ntr
ati
on
ng
/g

61
Fig. 5B : Standard curve generated for detection of 5-chloroquinolin-8-ol in (i)
liver, (ii) kidney and (iii) breast muscle tissues of broiler chicken (n= 5)
(i) Liver
(ii) Kidney
0 20000 40000 60000 800000
200
400
600
800
Area
Co
nce
ntr
ati
on
ng
/g
0 20000 40000 60000 800000
200
400
600
800
Area
Co
nce
ntr
ati
on
ng
/g

62
(iii) Breast muscle
0 20000 40000 60000 800000
200
400
600
800
Area
Co
nce
ntr
ati
on
ng
/g

63
Table 8A: Percent recovery of 5,7-dichloroquinolin-8-ol from spiked (i) liver, (ii)
kidney and (iii) breast muscle tissue matrix
(i) Liver
Concentration spiked
(ng/g)
Concentration detected (mean±SE;
ng/g) Recovery %
20 14.44±0.35 72.20
80 60.92±0.86 76.15
320 298.14±2.85 93.17
Mean per cent recovery 85.5
(ii) Kidney
Concentration spiked
(ng/g)
Concentration detected
(mean±SE; ng/g) Recovery %
20 14.80±0.48 74.00
80 63.40±0.87 79.25
320 300.10±1.90 93.78
Mean per cent recovery 91.9
(iii) Breast muscle
Concentration spiked
(ng/g)
Concentration detected (mean±SE;
ng/g) Recovery %
20 15.0±0.35 75.00
80 70.00±1.0 87.50
320 309.40±1.85 96.69
Mean per cent recovery 87.64

64
Table 8B: Percent recovery of 5-chloroquinolin-8-ol from spiked (i) liver, (ii) kidney
and (iii) breast muscle tissue matrix
(i) Liver
Concentration spiked
(ng/g)
Concentration detected
(mean±SE; ng/g) Recovery %
20 16.84±0.68 84.20
80 70.15±0.97 87.69
320 308.40±2.61 96.38
Mean per cent recovery 90.56
(ii) Kidney
Concentration spiked
(ng/g)
Concentration detected
(mean±SE; ng/g) Recovery %
20 16.76±0.52 83.80
80 73.22±0.82 91.53
320 311.0±2.98 97.19
Mean per cent recovery 92.39
(iii) Breast muscle
Concentration spiked
(ng/g)
Concentration detected
(mean±SE; ng/g) Recovery %
20 15.67±0.44 78.35
80 73.05±1.15 91.31
320 312.4±2.67 97.62
Mean per cent recovery 89.28

65
3.7 Statistical analysis
All the experimental data obtained were expressed as mean±SE. The significant
differences between the means of two groups were determined by XCALIBUR, ORIGIN
PRO 8 analytical softwares, USA and ONE WAY ANOVA followed by Tukeys Multiple
Comparison Test.

RESULTS

IV. RESULTS
The results of various experiments carried using halquinol are described.
4.1 UV Spectroscopy:
The UV visible Spectra indicated that the solubility of halquinol when used in
solution form of 1mg/ml was found to be 100% in DMSO. Fold solubility of halquinol in
all these solvents was 5.7, 5.6, 5, 4.32, 5.53 and 1 for acetonitrile, ethanol,
dichloromethane, hexane, methanol, ethanol and water respectively. Six solvents were
used to determine the maximum solubility of halquinol. The maximum solubility of
halquinol was found in acetonitrile i.e, 5.7. Since the cytoxicity assay of DMSO was high
in animal healthy cells, it was not used in the present study. Thus, acetonitrile (LCMS
grade) was used throughout the experiment to dissolve halquinol for all the experimental
work as fold solubility of halquinol was maximum (5.7) in it.
4.1.1 Ultraviolet Visible Spectrum of 5,7-dichloroquinolin-8-ol
Ultraviolet visible spectrum of 5,7-dichloroquinolin-8-ol in acidic (0.1 N HCl)
alkaline (0.1N NaOH ) and neutral solvent systems are shown in Fig. 6. The maximum
ultraviolet absorption of 5,7-dichloroquinolin-8-ol was found 0.694 at 338.5 nm in
acetonitrile solvent system. The fold solubility of halquinol was highest in acetonitrile i.e,
5.7 among the all solvent systems used.
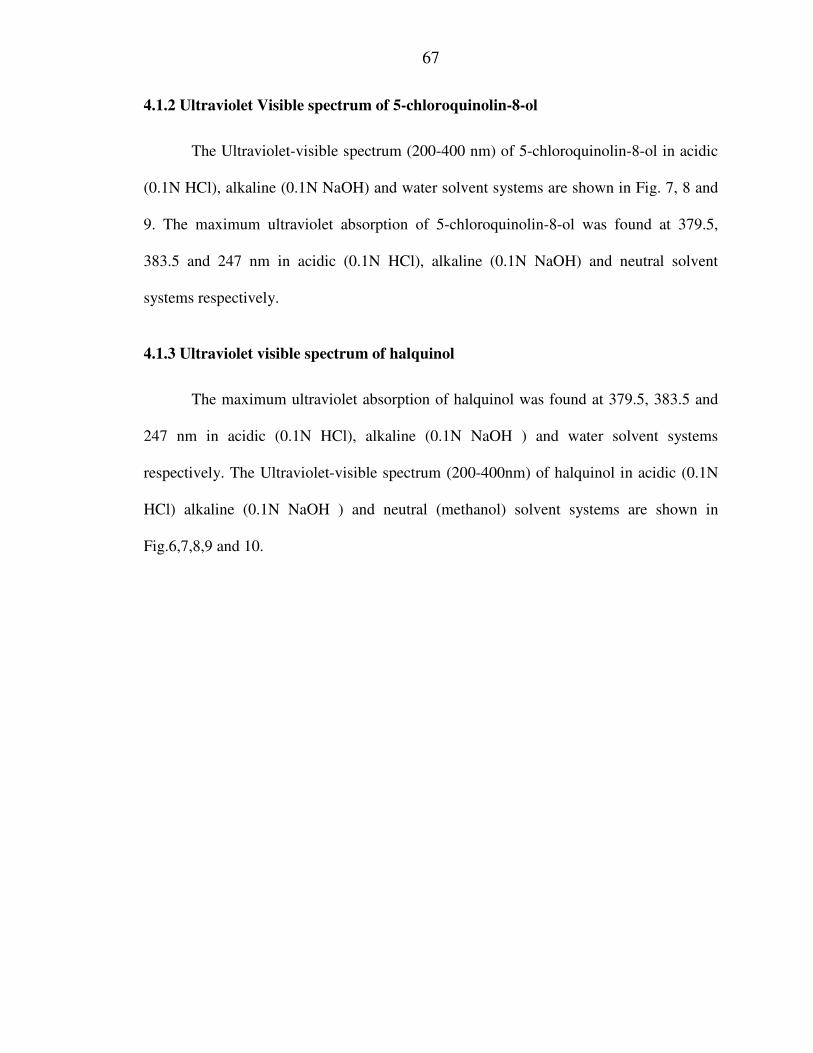
67
4.1.2 Ultraviolet Visible spectrum of 5-chloroquinolin-8-ol
The Ultraviolet-visible spectrum (200-400 nm) of 5-chloroquinolin-8-ol in acidic
(0.1N HCl), alkaline (0.1N NaOH) and water solvent systems are shown in Fig. 7, 8 and
9. The maximum ultraviolet absorption of 5-chloroquinolin-8-ol was found at 379.5,
383.5 and 247 nm in acidic (0.1N HCl), alkaline (0.1N NaOH) and neutral solvent
systems respectively.
4.1.3 Ultraviolet visible spectrum of halquinol
The maximum ultraviolet absorption of halquinol was found at 379.5, 383.5 and
247 nm in acidic (0.1N HCl), alkaline (0.1N NaOH ) and water solvent systems
respectively. The Ultraviolet-visible spectrum (200-400nm) of halquinol in acidic (0.1N
HCl) alkaline (0.1N NaOH ) and neutral (methanol) solvent systems are shown in
Fig.6,7,8,9 and 10.
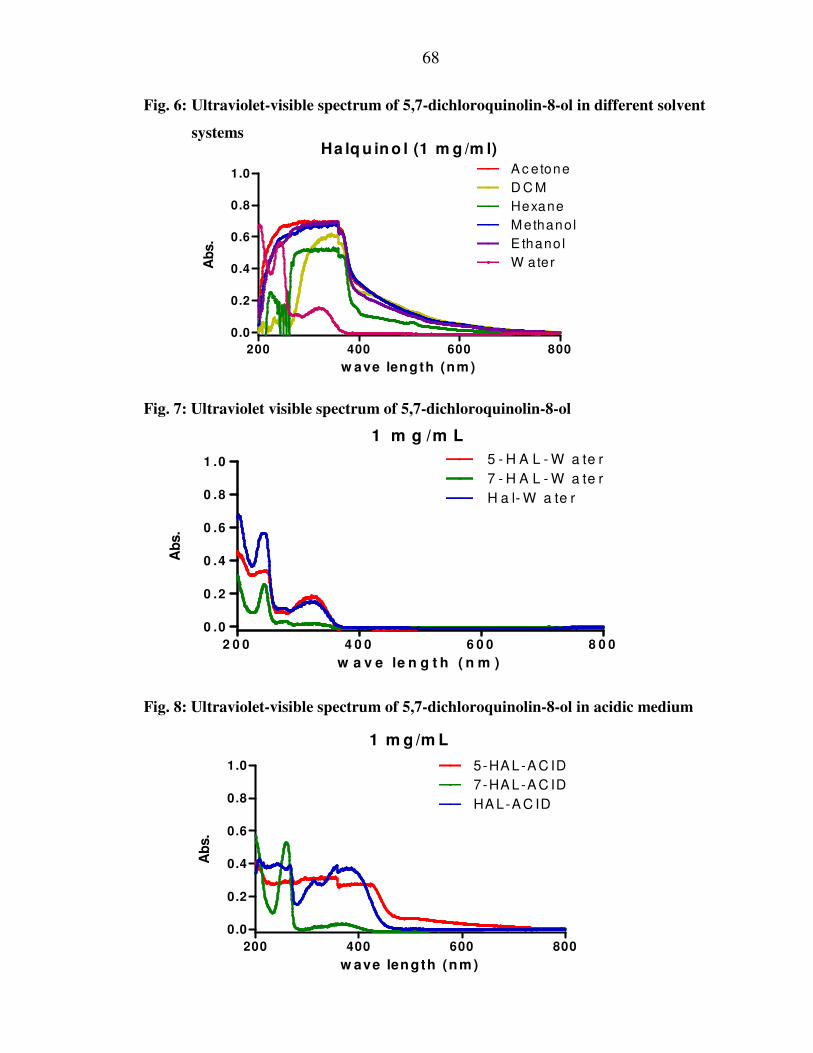
68
Fig. 6: Ultraviolet-visible spectrum of 5,7-dichloroquinolin-8-ol in different solvent
systems
Fig. 7: Ultraviolet visible spectrum of 5,7-dichloroquinolin-8-ol
Fig. 8: Ultraviolet-visible spectrum of 5,7-dichloroquinolin-8-ol in acidic medium
Ha lq u in o l (1 m g /m l)
200 400 600 800
0.0
0.2
0.4
0.6
0.8
1.0 A c etone
D C M
Hexane
Methanol
E thano l
W ater
w ave length (nm )
Ab
s.
1 m g /m L
2 0 0 4 0 0 6 0 0 8 0 0
0 .0
0 .2
0 .4
0 .6
0 .8
1 .0 5 - H A L - W a te r
7 - H A L - W a te r
H a l- W a te r
w a v e le n g t h ( n m )
Ab
s.
1 m g /m L
200 400 600 800
0.0
0.2
0.4
0.6
0.8
1.0 5-HA L-A C ID
7-HA L-A C ID
HA L-A C ID
w ave length (nm )
Ab
s.

69
Fig. 9. Ultraviolet-visible spectrum of 5,7-dichloroquinolin-8-ol in basic medium
Fig. 10. Ultraviolet-visible spectrum of 5,7-dichloroquinolin-8-ol in DMSO
1 m g/m L
200 400 600 800
0.0
0.2
0.4
0.6
0.8
1.0 5-HAL-Base
7-HAL-Base
HAL-Base
w ave length (nm)
Ab
s.
1 m g/m L
200 400 600 800
0.0
0.2
0.4
0.6
0.8
1.0 5-HAL-DMSO
7-HAL-DMSO
HAL-DMSO
w ave length (nm)
Ab
s.

70
4.2 IR Spectroscopy:
Samples were prepared in acetonitrile (1 mg/ml) and run on FTIR Nicolet 6700
(Thermo Fisher Scientific, Madisson, WI, USA) operated by Omnic software
8.1.spectroscope. Data was analyzed by describing various vibrational bands appeared in
spectra because of the chemical nature of the halquinol and its constituents. The infrared
spectra of (Halquinol 5,7) is shown in Fig. 11,12 and 13 respectively. The principal wave
numbers obtained in infrared spectrum and their corresponding assignment (bond,
compound type and functional groups) were characteristic for 5,7-dichloroquinolin-8-ol
as mentioned below:
Fig 11: IR Spectrum of 5,7-dichloroquinolin-8-ol.
X axis =Wavenumbers
Y axis=Percentage Transmittance
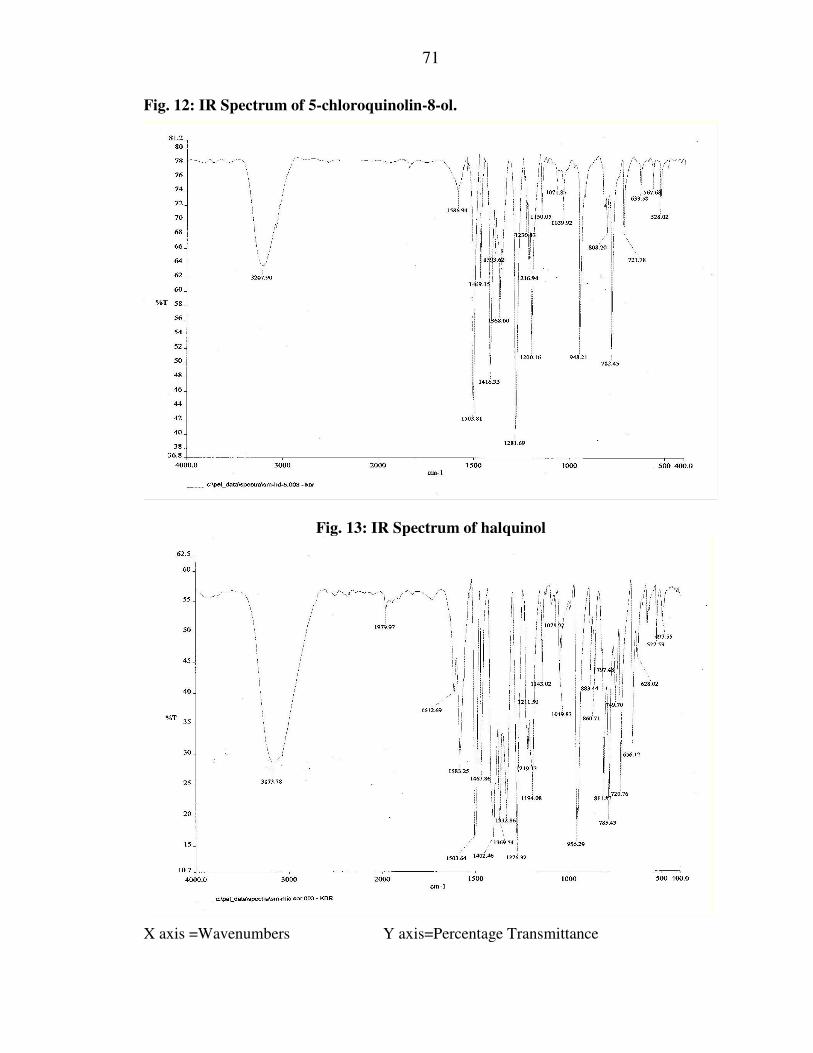
71
Fig. 12: IR Spectrum of 5-chloroquinolin-8-ol.
Fig. 13: IR Spectrum of halquinol
X axis =Wavenumbers Y axis=Percentage Transmittance

72
Table 9: The principal wave numbers obtained in infrared spectrum and their
corresponding assignment (bond, compound type and functional group)
were characteristic for 5-chloro-8-quinolinol
Wave number(cm-1
)
KBr disk Characteristics Assignment of wave numbers
3207.90 mb O-H stretch, particularly of phenols
1586.94 wb C=C stretching (aromatic)
1503.81 s C=N stretching (aromatic)
1469.15 ms C=C stretching(aromatic)
1416.33 s C=C stretching(aromatic)
1368 ms(poor) C-O stretching(phenolic)
1281.69 st s C-H stretching(in plane bending)
1200.16 s C-O stretching(phenolic)
1216.94 s C-H stretching(in plane bending)
1150.05 ws C-H stretching(in plane bending)
1071.87 w C-Cl stretching, C-H stretching(in plane bending)
1039.92 ws C-H stretching(in plane bending)
948.21 s C-O stretching(phenolic)
808.20 w C=C stretching(aromatic)
782.45 s C-H stretching(in plane bending)
721.78 ws C-Cl stretching, C-H stretching(in plane bending)
633.58 sts C=C stretching(aromatic)
567.68 ws C-O stretching(phenolic)
528.08 st C-O stretching(phenolic)

73
Table 10: The principal wave numbers obtained in infrared spectrum and their
corresponding assignment (bond, compound type and functional group)
were characteristic for 5,7-dichloroquinolin 8-ol
Wave number(cm-1
) KBr
disk Characteristics Assignment of wave numbers
3586.51 wb O-H stretch, particularly of phenols
3075.86 sb C- H stretching (aromatic)
1964.77 s C=C stretching (conjugated)
1745.72 ws C=C stretching(aromatic)
1588.20 s C=C stretching(aromatic)
1492.44 ms(poor)
C=C stretching(phenolic),C=N stretching
1392.52 st s C-O stretching(in plane bending)
1371.87,1376.26,1275.51 s C-O stretching(phenolic)
1230.64 s C-H stretching(in plane bending)
1194.67 ws C-H stretching(in plane bending)
1142.97 w C-Cl stretching, C-H stretching(in plane bending)
1050.09 ws C-H stretching(in plane bending)
957.99 s C-O stretching(phenolic)
882.87 ms C=C stretching(aromatic)
812.06 s C-H stretching(in plane bending)
786.46 ws C-H stretching(in plane bending)
743.31 sts C=C stretching(aromatic)
721.70 ws C-O stretching(phenolic)
656.94 st C-O stretching(phenolic)
578.99 - C-H out of plane bending

74
Table 11: The principal wave numbers obtained in infrared spectrum and their
corresponding assignment (bond, compound type and functional group)
were characteristic for halquinol
Wave number
(cm-1
) KBr disk Characteristics Assignment of wave numbers
3173.78 mb O-H stretch, particularly of phenols
1979.97 wb C=C stretching (aromatic)
1612.69 s C=N stretching (aromatic)
1503.64 ms C=C stretching(aromatic)
1467.86 s C=C stretching(aromatic)
1402.46 ms(poor) C-O stretching(phenolic)
1369.54 st s C-H stretching(in plane bending)
1332.86 s C-O stretching(phenolic)
1219.13 s C-H stretching(in plane bending)
1194.08 ws C-H stretching(in plane bending)
1143..02 w C-Cl stretching, C-H stretching(in plane bending)
1071.92 ws C-H stretching(in plane bending),C-Cl stretching
1049.83 s C-O stretching(phenolic)
956.29 w C=C stretching(aromatic)
883.44 s C-H stretching(in plane bending)
860.71 ws C-Cl stretching, C-H stretching(in plane bending)
811.87 sts C=C stretching(aromatic)
785.43 ws C-O stretching(phenolic)
749.70 st C-O stretching(phenolic)
720.76 w ------
656.12 b ------

75
4.3 NMR Spectroscopy: 1H-NMR of 5-chloro-8-quinolinol (δ)
7.08 (1H; H next to C-OH); 7.24 (for CDCl3); 7.53-7.56 (2H; 1H next to C-Cl and
1H second next N); 8.52 (1H; H second next to C-Cl); 8.81 (1H; H next to N). NMR data
revealed the satisfactory purity of the compound 5-chloro-8-quinolinol Fig.14 (Spectra
14)
Fig. 14. 1H-NMR Spectrum of 5-chloro-8-quinolinol
N
OH
Cl
7.08
7.54 7.56
8.52
8.81
X axis =Chemical Shift
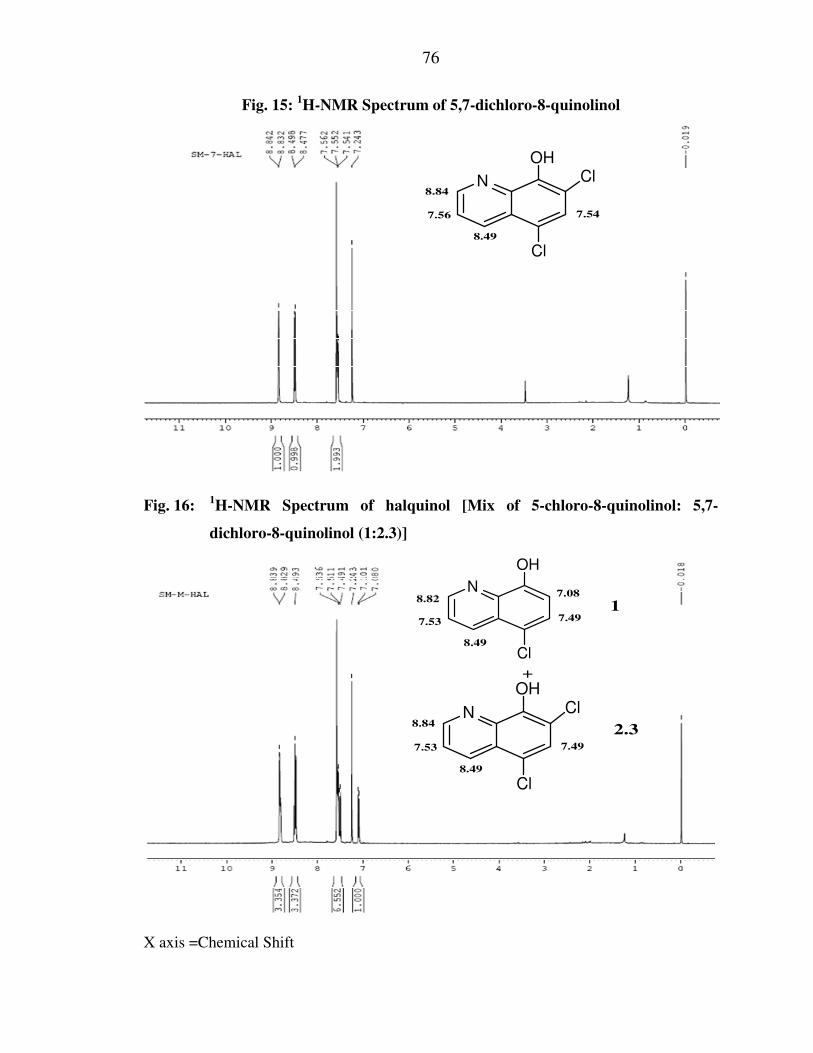
76
Fig. 15: 1H-NMR Spectrum of 5,7-dichloro-8-quinolinol
N
OHCl
Cl8.49
8.84
7.56 7.54
Fig. 16: 1H-NMR Spectrum of halquinol [Mix of 5-chloro-8-quinolinol: 5,7-
dichloro-8-quinolinol (1:2.3)]
N
OH
Cl
7.08
7.49 7.53
8.49
8.82
N
OHCl
Cl8.49
8.84
7.53 7.49
+
1
2.3
X axis =Chemical Shift

77
Fig. 17: 13
C-NMR Spectrum of 5-chloro-8-quinolinol
Fig. 18: 13
C-NMR Spectrum of 5,7-dichloro-8-quinolinol
X axis =Chemical Shift
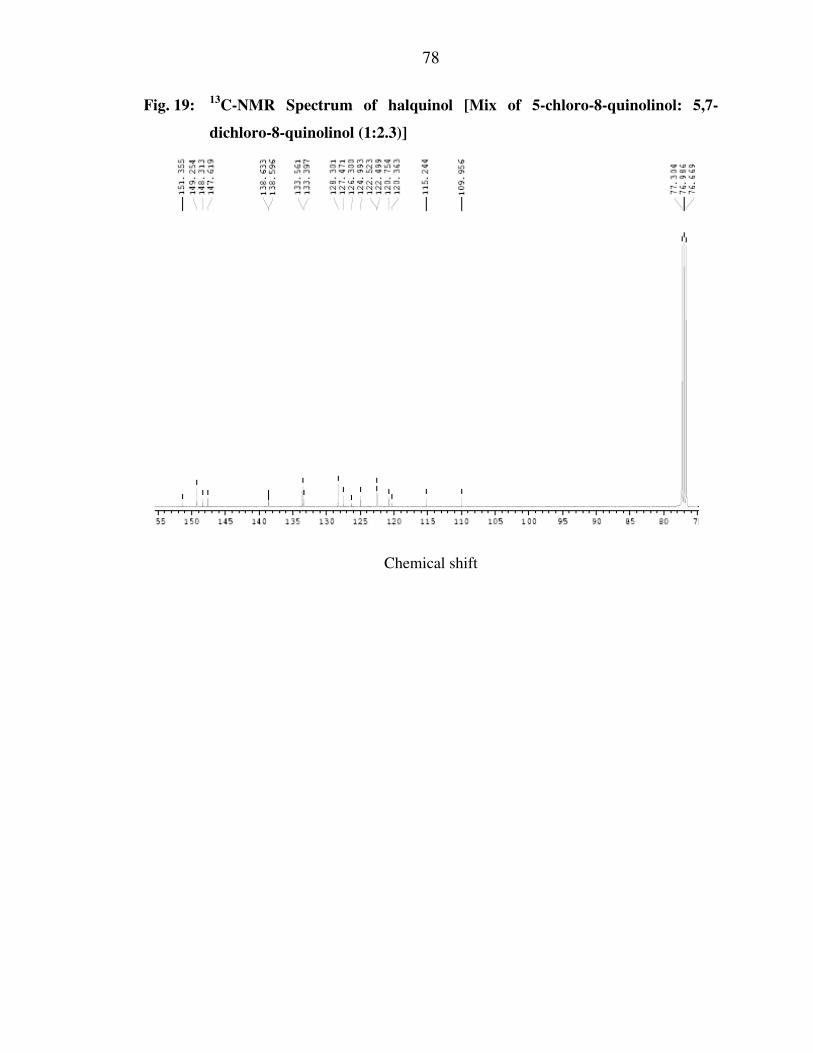
78
Fig. 19: 13
C-NMR Spectrum of halquinol [Mix of 5-chloro-8-quinolinol: 5,7-
dichloro-8-quinolinol (1:2.3)]
Chemical shift
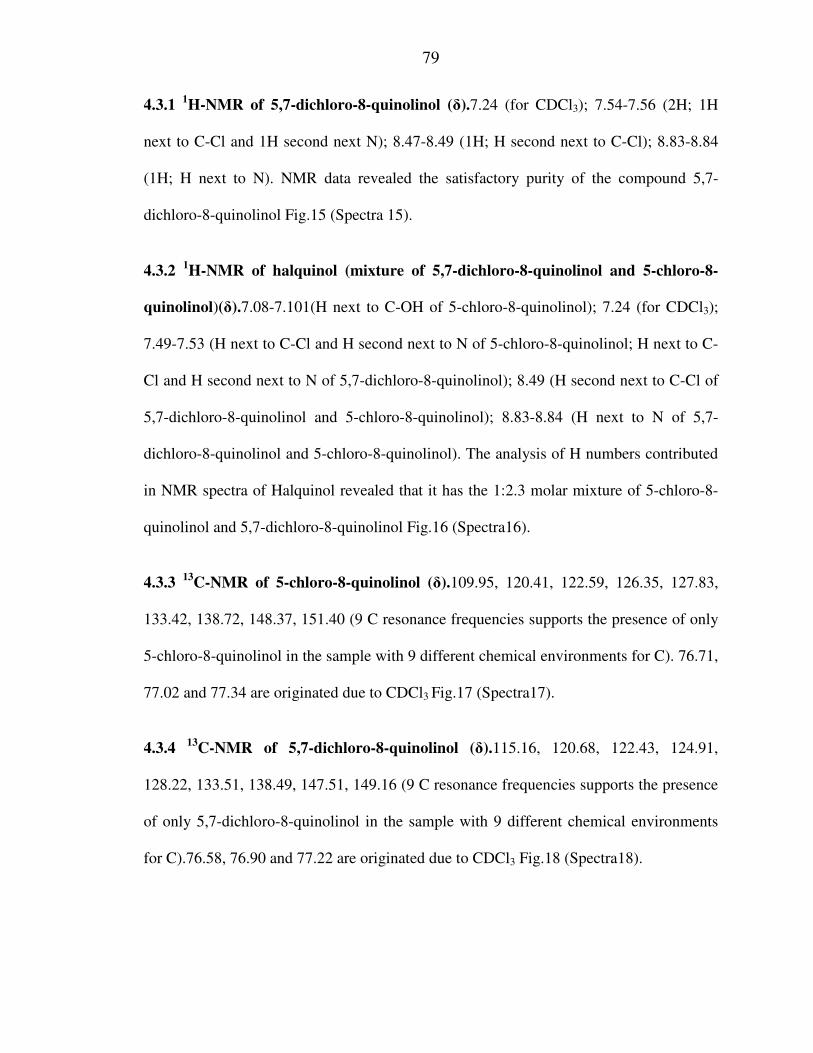
79
4.3.1 1H-NMR of 5,7-dichloro-8-quinolinol (δ).7.24 (for CDCl3); 7.54-7.56 (2H; 1H
next to C-Cl and 1H second next N); 8.47-8.49 (1H; H second next to C-Cl); 8.83-8.84
(1H; H next to N). NMR data revealed the satisfactory purity of the compound 5,7-
dichloro-8-quinolinol Fig.15 (Spectra 15).
4.3.2 1H-NMR of halquinol (mixture of 5,7-dichloro-8-quinolinol and 5-chloro-8-
quinolinol)(δ).7.08-7.101(H next to C-OH of 5-chloro-8-quinolinol); 7.24 (for CDCl3);
7.49-7.53 (H next to C-Cl and H second next to N of 5-chloro-8-quinolinol; H next to C-
Cl and H second next to N of 5,7-dichloro-8-quinolinol); 8.49 (H second next to C-Cl of
5,7-dichloro-8-quinolinol and 5-chloro-8-quinolinol); 8.83-8.84 (H next to N of 5,7-
dichloro-8-quinolinol and 5-chloro-8-quinolinol). The analysis of H numbers contributed
in NMR spectra of Halquinol revealed that it has the 1:2.3 molar mixture of 5-chloro-8-
quinolinol and 5,7-dichloro-8-quinolinol Fig.16 (Spectra16).
4.3.3 13
C-NMR of 5-chloro-8-quinolinol (δ).109.95, 120.41, 122.59, 126.35, 127.83,
133.42, 138.72, 148.37, 151.40 (9 C resonance frequencies supports the presence of only
5-chloro-8-quinolinol in the sample with 9 different chemical environments for C). 76.71,
77.02 and 77.34 are originated due to CDCl3 Fig.17 (Spectra17).
4.3.4 13
C-NMR of 5,7-dichloro-8-quinolinol (δ).115.16, 120.68, 122.43, 124.91,
128.22, 133.51, 138.49, 147.51, 149.16 (9 C resonance frequencies supports the presence
of only 5,7-dichloro-8-quinolinol in the sample with 9 different chemical environments
for C).76.58, 76.90 and 77.22 are originated due to CDCl3 Fig.18 (Spectra18).

80
4.3.5 13
C-NMR of halquinol (mixture of 5,7-dichloro-8-quinolinol and 5-chloro-8-
quinolinol)(δ).109.95, 115.24,120.36, 120.75, 122.49, 122.52, 124.99, 126.30, 127.47,
128.30, 133.39, 133.56, 138.59, 138.63, 147.61, 148.31, 149.25, 151.35 (18 C resonance
frequencies supports the presence of 5,7-dichloro-8-quinolinolwith 9 different chemical
environments for C and 5-chloro-8-quinolinolin the sample with 9 other different
chemical environments for C). 76.66, 76.98 and 77.30 are originated due to CDCl3 Fig.19
(Spectra19).
4.4 LCMS
The liquid chromatography mass spectroscopy (LCMS) assay system
standardized for 5,7-dichloroquinolin-8-ol and 5-chloroquinolin-8-ol was used to
quantify the constituent molecules of halquinol and its metabolites in tissue samples in
the present study. 5,7-dichloroquinolin-8-ol or 5-chloroquinolin-8-ol, were absent in
tissue samples (viz:liver and breast muscle) of control group (C) collected at each
sacrificing intervals in birds throughout the experimental period, upon LCMS analysis.
Thus, the chances of any contamination of halquinol by feed or water was eliminated.
NMR and IR revealed the purity and molecular characterization of halquinol and its
metabolites respectively. The metabolites were conjugated forms of quinoline compounds
viz., 5-chloro-quinolin-8-ol sulfate,5-chloro-quinolin-8-ol glucuronide, 5,7, dichloro-
quinolin-8-ol sulfate and 5,7, dichloro-quinolin-8-ol glucuronide. The LCMS graphs of
the various tissue samples of all the test groups are depicted in Fig 20 to 37.

81
Fig. 20: MS graph of 5HAL standard
5HAL:
RT: 0.00 - 40.00
0 5 10 15 20 25 30 35 40
Time (min)
0
20000
40000
60000
80000
100000
120000
140000
160000
180000
200000
220000
240000
260000
uA
U9.21
33.4916.855.33 18.56 22.12 24.07 26.584.261.79 28.67
NL:2.66E5
Total Scan PDA 5HAL
5HAL #722-884 RT: 8.70-10.58 AV: 163 NL: 9.69E6F: + c ESI Full ms [200.00-680.00]
200 250 300 350 400 450 500 550
m/z
0
1000000
2000000
3000000
4000000
5000000
6000000
7000000
8000000
9000000
Inte
ns
ity
453.16
221.09490.05 522.83
471.07318.44279.42 444.70 516.52424.36391.38 536.33 550.82368.73229.49 351.43
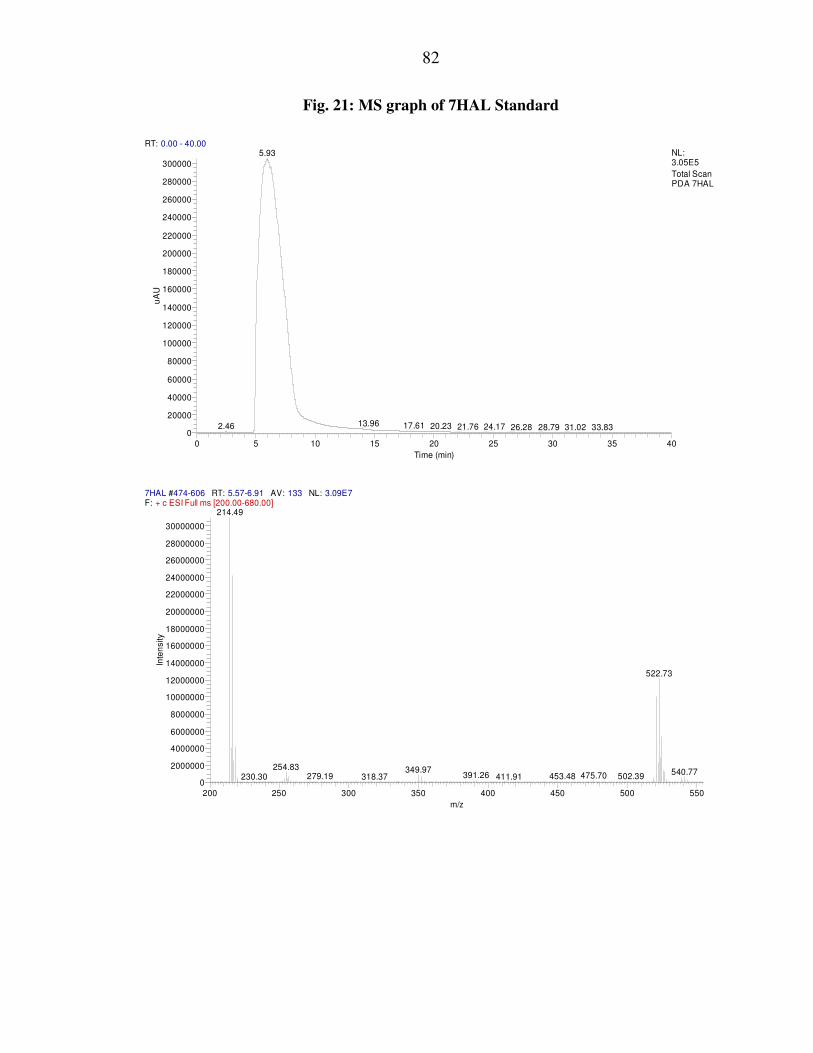
82
Fig. 21: MS graph of 7HAL Standard
RT: 0.00 - 40.00
0 5 10 15 20 25 30 35 40
Time (min)
0
20000
40000
60000
80000
100000
120000
140000
160000
180000
200000
220000
240000
260000
280000
300000u
AU
5.93
13.96 17.61 20.232.46 21.76 24.17 26.28 28.79 31.02 33.83
NL:3.05E5
Total Scan PDA 7HAL
7HAL #474-606 RT: 5.57-6.91 AV: 133 NL: 3.09E7F: + c ESI Full ms [200.00-680.00]
200 250 300 350 400 450 500 550
m/z
0
2000000
4000000
6000000
8000000
10000000
12000000
14000000
16000000
18000000
20000000
22000000
24000000
26000000
28000000
30000000
Inte
nsity
214.49
522.73
254.83 349.97 540.77391.26 475.70 502.39453.48279.19230.30 318.37 411.91

83
Fig. 22: MS graph of chicken liver tissue samples (T1)
RT: 4.69 - 15.56
5 6 7 8 9 10 11 12 13 14 15
Time (min)
0
5000
10000
15000
20000
25000
30000
35000
uA
U8.47
7.82
6.00
5.63
9.18
4.95
6.537.12
10.44
11.72 13.12
NL:3.79E4
Total Scan PDA T2B1

84
Fig.23: MS graph of chicken breast tissue samples (T2)
RT: 5.16 - 11.78
5.5 6.0 6.5 7.0 7.5 8.0 8.5 9.0 9.5 10.0 10.5 11.0 11.5
Time (min)
0
2000
4000
6000
8000
10000
12000
14000
16000
18000
20000
22000
24000
26000
28000
30000
32000
uA
U
RT: 6.01
8.47
7.83
5.63
9.18
6.51
9.91
10.90
11.59
NL:3.37E4
Total Scan PDA T2B2
T2B2 #132-136 RT: 5.92-6.10 AV: 3 NL: 3.41E4F: + p ESI Full ms [100.00-1500.00]
250 300 350 400 450 500
m/z
0
2000
4000
6000
8000
10000
12000
14000
16000
18000
20000
22000
24000
26000
28000
30000
32000
34000
Inte
nsity
480.13453.93
342.67
474.93
522.27493.87372.47 435.80
356.87
540.60507.27386.53331.80
311.93413.67
279.80409.00
243.33395.47298.60
267.67
250.27
85
Fig. 24: MS graph of chicken liver tissue samples (T3)
RT: 6.37 - 13.59
7 8 9 10 11 12 13
Time (min)
25000
30000
35000
40000
45000
50000
55000
60000
65000
70000
75000
80000u
AU
RT: 9.15
7.81
8.47
6.76 10.4910.01
9.62 11.41
12.39
NL:8.23E4
Total Scan PDA T2L1
T2L1 #203-206 RT: 9.08-9.17 AV: 2 NL: 1.82E5F: + p ESI Full ms [100.00-1500.00]
250 300 350 400 450 500 550
m/z
0
20000
40000
60000
80000
100000
120000
140000
160000
180000
Inte
nsity
522.60
539.00
497.60
552.20
326.87294.80 493.33
463.93209.40 403.87262.47 476.73
247.67 329.60426.07 450.20380.07314.60
364.60283.53236.07
221.20

86
Fig.25: MS graph of chicken breast tissue samples (T3)
RT: 7.10 - 12.72
7.5 8.0 8.5 9.0 9.5 10.0 10.5 11.0 11.5 12.0 12.5
Time (min)
20000
25000
30000
35000
40000
45000
50000
55000
60000
65000
70000u
AU
RT: 9.16
7.83 8.49
10.0210.53
9.6111.46
7.28
12.39
NL:7.18E4
Total Scan PDA T2Liver2
T2Liver2 #203-208 RT: 9.08-9.25 AV: 3 NL: 1.18E5F: + p ESI Full ms [100.00-1500.00]
250 300 350 400 450 500 550
m/z
0
10000
20000
30000
40000
50000
60000
70000
80000
90000
100000
110000
Inte
nsity
521.67
538.87
568.07
291.67517.40247.47
479.40495.47394.13 456.07262.87
417.67
346.27324.93355.00276.20 306.73
217.80

87
Fig. 26: MS graph of chicken liver tissue samples (T1)
T2Liver2 #81-99 RT: 3.63-4.32 AV: 9 NL: 2.10E5F: + p ESI Full ms [100.00-1500.00]
250 300 350 400 450 500 550
m/z
0
20000
40000
60000
80000
100000
120000
140000
160000
180000
200000
Inte
nsity
409.60
441.60
455.73387.80
423.60
569.87503.73 520.73467.60
486.00 565.87373.40
341.80283.47
301.73329.80
311.20251.40
223.07

88
Fig. 27: MS graph of chicken breast tissue samples (T2)
T2Liver3 #87-90 RT: 3.91-4.00 AV: 2 NL: 4.86E5F: + p ESI Full ms [100.00-1500.00]
250 300 350 400 450 500
m/z
0
50000
100000
150000
200000
250000
300000
350000
400000
450000
Inte
nsity
387.47 409.73
455.80418.73
441.53425.80
461.67 491.67509.47
477.67
226.07 384.40303.60 330.40283.40 356.20
267.53237.53251.33
RT: 0.00 - 15.05
0 1 2 3 4 5 6 7 8 9 10 11 12 13 14 15
Time (min)
0
20000
40000
60000
80000
100000
120000
140000
160000
180000
200000
220000
240000
260000
280000
300000
uA
U
RT: 3.93
4.14
3.55
8.492.097.84
6.015.649.20
6.5710.90 11.59 13.13 13.570.16 1.57
NL:3.05E5
Total Scan PDA T3B

89
Fig. 28: MS graph of chicken liver samples (T3)
T3B #90-95 RT: 4.03-4.21 AV: 3 NL: 4.27E5F: + p ESI Full ms [100.00-1500.00]
150 200 250 300 350 400 450 500
m/z
0
50000
100000
150000
200000
250000
300000
350000
400000
Inte
nsity
409.67
105.13 441.53
425.73
387.80
123.33
513.73500.47469.67
137.33369.40
267.93181.47 305.80 341.40232.53
211.33165.27
RT: 4.82 - 10.60
5.0 5.5 6.0 6.5 7.0 7.5 8.0 8.5 9.0 9.5 10.0 10.5
Time (min)
0
5000
10000
15000
20000
25000
30000
35000
uA
U
RT: 5.64
8.49
7.84
6.01
9.204.96
6.57
7.11
NL:3.96E4
Total Scan PDA T3B

90
Fig. 29: MS graph of chicken breast tissue samples (T1)
T3B #125 RT: 5.65 AV: 1 NL: 7.21E4F: + p ESI Full ms [100.00-1500.00]
260 280 300 320 340 360 380 400 420 440 460
m/z
0
5000
10000
15000
20000
25000
30000
35000
40000
45000
50000
55000
60000
65000
70000
Inte
nsity
454.33
447.53
433.33
343.27
387.73
302.53 407.20472.07
311.27 352.47
359.80 399.53381.73326.80290.73
429.80
417.47379.60255.60 319.73283.60
RT: 0.00 - 17.59
0 2 4 6 8 10 12 14 16
Time (min)
0
50000
100000
150000
200000
250000
300000
350000
uA
U
RT: 3.82
3.68
4.33
8.00 8.75
5.76
4.90
7.033.021.93 9.41 10.53 16.191.15 10.95 13.22
NL:3.74E5
Total Scan PDA T2_B_without
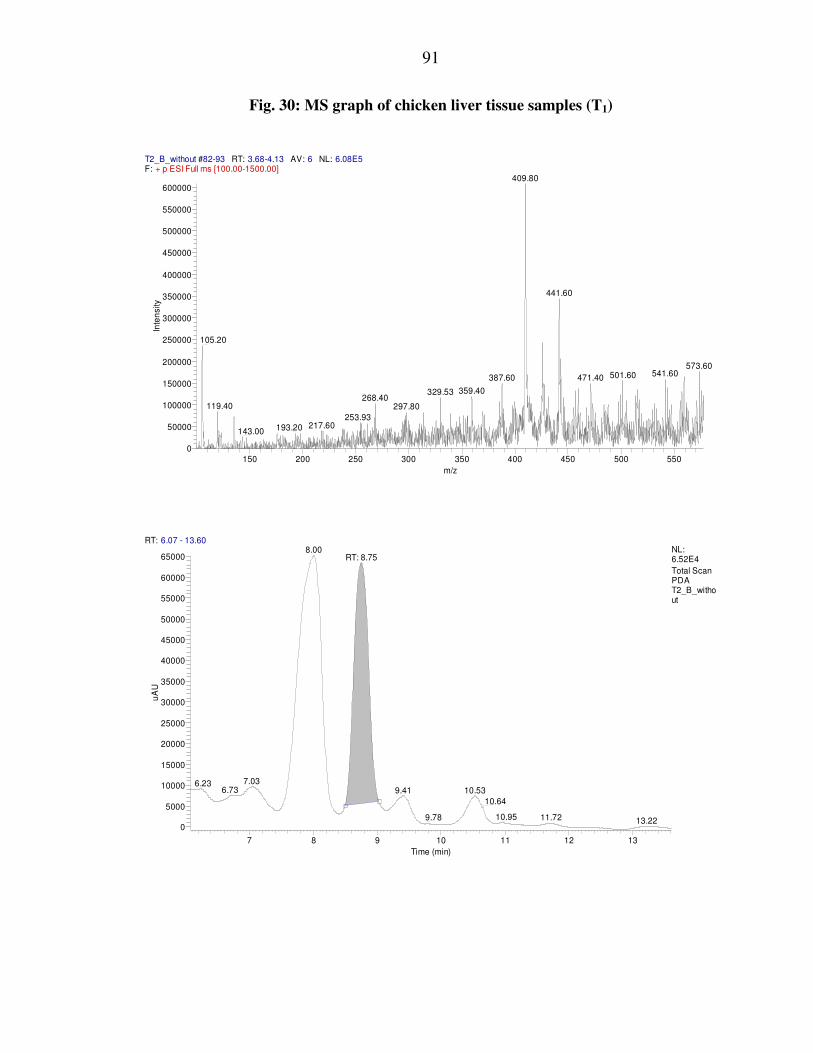
91
Fig. 30: MS graph of chicken liver tissue samples (T1)
T2_B_without #82-93 RT: 3.68-4.13 AV: 6 NL: 6.08E5F: + p ESI Full ms [100.00-1500.00]
150 200 250 300 350 400 450 500 550
m/z
0
50000
100000
150000
200000
250000
300000
350000
400000
450000
500000
550000
600000
Inte
nsity
409.80
441.60
105.20
573.60541.60501.60471.40387.60
359.40329.53268.40
119.40 297.80
253.93217.60193.20143.00
RT: 6.07 - 13.60
7 8 9 10 11 12 13
Time (min)
0
5000
10000
15000
20000
25000
30000
35000
40000
45000
50000
55000
60000
65000
uA
U
RT: 8.758.00
7.036.236.73 9.41 10.53
10.64
10.95 11.729.78 13.22
NL:6.52E4
Total Scan PDA T2_B_without
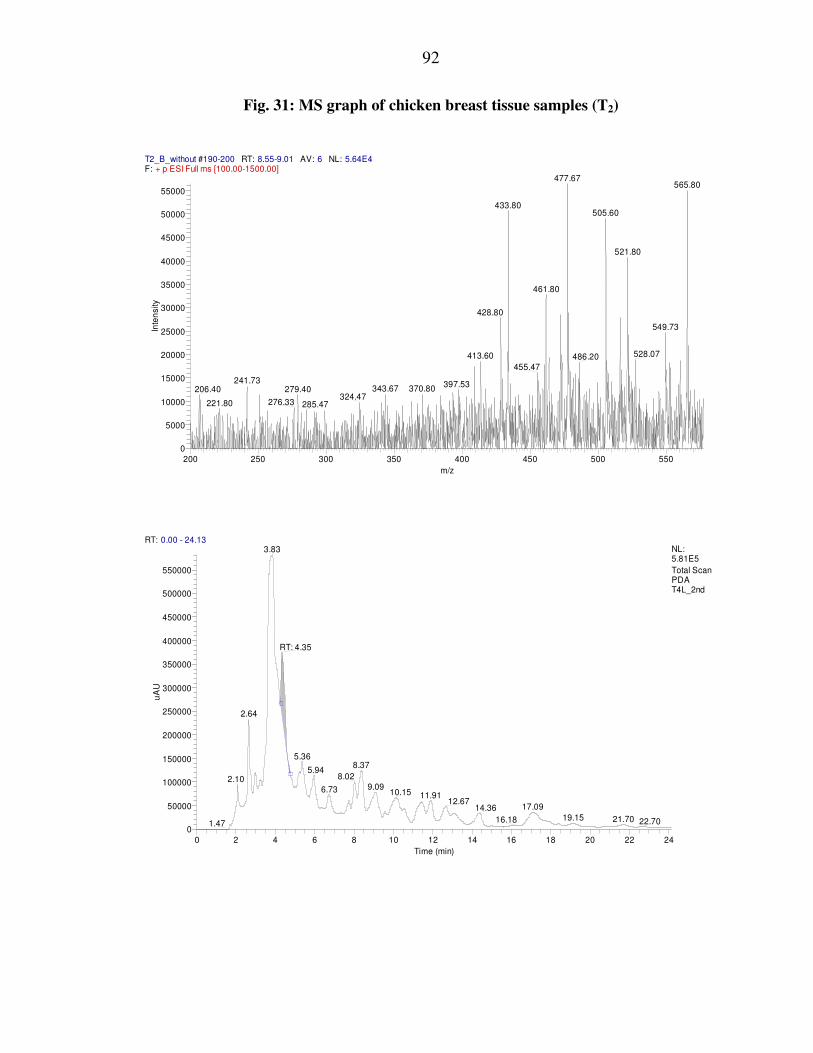
92
Fig. 31: MS graph of chicken breast tissue samples (T2)
T2_B_without #190-200 RT: 8.55-9.01 AV: 6 NL: 5.64E4F: + p ESI Full ms [100.00-1500.00]
200 250 300 350 400 450 500 550
m/z
0
5000
10000
15000
20000
25000
30000
35000
40000
45000
50000
55000
Inte
nsity
477.67565.80
433.80505.60
521.80
461.80
428.80
549.73
528.07413.60 486.20
455.47
241.73 397.53343.67 370.80279.40206.40
324.47276.33221.80 285.47
RT: 0.00 - 24.13
0 2 4 6 8 10 12 14 16 18 20 22 24
Time (min)
0
50000
100000
150000
200000
250000
300000
350000
400000
450000
500000
550000
uA
U
RT: 4.35
3.83
2.64
5.368.37
5.948.022.10
9.096.73 10.15 11.9112.67
17.0914.3619.15 21.7016.18 22.701.47
NL:5.81E5
Total Scan PDA T4L_2nd
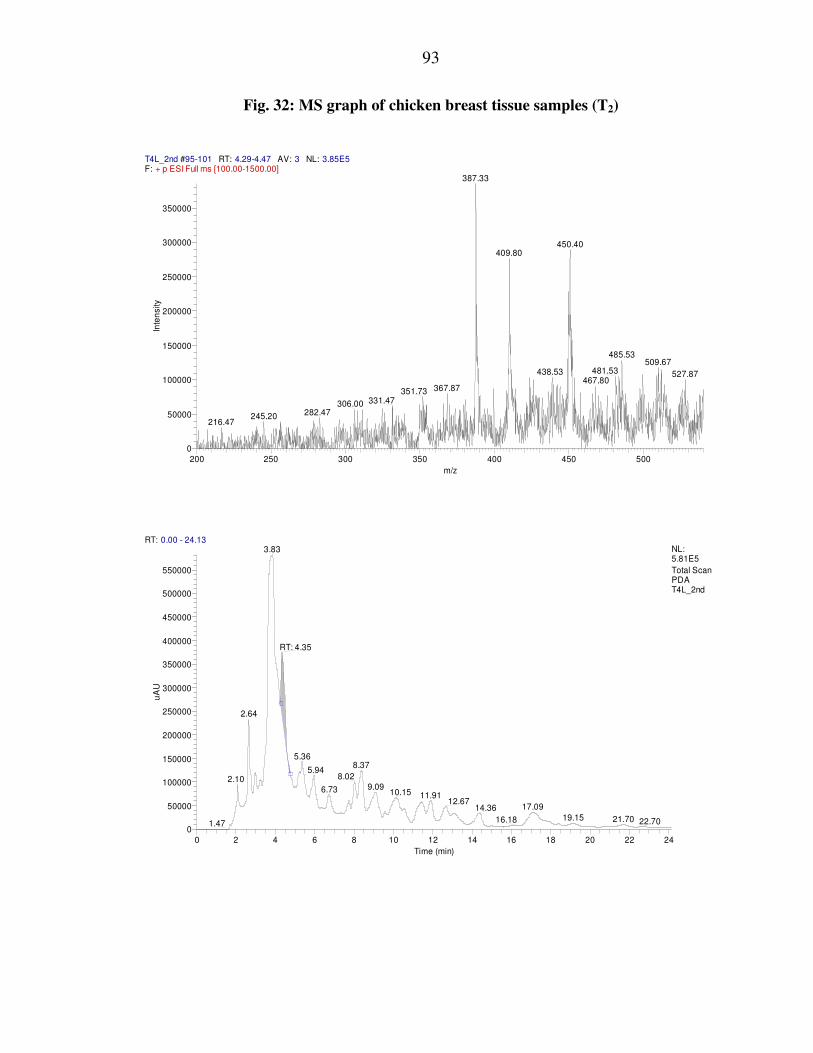
93
Fig. 32: MS graph of chicken breast tissue samples (T2)
T4L_2nd #95-101 RT: 4.29-4.47 AV: 3 NL: 3.85E5F: + p ESI Full ms [100.00-1500.00]
200 250 300 350 400 450 500
m/z
0
50000
100000
150000
200000
250000
300000
350000
Inte
nsity
387.33
450.40409.80
485.53509.67
481.53438.53 527.87467.80
367.87351.73331.47306.00
282.47245.20216.47
RT: 0.00 - 24.13
0 2 4 6 8 10 12 14 16 18 20 22 24
Time (min)
0
50000
100000
150000
200000
250000
300000
350000
400000
450000
500000
550000
uA
U
RT: 4.35
3.83
2.64
5.368.37
5.948.022.10
9.096.73 10.15 11.9112.67
17.0914.3619.15 21.7016.18 22.701.47
NL:5.81E5
Total Scan PDA T4L_2nd
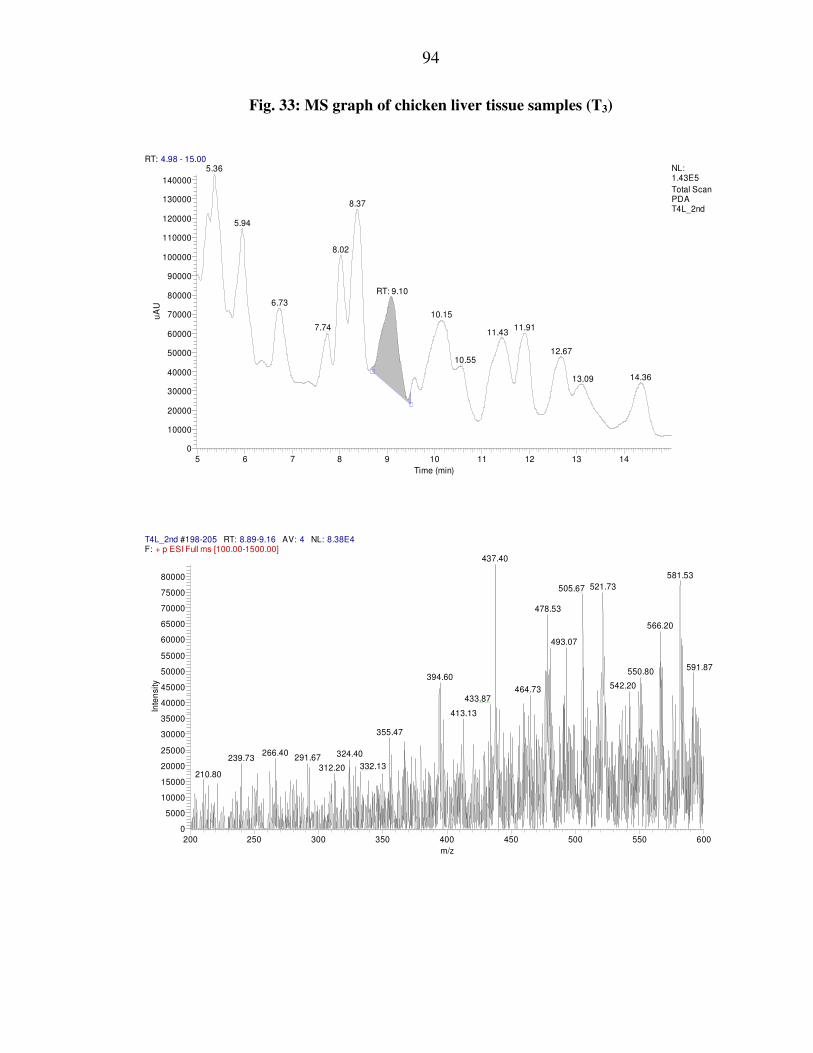
94
Fig. 33: MS graph of chicken liver tissue samples (T3)
RT: 4.98 - 15.00
5 6 7 8 9 10 11 12 13 14
Time (min)
0
10000
20000
30000
40000
50000
60000
70000
80000
90000
100000
110000
120000
130000
140000
uA
U
RT: 9.10
5.36
8.37
5.94
8.02
6.73
10.15
11.917.7411.43
12.6710.55
14.3613.09
NL:1.43E5
Total Scan PDA T4L_2nd
T4L_2nd #198-205 RT: 8.89-9.16 AV: 4 NL: 8.38E4F: + p ESI Full ms [100.00-1500.00]
200 250 300 350 400 450 500 550 600
m/z
0
5000
10000
15000
20000
25000
30000
35000
40000
45000
50000
55000
60000
65000
70000
75000
80000
Inte
nsity
437.40
581.53
521.73505.67
478.53
566.20
493.07
591.87550.80
394.60542.20464.73
433.87
413.13
355.47
266.40 324.40291.67239.73332.13312.20
210.80

95
Fig. 34: MS graph of chicken liver tissue samples (T3)
RT: 0.00 - 15.10
0 1 2 3 4 5 6 7 8 9 10 11 12 13 14 15
Time (min)
0
50000
100000
150000
200000
250000
300000
350000
400000
uA
U
RT: 3.87
4.13
8.345.972.15
4.95 9.11 10.1111.45
7.362.340.04
NL:4.04E5
Total Scan PDA T1B
T1B #90-97 RT: 4.03-4.29 AV: 4 NL: 6.38E5F: + p ESI Full ms [100.00-1500.00]
200 250 300 350 400 450 500 550 600
m/z
0
50000
100000
150000
200000
250000
300000
350000
400000
450000
500000
550000
600000
Inte
nsity
409.53
441.33425.53
387.47
483.40 559.60513.47
543.33 587.73469.47269.33384.07313.27 329.47
291.13217.40241.13

96
Fig. 35: MS graph of chicken breast tissue samples (T1)
RT: 5.23 - 15.10
6 7 8 9 10 11 12 13 14 15
Time (min)
-10000
-5000
0
5000
10000
15000
20000
25000
30000
35000
40000
45000
50000
55000
60000
65000
70000
75000
uA
U
RT: 9.12
8.34
5.97
5.5210.11
11.45
7.367.07
NL:7.60E4
Total Scan PDA T1B
T1B #200-205 RT: 8.98-9.16 AV: 3 NL: 1.32E5F: + p ESI Full ms [100.00-1500.00]
280 300 320 340 360 380 400 420 440 460 480 500 520 540 560
m/z
0
10000
20000
30000
40000
50000
60000
70000
80000
90000
100000
110000
120000
130000
Inte
nsity
521.87
557.53
393.53
479.67 546.67292.07 429.27353.40 499.13531.67433.87 466.93
285.00335.13 409.67
311.20
327.47 380.00
376.33

97
Fig. 36: MS graph of chicken liver tissue samples (T1)
RT: 0.00 - 16.77
0 2 4 6 8 10 12 14 16
Time (min)
0
50000
100000
150000
200000
250000
300000
350000
400000
450000
500000
550000
600000
650000
700000
750000
800000
uA
U
RT: 3.86
3.61
2.82
2.16
5.968.376.78
9.12 11.5710.2411.94
12.78 14.46
NL:8.44E5
Total Scan PDA T1L
T1L #83-94 RT: 3.76-4.19 AV: 6 NL: 5.03E5F: + p ESI Full ms [100.00-1500.00]
200 250 300 350 400 450 500 550 600
m/z
0
50000
100000
150000
200000
250000
300000
350000
400000
450000
500000
Inte
nsity
409.67
441.87 568.60
425.53 499.53 542.73
457.53 539.80487.60
585.60513.40
481.47405.73309.53
262.53 369.53353.33
221.40295.53255.20
252.20

98
Fig. 37: MS graph of chicken breast tissue samples (T1)
RT: 7.41 - 15.58
8 9 10 11 12 13 14 15
Time (min)
0
10000
20000
30000
40000
50000
60000
70000
80000
90000
100000
uA
U
RT: 9.14
8.378.20
9.12 11.5710.24
7.69
11.9410.61
12.78
14.4614.1913.15
NL:1.01E5
Total Scan PDA T1L
T1L #200-207 RT: 8.95-9.22 AV: 4 NL: 8.99E4F: + p ESI Full ms [100.00-1500.00]
250 300 350 400 450 500 550
m/z
0
5000
10000
15000
20000
25000
30000
35000
40000
45000
50000
55000
60000
65000
70000
75000
80000
85000
Inte
nsity
522.07
524.67
527.60 546.67414.87 485.40
401.67 482.80499.00463.20
517.80448.87394.27
391.87354.93
299.67 385.80428.33312.87
252.53273.53
352.47261.87339.93

99
4.5 Tissue concentration of halquinol and its conjugated metabolites
The concentration of halquinol (5,7-dichloroquinolin-8-ol and 5-chloroquinolin-8-
ol) and its conjugated metabolites in various edible tissue samples were in minimal
quantities. The concentration of 5,7-dichloroquinolin-8-ol as assayed by LCMS in
tissues belonging to various treatment groups are tabulated in Table 12 and 13
respectively.
4.5.1 Tissue distribution of 5,7-dichloroquinolin-8-ol following dietary inclusion of
halquinol at 60 ppm as assayed by LCMS
Liver
The concentration of 5,7-dichloroquinolin-8-ol following dietary inclusion of
halquinol @ 60 ppm (T1 group), in liver tissue at different time intervals during 40 days
is depicted in Table 12. In LCMS graph the increase in area under curve with successive
sacrifice indicated the cumulative behavior of halquinol. The concentration of 5,7-
dichloroquinolin-8-ol at 5th day and on 40th day of exposure were 26.09±0.51 ng.g-1
tissue and 188.8±3.83 ng.g-1 tissue respectively. The increase in concentration of 5,7-
dichloroquinolin-8-ol between each successive sampling days of 5, 10, 20, 30 and 40
days during treatment were statistically significant (p≤0.05) reflecting cumulative
behavior of 5,7-dichloroquinolin-8-ol following continuous dietary exposure to halquinol
@ 60 ppm in experimental birds (Table 12).
Kidney
The concentration of 5,7-dichloroquinolin-8-ol in kidney tissues at different time
intervals during 40 days dietary exposure of halquinol is depicted in Table 12. The

100
concentration of 5,7-dichloroquinolin-8-ol at 5th day and on 40th day of treatment were
38.11±1.49 ng.g-1 tissue and 233.5±5.874 ng.g-1 tissue respectively. The increase in
concentration of 5,7-dichloroquinolin-8-ol between each successive sampling days of 5,
10, 20, 30 and 40 days during treatment period of halquinol exposure through diet were
statistically significant (p≤0.05) , following continuous dietary exposure to halquinol @
60 ppm in experimental birds (Table 12).
Muscle
The constituent molecule of halquinol in muscle tissue viz: 5,7-dichloroquinolin-
8-ol was not detectable at all-time intervals of 5, 10, 20, 30 and 40 days during treatment
period, following dietary inclusion of halquinol @ 60 ppm in experimental birds
indicating that concentration of 5,7-dichloroquinolin-8-ol was less than 20 ng.g-1 at all
sacrificing intervals. The LCMS assay did not spot the presence of 5,7-dichloroquinolin-
8-ol in muscle tissue throughout the study period .
4.5.2 Tissue distribution of 5,7-dichloroquinolin-8-ol following dietary inclusion of
halquinol at 120 ppm
Liver
The concentration of 5,7-dichloroquinolin-8-ol in liver tissues at different time
intervals during 40 days dietary exposure of halquinol @ 120 ppm (T2 group) is depicted
in Table 12. In this treatment group, the concentration of 5,7-dichloroquinolin-8-ol at 5th
day and on 40th day of treatment were 40.7±0.62 ng.g-1 and 411.0±4.22 ng.g-1 tissue
respectively and the increase in concentration of 5,7-dichloroquinolin-8-ol between each
successive sampling days of 5, 10, 20, 30 and 40 days during treatment period (Table 12)

101
were statistically significant (p≤0.05) following dietary halquinol exposure @ 120 ppm.
The concentration of 5,7-dichloroquinolin-8-ol on all sampling days of 5, 10, 20, 30 and
40 days during 40 days dietary exposure of halquinol at 120 ppm was significantly
greater (p≤0.05) than that compared to corresponding concentrations of 5,7-
dichloroquinolin-8-ol on corresponding sampling days at 60 ppm inclusion level (Table
12).
Kidney
The concentration of 5,7-dichloroquinolin-8-ol in kidney following dietary
exposure of halquinol at different time intervals is depicted in Table 12. The
concentration of 5,7-dichloroquinolin-8-ol at 5th day and on 40th day during treatment
were 55.07±0.72 ng.g-1 and 364.5±6.05 ng.g-1 tissue respectively. There was statistically
significant increase (p≤0.05) in concentration of 5,7-dichloroquinolin-8-ol between each
successive sampling days of 5, 10, 20, 30 and 40 days during treatment which was after
halquinol exposure @ 120 ppm for 40 days. The concentration of 5,7-dichloroquinolin-8-
ol on all sampling days of 5, 10, 20, 30 and 40 days during treatment period of 40 days
dietary exposure of halquinol at 120 ppm is significantly greater (p≤0.05) when
compared to corresponding concentrations of 5,7-dichloroquinolin-8-ol in kidney tissue
on corresponding sampling days of 60 ppm inclusion level (Table 12).
Muscle
The LCMS assay could not detect the major constituent of halquinol viz: 5,7-
dichloroquinolin-8-ol in breast muscle tissue even at 120 ppm inclusion level indicating
that the concentration of 5,7-dichloroquinolin-8-ol was less than 20 ng.g-1 at all time
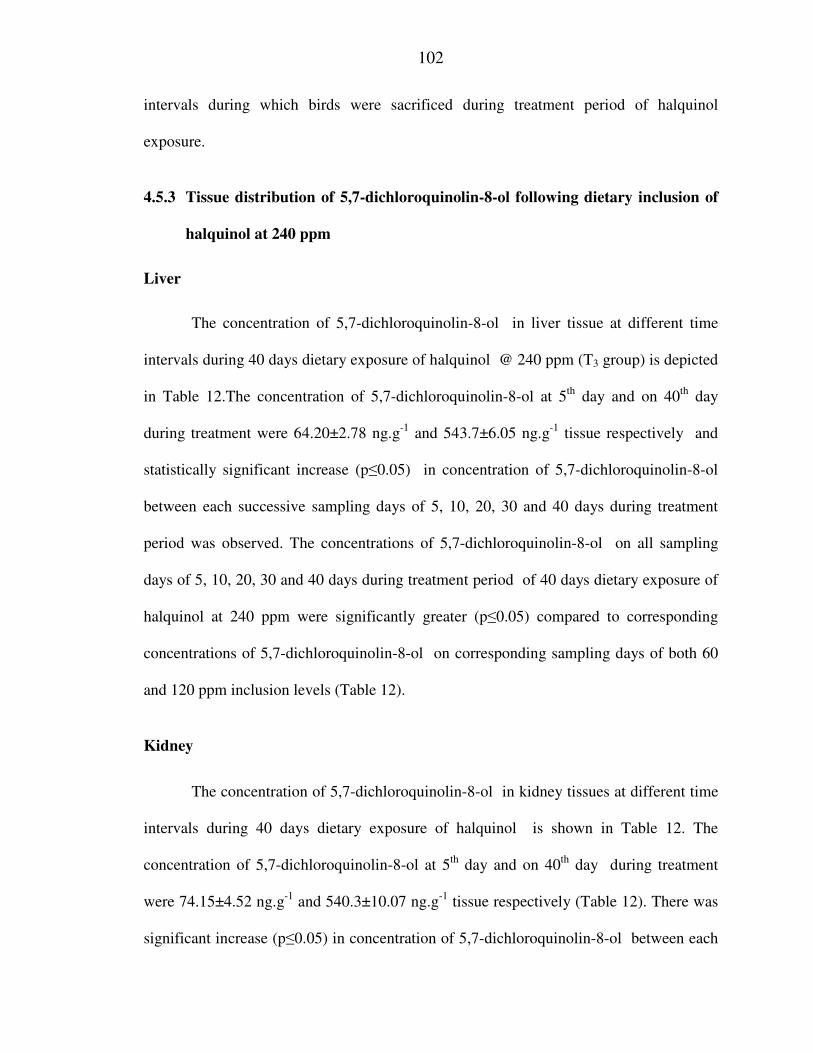
102
intervals during which birds were sacrificed during treatment period of halquinol
exposure.
4.5.3 Tissue distribution of 5,7-dichloroquinolin-8-ol following dietary inclusion of
halquinol at 240 ppm
Liver
The concentration of 5,7-dichloroquinolin-8-ol in liver tissue at different time
intervals during 40 days dietary exposure of halquinol @ 240 ppm (T3 group) is depicted
in Table 12.The concentration of 5,7-dichloroquinolin-8-ol at 5th day and on 40th day
during treatment were 64.20±2.78 ng.g-1 and 543.7±6.05 ng.g-1 tissue respectively and
statistically significant increase (p≤0.05) in concentration of 5,7-dichloroquinolin-8-ol
between each successive sampling days of 5, 10, 20, 30 and 40 days during treatment
period was observed. The concentrations of 5,7-dichloroquinolin-8-ol on all sampling
days of 5, 10, 20, 30 and 40 days during treatment period of 40 days dietary exposure of
halquinol at 240 ppm were significantly greater (p≤0.05) compared to corresponding
concentrations of 5,7-dichloroquinolin-8-ol on corresponding sampling days of both 60
and 120 ppm inclusion levels (Table 12).
Kidney
The concentration of 5,7-dichloroquinolin-8-ol in kidney tissues at different time
intervals during 40 days dietary exposure of halquinol is shown in Table 12. The
concentration of 5,7-dichloroquinolin-8-ol at 5th day and on 40th day during treatment
were 74.15±4.52 ng.g-1 and 540.3±10.07 ng.g-1 tissue respectively (Table 12). There was
significant increase (p≤0.05) in concentration of 5,7-dichloroquinolin-8-ol between each

103
successive sampling days of 5, 10, 20, 30 and 40 days during treatment following
continuous dietary exposure of halquinol at 240 ppm. The concentrations of 5,7-
dichloroquinolin-8-ol on all sampling days of 5, 10, 20, 30 and 40 days during 40 days
dietary exposure of halquinol at 240 ppm was significantly greater (p≤0.05) compared to
corresponding concentrations of 5,7-dichloroquinolin-8-ol on corresponding sampling
days of both 60 ppm and 120 ppm dose groups (Table 12).
Muscle
The concentration of 5,7-dichloroquinolin-8-ol in breast muscles at different time
intervals during 40 days dietary exposure of halquinol is shown in Table 12,
concentration of 5,7-dichloroquinolin-8-ol at 5th day and on 40th day during treatment
were 35.13±2.25 ng.g-1 and 170.4±5.42 ng.g-1 tissue respectively and there was
significant increase (p≤0.05) in concentration of 5,7-dichloroquinolin-8-ol between each
successive sampling days of 5, 10, 20, 30 and 40 days during treatment in breast muscle
tissue following dietary exposure @ 240 ppm (Table 12).
4.6 Tissue concentration of conjugated metabolites of halquinol following dietary
inclusion of halquinol at 60 ppm
Liver
Liver is the main organ of metabolism of halquinol therefore the conjugated
metabolites were detected by LCMS in liver tissue.The tissue concenteration of 5-chloro-
quinolin-8-ol glucuronide in liver tissue is depicted in (Table 13). The concentration of 5-
chloro-quinolin-8-ol glucuronide in liver tissue at different time intervals during 40 days
dietary exposure of halquinol is shown in (Table 13) concentration of 5-chloro-quinolin-

104
8-ol glucuronide at 5th day and on 40th day during treatment were 25.13±1.25 ng.g-1 and
160.4±4.42 ng.g-1 tissue respectively and there is significant increase (p≤0.05) in
concentration of 5-chloro-quinolin-8-ol glucuronide between each successive sampling
days of 5, 10, 20, 30 and 40 days during treatment in breast muscle tissue following
dietary exposure @ 60 ppm (Table 13).
Kidney
The LCMS detected the major metabolite in kidney in minimal levels as it is not
the organ of metabolism for halquinol. The concentration of 5-chloro-quinolin-8-ol
glucuronide in kidney at different time intervals during 40 days dietary exposure of
halquinol is shown in Table 13. The concentration of 5-chloro-quinolin-8-ol glucuronide
at 5th day and on 40th day during treatment were 24.12±1.25 ng.g-1 and 75.4±4.42 ng.g-1
tissue respectively and there is significant increase (p≤0.05) in concentration of 5,7-
dichloroquinolin-8-ol between each successive sampling days of 5, 10, 20, 30 and 40
days during treatment in kidney tissue following dietary exposure @ 60 ppm (Table 13).
Muscle
The LCMS assay could not detect the major metabolite constituents of halquinol
viz:5-chloro-quinolin-8-ol glucuronide in muscle at 60 ppm inclusion level indicating that
the concentration of 5-chloro-quinolin-8-ol glucuronide was less than 10 ng.g-1 at all time
intervals during which birds were sacrificed during treatment period of halquinol
exposure.

105
4.6.1 Tissue concentration of conjugated metabolites of halquinol following dietary
inclusion of halquinol at 120 ppm
Liver
Liver is the main organ of metabolism of halquinol therefore the conjugated
metabolites were detected by LCMS in liver tissue.The tissue concenteration of 5-chloro-
quinolin-8-ol glucuronide in liver tissue is depicted in Table 13.The concentration of 5-
chloro-quinolin-8-ol glucuronide in liver tissue at different time intervals during 40 days
dietary exposure of halquinol is shown in Table 13, concentration of 5-chloro-quinolin-
8-ol glucuronide at 5th day and on 40th day during treatment were 45.12±2.15 ng.g-1 and
190.4±2.12 ng.g-1 tissue respectively and there is significant increase (p≤0.05) in
concentration of 5-chloro-quinolin-8-ol glucuronide between each successive sampling
days of 5, 10, 20, 30 and 40 days during treatment in liver tissue following dietary
exposure @ 120 ppm (Table 13).
Kidney
The LCMS detected the major metabolite in kidney in minimal levels as it is not
the organ of metabolism for halquinol. The concentration of 5-chloro-quinolin-8-ol
glucuronide in kidney at different time intervals during 40 days dietary exposure of
halquinol is shown in Table 13, concentration of 5-chloro-quinolin-8-ol glucuronide at
5th day and on 40th day during treatment were 34.12±1.35 ng.g-1 and 95.4±5.42 ng.g-1
tissue respectively and there is significant increase (p≤0.05) in concentration of 5,7-
dichloroquinolin-8-ol between each successive sampling days of 5, 10, 20, 30 and 40
days during treatment in kidney following dietary exposure @ 120 ppm (Table 13).

106
Muscle
The LCMS assay could not detect the major metabolite constituent of halquinol
viz:5-chloro-quinolin-8-ol glucuronide in muscle at 120 ppm inclusion level indicating
that the concentration of 5-chloro-quinolin-8-ol glucuronide was less than 10 ng.g-1 at all
time intervals during which birds were sacrificed during treatment period of halquinol
exposure.
4.6.2 Tissue concentration of conjugated metabolites of halquinol following dietary
inclusion of halquinol at 240 ppm
Liver
Liver is the main organ of metabolism of halquinol therefore the conjugated
metabolites were detected by LCMS in liver tissue.The tissue concenteration of 5-chloro-
quinolin-8-ol glucuronide in liver tissue is depicted in Table 13 The concentration of 5-
chloro-quinolin-8-ol glucuronide in liver tissue at different time intervals during 40 days
dietary exposure of halquinol is shown in Table 13, concentration of 5-chloro-quinolin-
8-ol glucuronide at 5th day and on 40th day during treatment were 55.12±2.15 ng.g-1 and
243.7±2.12 ng.g-1 tissue respectively and there was significant increase (p≤0.05) in
concentration of 5-chloro-quinolin-8-ol glucuronide between each successive sampling
days of 5, 10, 20, 30 and 40 days during treatment in liver tissue following dietary
exposure @ 240 ppm (Table 13).
Kidney
The LCMS detected the major metabolite in kidney in minimal levels as it is not
the organ of metabolism for halquinol. The concentration of 5-chloro-quinolin-8-ol
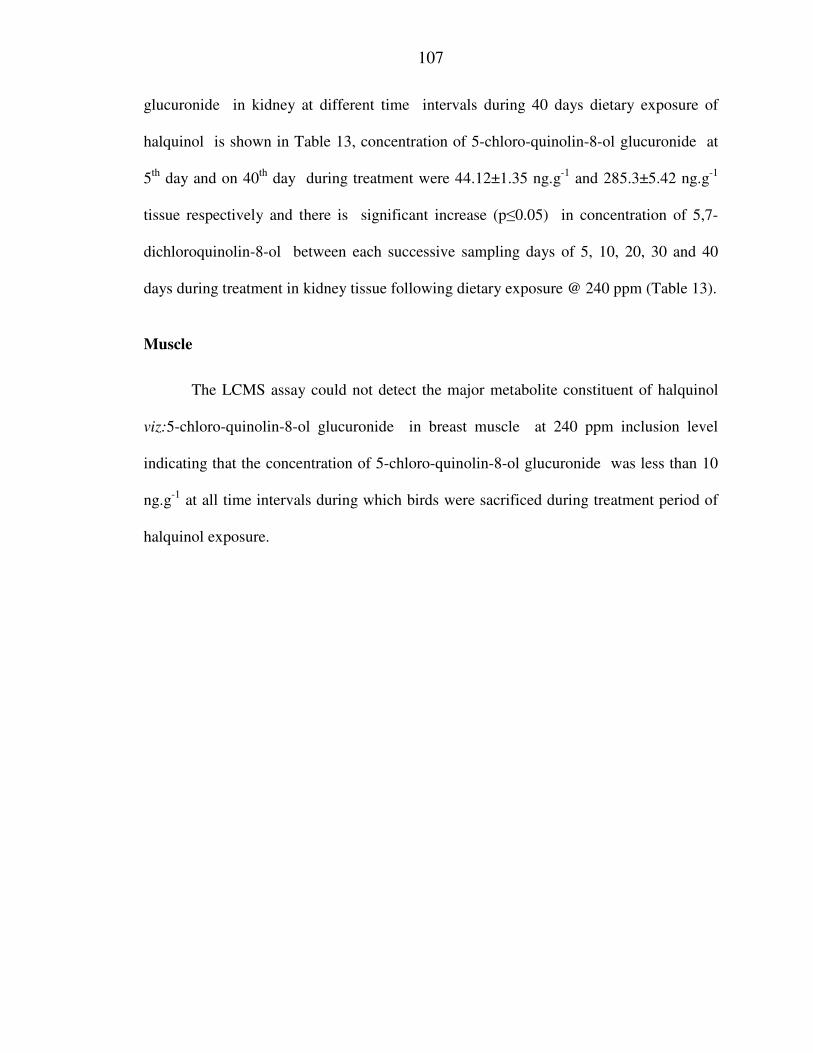
107
glucuronide in kidney at different time intervals during 40 days dietary exposure of
halquinol is shown in Table 13, concentration of 5-chloro-quinolin-8-ol glucuronide at
5th day and on 40th day during treatment were 44.12±1.35 ng.g-1 and 285.3±5.42 ng.g-1
tissue respectively and there is significant increase (p≤0.05) in concentration of 5,7-
dichloroquinolin-8-ol between each successive sampling days of 5, 10, 20, 30 and 40
days during treatment in kidney tissue following dietary exposure @ 240 ppm (Table 13).
Muscle
The LCMS assay could not detect the major metabolite constituent of halquinol
viz:5-chloro-quinolin-8-ol glucuronide in breast muscle at 240 ppm inclusion level
indicating that the concentration of 5-chloro-quinolin-8-ol glucuronide was less than 10
ng.g-1 at all time intervals during which birds were sacrificed during treatment period of
halquinol exposure.

108
Table12: Tissue concentration (ng.g-1
) of halquinol* at different time intervals during 40 days dietary exposure in broiler
chickens
Day of halquinol
exposure
Halquinol® concentration in diet
60 ppm (T1) 120 ppm (T2) 240 ppm (T3)
Liver Kidney Liver Kidney Liver Kidney Muscle
5 26.09±0.51A 38.11±1.49a 40.70±0.62F 55.07±0.72f 64.20±2.78K 74.15±4.42k 35.13±2.25>
10 37.45±1.29B 59.52±1.60b 86.13±1.47G 96.47±1.48g 138.7±2.95L 151.8±4.36l 52.45±1.14#
20 109.22±2.34C 119.0±2.62c 170.0±3.65H 185.5±3.06h 329.2±5.83M 322.7±7.55m 96.47±2.33$
30 112.4±2.92D 124.2±5.46d 216.6±3.67I 219.3±3.70i 396.7±4.62N 388.3±4.78n 104.7±3.22@
40 188.8±3.83E 233.5±5.87e 411.0±4.22J 364.7±6.05j 543.7±6.04O 540.3±10.07o 170.4±5.42^
Note: 1 Values are expressed as mean ± SE; n= 6 birds sacrificed at a time
2. * = represents 5,7-dichloroquinolin-8-ol
3. Tissue concentration data (liver & kidney) between different dose groups and between different days during treatment period were analyzed by xcalibur analytical softwares, while muscle concentration data was analysed by one way ANOVA followed by Tukey's multiple comparison test
4. Values bearing different alphabets as superscripts both between rows (days) and columns (dose levels) for individual tissue varysignificantly (p≤0.05);Capital alphabets indicate comparison within liver tissue and small alphabets indicate comparison within kidney tissue and values bearing symbol, a

109
Table 13: Tissue concentrations (ng.g-1
) of 5-chloro-quinolin-8-ol glucuronide* at different time intervals during 40 days
dietary exposure in broiler chickens
Day of
halquinol
exposure
Halquinol® concentration in diet
60 ppm (T1) 120 ppm (T2) 240 ppm (T3)
Liver Kidney Liver Kidney Liver Kidney Muscle
5 25.13±1.25A 24.12±1.25a 45.12±2.15F 34.12±1.35f 55.12±2.15K 44.12±1.35k ----------------------
10 27.35±1.29B 39.52±1.60b 76.13±1.47G 46.47±1.48g 68.7±2.95L 81.8±4.36l ---------------------
20 70.22±2.34C 58.0±2.62c 100.0±3.65H 65.5±3.06h 119.2±5.83M 122.7±7.55m ---------------------
30 85.4±2.92D 62.2±5.46d 166.6±3.67I 77.3±3.70i 200.7±4.62N 244.3±4.78n ---------------------
40 160.8±4.42E 75.4±4.42e 190.4±2.12E 95.4.±5.42j 243.7±2.12O 285.4±5.42o ---------------------
Note: 1 Values are expressed as mean ± SE; n= 6 birds sacrificed at a time
2. * = 5-chloro-quinolin-8-ol glucuronide*
3. Tissue concentration data (liver & kidney) between different dose groups and between different days during treatment period were analyzed by xcalibur analytical softwares, while muscle concentration data was analysed by one way ANOVA followed by Tukey's multiple comparison test
4. Values bearing different alphabets as superscripts both between rows (days) and columns (dose levels) for individual tissue vary significantly (p≤0.05); Capital alphabets indicate comparison within liver tissue and small alphabets indicate comparison within kidney tissue and values bearing symbol, a
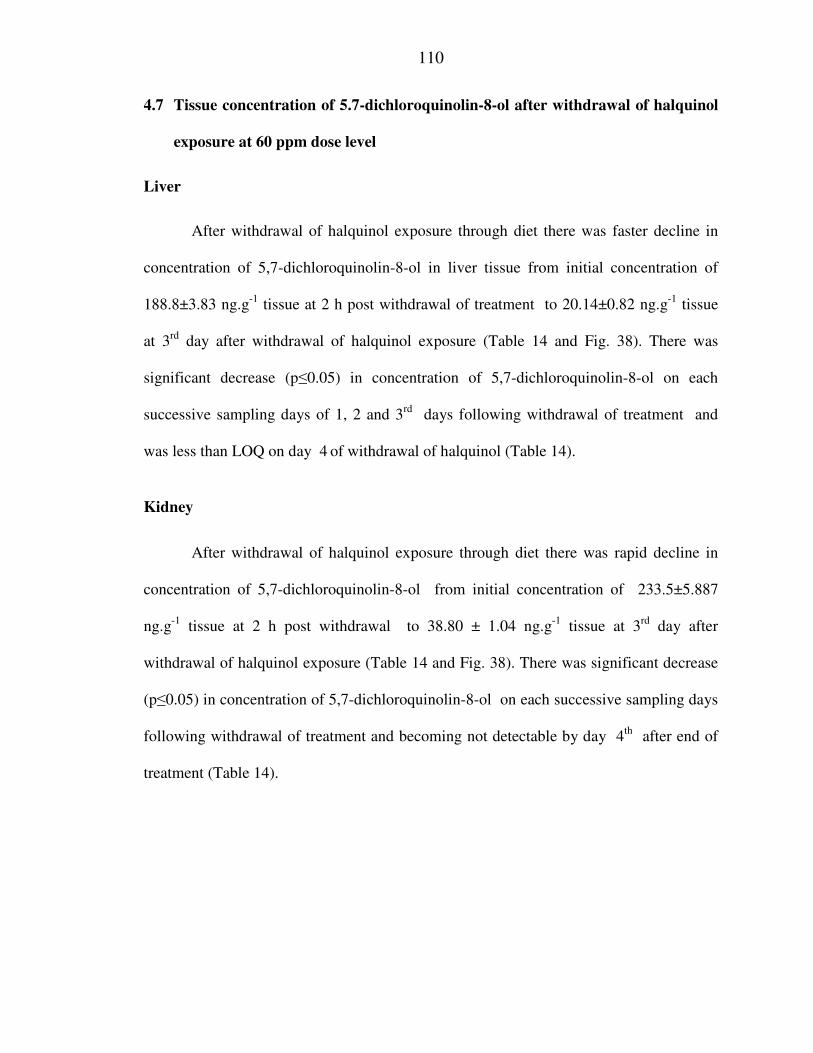
110
4.7 Tissue concentration of 5.7-dichloroquinolin-8-ol after withdrawal of halquinol
exposure at 60 ppm dose level
Liver
After withdrawal of halquinol exposure through diet there was faster decline in
concentration of 5,7-dichloroquinolin-8-ol in liver tissue from initial concentration of
188.8±3.83 ng.g-1 tissue at 2 h post withdrawal of treatment to 20.14±0.82 ng.g-1 tissue
at 3rd day after withdrawal of halquinol exposure (Table 14 and Fig. 38). There was
significant decrease (p≤0.05) in concentration of 5,7-dichloroquinolin-8-ol on each
successive sampling days of 1, 2 and 3rd days following withdrawal of treatment and
was less than LOQ on day 4 of withdrawal of halquinol (Table 14).
Kidney
After withdrawal of halquinol exposure through diet there was rapid decline in
concentration of 5,7-dichloroquinolin-8-ol from initial concentration of 233.5±5.887
ng.g-1 tissue at 2 h post withdrawal to 38.80 ± 1.04 ng.g-1 tissue at 3rd day after
withdrawal of halquinol exposure (Table 14 and Fig. 38). There was significant decrease
(p≤0.05) in concentration of 5,7-dichloroquinolin-8-ol on each successive sampling days
following withdrawal of treatment and becoming not detectable by day 4th after end of
treatment (Table 14).
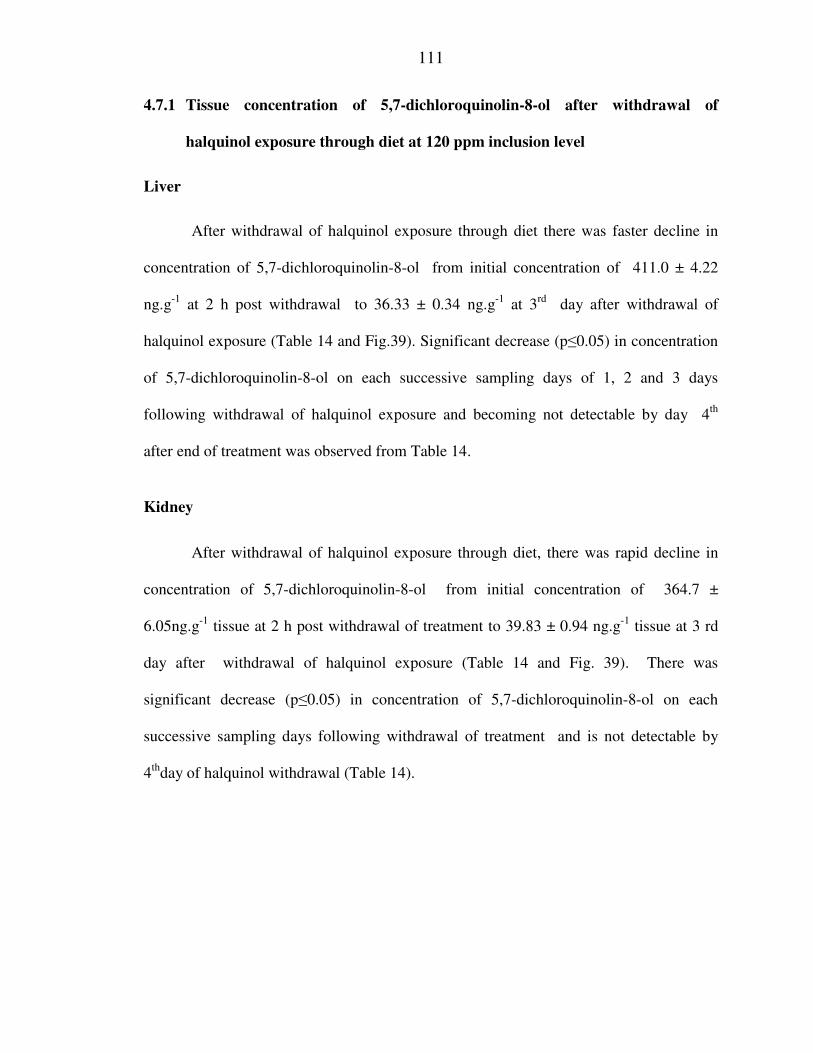
111
4.7.1 Tissue concentration of 5,7-dichloroquinolin-8-ol after withdrawal of
halquinol exposure through diet at 120 ppm inclusion level
Liver
After withdrawal of halquinol exposure through diet there was faster decline in
concentration of 5,7-dichloroquinolin-8-ol from initial concentration of 411.0 ± 4.22
ng.g-1 at 2 h post withdrawal to 36.33 ± 0.34 ng.g-1 at 3rd day after withdrawal of
halquinol exposure (Table 14 and Fig.39). Significant decrease (p≤0.05) in concentration
of 5,7-dichloroquinolin-8-ol on each successive sampling days of 1, 2 and 3 days
following withdrawal of halquinol exposure and becoming not detectable by day 4th
after end of treatment was observed from Table 14.
Kidney
After withdrawal of halquinol exposure through diet, there was rapid decline in
concentration of 5,7-dichloroquinolin-8-ol from initial concentration of 364.7 ±
6.05ng.g-1 tissue at 2 h post withdrawal of treatment to 39.83 ± 0.94 ng.g-1 tissue at 3 rd
day after withdrawal of halquinol exposure (Table 14 and Fig. 39). There was
significant decrease (p≤0.05) in concentration of 5,7-dichloroquinolin-8-ol on each
successive sampling days following withdrawal of treatment and is not detectable by
4thday of halquinol withdrawal (Table 14).
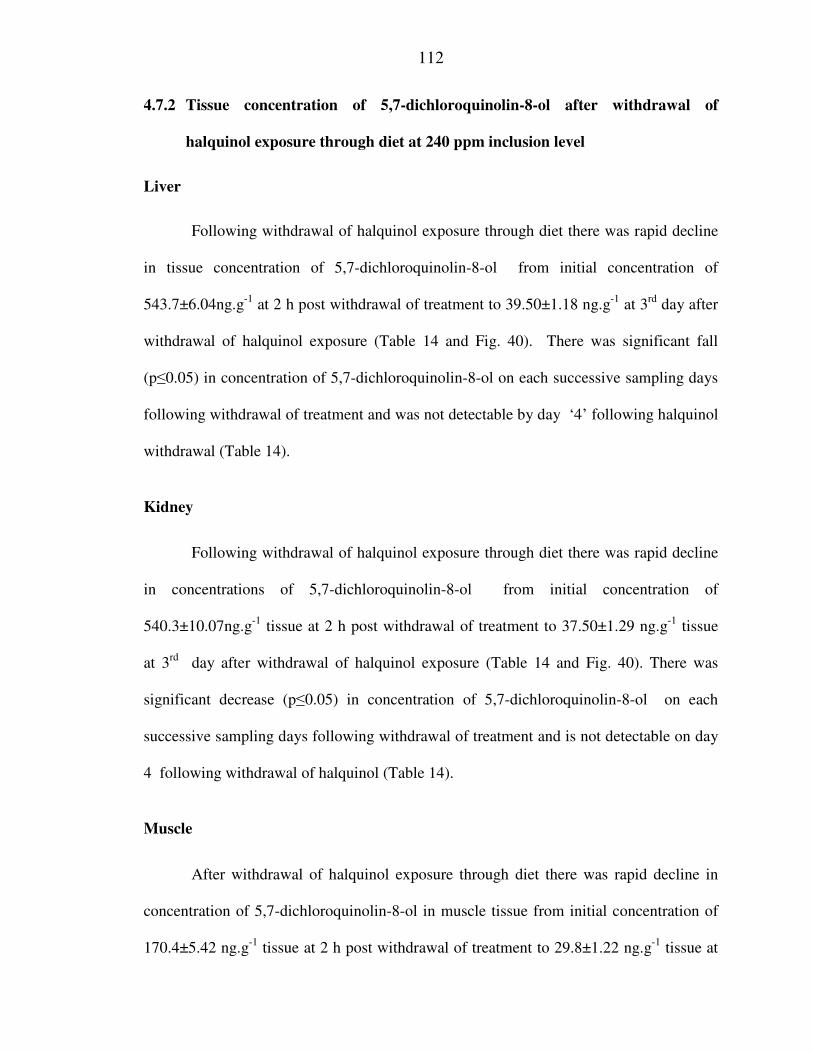
112
4.7.2 Tissue concentration of 5,7-dichloroquinolin-8-ol after withdrawal of
halquinol exposure through diet at 240 ppm inclusion level
Liver
Following withdrawal of halquinol exposure through diet there was rapid decline
in tissue concentration of 5,7-dichloroquinolin-8-ol from initial concentration of
543.7±6.04ng.g-1 at 2 h post withdrawal of treatment to 39.50±1.18 ng.g-1 at 3rd day after
withdrawal of halquinol exposure (Table 14 and Fig. 40). There was significant fall
(p≤0.05) in concentration of 5,7-dichloroquinolin-8-ol on each successive sampling days
following withdrawal of treatment and was not detectable by day ‘4’ following halquinol
withdrawal (Table 14).
Kidney
Following withdrawal of halquinol exposure through diet there was rapid decline
in concentrations of 5,7-dichloroquinolin-8-ol from initial concentration of
540.3±10.07ng.g-1 tissue at 2 h post withdrawal of treatment to 37.50±1.29 ng.g-1 tissue
at 3rd day after withdrawal of halquinol exposure (Table 14 and Fig. 40). There was
significant decrease (p≤0.05) in concentration of 5,7-dichloroquinolin-8-ol on each
successive sampling days following withdrawal of treatment and is not detectable on day
4 following withdrawal of halquinol (Table 14).
Muscle
After withdrawal of halquinol exposure through diet there was rapid decline in
concentration of 5,7-dichloroquinolin-8-ol in muscle tissue from initial concentration of
170.4±5.42 ng.g-1 tissue at 2 h post withdrawal of treatment to 29.8±1.22 ng.g-1 tissue at

113
2nd day after withdrawal of halquinol exposure (Table 14 and Fig. 40). There was
significant decrease (p≤0.05) in concentration of 5,7-dichloroquinolin-8-ol on each
successive sampling days of 1 and 2 following withdrawal of treatment and not
detectable in samples obtained on day ‘3’(Table 14).
4.8 Tissue concentration of 5-chloro-quinolin-8-ol glucuronide after withdrawal of
halquinol exposure at 60 ppm dose level
Liver
After withdrawal of halquinol exposure through diet there was faster decline in
concentration of 5,7-dichloroquinolin-8-ol in liver tissue from initial concentration of
160.8±4.42 ng.g-1 tissue at 2 h post withdrawal of treatment to 7.14±0.12 ng.g-1 tissue
at 4th day after withdrawal of halquinol exposure (Table 15). There was significant
decrease (p≤0.05) in concentration of 5,7-dichloroquinolin-8-ol on each successive
sampling days of 1, 2 and 3rd days following withdrawal of treatment and becoming not
detectable by day 5th after end of treatment (Table 15).
Kidney
After withdrawal of halquinol exposure through diet there was rapid decline in
concentration of 5,7-dichloroquinolin-8-ol from initial concentration of 75.4±4.42 ng.g-1
tissue at 2 h post withdrawal to 18.40±2.04d ng.g-1 tissue at 4th day after withdrawal of
halquinol exposure (Table 15). There was significant decrease (p≤0.05) in concentration
of 5,7-dichloroquinolin-8-ol on each successive sampling days following withdrawal of
treatment and becoming not detectable by day 5th after end of treatment (Table 15).

114
4.8.1 Tissue concentration of 5,7-dichloroquinolin-8-ol after withdrawal of
halquinol exposure through diet at 120 ppm inclusion level
Liver
After withdrawal of halquinol exposure through diet there was faster decline in
concentration of 5,7-dichloroquinolin-8-ol from initial concentration of 190.4±2.12
ng.g-1 at 2 h post withdrawal to 16.33±0.12 ng.g-1 at 4th day after withdrawal of
halquinol exposure (Table 15) . Significant decrease (p≤0.05) in concentration of 5,7-
dichloroquinolin-8-ol on each successive sampling days of 1, 2 and 3 days following
withdrawal of halquinol exposure and becoming not detectable by 5th day after end of
treatment was observed from Table 15.
Kidney
After withdrawal of halquinol exposure through diet, there was rapid decline in
concentration of 5,7-dichloroquinolin-8-ol from initial concentration of 95.4±5.42 ng.g-1
tissue at 2 h post withdrawal of treatment to 17.12±1.64 ng.g-1 tissue at 4th day after
withdrawal of halquinol exposure (Table 15). There is significant decrease (p≤0.05) in
concentration of 5,7-dichloroquinolin-8-ol on each successive sampling days following
withdrawal of treatment and is not detectable by 5th day of halquinol withdrawal (Table
15).
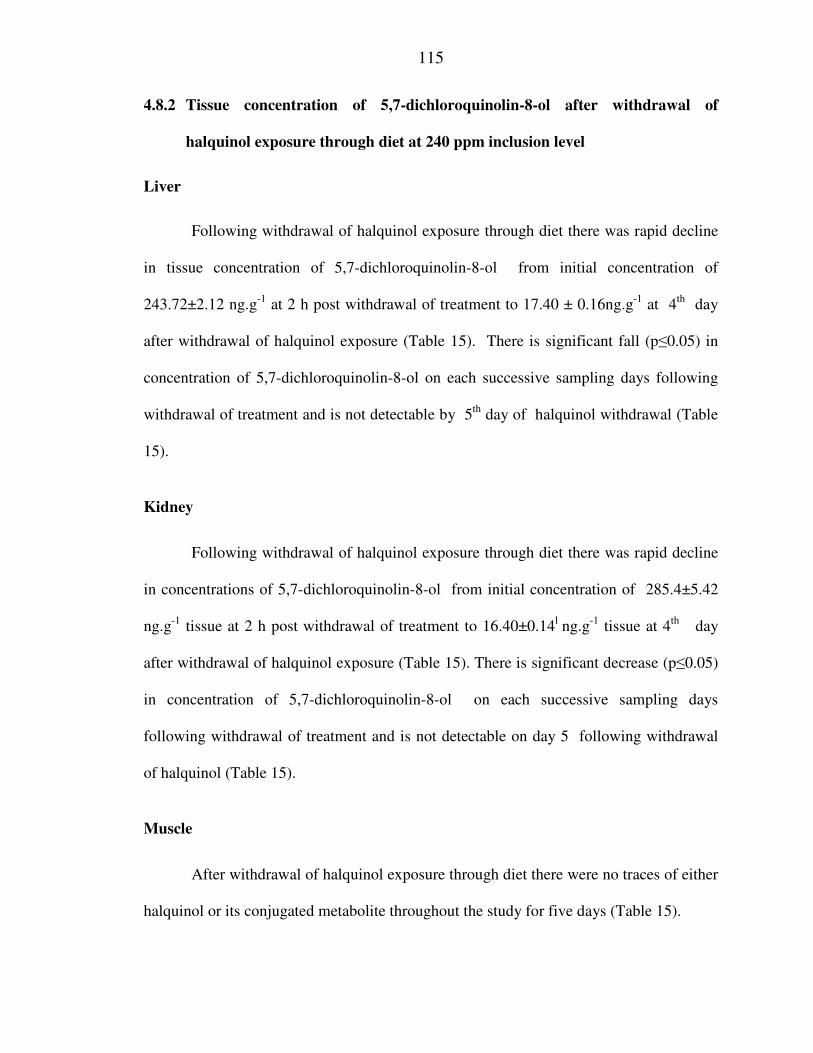
115
4.8.2 Tissue concentration of 5,7-dichloroquinolin-8-ol after withdrawal of
halquinol exposure through diet at 240 ppm inclusion level
Liver
Following withdrawal of halquinol exposure through diet there was rapid decline
in tissue concentration of 5,7-dichloroquinolin-8-ol from initial concentration of
243.72±2.12 ng.g-1 at 2 h post withdrawal of treatment to 17.40 ± 0.16ng.g-1 at 4th day
after withdrawal of halquinol exposure (Table 15). There is significant fall (p≤0.05) in
concentration of 5,7-dichloroquinolin-8-ol on each successive sampling days following
withdrawal of treatment and is not detectable by 5th day of halquinol withdrawal (Table
15).
Kidney
Following withdrawal of halquinol exposure through diet there was rapid decline
in concentrations of 5,7-dichloroquinolin-8-ol from initial concentration of 285.4±5.42
ng.g-1 tissue at 2 h post withdrawal of treatment to 16.40±0.14l ng.g-1 tissue at 4th day
after withdrawal of halquinol exposure (Table 15). There is significant decrease (p≤0.05)
in concentration of 5,7-dichloroquinolin-8-ol on each successive sampling days
following withdrawal of treatment and is not detectable on day 5 following withdrawal
of halquinol (Table 15).
Muscle
After withdrawal of halquinol exposure through diet there were no traces of either
halquinol or its conjugated metabolite throughout the study for five days (Table 15).

116
Table 14: Tissue concentration (ng.g-1
) of halquinol* at different time intervals following withdrawal of halquinol exposure in
feed of broiler chickens
Day
following
withdrawal
Halquinol® concentration in diet
60 ppm (T1) 120 ppm (T2) 240 ppm (T3)
Liver Kidney Liver Kidney Liver Kidney Muscle
0.08# 188.8±3.83E 233.5±5.87e 411.0±4.22J 364.7±6.05j 543.7±6.04O 540.3±10.07o 170.4±5.42#
1 58.17±1.33B 77.3± 2.10b 89.17±1.24F 82.12±3.84f 160.30±3.32J 280.4±3.37j 54.62±3.16^
2 45.04±1.21C 54.44±1.19c 69.17±1.04G 73.83±1.16g 73.17±2.70K 81.87±2.87k 29.8±1.22@
3 20.14±0.82D 38.80±1.04d 36.33±0.34H 39.83±0.94h 39.50±1.18L 37.50±1.29l ND
4 ND ND ND ND ND ND ND
Note: 1. Values are expressed as mean ± SE; n= 6 birds sacrificed at a time ; * = represents 5,7-dichloroquinolin-8-ol
2. # Samples were collected at 2h post-withdrawal of dietary source of halquinol
3. Tissue concentration data between different days within a tissue of different dose groups, following withdrawal of halquinol exposure were analyzed by One Way Anova followed by Tukey’s multiple comparison test
4. Values bearing different alphabets as superscripts between rows (days) for individual tissues vary significantly (p≤0.05); Capital alphabets indicate comparison within liver tissue, small alphabets indicate comparison within kidney tissue while values bearing different symbols as superscripts indicate comparison within muscle tissue
5. ND = not detectable

117
Table 15: Tissue concentration (ng.g-1
) 5-chloro-quinolin-8-ol glucuronide* at different time intervals following withdrawal of
halquinol exposure through feed in broiler chickens
Day following
withdrawal
Halquinol® concentration in diet
60 ppm (T1) 120 ppm (T2) 240 ppm (T3)
Liver Kidney Liver Kidney Liver Kidney Muscle
0.08# 160.8±4.42A 75.4±4.42a 190.4±2.12J 95.4±5.42j 243.72±2.12O 285.4±5.42o ND
1 48.17±1.33B 67.03± 2.10b 69.17±1.24F 82.12±3.84f 160.30±3.32J 280.4±3.37j ND
2 35.04±1.21C 44.44±1.19c 49.17±1.04G 73.83±1.16g 73.17±2.70K 81.87±2.87k ND
3 10.14±0.82D 28.80±1.04d 36.33±0.34H 39.83±0.94h 39.50±1.18L 37.50±1.29l ND
4
5
7.14±0.12
ND
18.40±2.04
ND
16.33±0.12
ND
17.12±1.64
ND
17.40±0.16
ND
16.40±0.14
ND
ND
ND
Note: 1. Values are expressed as mean ± SE; n= 6 birds sacrificed at a time ; * = represents 5-chloro-quinolin-8-ol glucuronide
2. # Samples were collected at 2h post-withdrawal of dietary source of halquinol
3. Tissue concentration data between different days within a tissue of different dose groups, following withdrawal of halquinol exposure were analyzed by one way ANOVA followed by Tukey’s multiple comparison test
4. Values bearing different alphabets as superscripts between rows (days) for individual tissues vary significantly (p≤0.05); Capital alphabets indicate comparison within liver tissue, small alphabets indicate comparison within kidney tissue while values bearing different symbols as superscripts indicate comparison within muscle tissue
5. ND = not detectable

118
0 1 2 3 40
50
100
150
200
250
liver
kidney
Days after withdrawal of halquinol
ng/g
tis
sue
Fig. 38: Mean tissue concentration-time profile of halquinol (5,7-dichloroquinolin-
8-ol) in broiler chickens following withdrawal of dietary exposure to
halquinol @ 60 ppm x 40 days (n=6 birds sacrificed at each time interval)
0 1 2 3 40
100
200
300
400
liver
kidney
Days after withdrawal of halquinol
ng/g
tis
sue
Fig. 39: Mean tissue concentration-time profile of halquinol (5,7-dichloroquinolin-
8-ol) in broiler chickens following withdrawal of dietary exposure to
halquinol @120 ppm x 40days (n=6 birds sacrificed at each time interval)

119
0 1 2 3 40
200
400
600
liver
kidney
muscle
Days after withdrawal of halquinol
ng
/g t
issu
e
Fig. 40 : Mean tissue concentration-time profile of halquinol (5,7-dichloroquinolin-
8-ol) in broiler chickens following withdrawal of dietary exposure to
halquinol @ 240 ppm x 40days (n=6 birds sacrificed at each time interval)

DISCUSSION
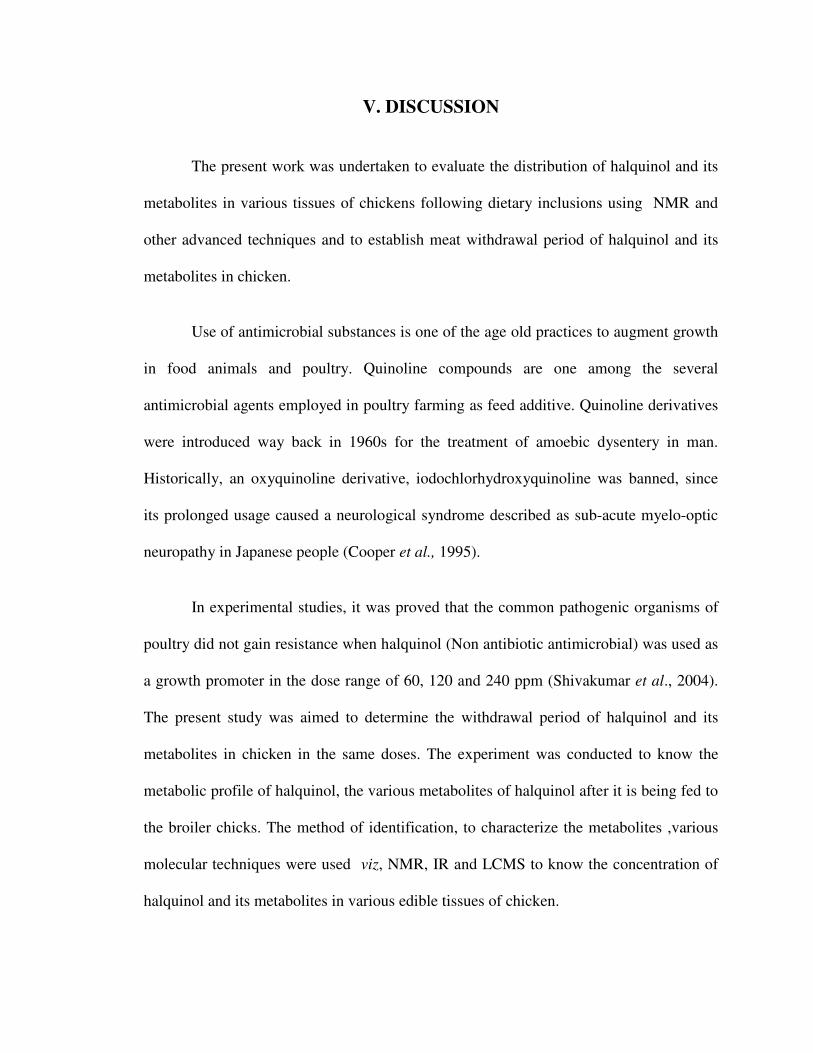
V. DISCUSSION
The present work was undertaken to evaluate the distribution of halquinol and its
metabolites in various tissues of chickens following dietary inclusions using NMR and
other advanced techniques and to establish meat withdrawal period of halquinol and its
metabolites in chicken.
Use of antimicrobial substances is one of the age old practices to augment growth
in food animals and poultry. Quinoline compounds are one among the several
antimicrobial agents employed in poultry farming as feed additive. Quinoline derivatives
were introduced way back in 1960s for the treatment of amoebic dysentery in man.
Historically, an oxyquinoline derivative, iodochlorhydroxyquinoline was banned, since
its prolonged usage caused a neurological syndrome described as sub-acute myelo-optic
neuropathy in Japanese people (Cooper et al., 1995).
In experimental studies, it was proved that the common pathogenic organisms of
poultry did not gain resistance when halquinol (Non antibiotic antimicrobial) was used as
a growth promoter in the dose range of 60, 120 and 240 ppm (Shivakumar et al., 2004).
The present study was aimed to determine the withdrawal period of halquinol and its
metabolites in chicken in the same doses. The experiment was conducted to know the
metabolic profile of halquinol, the various metabolites of halquinol after it is being fed to
the broiler chicks. The method of identification, to characterize the metabolites ,various
molecular techniques were used viz, NMR, IR and LCMS to know the concentration of
halquinol and its metabolites in various edible tissues of chicken.

121
In the present study, broiler chickens were fed with halquinol mixed feed at
different levels of 60, 120 and 240 ppm for a period of 40 days. The dose selected in the
present study was based on the earlier studies of Shivakumar et al. (2004).
5.1 Halquinol characterization
In the present study, the characterization of the halquinol procured from (Provimi
Animal Nutrition Ltd., Bangalore) was done by various analytical techniques such as
Ultraviolet-visible (UV-Vis) spectroscopy, Fourier Transform Infrared Spectroscopy
(FTIR), Thin Layer Chromatography (TLC), Nuclear Magnetic Resonance (NMR), High
Performance Liquid Chromatography (HPLC) and Liquid Chromatography Mass
Spectroscopy (LCMS) were performed. The genuineness of the procured halquinol was
assessed by UV-Vis double beam spectrophotometer and FTIR. The purity or presence of
any impurities in the procured halquinol was tested and confirmed by NMR and the
results were in accordance with the findings of Boison and Keng, (1998).
5.2 Identification of the halquinol in edible tissues of chicken
Halquinol was incorporated in the feed of broiler chickens at different levels viz:
60, 120 and 240 ppm for a period of 40 days and few birds (n=6 each) in each treatment
group at regular intervals were sacrificed to determine tissue concentration of 5,7-
dichloroquinolin-8-ol and 5-chloroquinolin-8-ol, the metabolites of halquinol. The
remaining birds were serially sacrificed (n = 6) at regular intervals from all groups
following withdrawal of experimental exposure to halquinol and vital edible tissues viz:
liver, kidney and breast muscles were collected and subjected to liquid chromatography
mass spectroscopy (LCMS).

122
The detection and quantification of 5,7-dichloroquinolin-8-ol and 5-
chloroquinolin-8-ol and its major metabolites i.e, 5,7-dichloroquinolin-8-ol sulfate and
5,7-dichloro-quinolin-8-ol glucuronide in tissues was carried out by using LCMS fitted
with photo diode array detector. Reference standards of 5,7-dichloroquinolin-8-ol and 5-
chloroquinolin-8-ol from Sigma® were used for standardization, recovery and assay
precision studies. The tissue clean-up and analytical procedures to quantify 5,7-
dichloroquinolin-8-ol and 5-chloroquinolin-8-ol, the constituent molecules of halquinol
with permissible limits of repeatability, precision and sensitivity were standardized in the
present study. However, the tissue concentration of 5-chloroquinolin-8-ol and 5,7-
dichloroquinolin-8-ol sulfate was less than the detection limit of the assay system (20
ng/g tissue). Therefore, the interpretations of halquinol residues made in the present study
were limited to 5,7-dichloroquinolin-8-ol only and 5-chloro-quinolin-8-ol glucuronide.
The m/z value and area under curve of halquinol and its metabolites indicated the
increase in its concentration on successive sampling. The RT value for halquinol was
5.57 to 6.97 and the mass was also known by performing LCMS of test samples. The area
under curve was the indicator of increasing concentration of halquinol in the successive
sampling. All the constituents of halquinol were identified by above mentioned molecular
methods.
In the present study, 5,7-dichloroquinolin-8-ol was detected in the liver and
kidney samples belonging to all the three treatment groups throughout the experimental
period, while its residue concentration was not found in breast muscles except in those
belonging to 240 ppm group. Similarly, the tissue levels of 5,7-dichloroquinolin-8-ol
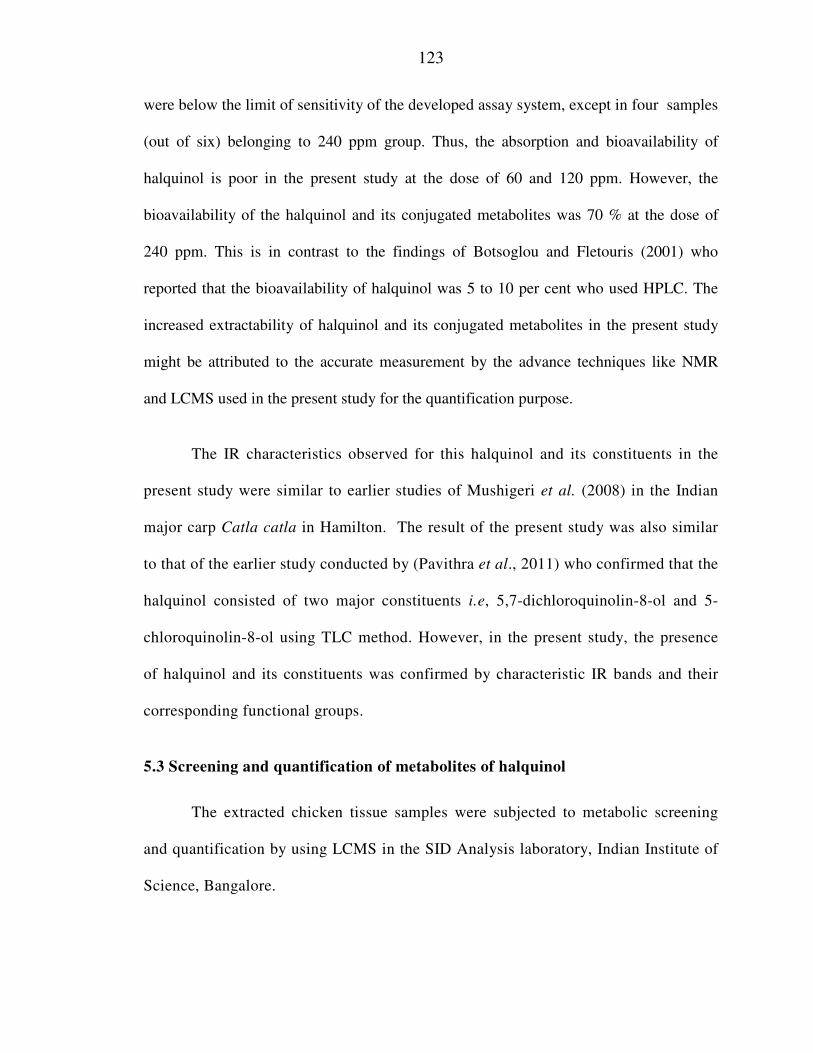
123
were below the limit of sensitivity of the developed assay system, except in four samples
(out of six) belonging to 240 ppm group. Thus, the absorption and bioavailability of
halquinol is poor in the present study at the dose of 60 and 120 ppm. However, the
bioavailability of the halquinol and its conjugated metabolites was 70 % at the dose of
240 ppm. This is in contrast to the findings of Botsoglou and Fletouris (2001) who
reported that the bioavailability of halquinol was 5 to 10 per cent who used HPLC. The
increased extractability of halquinol and its conjugated metabolites in the present study
might be attributed to the accurate measurement by the advance techniques like NMR
and LCMS used in the present study for the quantification purpose.
The IR characteristics observed for this halquinol and its constituents in the
present study were similar to earlier studies of Mushigeri et al. (2008) in the Indian
major carp Catla catla in Hamilton. The result of the present study was also similar
to that of the earlier study conducted by (Pavithra et al., 2011) who confirmed that the
halquinol consisted of two major constituents i.e, 5,7-dichloroquinolin-8-ol and 5-
chloroquinolin-8-ol using TLC method. However, in the present study, the presence
of halquinol and its constituents was confirmed by characteristic IR bands and their
corresponding functional groups.
5.3 Screening and quantification of metabolites of halquinol
The extracted chicken tissue samples were subjected to metabolic screening
and quantification by using LCMS in the SID Analysis laboratory, Indian Institute of
Science, Bangalore.

124
All the analysed samples were positive for the presence of 2 main metabolites
viz.,5-chloro-quinolin-8-ol sulfate and 5-chloro-quinolin-8-ol glucuronide. The
conjugated metabolites of halquinol were identified by MS chromatogram (LCMS)
and the mass of the metabolites were calculated by Chemdraw 4 software. Perusal of
the literature revealed a similar report by Alhendi et al, (2000) Who worked on
clioquinol compound (a member of the same quinoline family which also follow the
same metabolic pathway) and found similar conjugated metabolites of clioquinol viz,
clioquinol sulfate and clioquinolglucuronide. Scanty reports are available regarding
the tissue distribution of metabolites of clioquinol i.e, 5-chloro-quinolin-8-ol sulfate,
5-chloro-quinolin-8-ol glucuronide except the report by (Horie et al., 1998).
The present finding was in accordance with Borries and Tulliez (1972) who
conducted radio labeled studies in rat and found that halquinol is excreted as glucoronide
conjugate in the bile similar to that of one of the closely related compound clioquinol
which essentially undergo glucuronidation in the intestine (Kotaki et al., 1983). In
addition , quinolines undergo aromatic hydroxylation and N-oxygenation based on region
selectivity among them (Dowers et al., 2004).
Some reports are available on the tissue distribution profile of halquinol and its
constituents in broiler chicks. The study conducted by Mushigeri et al. (2008) confirmed
the distribution pattern of the halquinol and its constituents i.e ,5,7-dichloroquinolin-8-ol
and chloroquinolin-8-ol in broiler chicken tissues.
Two last samples viz on days 30th and 40th had very high concentration of
halquinol as well as its metabolites mainly the 5-chloro-quinolin-8-ol glucuronide was
125
found indicating the cumulative behavior of halquinol and its metabolites. The present
finding is in accordance with the earlier studies by Swetha et al. (2009) who had also
reported the cumulative behavior of quinoline compounds in rats.
In the present study, the significant increase (p≤0.05) in concentrations of 5,7-
dichloroquinolin-8-ol in liver and kidney on each successive sampling days of 5, 10, 20,
30 and 40 in the three treatment groups were dose dependent. On day 40 of halquinol
exposure the tissue concentration of 5,7-dichloroquinolin-8-ol was relatively high in liver
and kidney in experimental birds which received halquinol @ 240 ppm. However,
maximum residue concentration of 5,7-dichloroquinolin-8-ol was present in breast
muscles (160.0 + 6.31ng.g-1 ) of birds belonging to 240 ppm group on day 40. Bound
residues may arise from incorporation of residues of the drug in to endogenous
compounds, chemical retention of proven drug or its metabolites in to macromolecules or
physical encapsulation in to tissue matrices (Beltran et al., 1985).The present finding was
in accordance with the findings of (Bories and Tulliez, 1972; Kotaki et al., 1983) who
also observed the cumulative behavior of quinoline compounds in chicken tissues.
The method developed in the present study was in accordance with earlier study
conducted by Jane et al. (2005) who had done the determination of nitrofuran metabolites
in poultry muscle and eggs by liquid chromatography-tandem mass spectrometry by LC-
MS/MS) with the similar method . The method focused on analytes which were known to
be produced by quinoline compounds. A simple pH-buffered sample extraction was
developed. The limit of detection (LOD) for the quantitatively validated analytes ranged
from 1 to 20 (ng.g-1).

126
In breast muscle samples, 5,7-dichloroquinolin-8-ol was not detected throughout
the experimental period in birds exposed to halquinol @ 60 and 120ppm in the present
study. However, residues were detected in 240 ppm group and the concentration was
found to be 160.4 + 6.51 ng.g-1 (Table 1). When compared to liver and kidney tissue (60
and 120 group), the mean residue concentration of 5,7-dichloroquinolin-8-ol and its
metabolite in breast muscles was relatively less despite the experimental birds were fed
halquinol @ 240ppm. This may be attributed to less vascular nature of skeletal muscles
when compared to highly perfused organs (liver and kidney) in the present study. The
results of the present study were supported by the earlier findings of (Ellis, 2004) who
carried out the analysis of metabolism of 3,S-Dinitro-otoluamide-C14 in Chickens with
slight modification method.
5.4 Tissue depletion of 5,7-dichloroquinolin-8-ol following withdrawal of halquinol
Following ‘a day’ after withdrawal of halquinol given either therapeutic dose (60
ppm) or extra-label dose (120 and 240 ppm), the concentrations of 5,7-dichloroquinolin-
8-ol fell significantly (p<0.05) in both liver and kidney tissues and their concentration
was not detectable (< 20 ng.g-1) on day ‘4’ in these tissues after withdrawal.
Relatively, the depletion of 5,7-dichloroquinolin-8-ol from breast muscles of
experimental birds fed halquinol @ 240 ppm was rapid when compared to other edible
tissues subjected to analysis in the present study. There are no reports of either
pharmacokinetic profile of halquinol or metabolic site (s) in poultry following extra -
vascular administration. Depletion of tissue residues depends on terminal elimination
phase of the drug in question. It has been reported that clioquinol, a quinoline compound
127
mostly metabolised to clioquinolglucuronide and sulfate and these metabolites were
excreted in urine and bile (Kotaki et al., 1983). Rapid depletion of 5,7-dichloroquinolin-
8-ol in all the treated birds might be due to combined effect of intestinal and/or hepatic
metabolism and urinary or biliary excretion in the present study.
However the depletion of the major metabolite viz 5-chloro-quinolin-8-ol
glucuronide was slow when compared to halquinol which supports the fact that the
metabolites of drug takes a day or two longer than the parent compound. In the
present study the concentration of 5-chloro-quinolin-8-ol glucuronide was not
detectable by day 5, a day longer than what required for halquinol.This finding was in
accordance with the earlier findings of (Boison and Keng ,1998) who had found
similar depletion studies of pencillin and its metabolites in bovine tissues using
LCMS.
5.5 Pre-slaughter withdrawal period
Fixation of meat withdrawal period (WP) requires quantification of tissue residues
of drug or its metabolites quantified according to specified analytical procedures as
specified from time to time by enforcement agencies. However, partly because of
complexity in structural chemistry of halquinol, tissue or plasma kinetics of individual
constituent molecules of halquinol has not been determined. In the present study, tissue
residues of 5,7-dichloroquinolin-8-ol was determined, however the concentration of 5-
chloroquinolin-8-ol was below the detection limit of assay system. Hence, the WPs for
halquinol in broiler chickens were made based on the tissue depletion profile of 5,7-
dichloroquinolin-8-ol and its major metabolite (5-chloro-quinolin-8-ol glucuronide )

128
obtained in the present study. The present study concords with earlier findings of Kao et
al. (2001) who had established the WP of nitrofuran in broiler chickens by following the
similar method.
By whatever procedures are applied, separate withdrawal periods (WPs) must be
estimated from each edible tissue and the longest of these individual tissues ,WPs then
becomes overall withdrawal period for the marketed product (Woodward et al., 2009).
US-FDA requires that log-linear kinetics and least square regression to be used to
calculate withdrawal time in edible tissue/s after deriving a statistical tolerance limit
(Reeves, 2010). An important feature of the statistical tool is that it takes account of both
acceptable daily intake (ADI) and kinetic behavior of the residue in muscle, fat, liver and
kidney Kirbi et al. (2005).
Generally, MRL and tolerance values are employed to derive WPs for marketed
veterinary medicines. Hence it can be derived by examining the time-dependent tissue
depletion preferably in key tissues (viz: liver, muscle, kidney and fat) against the MRL or
tolerance values (Martin et al., 2009). Upon extensive literature survey, it was found that
there is lack of information on either residue kinetic data or other parameters of
regulatory toxicological importance (viz: tolerance, ADI, NOAL, NOAEL) with respect
to halquinol or its constituent molecules. However, in the absence of MRL, particularly
keeping in view of developing countries where veterinary drug assessment and MRL
values are difficult to generate, FAO/WHO joint expert committee on food additives
(JECFA) has permitted the use of veterinary medicine products and trade at least based
on scientific approach or those that develop and use their own national standards.

129
However, there is no standard for halquinol residues in foods of animal origin set by
Agricultural and Processed Food Products Export Development Authority or by
Government of India under Prevention of Food Adulteration Act (GOI, 2004), thus,
complicating the fixation of WPs.
According to EMEA CVMP, 1996 guidance, regulatory standards require that
drugs be regulated on the basis of total residues. Total residues resulting from drug
administration to an animal consist of the parent drug and all metabolites, conjugates, and
residues bound to endogenous macromolecules. To ensure compliance with the
withdrawal period, an assay is needed to monitor total residues in the edible tissues.
However, it would be impractical to subject all known metabolites of a drug to analysis,
since some drugs can give rise to numerous metabolites (Woodward, 1992). Maximum
residue limits (MRLs) for a commodity are set for residues measured by a valid method
of analysis. This method may measure the chemical or a derivative of the chemical and
may include metabolites originating from the parent compound or other chemicals. In
some cases, the nominal concentration of the parent compound is calculated from the
measured concentration of a metabolite, but in other cases a derivative or metabolite is
used as a measure of the residue (Ellis, 2008). Therefore, the residue to which the MRL
applies to each chemical compound (Webber, 1979). Admittedly, all the indirect ways
employed for establishing pre-slaughter WP cannot guarantee absolutely that the poultry
meat is free from antimicrobial substance.
Halquinol is derived from a mixture of compounds obtained by the chlorination of
8-quinolinol and it is composed of 5,7-dichloroquinolin-8-ol (57–74%), 5-chloro-8-

130
quinolinol (23–40%), and 7-chloro-uinolinol-8-ol (not more than 3%), however the
stability of the third component is weak. In the present study, commercial product of
halquinol (Provimi Animal Nutrition India Pvt. Ltd. Bangalore) which was certified to
contain respectively 71.39 and 26.21 per cent of 5,7-dichloroquinolin-8-ol and 5-chloro-
quinolin-8-ol was used (Kaul and Lewis ,1965).
SUMMARY

VI. SUMMARY
Halquinol, a quinoline derivative is a mixture of 5,7-dichloroquinolin-8-ol, 5-
chloroquinolin-8-ol and 7-chloroquinolin-8-ol in the ratio of 57-74 : 23-40 : 3 per cent. It
possesses broad spectrum antibacterial, antifungal and antiprotozoal activity. It is used
extensively in India and other Asian countries to overcome common challenges of
modern poultry and swine farming like microbial infections and growth promotion
aspects. The present study was conducted in broiler chickens with the objectives (a) To
determine the distribution of halquinol and its metabolites in various tissues following
dietary inclusion in chickens (b) to study the halquinol as well as its metabolites in
various tissues of using NMR and other advanced techniques (c) to establish meat
withdrawal period of halquinol and its metabolites in chicken.
Four hundred day old Vencobb-400® broiler chicks were divided into four groups
of 100 chicks each. Group I served as untreated control and received standard poultry
diet without any antimicrobial substances in it, while experimental birds in group II (T1),
III (T2) and IV (T3) received standard poultry diet containing halquinol (Provimi Animal
Nutrition India Pvt. Ltd., Bangalore) @ 60, 120 and 240 ppm respectively, for a period of
40 days. Edible tissues viz: liver, kidney and breast muscles were collected by sacrificing
experimental birds (n=6 each) on day 5, 10, 20, 30 and 40 of halquinol exposure to
determine tissue distribution. The tissue depletion of halquinol and its metabolites from
the aforesaid edible tissues were determined by sacrificing the remaining birds (n=6
each) on day 1, 2, 3, 4, 5, 6, 7, 8, 9 and 10 following withdrawal of dietary exposure of
halquinol.

132
The tissue samples were subjected to liquid-liquid extraction using acetonitrile
and ethyl acetate respectively and the tissue clean-up and analytical procedures were
standardised to quantify 5,7-dichloroquinolin-8-ol, 5-chloroquinolin-8-ol and its main
metabolite 5-chloro-quinolin-8-ol glucuronide, with permissible limits of repeatability,
precision and sensitivity. However, the tissue concentration of 5-chloroquinolin-8-ol and
the other three metabolites (5-chloro-quinolin-8-ol sulfate, 5,7, dichloro-quinolin-8-ol
sulfate, 5,7, dichloro-quinolin-8-ol glucuronide) below the lower limit of detection. The
extraction recovery of 5,7-dichloroquinilin-8-ol was 89.5, 91.9 and 87.64 per cent for
liver, kidney and breast muscle tissues respectively.
High performance liquid chromatography (HPLC, Shimadzu Prominence, Japan)
system equipped with a reverse phase C18 column (250 x 4.6mm , particle size 5µm,
pH:1.5-11, Purospher Star RP-18e, Merck, Germany) as stationary phase and detection
was measured at 247 nm with scanning range of 200 to 400 nm. The mobile phase was
composed of 0.1% v/v orthophosphoric acid and acetonitrile at a ratio of 500:500
volumes and delivered at a flow rate of one ml per minute. The sensitivity of the assay
system to detect 5,7-dichloroquinolin-8-ol was 20 ng.g-1 tissue. There was a significant
(p≤0.05) increase in concentration of 5,7-dichloroquinolin-8-ol in liver and kidney
between each successive sampling days of 5, 10, 20, 30 and 40 in T1, T2 and T3 groups of
experimental birds exposed to halquinol. However, 5,7-dichloroquinolin-8-ol in breast
muscle samples belonging to T1 and T2 group were below the detection limit of assay,
while its concentration was significantly (p≤0.05) increased in experimental birds
belonging to T3 (240 ppm) group between each successive sampling days viz: 5, 10, 20,
30 and 40 of halquinol exposure. On termination of halquinol exposure @ 60 ppm (T1),

133
the concentration of 5,7-dichloroquinolin-8-ol in experimental birds which received
halquinol @ 60 ppm were high in liver and kidney tissues.
Consequent to withdrawal of halquinol exposure in all the treatment groups (T1,
T2 and T3) there was significant decrease (p≤0.05) in concentration of 5,7-
dichloroquinolin-8-ol in liver and kidney tissues on each successive sampling days and
reached to non-detectable levels on day ‘4’. The depletion of 5,7-dichloroquinolin-8-ol
from breast muscles of experimental birds exposed to halquinol @ 240 ppm was
relatively rapid and the residues were non-detectable on day ‘3’ following its withdrawal
from diet.
However the depletion of the major metabolite viz 5-chloro-quinolin-8-ol
glucuronide was slow when compared to halquinol which supports the fact that the
metabolites of drug takes a day or two longer than the parent compound.In the present
study the concentration of 5-chloro-quinolin-8-ol glucuronide was not detectable by
day 5, a day longer than what required for halquinol.Hence the withdrawal period for
halquinol and its metabolites in poultry was established as 5 days

BIBLIOGRAPHY
VII. BIBLIOGRAPHY
AERTS, M. M. L., HOGENBOOM, A. C. and BRINKMAN, U. A. T., 1995. Analytical
strategies for the screening of Veterinary drugs and their residues in edible
products. J. Chrom. B Biomed. Appl., 667: 1-40
ALHENDI, A.B., HOMEIDA ABD-ALGADIR, M. and GAILI El-SAMMANI., 2000.
Drug residues in broiler chickens fed with antibiotics in ration. Veterinarski Arch.,
70: 199-205
ANONYMOUS, 1976. The Merck Index, An encyclopedia of Chemicals and Drugs,
Edt.Windholz, M., Edn. 12th, Merck Research Laboratories, Merck & Co. Inc.,
White house Station, NJ., USA, pp 600
ANONYMOUS, 1980. British Pharmacopoeia. Her Majesty’s Stationary office :London,
pp 218-219
ANONYMOUS, 1994. British Pharmaceutical Codex, Edn. 12th, London,U.K. pp 405-
406
ANONYMOUS, 1999. Martindale : The Complete Drug Reference, Edt.Parfitt, K. Edn.
32ndIn: Antibacterials, Pharmaceutical Press, London, pp 215
ANONYMOUS, 2005. The Merck Veterinary Manual, Edt.Cynthiakhan and Scottline,
Edn. 9th,In: Antibacterial Agents, Merck & Co., Inc. White house Station, N.J.,
USA, pp 2098
ANONYMOUS, 2006. Clarke’s Analysis of Drugs and Poisons, London: Pharmaceutical
Press, Electronic Version.
ARMSON, A., MELONI, B. P., REYNOLDSON, J. A. and THOMPSON, R. C. A.,
1999. Assessment of drugs against Cryptosporidium parvum using a simple in
vitro screening method. FEMS Microbiol. Lett., 178: 227-233

135
AUSTIN, B. MORGAN, D. A. and ALDERMAN, D. J., 1981. Comparison of
antimicrobial agents for control of vibriosis in marine fish. Aquaculture, 26:1-12
AUSTIN, B., JOHNSON, C. and ALDERMAN, D. J., 1982. Evaluation of substituted
quinolines for the control of vibriosis in turbot (Scophthalmusmaximus).
Aquaculture, 29: 227-239
BAXI, K. K., SODHI, H. S., CHHABRA, R. C. and SINGH, A., 1973. Efficacy of
Diodin, Strinacin and quixalin in caprinecoccidiosis.Indian Vet. J., 50: 756-758
BELTRAN, J. L., PRAT, M. D. and CODONY, R., 1985. Interaction of 5,7-dichloro-2-
methyl-8-hydroxyquinoline with ionic micelles. Talanta, 42: 1987-1997
BLACK, W. D., 1984. The use of antimicrobial drugs in agriculture. Can. J. Physiol.
Pharmacol., 623: 1044-1048
BOISON, J. O. and KENG, L. J. Y., 1998. Multiresidue liquid chromatography method
for determining residues of mono and dibasic penicillins in bovine muscle tissue.
J. AOAC Int., 81: 1113-1120
BONDIOLOTTI, G. P., POLLERA, C., PIROLA, R. and BAREGGI, S. R., 2006.
Determination of 5-Chloro-7-iodo-8-quinolinol (clioquinol) in plasma and tissues
of hamsters by high-performance liquid chromatography and electrochemical
detection. J. Chromatogr. B., 837: 87-91
BORIES, G. F and TULLIEZ, J. E., 1972. Metabolism of mono-and dichloro hydroxyl
quinolines Cl36 in the rat and calf. J. Agric. Food Chem., 20: 417-420
BOTSOGLOU, N. A. and FLETOURIS, D. J., 2001. Drug Residues In Foods, In:
Antimicrobial growth promoters. Marcel Dekker, New York. pp 189-190
BURROWS, D., 1975. Contact dermatitis in animal feed mill workers. Br. J. Dermatol.,
92: 167-169

136
CARDOSO, M. A. B., FLEMMING, J. S and FLEMMING, F. F., 2002. Utilization of
halquinol as a growth promoter and coadjuvant on coccidiosis control in broilers.
Arch. Vet. Sci., 7: 11-19
CERNIGLIA, C. E. and KOTARSKI, S., 1998. Evaluation of veterinary drug residues in
food for their potential to affect human intestinal microflora. Regul. Toxicol.
Pharmacol., 29: 238-261
CERNIGLIA, C. E. and KOTARSKI, S., 2005. Approaches in the safety evaluations of
Veterinary antimicrobial agents in food to determine the effects on the human
intestinal microflora. J. Vet. Pharmacol. Therap., 28: 3-20
CINQUINA, A. L., ROBERTI, P., GIANETTI, L., LONGO, F., DRAISCI, R.,
FAGIOLO, A. and BRIZIOLI, N. R., 2003. Determination of enrofloxacin and its
metabolite.ciprofloxacin in goat milk by high-performance liquid chromatograph
with diode-array detection: optimization and validation. J. Chromatogr. A., 987:
221-226
CLARKE, E. G. C., 1978. Isolation and identification of Drugs in Pharmaceuticals, body
fluids and post-mortem materials.In: Analytical and Toxicological Data,
Pharmaceutical press, London, pp 1046
COOPER, A. D., CREASER, C. S., FARRINGTON, W. H. H., TARBIN, J. A. and
SHEARER, G., 1995. Development of multi-residue methodology for the HPLC
determination of Veterinary drugs in animal tissues.Food Add.Contam., 12: 167-
176
COSGROVE, R. F., 1977. Rapid microbiological assay for chlorhydroxyquinoline that
uses a cryogenically stored inoculum. Antimicrob. Agents Chemother., 11: 848-
851
COSGROVE, R. F and BAINES, S., 1978. In vitro activity of chlorohydroxyquinoline
against mycoplasma species.Antimicrob. AgentsChemother., 13: 540-541
137
COSGROVE, R. F. and FORSTER, T. C., 1980. Sensitivity testing using halquinol discs.
Vet. Rec., 107: 310-311
COSGROVE, R. F., FORSTER, T. C., JONES, G. T. and PICKLES, R. W., 1981. A
study of fluctuations in Escherichia coli sensitivity patterns from pigs fed a
halquinol supplemented diet. J. Vet. Pharmacol. Ther., 4: 39-42
CROUBLES, S., DAESELAIRE, DEBAERE, S., DEBACKER, P. and COURTHEYN,
D., 2004. Feed and drug residues. In: Encyclopedia of meat sciences. Edt: Jansen,
Devine, C. and Dikemann, M., Elsevier, London, U.K., pp 1172-1187
DAMAYANTHI, A., NASAR, S. S and PUDJIADI, S. H., 1973. Quixalin in the
treatment of dysenteriformdiarrhoea. Paediatr. Indones., 13: 98-102
DONOGHUE, D. J., 2003. Antibiotic residues in poultry tissues and eggs: Human health
concerns. Poult. Sci., 82: 618-621
DOWERS, T. S., ROCK, D. A., ROCK, D. A.(Jr.)., PERKINS, B. N. S. and JONES, J.
P., 2004. An analysis of the regioselectivity of aromatic hydroxylation and N-
oxygenation by cytochrome P450 enzymes. Am. Chem. Soc. Phamacol. Exp. Ther.,
32: 328-332
DUNN, W.B., 2008. Current trends and future requirements for the mass spectrometric
investigation of microbial, mammalian and plant metabolomes. Phys.
Biol., 5:408-423
ELLENRIEDER, V. M. and SENSCH, K. H., 1972. The influence of chlorinated
oxyquinoline derivatives on anaerobic micro-organisms. Arzneim. Forsch., 22:
908-909
ELLIS, R., 2004. U.S. FDA Regulatory Approach for Veterinary Drugs. JointFAO ⁄WHO
technical workshop on Vetrinary Drugs without ADI ⁄MRL.Food and Drug
Administration and World Health Organization, Geneva.

138
ELLIS, R. L., 2008. Development of veterinary drug residue control by codex
alimentarius commission: a review. Food Addt. Contam., 25: 1432-1438
EMEA CVMP, 1996. Note for guidance: Practical approach towards harmonization of
withdrawal periods. EMEA.CVMP/036/95-Final
FAO, 2005. Food and Agriculture Organization, UN. http://www.fao.org/DOCREP/
ARTICLE/AGRIPPA/555_EN.HTM. Last accessed 16 September 2005.
FIEDLER, H. and KABEN, U., 1966. Antimycotic and antibacterial action of
8 quinolinols and nicotinic acid esters. Pharmazie, 21: 233-238
FORSTER, T. C. and DUGGAN, G., 1974. Proceedings of the 3rd
international congress
of the international pig veterinary society. Lyon, France, pp 28-32
FREEMAN, F. M. and HESELTINE, W. W., 1963.Absorption of chlorhydroxyquinoline.
Nature, 199: 703-704
GADIAN, D.G., 1995. NMR and its application to living systems. Oxford University
Press, Oxford, 185: 265-267
GAD, S. C., 2004.Safety pharmacology in pharmaceutical development and
approval.CRC press, USA, pp 125
GOI, 2004: Government of India, Prevention of Food Adulteration Act, 2004.
HANSON, O. and HERXHEIMER, O., 1981. Neuropathy and optic atrophy associated
with halquinol. Lancet, 1: 450
HAYAKAWA, K., KITADA, K., HAMAKI, M. and MIYAZAKI, M., 1982. High
Performance Liquid Chromatographic determination of clioquinol and its
conjugates in biological materials. J. Chromatogr., 9229: 159-165
HEAD, M. J., 1974. Halquinol for growing pigs. Proc. Third Int. Pig Vet. Soc. Congress,
June 12-12, Lyon, pp 1-9

139
HESELTINE, W. W. and CAMPBELL, P. J., 1960. Laboratory studies on
chlorhydroxyquinoline, J. Trop. Med. Hyg., 63: 163
HESELTINE, W. W. and FREEMAN, F. M., 1959. Some pharmacological and
microbiological properties of chlorhydroxyquinoline and related compounds. J.
Pharma. Pharmacol., 11: 169-174
HORIE, M., YOSHIDA, T., SAITO, K. and NAKAZAWA, H., 1998. Rapid screening
method for residual Veterinary drugs in meat and fish by HPLC.J. Food Hyg. Soc.
Japan, 39: 383-389
JANE, K., FINZI, JOSE, LUIZDONATO, MAURO SUCUPIRA and GILBERTO DE
NUCCI, 2005. Determination of nitrofuran metabolites in poultry muscle and
eggs by liquid chromatography-tandem mass spectrometry. J. Chromatogr. A.,
939: 49
KAO, Y. M., CHANG, M. H., CHENG, C. C. and CHOU, S. S., 2001.Multiresidue
determination of veterinary drugs in chicken and swine muscles by high
performance liquid chromatography. J.Food Drug Anal., 9: 84-95
KAUL, C. L and LEWIS, J. J., 1965. Observations on the pharmacology of halquinol. J.
Pharm. Pharmacol., 17: 434-439
KAUR, K., RANDHAWA, S. S. and RANDHAWA, S. S., 2002. Comparative clinical
efficacy of some antimicrobials in colibacillotic neonatal calves. J. Vet. Med., 22:
116-117
KAVITHARANI, B., RADHAKRISHNA, P. M., RAJEEVALOCHANA,
SHIVAKUMAR and MOHAN, B., 2004. Determination of acute oral toxicity of
halquinol (chlorhydroxyquinoline) in broilers. National Symposium on Latest
Approaches and Biotechnological Tools for Health Management of Farm Animals
and Annual Convention of the Indian Society for Veterinary Medicine, Bangalore,
India, pp 30

140
KIRBIS, A., MARINSEK, J. and FLAJS, V. C., 2005. Introduction of the HPLC method
for the determination of quinoline residues in various muscle tissues. Biomed.
Chromatogr., 19: 259-265
KOTAKI,H., YAMAMURA,Y.,TANIMURA,Y., SAITOH,Y., NAKAGAWA, F. and
TAMURA, Z., 1983. Intestinal absorption and metabolism of clioquinolin the rat.
J. Pharm. Dyan., 6: 881-887
KUKANICH, B., GING, R., WEBB,A., CRAIGMILL, A. and RIVIERE, J. 2005. Effect
of formulation and route of administration on tissue residues and withdrawal
times. J. Am. Vet. Med. Assoc., 227: 1574–1577
LAMY, L., 1964. A comparative experimental study of the activity of certain
hydroxyquinoline derivatives on multiplication of Entamoebahistolytica cultures
and associated bacteria. Ann. Inst. Pasteur Paris, 107: 98-108
LIAN, Y., DENTON, M. B. and BATES, R. B., 1998. Stability studies of tetracycline in
methanol solution. J. Chromatogr. A., 827: 45-55
MALA, JAYAMANNE., INGRID, GRANELLI., AGNETAT and JERNBERG, 2010
Development of a two-dimensional liquid chromatography system for isolation of
drug metabolites. J. Pharmacobiodyn. 12:371-7
MARTIN, B.S., CORNEJO, J., LAPIERRE, L., IRAGU, D., PEREZ, F., HIDALGO, H.
and ANDRE, F., 2009. Withdrawal time of four pharmaceutical formulations of
enrofloxacin in poultry according to different maximum residues limits. J. Vet.
Pharamcol. Ther., 33:246-251
MATHEW, T., 1990. Sensitivity pattern of chlorohydroxyquinoline (CHQ). Poult.
Guide, 27: 25-36
MINDER, H. P., MERRITT, A. M., and CHALUPA, W., 1980. In vitro fermentation of
feces from normal and chronically diarrheal horses. Am. J. Vet. Res., 41: 564
141
MUSHIGERI, S. B., SAHA, S., SOMASHEKAR, B. N., NISCHAL, K. and
RADHAKRISHNA, P. M., 2008. Halquinol modulated growth, physiology and
protein profile and halquinol residue with drawl study in the Indian major Carp.
Catlacatla (Hamilton). J. Basic Clin. Physiol. Pharmacol., 19: 15-27
MUSIOL, R., JAMPILEK, J., NAYCZ, J.E., PESKO, M., CARROLL, J., KRALOVA,
K., VEJSOVA, M., MAHONY, J.O., COFFEY, A., MROZEK, A. and
POLANSKI, J., 2010. Investigating the activity spectrum for ring-substituted 8-
hydroxyquinolines. Molecules, 15: 288-304
NEOGY, N. K. and NANDY, P. K., 1965. Spectrum of activity of quixalin against
enteropathogenic bacteria. Bull. Calcutta School Trop. Med., 23: 131-132
NISCHAL, K., SHARADAMMA, C., KODAGANUR, ABHILEKHA, P.,
SARMISTHA, S., RADHAKRISHNA, M. and PALLIPADI., 2012. RP-HPLC
method for quantitative estimation of Halquinol in pharmaceutical dosage forms.
Eurasian J Anal Chem 7(1): 7-12
OBRIEN, K., 1981. Treatment of chronic equine diarrhoea with halquinol. Vet. Rec.,
109: 61
OWEN, T., 2000. Fundamentals of modern UV-visible spectroscopy, Agilent
Technologies, Germany.
PAVITHRA, B. H., JAYAKUMAR, K., BHAT, A., MOHAN, K., PRAKASH, N. and
SHUAIB, A. H., 2011. Determination of 5,7-dichloroquinolin-8-ol and 5-
chloroquinolin-8-ol in bulk drug powder and pharmaceutical preparation by TLC.
Chronicles Young Scientist, 2: 47-50
POINTON, A. M., 1989. Compylobacter associated intestinal pathology in pigs. Aust.
Vet. J., 66: 90-91
READETT, M. D., 1965. Halquinol in dermatology. Br. Med. J.,77: 593-595
142
REEVES, P. T., 2010. Drug residues. In: Comparative and veterinary pharmacology, Edt.
Springer Publications, London, pp 217
REIG, M. and TOLDRA, F., 2008. Growth promoters. In: Handbook of Muscle Foods
Analysis., Edt. CRC Press, Boca Raton, EL, USA, pp 200
RESURRECCION, A. V. A. and GALVEZ, C. F., 1999. Will consumers buy irradiated
beef ?. Food Technol., 53: 52-55
RIVIERE, J. E. and SUNDLOF, S. F., 2001.Chemical residues in tissues of food animals.
In: Veterinary Pharmacology and Therapeutics, Edn.8th, Edt. Adams,H. R., First
Indian Reprint, Replika Press Pvt. Ltd., New Delhi, pp 1166-1174
ROSEN, G. D., 1996. The nutritional effects of tetracyclines in broiler feeds.
Proceedings of the World Poultry Science Society, New Delhi, pp 141
SADANAND M, GANESH M, RADHAKRISHNA P M (2006). A validated method for
Halquinol extraction from chicken liver matrix for residual studies employing
HPLC. JBCPP 17:133.
SATOSKAR, R. S. and BHANDARKAR, S. D., 1988. Chemotherapy of amoebiasis.
In: Pharmacology and Pharmacotherapeutics. Edn. 11th, Popular Prakashan,
Bombay, pp 663-673
SHIVAKUMAR, KAVITHARANI, B. D., RAJEEVALOCHANA, BRIJMOHAN and
RADHAKRISHNA, P. M., 2004. Effects of acute oral toxicity of halquinol in
poultry broilers. National Symposium on Good Laboratory Practice and
Regulatory Issues and 23rd
Annual Conference of Society of Toxicology, India,
October 28-30, 2004.
SINGH, K. B., 1979. Treatment of balantidiosis in bovines. Livestock Adviser, 4: 13-16
STEWART, G. T., 1958. Fungus diseases and their treatment, Edt. Reddell., R. W. and
Stemart, G. T., London, Butterworth.
143
STUART, B., 2004. Infrared spectroscopy; Fundamentals and applications. John Wiley
& Sons, Inc., USA.
SWETHA, R., JAYAKUMAR, K., SHRIDHAR, N. B., SHUAIB, A. H. and SUHAS, Y.
S., 2005a. Effect of halquinol on humoral and cell mediated immune response in
female rats: National Seminar on Veterinary Pharmacology in ost WTO era and
5th
Annual Conference of ISVPT, November 24-26th , 2005, pp 96
SWETHA, R., JAYAKUMAR, K., SHRIDHAR, N. B., SHUAIB, A. H., SUHAS, Y. S.,
and SUGUNA RAO., 2005b. Thyrotoxicity induced by halquinol in rats. National
Seminar on Veterinary Pharmacology in post WTO era and 5th
Annual conference
of ISVPT, November 24-26th 2005, pp 99
SWETHA, R., JAYAKUMAR, K., SUGUNA RAO., SHRIDHAR, N. B., NARAYANA
SWAMY. M. and SHILPA, V. T., 2006. Organ directed toxicity of halquinol in a
repeated dose 28 day oral toxicity study in male rats. J. Vet. Pharmacol. Toxicol.,
5: 26-31
SWETHA, R., JAYAKUMAR, K., NARAYANASWAMY, M., SHRIDHAR, N. B.,
JAGADEESH, S. and SUGUNA RAO., 2009. Organ directed toxicity of
halquinol in a repeated dose 28 day oral toxicity study in female rats. Indian J.
Pharmacol., 39: 97-102
SWICK, R. A., 1996. Role of growth promotants in poultry and swine feed. ASA
Technical Bull., pp 1-9
TRANTER, R. W., 1968. The in vitro activity of halquinol against Vibrio cholerae. J.
Trop. Med. Hyg., 71: 146-149

144
VERDON, E., COUEDOR, P., ROUDAUT, B. and SANDERS, P., 2005. Multiresidue
method for simultaneous determination of ten quinoline antibacterial residues in
multimatrix/multispecies animal tissues by liquid chromatography with
fluorescence detection: Single laboratory validation study. J. AOAC Int., 88:
1179-1192
VERMA, B. B., 1982. Effect of treatment of chronic hepatitis of cattle. Indian Vet. J., 59:
905-908
VILLAS-BOAS, S.G., MAS, S., ÅKESSON, M., SMEDSGAARD, J., NIELSEN, J.,
2005. Mass spectrometry in metabolome analysis. Mass Spectrom Rev., 24: 613-
646
VINAYAVEKHIN, N., HOMAN. E.A, SAGHATELIAN., 2009. A exploring disease
through metabolomics. Am.Chem Soic. Chem. Biol., 5: 91–103
WANG, S., ZHANG, H. Y., DUAN, Z. J., KENNEDY, I., 2006. Analysis of
sulphonamide residues in edible animal products. Rev. Food Add. Contam., 23:
362-384
WEBBER, N. E., 1979. Bioavailability of bound residues. FDA By. Line, 9: 287-294
WELCH, J. G., O’CONNOR, I. J. and VANDERNOOT, G. W., 1965. Effect of feeding
chorhydroxyquinoline to fattening lambs. J. Anim. Sci., 24: 38-40
WHO, 1989: World health organization. Evaluation of certain veterinary drug residues in
food. 34th report of the joint FAO/WHO expert committee on food additives.
WHO technical Series No.788.
WOODWARD, K. N., Hutson, D. H., Hawkins, D. R., Paulson, G. D and Struble, C.B.,
1992. In: Xenobiotics and food-producing animals. Edt. American Chemical
Society, Washington, DC.

145
WOODWARD, L. S. 2009. Pharmacovigilance- Adverse reactions to veterinary
medicinal products. Blackwell Publishing Ltd., U.K. pp 554-555
WOJTOWICZ., E. J., 1984 .Reverse-phase high-performance liquid chromatographic
determination of halogenated 8-hydroxyquinoline compounds in pharmaceuticals
and bulk drugs. J Pharm Sci 73:1430-1431.

ABSTRACT

146
VIII. ABSTRACT
Halquinol is a quinoline derivative, a mixture of 5,7-dichloroquinolin-8-ol,
5-chloroquinolin-8-ol and 7-chloroquinolin-8-ol. The present study was carried out in
broiler chickens to determine the distribution of halquinol and its metabolites into edible
tissues and to establish pre-slaughter withdrawal period for meat following dietary
inclusion of halquinol. Experimental birds consisted of 400, day-old broiler chicks
(Vencobb-400). They were divided into four groups of 100 chicks each. Group I birds
served as control (C) and received poultry diet without any antimicrobial substances in it,
while experimental birds in group II (T1), III (T2), IV (T3) received poultry diet
containing halquinol @ 60, 120 and 240 ppm respectively for a period of 40 days. Edible
tissues samples viz: liver, kidney and breast muscles were collected by sacrificing
experimental birds (n=6) on day 5, 10, 20, 30 and 40 of the halquinol exposure through
diet and at 2 h and on day 1, 2, 3, 4, 5, 6, 7, 8, 9 and 10 following withdrawal of
halquinol.
The tissue clean-up and analytical procedures were standardized to quantify 5,7-
dichloroquinolin-8-ol and 5-chloroquinolin-8-ol by employing Liquid Chromatography
Mass Spectroscopy (LCMS) with permissible limits of repeatability, precision and
sensitivity. The detection limit of the assay system for both the constituent molecules was
20 ng.g-1tissue. There was significant (p≤0.05) increase in concentration of 5,7-
dichloroquinolin-8-ol and its metabolite viz 5-chloro-quinolin-8-ol glucuronide in liver
and kidney between each successive sampling days.
There was a significant decrease (p≤0.05) in concentration of 5,7-
dichloroquinolin-8-ol and 5-chloro-quinolin-8-ol glucuronide, in liver and kidney
tissues on each successive sampling days following withdrawal of halquinol and reached
to non-detectable levels on day ‘4’ and 5 respectively, following withdrawal of halquinol
exposure in all the treatment groups (T1, T2 and T3).
Therefore it is suggested to adopt four days pre-slaughter withdrawal period in
broiler chickens when halquinol being used as growth promoter.