structure and electrical properties of ba(in nb tix … 37 04.pdfstructure and electrical properties...
TRANSCRIPT

Processing and Application of Ceramics 11 [3] (2017) 191–200
https://doi.org/10.2298/PAC1703191C
Structure and electrical properties of Ba(In0.5Nb0.5)1-x
TixO3 ceramics
Kumar P. Chandra1, Ajit R. Kulkarni2, Priyanka3, Kamal Prasad3,∗
1Department of Physics, S.M. College, Bhagalpur - 812001, India2Department of Metallurgical Engineering and Materials Science, Indian Institute of Technology,
Mumbai - 400076, India3Materials Research Laboratory, University Department of Physics, T. M. Bhagalpur University,
Bhagalpur - 812007, India
Received 8 April 2017; Received in revised form 25 July 2017; Accepted 23 August 2017
Abstract
Lead-free Ba(In0.5Nb0.5)1-x
TixO3 (0 ≤ x ≤ 1) ceramics was synthesized using a standard high temperature solid-state reaction method and sintered at 1400 °C/4 h (except the pure BaTiO3 which was sintered at 1300 °C/4 h).The ceramics was characterized by X-ray diffraction, scanning electron microscopy, dielectric, impedance andAC conductivity studies. The crystal structure of the compounds was found to be cubic (with the space groupPm3m) for x = 0, 0.25 and 0.50 and tetragonal (P4/mmm) for x = 0.75 and 1.0. Increase in Ti-content in theceramic samples leads to the decrease in unit cell volume while the values of real as well as imaginary partsof dielectric constant and AC conductivity increase. Complex impedance spectroscopy analysis indicated thenegative temperature coefficient of resistance. AC conductivity data supported the hopping type of conductionin the system and obeyed Jonscher’s power law. The real and imaginary parts of dielectric constant and ACconductivity data fit excellently well with an exponential function.
Keywords: Ba(In0.5Nb0.5)1-x
TixO3, perovskite structure, electrical and dielectric properties
I. Introduction
Lead-bearing compounds with perovskite ABO3-type structures are widely used for capacitor, pyroelec-tric, piezoelectric, electro-optic, magneto-electric ap-plications. Currently, immense interest is being shownworldwide by the academia as well as industries eithereliminate or minimize the use of hazardous substancessuch as lead in the electrical/electronic equipment dueto the fact that electronic gadgets containing lead are notrecyclable and are listed as toxic. Besides, different prin-ciples of chemistry (e.g. ionic radii, valence state, toler-ance factor, etc.) when combined together result in for-mulation of numerous complex perovskite oxides hav-ing the mixed-cation formula such as (A′A′′ . . . )BO3,A(B′B′′ . . . )O3 or (A′A′′ . . . )(B′B′′ . . . )O3 with varietyof interesting properties which find many industrial ap-plications [1–5]. It has been observed that modifica-tions either at A- or B-site are very important in tai-loring various properties of complex perovskites. Thus,
∗Corresponding author: tel/fax: +91 641 2501699,e-mail: [email protected]
the size difference of pseudo-cation (A′A′′ . . . )2+ and/or(B′B′′ . . . )4+ and difference of their valance states playimportant role.
BaTiO3 is a well-known ferroelectric materialwith perovskite type tetragonal (P4/mmm) structure(tolerance factor 0.9972). It has found widespreadapplications as a capacitor material because of its highpermittivity (∼103). There are enormous literature dataon the homovalent, heterovalent ions doped BaTiO3either at Ba and/or Ti-site or at both sites, and solidsolution of BaTiO3 with other perovskite materials,which showed promising electrical behaviour [6–12].On the other hand, Ba(In0.5Nb0.5)O3 with cubic (Pm3m)structure [13,14] (tolerance factors: 0.9934) is verystable material with low dielectric constant (∼45) andloss tangent (∼ 10−2) and it has been considered asa good candidate for microwave applications [15].Furthermore, with the aim of getting lead-free com-pounds suitable for device application, attempts havebeen made to modify Ti-site by the pseudo-tetravalentcation (B,Nb)4+, where B is trivalent ion. Thus, theelectrical properties of a number of solid-solutions,such as: Ba(Fe0.5Ta0.5)O3 [8], Ba(Fe0.5Nb0.5)O3
191
K.P. Chandra et al. / Processing and Application of Ceramics 11 [3] (2017) 191–200
[16–19], Ba(Sm0.5Nb0.5)O3 [20], Ba(Y0.5Nb0.5)O3[21], Ba(Bi0.5Ta0.5)O3 [22], Ba(Co0.5W0.5)O3 [23],Ba(Zn0.5W0.5)O3 [24], with BaTiO3 have been re-ported recently. Also, extensive literature surveysuggested that no attempt has been made so far on (1-x)Ba(In0.5Nb0.5)O3–x BaTiO3 (0 ≤ x ≤ 1) solid-solutions.Both BaTiO3 and Ba(In0.5Nb0.5)O3 are describedas typical perovskite-type compounds and could beexpected to form solid solutions. Therefore, it is ofgreat interest to study the structural and electrical prop-erties of Ba(In0.5Nb0.5)1-xTixO3 ceramics. Accordingly,studies on the structure and electrical properties ofBa(In0.5Nb0.5)1-xTixO3 (abbreviated hereafter as BINT)ceramics with different composition (x = 0, 0.25, 0.50,0.75 and 1.0) were performed in this work. Further,an attempt was made to understand the dielectricrelaxation and electrical conduction mechanism inthe system using complex impedance spectroscopytechnique. Also, a mathematical model was proposedto explain the real and imaginary parts of dielectricconstant and AC conductivity data.
II. Materials and methods
Polycrystalline Ba(In0.5Nb0.5)1-xTixO3 samples(where x = 0, 0.25, 0.50, 0.75 and 1.0) samples wereprepared using BaCO3, In2O3, Nb2O5 and TiO2 (withAR grade 99.9%, Merck) in proper stoichiometricproportions and by single step solid-state reactionprocess according to the thermo-chemical reaction:
BaCO3 +
(
1 − x
4
)
In2O3 +
(
1 − x
4
)
Nb2O5 + xTiO2∆−−−→
Ba(B0.5Nb0.5)1−xTixO3 + CO2(g) ↑
The reaction was carried out at 1350 °C for 5 h in airatmosphere, except for BaTiO3 (x = 1.0) which waskept at 1250 °C for 5 h. The calcined powders were thenground and uniaxially pressed at ∼650 MPa to form pel-
lets having thickness of 1.5–2 mm and diameter of 9.5–10 mm. Polyvinyl alcohol (PVA) was used as binder.The pellets were subsequently sintered at 1400 °C/4 h,except for the pure BaTiO3 for which it was 1300 °C/4 h.The completion of reactions and the formation of de-sired compounds were checked by X-ray diffraction(XRD) technique. The weights of the samples weremonitored before and after the heat treatments. Themaximum difference was noted to be about 1.08 mg forthe total of 10 g of the samples. Therefore, the composi-tions of the samples were considered to be the same asthe initial one.
The crystal structure was identified using XRD anal-yses with CuKα radiation (X’PERT-PRO, Pan Analyt-ical) for all the sintered specimens. The XRD data forRietveld analysis were collected over the range of 2θ =25–80° with a step size of 0.02° and a count time of2 s. The FullProf program was used for Rietveld struc-tural refinement. The Bragg peaks were modelled withpseudo-Voigt function and the backgrounds were esti-mated by linear interpolation between selected back-ground points. The microstructure of all the specimenswas obtained by a scanning electron microscopy (SEMHitachi S-3400N, Japan) on the fractured surface. Forelectrical characterization, the samples were polishedand air drying silver paste (SPI, Structure Probe, Inc.)was applied on both surfaces of the samples to serveas electrodes. The real and imaginary parts of the elec-trical impedance were measured as a function of fre-quency (1 Hz ≤ f ≤ 1 MHz) between 50 and 450 °Cat a heating rate of 1 °C/min with a computer inter-faced Solartron SI1260 impedance/gain phase analyser.AC conductivity data were calculated using the relationσAC = 2π · f · ε0 · ε
′ · tan δ, where f is frequency, ε′
is the real part of the dielectric constant and tan δ isdielectric loss. Further, the temperature coefficient ofcapacitance (TCC) which is an important parameter forthe low-temperature dependence of capacitance was ob-tained using the relation:
Table 1. The crystal data and refinement factors of Ba(In0.5Nb0.5)1-x
TixO3 ceramics (x = 0, 0.25, 0.50, 0.75 and 1.0) ceramicsobtained from X-ray powder diffraction data
Composition, x 0 0.25 0.5 0.75 1Crystal System Cubic Cubic Cubic Tetragonal TetragonalSpace group Pm3m Pm3m Pm3m P4/mmm P4/mmm
a [Å] 4.1413 4.1093 4.0693 4.0172 3.9912c [Å] - - - 4.0214 4.0264V [Å3] 71.0272 69.3912 67.3819 64.8982 64.1401Profile factor, Rp 25.4 26.8 27.2 23.5 37.1Weighted profile factor, Rwp 23.7 25.3 25.5 25.2 37.9Expected weighted profile factor, Rexp 14.2 14.4 15.3 16.2 16.6Bragg factor, RB 0.223×10⁻³ 0.239×10⁻³ 0.492×10⁻³ 0.0810 0.0242Crystallographic RF factor 0.210×10⁻³ 0.330×10⁻³ 0.661×10⁻³ 0.166 0.0259χ2 2.778 3.084 2.780 2.42 5.22Durbin-Watson statistics, d 0.7425 0.6962 0.8244 1.8348 0.6712QD 1.8980 1.8960 1.8966 1.8584 1.9082Goodness of fit S 1.6690 1.7569 1.6667 1.5556 2.28
192

K.P. Chandra et al. / Processing and Application of Ceramics 11 [3] (2017) 191–200
Figure 1. (a) Rietveld refined patterns of Ba(In0.5Nb0.5)1-x
TixO3 ceramics (symbols represent the observed data points, solidlines their Rietveld fit, vertical lines their Bragg positions and lower solid lines their difference between the
observed-calculated data) and (b) X-ray diffraction patterns of selected regions (2θ range 30°–32°)
TCC =ε′
T− ε′
RT
ε′RT
· 100 (1)
where ε′T and ε′RT are real parts of dielectric constant atelevated and room temperature, respectively.
III. Results and discussion
Rietveld refinement of XRD data ofBa(In0.5Nb0.5)1-xTixO3 (BINT, where x = 0, 0.25,0.50, 0.75 and 1.0) were carried out to see the effect ofpseudo-cation (In0.5
3+,Nb0.55+)4+ addition to BaTiO3
on its unit cell structure. Figure 1a shows the observed,calculated and difference profiles for the BINT ceramicsafter the refinements. The appearance of single andsharp peaks of perovskite phase and no other peaks ofany oxides and/or carbonates indicated the formationof single phase compounds. It can also be seen thatthe profiles for the observed and calculated ones areperfectly matching. The adopted profile fitting proce-dure was minimizing the χ2 function. The crystal dataand refinement parameters of the BINT are depictedin Table 1. The compounds show a single cubic phaseformation with space group Pm3m except for x = 0.75and 1.0 for which the unit cell structure comes out tobe tetragonal (P4/mmm). Therefore, the addition ofpseudo-cation (In0.5
3+,Nb0.55+)4+ to BaTiO3 changes
the basic unit cell structure of the solid-solutions forx ≥ 0.75. This could be due to the highly tolerant
Ba(In0.5Nb0.5)O3 structure (tolerance factor ∼1). How-ever, shifting in the peak positions and changes in theintensities of peaks could be observed with the increasein the value of x. The shift in diffraction peaks towardshigher Bragg’s angle indicated the decrease in latticeparameters with increasing x (Fig. 1b). Furthermore,it is observed that the unit cell volume decreases withincreasing x, which could be due to the partial replace-ment of pseudo-cation (In0.5
3+,Nb0.55+)4+ with Ti4+. A
second order polynomial fitting to concentration (x)dependence of unit cell volume data yielded a relation:
V = 71.20422 − 8.77134 · x + 1.46446 · x2 (2)
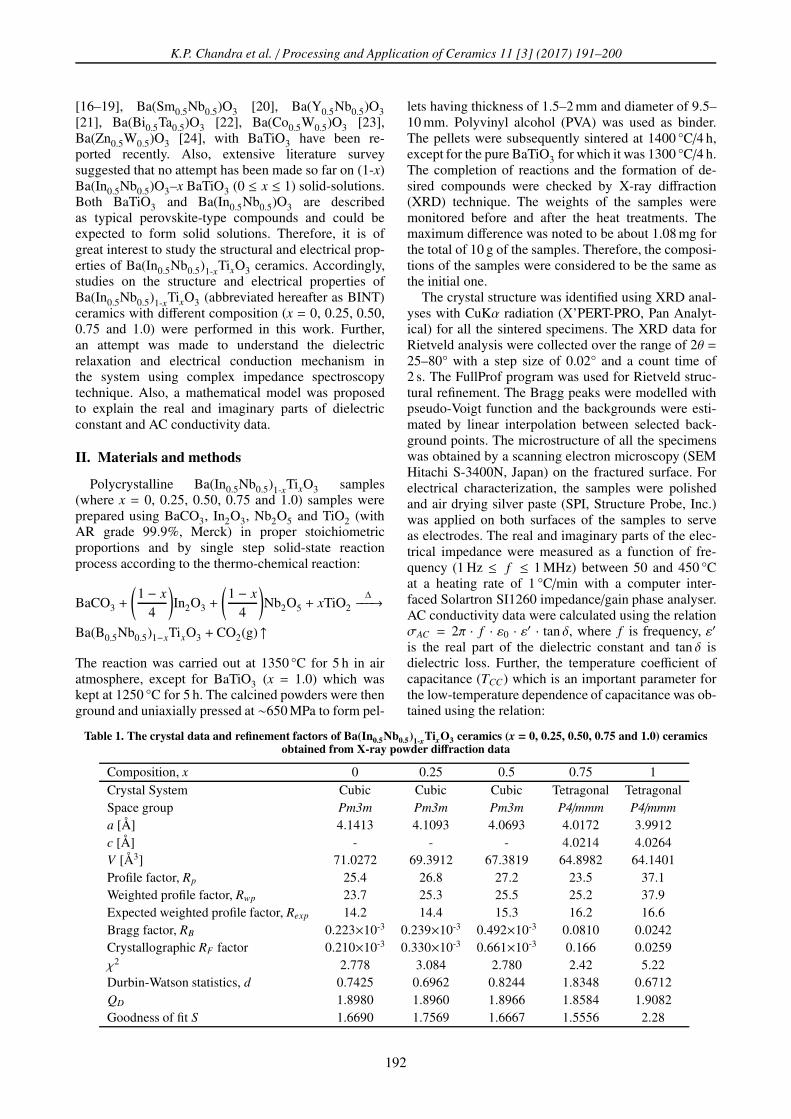
with r2 = 0.9696.Figure 2 shows the SEM micrographs of the fractured
surface of the sintered BINT ceramics. The characteris-tic polycrystalline texture can be recognised as well asthe presence of a very small amount of pores suggestinghigh density of the samples. The grains of unequal sizes(1–4 µm) were found for the chosen compositions. It isalso observed that a few grains are larger in comparisonto the average size which can be termed as an abnormalgrain growth.
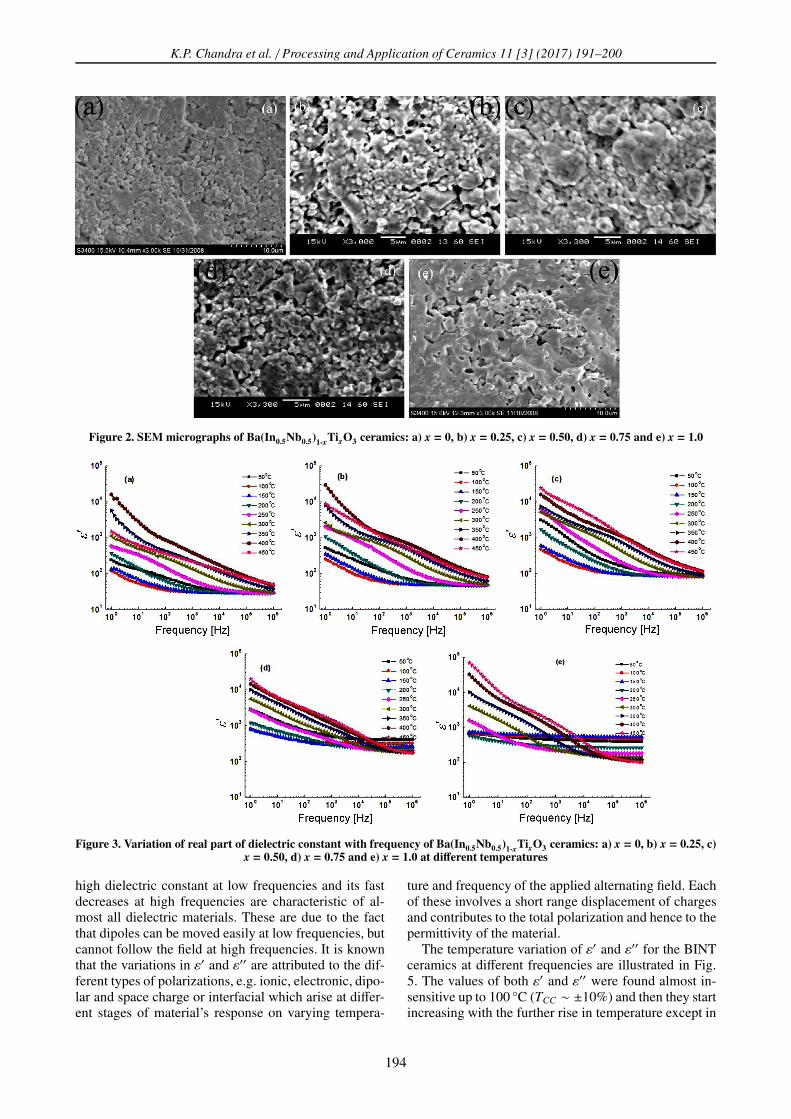
The frequency dependence of real (ε′) and imaginary(ε′′) parts of dielectric constant for the BINT ceram-ics at different temperatures are shown in Figs. 3 and4, respectively. It is observed that the values of both ε′
and ε′′ decrease with increasing frequency. A relatively
193
K.P. Chandra et al. / Processing and Application of Ceramics 11 [3] (2017) 191–200
Figure 2. SEM micrographs of Ba(In0.5Nb0.5)1-x
TixO3 ceramics: a) x = 0, b) x = 0.25, c) x = 0.50, d) x = 0.75 and e) x = 1.0
Figure 3. Variation of real part of dielectric constant with frequency of Ba(In0.5Nb0.5)1-x
TixO3 ceramics: a) x = 0, b) x = 0.25, c)x = 0.50, d) x = 0.75 and e) x = 1.0 at different temperatures
high dielectric constant at low frequencies and its fastdecreases at high frequencies are characteristic of al-most all dielectric materials. These are due to the factthat dipoles can be moved easily at low frequencies, butcannot follow the field at high frequencies. It is knownthat the variations in ε′ and ε′′ are attributed to the dif-ferent types of polarizations, e.g. ionic, electronic, dipo-lar and space charge or interfacial which arise at differ-ent stages of material’s response on varying tempera-
ture and frequency of the applied alternating field. Eachof these involves a short range displacement of chargesand contributes to the total polarization and hence to thepermittivity of the material.
The temperature variation of ε′ and ε′′ for the BINTceramics at different frequencies are illustrated in Fig.5. The values of both ε′ and ε′′ were found almost in-sensitive up to 100 °C (TCC ∼ ±10%) and then they startincreasing with the further rise in temperature except in
194

K.P. Chandra et al. / Processing and Application of Ceramics 11 [3] (2017) 191–200
Figure 4. Variation of imaginary part of dielectric constant with frequency of Ba(In0.5Nb0.5)1-x
TixO3 ceramics: a) x = 0, b) x =0.25, c) x = 0.50, d) x = 0.75 and e) x = 1.0 at different temperatures
Figure 5. Variation of the real and imaginary parts ofdielectric constant with temperature at 1 kHz of
Ba(In0.5Nb0.5)1-x
TixO3 (x = 0, 0.25, 0.50, 0.75 and 1.0)ceramics. Inset: Compositional dependence of the real and
imaginary parts of dielectric constant at 1 kHzand room temperature
the case of the pure BaTiO3 for which ε′-T as well asε′′-T plots have a maximum at ∼120 °C. Inset in Fig.5 shows the compositional dependence of ε′ and ε′′ forthe BINT ceramics at room temperature and 1 kHz. Itcan be seen that ε′ simply increase with the incrementin BaTiO3 content (x) while ε′′ find a maximum for x =
0.75. Hence, addition of BaTiO3 to Ba(In0.5Nb0.5)O3 isadvantageous for capacitor applications, especially for x
= 0.50.The logarithmic frequency dependence of Z′ and Z′′
of the BINT, at different temperatures are plotted inFigs. 6 and 7, respectively. It is observed that Z′ de-creases monotonically with increasing frequency for alltemperatures. On the other hand, Z′′ decreases mono-tonically only at lower temperatures suggesting the ab-sence of any relaxation. This suggests that the relaxationspecies are immobile defects and the orientation effectmight be associated. At higher temperatures, the peakin Z′′- f plots appears (Fig. 7), and shifts towards higherfrequency with the increment in temperature showingthat the resistance of the bulk material is decreasing andsupports NTCR character of the BINT. Upon furtherrise in temperature Z′′- f plots exhibited double peaks,which clearly indicated the introduction of grain bound-ary effect especially in case of the sample with x ≥ 0.75.Besides, the magnitude of Z′′ peaks decreases while thewidth of the peak increases with increasing temperatureand the peaks are slightly asymmetric in nature for allthe compounds. This suggests that there is a spread ofrelaxation times, i.e. the existence of a temperature de-pendent electrical relaxation in the materials. Further, atlow frequencies the Z′ values decrease with rise in tem-
195

K.P. Chandra et al. / Processing and Application of Ceramics 11 [3] (2017) 191–200
Figure 6. Variation of the real part of impedance with frequency of Ba(In0.5Nb0.5)1-x
TixO3 ceramics: a) x = 0, b) x = 0.25,
c) x = 0.50, d) x = 0.75 and e) x = 1.0 at different temperatures
Figure 7. Variation of the imaginary part of impedance with frequency of Ba(In0.5Nb0.5)1-x
TixO3 ceramics: a) x = 0, b) x = 0.25,c) x = 0.50, d) x = 0.75 and e) x = 1.0 at different temperatures
perature showing the negative temperature coefficient ofresistance (NTCR) type behaviour of semiconductors.The relaxation time was estimated from the frequencyat which Z′′max is observed. At the peak (ω = ω0), themost probable relaxation is defined by the condition:ω · τ = 1, where τ is the relaxation time and obeyingthe Arrhenius relationship:
τ = τ0 exp−U
kB · T(3)
where τ0, U, kB and T are the pre-exponential factor, ac-tivation energy, Boltzmann constant and absolute tem-perature, respectively. The values of U were estimatedusing linear least square fit to the above equation and
196

K.P. Chandra et al. / Processing and Application of Ceramics 11 [3] (2017) 191–200
Figure 8. Variation of the AC conductivity with frequency of Ba(In0.5Nb0.5)1-x
TixO3 ceramics: a) x = 0, b) x = 0.25, c) x = 0.50,d) x = 0.75 and e) x = 1.0 at different temperatures
data points. It is observed that partial replacement ofpseudo-cation (In0.5Nb0.5)4+ with Ti4+-ion led to the de-crease in real and imaginary parts of impedance as wellas activation energy.
Figure 8 shows the variation of AC conductivity(σAC) of the BINT ceramics as a function of frequencyat different temperatures. The nature of variation ofσACwith frequency exhibits dispersion throughout thechosen range of frequencies. Also, σAC increase withrise in frequency as well as temperature. Such incrementin conductivity is due to the movement of thermal ions(generally comes from hopping motion of ions) fromone preferable site to the other. The plots get flattened(low frequency plateau) upon further rise in tempera-ture. The high-frequency conductivity dispersion maybe attributed to the AC conductivity whereas the fre-quency independent plateau region of the conductivitypattern corresponds to the DC conductivity (σDC) of thematerial. The switch from frequency-independent to thefrequency-dependent region shows the onset of the con-ductivity relaxation phenomenon which shifts to higherfrequency side with the increase in temperature, indi-cating the translation from long range hopping to theshort range ion-motion. Such dependence is associatedwith the displacement of carriers which move withinthe sample by discrete hops of length R between ran-domly distributed localized sites. Furthermore, the ACconductivity, in most of the materials due to localizedstates can be expressed using Jonscher’s power law [25]:σAC = σ0 + A · ωs. The values of the index s were ob-tained from the slopes of the plots in the low frequencyregion, which always comes out to be less than 1 and aredecreasing with the rise in temperature. This observa-
tion is consistent with correlated barrier hopping model[26]. Therefore, the electrical conduction in the BINTmay be considered due to the short range translationaltype hopping of charge carriers. Besides, the value of s
approaching zero at higher temperatures indicates thatthe DC conductivity dominates at higher temperaturesin the low frequency region following the Jonscher’spower law. It can be seen that the slope of the curveschanges with changing temperature, which clearly indi-cates that the conduction process is dependent on bothtemperature as well as on frequency. Further, a decreasein the values of σAC is observed with the rise in tem-perature for all the compounds, thereby indicating theNTCR character of the samples. This may happen dueto the accumulation of charge species at the barriers(grain boundaries) which get thermally activated, thatplays a dominant role at elevated temperature show-ing NTCR characteristics. With the rise in temperature,these charge species have sufficient energy to jump overthe barrier. Therefore, they are responsible for increas-ing the conductivity and hence the grain boundary resis-tance decreases beyond these temperatures.
Hopping type of electrical conduction is generallyconsistent with the existence of a high density of statesin the materials having band gap like that of semicon-ductor. Due to the localization of charge carriers, for-mation of polarons takes place and the hopping conduc-tion may occur between the nearest neighbouring sites.Figure 9 shows the variation of AC conductivity ver-sus 103/T of the BINT ceramics at different frequen-cies. It is clear from all the plots that change in the slopeof the curves at different temperature regions are dif-ferent, which clearly indicates that carriers transport in
197

K.P. Chandra et al. / Processing and Application of Ceramics 11 [3] (2017) 191–200
Figure 9. Variation of the real part of AC conductivity with temperature of Ba(In0.5Nb0.5)1-x
TixO3 ceramics: a) x = 0,
b) x = 0.25, c) x = 0.50, d) x = 0.75 and e) x = 1.0 at different frequencies
the samples are obeying the hopping type of conductionmechanism. The temperature dependent AC conductiv-ity data, in high temperature region, were fitted to theArrhenius relationship:
σAC = σ0 · expEa
kB · T(4)
where Ea is the apparent activation energy of conduc-tion and T is the absolute temperature. It is observed thatthe values of σAC increase while the values of Ea de-crease with increasing x. The low values of Ea might bedue to the transport of charge carriers through hoppingbetween localized states in a disordered manner [27].
It is observed (Fig. 9) that σAC increases with the risein temperature for all the compounds under investiga-tion, thereby indicating the negative temperature coef-ficient of resistance (NTCR) character of the samples.This may happen due to the accumulation of charges atthe barriers which get thermally activated, that plays adominant role at elevated temperature showing NTCRcharacteristics. With the rise in temperature, the chargespecies (which are accumulated at grain boundaries)have sufficient energy to jump over the barrier therebyincreasing the conductivity. Thus, the grain boundaryresistance decreases beyond these temperatures. On theother hand, a slight change in stoichiometry (i.e. themetal to oxygen ratio) in multi-metal complex oxidescauses the creation of a large number of donor or ac-cepter like states in the vicinity of conduction or valancebands. These donors or acceptors might be activatedwith less energy [28]. It is known that in perovskite ti-tanates, ionization of oxygen vacancy creates conduct-
ing electrons, a process which can be described usingthe Kröger and Vink notation [29]. These excess elec-trons and oxygen vacancies are formed in the reduc-tion reaction during sintering that enhances the electri-cal conductivity, dielectric loss and space charge accu-mulation at the grain boundaries which are detrimentalto the material’s performance [26,30]. It is reported thattitanate based perovskite oxide materials contain Ti3+
that is formed because of the capturing of electrons re-leased during the process of formation of oxygen va-cancies by Ti4+. The polaronic conduction of 3d elec-trons on Ti3+ with low mobility must be predominant atlow temperature and these polaronic states are thermallydissociated and the residual carriers, 3d electrons, arestrongly scattered by thermal phonons at high temper-ature, resulting in high electronic conductivity [31]. InBINT system, partial replacement of Ti4+ ions with In3+
and Nb5+ ions may result in localized oxygen vacanciesand titanium vacancies given as:
12 BaO + 3 In2O3 + 2 Nb2O5 + TiO2 −−−→
12 Ba + Ti + 6 InTi + 4 NbTi + 33 O + 3 VO + VTi
where VO and VTi are the oxygen and titanium vacan-
cies, respectively. InTi and NbTi represent the incorpo-ration of In and Nb at Ti position, respectively. SinceTi can exist in +3 and +4 state, whereas Nb can existin +3 and +5 states, Ti4+ and Nb5+ ions may capturethe electrons to form Ti3+ and Nb3+ ions, respectively.The polaronic conduction of 3d electrons on Ti3+ and4d electrons on Nb3+ with low mobility may be pre-dominant at intermediate temperature. High electronic
198

K.P. Chandra et al. / Processing and Application of Ceramics 11 [3] (2017) 191–200
Figure 10. Variation of the real and imaginary parts of dielectric constant and the AC conductivity with composition (x) ofBa(In0.5Nb0.5)
1-xTixO3 ceramics (points show experimental data and line shows theoretical fit)
Table 2. Concentration dependent variation of the real and imaginary parts of dielectric constant and the AC conductivity ofBa(In0.5Nb0.5)
1-xTixO3 ceramics
Model Parameters ε′ ε′′ σAC
Y = Y0 + A0 · ex/c
Y0 69.87803 47.04451 2.6146×10⁻⁶
A0 0.6639 0.20679 1.1493×10⁻⁸
c 0.11579 0.12614 0.12614r2 0.99978 0.99121 0.99121
conductivity at elevated temperatures may also be at-tributed to the increase in polaronic conduction. Thisincrease in polaronic conduction may be linked to theformation of more oxygen vacancies due to oxygen lossat very high temperatures. Contribution to the polaronicconduction from In-ion can be ruled out, as it has sta-ble valence state (+3). In the present perovskite sys-tem, the high frequency localized orientation hoppingmay be attributed to the formation of dipoles, Nb3+−VOand Ti3+−V′O. These dipoles can change their orienta-tions by electron hopping. The hopping of 4d electrons,Nb3+−VO and Ti3+−V′O, gives rise to localized energylevels in the energy gap of Ba(In0.5Nb0.5)1-xTixO3. Thecharge carriers trapped at these localized sites may formlarge polarons and conduction occurs as a result of ther-mally activated large polarons. This is also clear fromthe temperature dependence of s, which decreases withincreasing temperature for hopping mechanism of largepolarons [32,33].
Figure 10 shows the variation of the real and imagi-nary parts of dielectric constant and the AC conductivitywith Ti-content (x) in Ba(In0.5Nb0.5)1-xTixO3 ceramics.It is seen that the values of ε′, ε′′ and σAC show an in-creasing trend with the increase in Ti-content. Further,ε′, ε′′ andσAC vs. Ti-content (x) data fit excellently well(r2 > 0.99) with an exponential growth type of functiongiven by: Y = Y0 + A0 · ex/c. Here Y0, A0 and c are ma-terial dependent constants where Y0 and A0 are the ini-tial values (corresponding to x = 0) of these parameters.The values of these model parameters and constants aregiven in Table 2.
IV. Conclusions
Ba(In0.5Nb0.5)1-xTixO3 ceramics (BINT, where x = 0,0.25, 0.50, 0.75 and 1.0) ceramics were synthesized us-ing high temperature solid-state reaction method and
sintered at 1400 °C/4 h (except for the pure BaTiO3which was sintered at 1300 °C/4 h). The unit cell struc-ture of the BINT ceramics is observed to be cubic(Pm3m) up to x = 0.50 while for x = 0.75 and 1.0 itis tetragonal (P4/mmm). The unit cell volume decreaseswhile the real and imaginary parts of dielectric constantas well as the AC conductivity increase with increasingTi-content in the system. The variation of dielectric con-stant with temperature was found to be almost constantup to 100 °C (TCC ∼ ±10%) for x = 0.50 suggestingthat this ceramics is suitable for capacitor applications.The ceramics showed the negative temperature coeffi-cient of resistance character and supported the hoppingtype of conduction. The frequency dependence of theAC conductivity data obeyed Jonscher’s power law. Thereal and imaginary parts of dielectric constant as well asAC conductivity data were fitted excellently well withthe exponential growth type function.
Acknowledgements: The present work was supportedby ER & IPR Division of Defense Research and Devel-opment Organization, New Delhi.
References
1. T.R. Shrout, S.J. Zhang, “Lead-free piezoelectric ceram-ics: Alternatives for PZT?”, J. Electroceram., 19 (2007)111–124.
2. P.K. Panda, “Review: environmental friendly lead-freepiezoelectric materials”, J. Mater. Sci., 44 (2009) 5049–5062.
3. J. Rödel, W. Jo, K.T.P. Seifert, E.-M. Anton, T. Granzow,D. Damjanovic, “Perspective on the development of lead-free piezoceramics”, J. Am. Ceram. Soc., 92 (2009) 1153–1177.
4. R.-A. Eichel, H. Kungl, “Recent developments and fu-ture perspectives of lead-free ferroelectrics”, Funct. Mater.
Lett., 3 (2010) 1–4.
199

K.P. Chandra et al. / Processing and Application of Ceramics 11 [3] (2017) 191–200
5. D. Damjanovic, N. Klein, J. Li, V. Porokhonskyy, “Whatcan be expected from lead-free piezoelectric materials?”,Funct. Mater. Lett., 3 (2010) 5–13.
6. W. Li, J. Qi, Y. Wang, L. Li, Z. Gui, “Doping behaviorsof Nb2O5 and Co2O3 in temperature stable BaTiO3-basedceramics”, Mater. Lett., 57 (2002) 1–5.
7. Y. Yuan, S. Zhang, W. You, “Preparation of BaTiO3-basedX7R ceramics with high dielectric constant by nanome-ter oxides doping method”, Mater. Lett., 58 (2004) 1959–1963.
8. G. Li, S. Liu, F. Liao, S. Tian, X. Jing, J. Lin, Y. Uesu,K. Kohn, K. Saitoh, M. Terauchi, N. Di, Z. Cheng, “Thestructural and electric properties of the perovskite sys-tem BaTiO3-Ba(Fe1/2Ta1/2)O3”, J. Solid State Chem., 177
(2004) 1695–1703.9. Y. Hiruma, R. Aoyaqi, H. Nagata, T. Takenaka, “Piezo-
electric properties of BaTiO3-(Bi1/2K1/2)TiO3 ferroelectricceramics”, Jpn. J. Appl. Phys. Part 1, 43 (2004) 7556–7559.
10. S. Mahboob, A.B. Dutta, C. Prakash, G. Swaminathan,S.V. Suryanarayana, G. Prasad, G.S. Kumar, “Dielectricbehaviour of microwave sintered rare-earth doped BaTiO3ceramics”, Mater. Sci. Eng. B, 134 (2006) 36–40.
11. A. Umeri, T.A. Kuku, N. Scuor, V. Sergo, “Raman investi-gation of the ageing of Ni-BaTiO3 multilayer ceramic ca-pacitors”, J. Mater. Sci., 43 (2008) 922–926.
12. H.L.W. Chan, S.H. Choy, C.P. Chong, H.L. Li, P.C.K. Liu,“Bismuth sodium titanate based lead-free ultrasonic trans-ducer for microelectronics wirebonding applications”, Ce-
ram. Int., 34 (2008) 773–777.13. K. Prasad, Priyanka, K.P. Chandra, A.R. Kulkarni, “Struc-
tural and electrical properties of lead-free perovskite ce-ramic: Ba(In1/2Nb1/2)O3”, J. Non-Cryst. Solids, 357 (2011)1209–1217.
14. K. Prasad, Powder diffraction file - Release 2012, Interna-tional Centre for Diffraction Data, USA, 2012.
15. L.A. Khalam, H. Sreemoolanathan, R. Ratheesh, P. Mo-hanan, M.T. Sebastian, “Preparation, characterization andmicrowave dielectric properties of Ba(B′1/2Nb1/2)O3 [B′ =La, Pr, Nd, Sm, Eu, Gd, Tb, Dy, Ho, Y, Yb and In] ceram-ics”, Mater. Sci. Eng. B, 107 (2004) 264–270.
16. E. Vlakhov, Y. Dimitriev, E. Gattef, A. Staneva, S.Aleksandrova, K. Nenkov, “Synthesis and superconduct-ing properties of the composite in the system (1-x)YBa2Cu3Oy–x Ba(Y1/2Nb1/2)O3”, J. Mater. Sci. Lett., 16
(1997) 763–765.17. S. Bhagat, K. Amar Nath, K.P. Chandra, R.K. Singh,
A.R. Kulkarni, K. Prasad, “The structural, electrical andmagnetic properties of perovskite (1-x) Ba(Fe1/2Nb1/2)O3–x BaTiO3 ceramics”, Adv. Mater. Lett., 5 (2014) 117–121.
18. H. Yang, Y. Yang, Y. Lin, J. Zhu, F. Wang, “Prepara-
tion and electrical properties of (1-x) Ba(Fe0.5Nb0.5)O3–x BaTiO3 ceramics”, Ceram. Int., 38 (2012) 1745–1749.
19. U. Intatha, S. Eitssayeam, K. Pengpat, G. Rujijanagul,T. Tunkasiri, “The structural and electrical properties of(1-x) BaTiO3–x BaFe0.5Nb0.5O3 ceramics”, Ferroelectr.,415 (2011) 176–181.
20. K. AmarNath, K. Prasad, “Structural and electric prop-erties of perovskite Ba(Sm1/2Nb1/2)O3–BaTiO3 ceramic”,Adv. Mater. Res., 1 (2012) 115–128.
21. K. Prasad, Priyanka, K. Amar Nath, K.P. Chandra,A.R. Kulkarni, “Dielectric relaxation in Ba(Y1/2Nb1/2)O3–BaTiO3 ceramics”, J. Mater. Sci.: Mater. Electron., 25
(2014) 4856–4866.22. J. Kumar, S.N. Choudhary, K. Prasad, R.N.P. Choud-
hary, “Electrical properties of 0.25 Ba(Bi1/2Ta1/2)O3–0.75 BaTiO3”, Adv. Mater. Lett., 5 (2014) 106–110.
23. C.L. Tian, Z.X. Yue, Y.Y. Zhou, S.Q. Meng,“Structures and microwave dielectric properties ofBa[Ti1-x(Co0.5W0.5)x]O3 (x = 0.40–0.90) perovskiteceramics”, J. Am. Ceram. Soc., 95 (2012) 1645–1650.
24. C. Tian, Z. Yue, Y. Zhou, L. Li, “Crystal structures andmicrowave dielectric properties of Zn,W co-substitutedBaTiO3 perovskite ceramics”, J. Solid State Chem., 197
(2013) 242–247.25. A.K. Jonscher, Dielectric Relaxation in Solids, Chelsea,
New York, 1983.26. S. Bhagat, K. Prasad, “Structural and impedance spec-
troscopy analysis of Ba(Fe1/2Nb1/2)O3 ceramic”, Phys.
Status Solidi (a), 207 (2010) 1232–1239.27. K. Prasad, C.K. Suman, R.N.P. Choudhary, “Electri-
cal characterization of Pb2Bi3SmTi5O18 ceramic usingimpedance spectroscopy”, Adv. Appl. Ceram., 105 (2006)258–264.
28. R.C. Buchanan, Ceramic Materials for Electronics, Mar-cel Dekker, New York, 1986.
29. F.A. Kröger, H.J. Vink, “Relations between the concen-trations of imperfections in crystalline solids”, Solid State
Phys., 3 (1956) 307–435.30. R. Maier, J.L. Chon, J.J. Neumeier, L.A. Bendersky, “Fer-
roelectricity and ferrimagnetism in iron-doped BaTiO3”,Appl. Phys. Lett., 78 (2001) 2536–2539.
31. E. Iguchia, S. Mochizuki, “Electric conduction and dielec-tric relaxation processes in solid oxide fuel cell electrolyteLa0.5Sr0.5Ga0.6Ti0.4O3-δ”, J. Appl. Phys., 96 (2004) 3889–3896.
32. S.R. Elliott, “A.c. conduction in amorphous chalcogenideand pnictide semiconductors”, Adv. Phys., 36 (1987) 135–217.
33. S. Upadhyay, A.K. Sahu, D. Kumar, O. Parkash, “Probingelectrical conduction behavior of BaSnO3”, J. Appl. Phys.,84 (1998) 828–833.
200