structural characterization of natural and engineered ... · structural characterization of natural...
TRANSCRIPT

jeudi 9 mars 2017
Structural characterization of natural and
engineered barrier materials: from macro to
nanoscopic scales
Gaboreau Stéphane (BRGM, France)
In collaboration with C. tournassat, A. Loschetter, J. Rohmer, P. Audigane, A. Sbai and J.C. Robinet

Microstructure interest
(e.g. smectite)
(e.g. illite)
Interlayerpore volume
External basalsurfaces
Bulk pore solution
Clay edges
Solution volume influencedby basal surface charge
Swelling clay mineral(e.g. montmorillonite)
Bulk solution
Non-swelling clay mineral(e.g. illite)
Macroscale properties of finely divided materials arise for a large part
from the surface properties of their nano-sized minerals or phases
constituents and from the characteristics of associated microstructure
and pore network.

Pore network and microstructure characterization
Which technics for which scale ?
: from macroscopic scale to nanoscopic scale
1 nm 10 nm 100 nm 1 µm 10 µm 100 µm 1 mm
IUPAC
Macroscopic scale Mesoscopic Micro/Nano
In the last decades, large technologic development allowing the characterization of the
microstructure (mineralogy and porosity)
X-ray µtomography
SEM FIB/SEM
TEM/electron tomography
Among many others technics (Autoradiography, PDF, PDF tomography, SAXS ….)
3D
2D and 3D 2D
2D and 3D

Reservoir rock pore network
Macroscopic scale
Carbonate reservoir rock
Large connected pores in the macroscopic domain
Gaz transfer/permeability modelling and poroelastic behavior at pore scale
Laboratory X-ray µTomography
Pore size distribution
‘Maximal ball algorithm’
Voxel size 20 µm3
Oolith
Porous domain
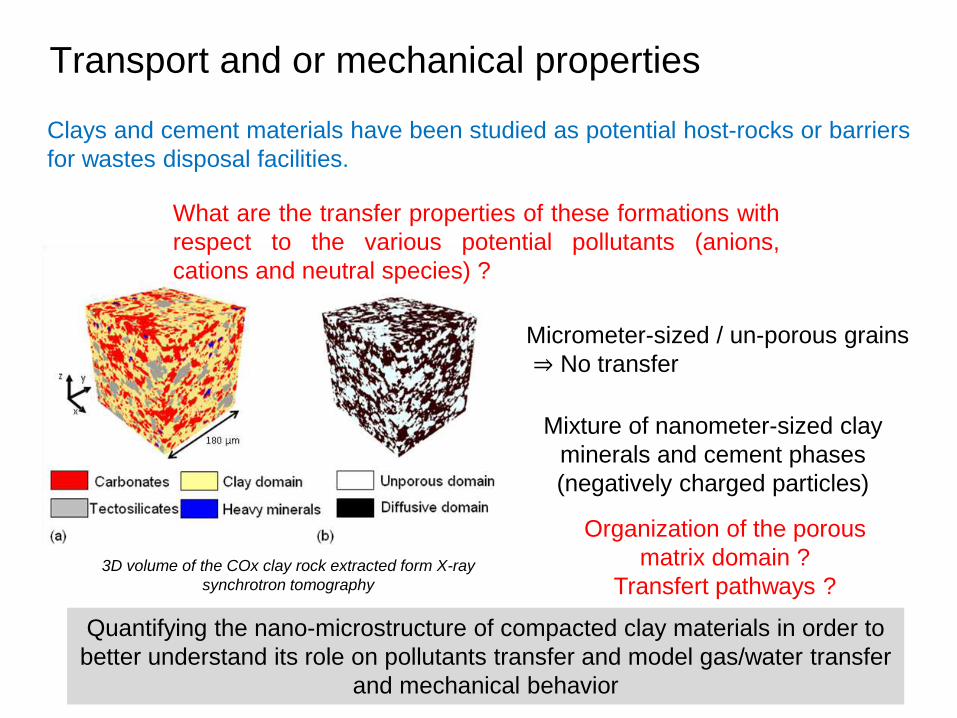
Transport and or mechanical properties
Clays and cement materials have been studied as potential host-rocks or barriers
for wastes disposal facilities.
What are the transfer properties of these formations with
respect to the various potential pollutants (anions,
cations and neutral species) ?
Micrometer-sized / un-porous grains
⇒ No transfer
Mixture of nanometer-sized clay
minerals and cement phases
(negatively charged particles)
3D volume of the COx clay rock extracted form X-ray
synchrotron tomography
Organization of the porous
matrix domain ?
Transfert pathways ?
Quantifying the nano-microstructure of compacted clay materials in order to
better understand its role on pollutants transfer and model gas/water transfer
and mechanical behavior

1 cm
Natural and engineered barrier material
Concrete polished section Argilite SEM image
50 µm
Finelly divided materials with spatial heterogeneity, multiscale distribution
of mineral and pore size
Multi-technics downscaling approach to cover the multi field of view of the
microstructure from the mineralogy to the porosity
1 nm 10 nm 100 nm 1 µm 10 µm 100 µm 1 mm
IUPAC
Macroscopic scale Mesoscopic Micro/Nano
Interlayer space
Inter particules
Inter aggregates
Carbonate agregate Quartz
Pyrite
Carbonates

Bulk data – Reference Total porosity
He pycnometry
MIP intrusion - extrusion
𝜀 = 1 −𝜌𝑑
𝜌𝑔𝑟
𝜌𝑔𝑟 = 𝐴𝑖 𝑤𝑡% × 𝜌𝑔𝑟𝑖
MIP
He

jeudi 9 mars 2017 > 8
densité de
grain (pycno
He)
densité
apparente
sèche
(poromercure)
porosité
mesurée
(poromercure)
densité
apparente
séche kerdane
porosité
totale
kerdane
Porosité
calculée
teneur en
eau W
Degré de
saturation Sr
g/cm3 g/cm3 (%) g/cm3 (%) (%) (%) (%)
Ciment 2,38 1,54 15,96 1,55 38,4 35,0 23,85 96
Béton 2,56 2,26 7,62 2,25 14,2 12,2 5,44 86
Bulk data – Reference Total porosity
Grain density, apparent dry density, total porosity
Information on the size of the throat -> Possibility to detect the pores
with imaging technics
densité de
grain (pycno
He)
densité
apparente
sèche
(poromercure)
porosité
mesurée
(poromercure)
densité
apparente
séche kerdane
porosité
totale
kerdane
Porosité
calculée
teneur en
eau W
Degré de
saturation Sr
g/cm3 g/cm3 (%) g/cm3 (%) (%) (%) (%)
Ciment 2,38 1,54 15,96 1,55 38,4 35,0 23,85 96
Béton 2,56 2,26 7,62 2,25 14,2 12,2 5,44 86

Autoradiography – Spatial distribution of the total porosity
Microstructure
preservation
Impregnated samples with 14C-MMA
Impregnation with a resin
in order to preserve the
microstructure in a water-
like saturation state
All the pore even interlayer
space are impregnated

Autoradiography – Spatial distribution of the total porosity
2D spatial distribution of the Total porosity (from nano
to macropores, with a spatial resolution of 10µm)
2 cm
Non porous agregate Total porosity map (Quantification of the total porosity each 10 µm)
Autoradiography
100%
0%
e
Porosity
scale
Quantification of the
beta emission of the 14C resin
Non porous agregate
Voids filled with MMA
In grey, the hydrated porous domain with a porosity of 40-45 %
Total porosity : 12%
jeudi 9 mars 2017
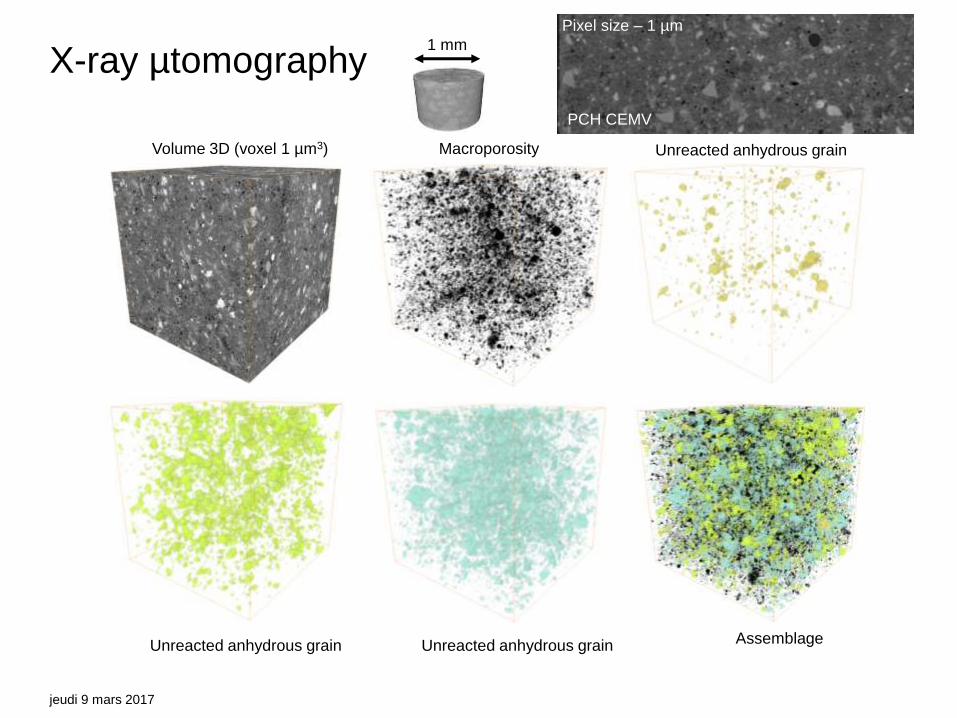
X-ray µtomography
Macroporosity Unreacted anhydrous grain
Assemblage
Volume 3D (voxel 1 µm3)
1 mm
Pixel size – 1 µm
PCH CEMV
Unreacted anhydrous grain Unreacted anhydrous grain

µtomographie RX – Macroscopic field of view
jeudi 9 mars 2017
Weight % distribution of the mineralogy
Evolution of the hydration of the cement
materials
Size distribution of the phases and reactive
surface estimation
At this scale, 10 % of the porosity is probed
on the 35%
No chemical information!!
Macroporosity
Hydrated phases
Unreacted anhydrous phases
Porous domain
Non porous domain Unreacted anhydrous phases
Unreacted anhydrous phases
Voxel size – 1 µm3

Quantitative chemical map obtained from EPMA. Na, K, Ca, Si, Al, Fe, Mg, S, Cl Maps of 512 x 512 pixels with a resolution 2µm/pixel BSE image associated to the chemical maps 262 144 pixels x 9 elements
N pixels
N p
ixe
ls
In each pixels
Sum of atomic Wt%
Concrete BSE
Concrete Ca X-ray map
Quantitative mineralogy

Si
Ca Al3 – Fe – Mg Ca Al3 – Fe – Mg
Si
Concrete Cement paste
Calcite
Portlandite
Quartz
Silica Fume
Dolomite
Slag
Stratlïngite Hydrogarnet
Solid solution
Katoite Hydrotalcite
AFt – AFm
solid solution
1.6
0.6
zeolite C-(A-)S-H
Solid solution
Successive ternary scatterplots procedure to threshold the mineralogy

Concrete Cement paste
Phases Formula (Ati)wt%
Ca Si O* H2O
(not analyzed) S (oxide) wt%
C2S 2CaOSiO2 46 16 38 100
Portlandite Ca(OH)2 54 0 22 24 76

Quantitative mineralogy – Image segmentation

Quantitative mineralogy – Image segmentation

Quantitative mineral map
512
512
2 µm/pixel
Macroporosity (5 %)
Fe oxides (0.2 %)
Aluminates (0.4 %)
Aluminates (5 %)
Dolomite (1.5%)
Slag (3%)
Calcite (25%)
S bearing (1.6%)
SiO2 (7%)
C-A-S-H (33%)
Mg-rich C-A-S-H (7%)
Al-rich C-A-S-H (6.5%)
C2S (2.5%)
Hydrogrenat (0.5%)
Hydrogrenat (0.4%)
With the associated chemical composition for each
phase/mineral
X Ca wt%; y Al wt%, Z Si wt%, alkalis wt%
Weight % distribution of the
mineralogy
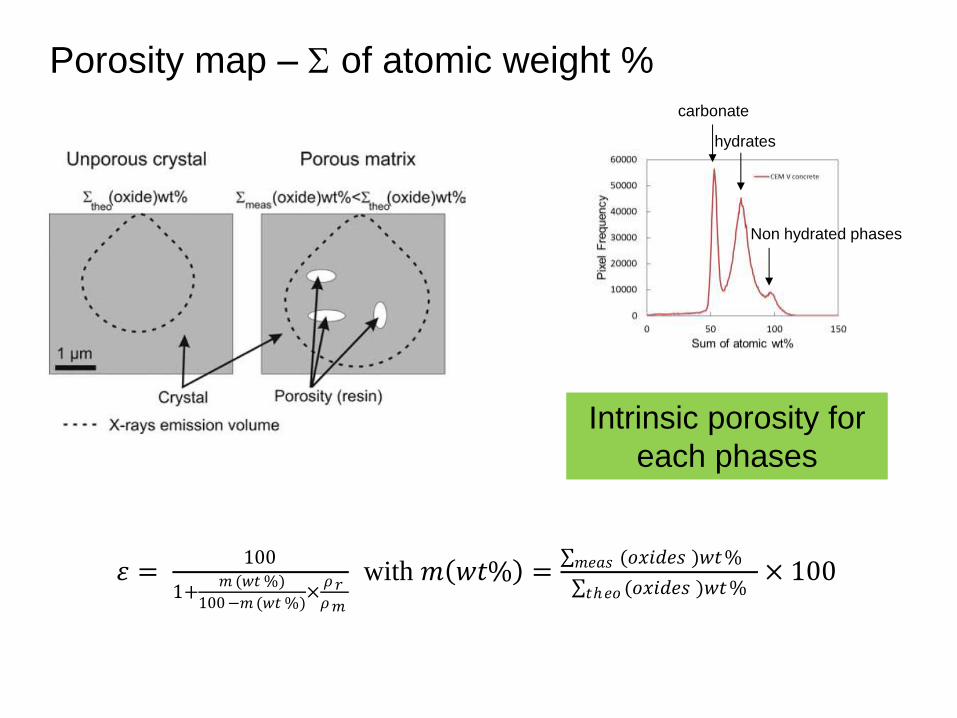
Porosity map – S of atomic weight %
𝜀 = 100
1+𝑚 (𝑤𝑡 %)
100−𝑚 (𝑤𝑡 %)×
𝜌𝑟𝜌𝑚
with 𝑚 𝑤𝑡% = (𝑜𝑥𝑖𝑑𝑒𝑠𝑚𝑒𝑎𝑠 )𝑤𝑡%
(𝑜𝑥𝑖𝑑𝑒𝑠𝑡ℎ𝑒𝑜 )𝑤𝑡%× 100
Intrinsic porosity for
each phases
carbonate
hydrates
Non hydrated phases
100%
50%
0%
Ø 75%
25%
Porosity
scale
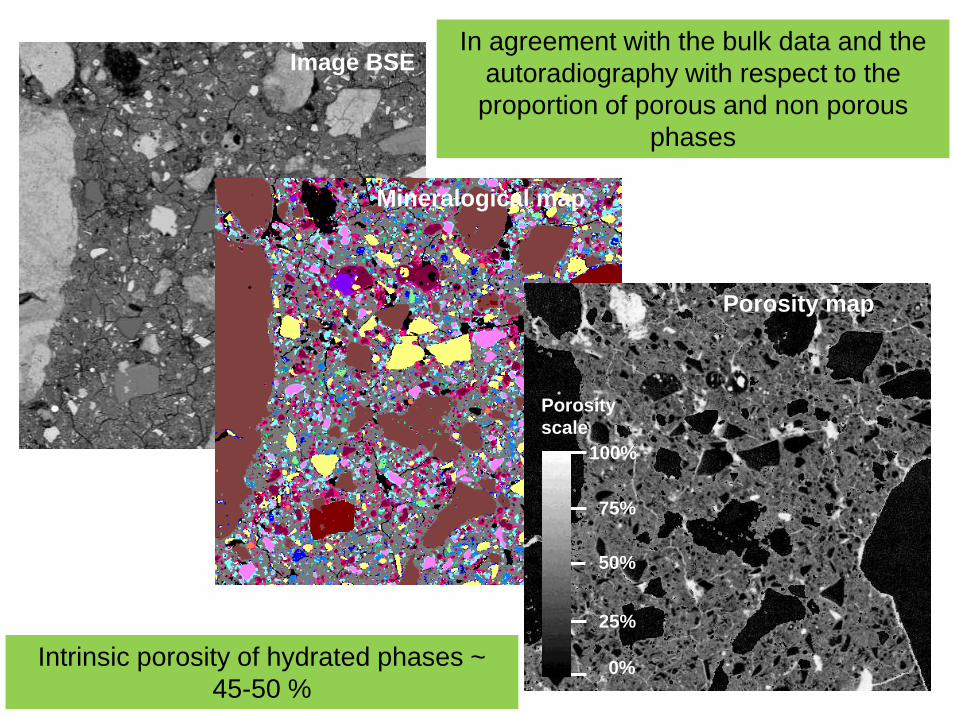
Image BSE
Mineralogical map
Porosity map
Intrinsic porosity of hydrated phases ~
45-50 %
In agreement with the bulk data and the
autoradiography with respect to the
proportion of porous and non porous
phases

Downscaling 3D FIB-nt images – mesoscopic scale
Slice and view techniques (Holzer et al., 2004)
Reconstruction of a two-dimensional images into a three-dimensional representation
Successive milling/imaging process
SEM images (low energy)

Downscaling 3D FIB-nt images – image analysis
In order to detect the pores and the throat to threshold a
connected pore network
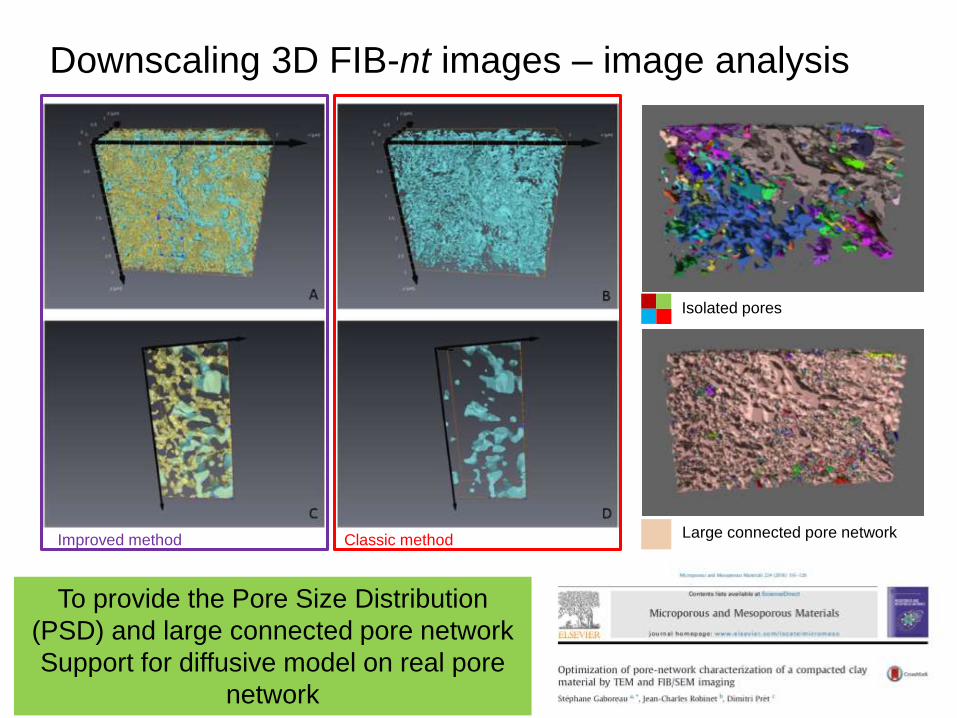
Isolated pores
Large connected pore network
Downscaling 3D FIB-nt images – image analysis
To provide the Pore Size Distribution
(PSD) and large connected pore network
Support for diffusive model on real pore
network
Classic method Improved method

Pore network Carbonates
Spatial distribution of the porosity from macro to mesoscopic scale
Downscaling 3D FIB-nt images
Argilite
Reactive surface area of some
detritic grains 2 µm

Diffusion simulation
Time domain diffusion algorithm
Particle tracking method (Delay et
al., 2002)
Determination of (i) the water diffusion coefficient (ii) diffusion anisotropy and
geometrical factor
HTO being considered as a non-reactive species, its
diffusion behavior is controlled by its mobility through
the pore network, consequently our modelling results
can be directly compared against HTO diffusion
experiments
Comparison with HTO diffusion experiments
Preliminary test on compacted clay material

Impact of the microstructure on the anion distribution Sensitivity of anion exclusion prediction to
microstructural parameters
Pore Size Distribution
Shape description
Anion accessible
porosity calculation

Downscaling TEM
Dark field HAADF
1 nm 10 nm 100 nm 1 µm 10 µm 100 µm 1 mm
IUPAC
Macroscopic scale Mesoscopic Micro/Nano
Interlayer space
Inter particules
Inter aggregates
We are here, following the next episode
Argilite
TEM foil prepared from fully impregnated samples
100 nm thick.
Argilite

Microstructure and mechanical behavior
Swelling pressure measurement according to the solute
Microstructure evolution
Crystalline pressure
vs.
Osmotic pressure
In situ, time resolved
X-ray µtomography

> Quantify the mineralogy to support the
thermodynamic and reactive transport model
> In the case of cement materials, follow the
hydration reaction to identify the reaction
pathway
> Calculate the reactive surface area
> Support the poro elastic model done at the pore
scale
> Display real pore network from macroscopic to
nanoscopic scale for transfer simulation
> Improve the knowledge in the mechanical
behavior of materials
> ….. Thank you for your attention
Why we are interested in Microstructure