structural characterization of nanoparticles€¢ do not permit to study structural properties of...
TRANSCRIPT

Structural Characterization of Nanoparticles
Nicola Pinna
Max Planck Institute of Colloids and Interfaces
e-mail: [email protected] - http://www.pinna.cx

Plan
1. Transmission Electron Microscopy
• Selected Area Electron Diffraction
• High Resolution Transmission Electron Microscopy
• HRTEM Simulations
2. X-Ray Diffraction
• Particle Size Broadening
• Sherrer equation
• Debye scattering equation

Transmission Electron Microscopy

Transmission Electron Microscopy

Transmission Electron Microscopy

Assembly of Nanoparticles

Electron Diffraction
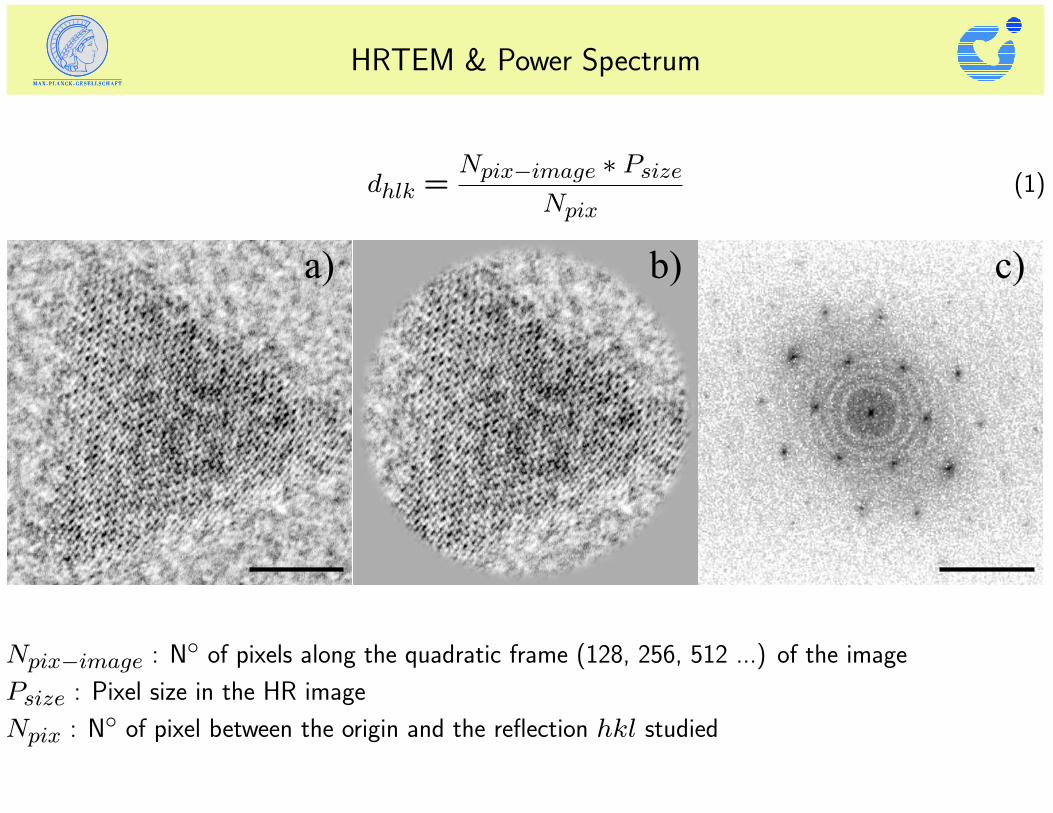
HRTEM & Power Spectrum
dhlk =Npix−image ∗ Psize
Npix(1)
a) b) c)
Npix−image : N◦ of pixels along the quadratic frame (128, 256, 512 ...) of the image
Psize : Pixel size in the HR image
Npix : N◦ of pixel between the origin and the reflection hkl studied

HCP - FCC structures∗
HCP FCC FCC + Twins
Crystals oriented along the [110] direction
∗The wurtzite structure is composed by two hcp networks, one occupied by the sulfur and the other by the cadmium,shifted by 001
4. The zinc blende structure is composed by two fcc arrays, as for the hcp occupied by the sulfur and
the zinc respectively, shifted by 141414.

Single Crystal Diffraction
0_20 1
_20 2
_20
_1
_10 0
_10 1
_10 2
_10
_200
_100 100 200
_210
_110 010 110
_220
_120 020
-0.4 0.0 0.4
-0.6
-0.4
-0.2
0.0
0.2
0.4
0.6
20_2 02
_2
2_20
_220
0_22
_202
-0.4 0.0 0.4
d* (A )-1° d* (A )
-1°
A B
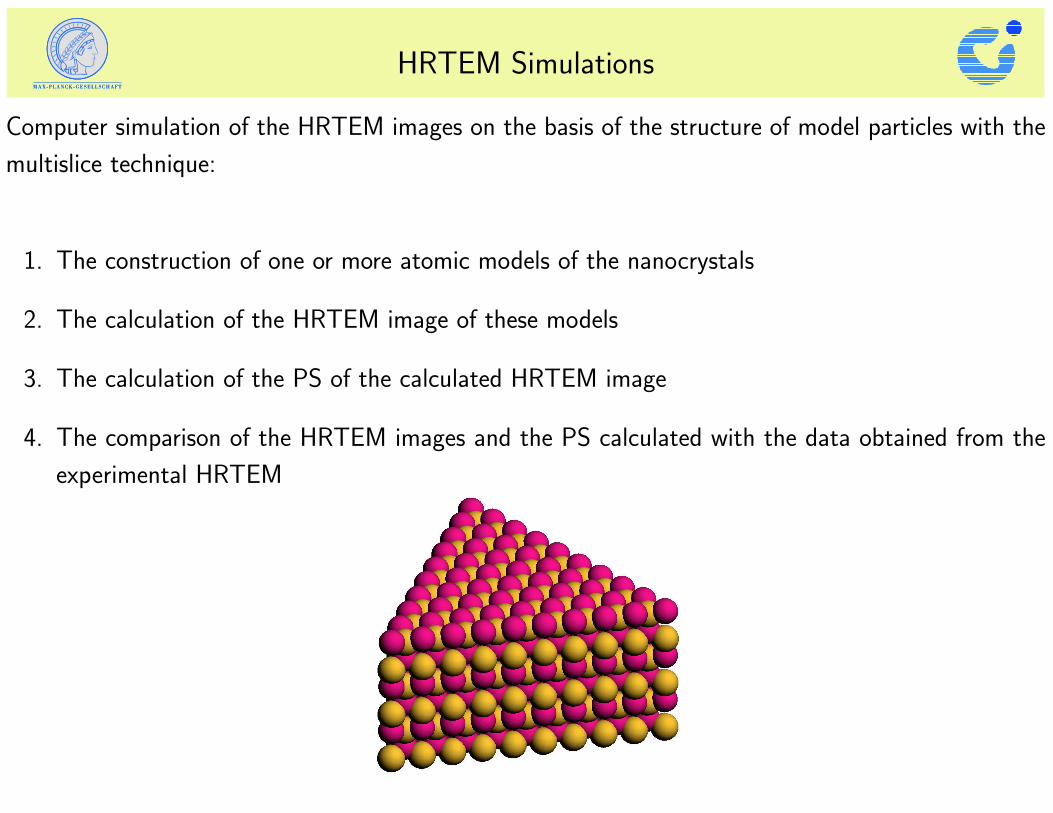
HRTEM Simulations
Computer simulation of the HRTEM images on the basis of the structure of model particles with the
multislice technique:
1. The construction of one or more atomic models of the nanocrystals
2. The calculation of the HRTEM image of these models
3. The calculation of the PS of the calculated HRTEM image
4. The comparison of the HRTEM images and the PS calculated with the data obtained from the
experimental HRTEM

Multislice Technique∗
Electrons are assumed to scatter only in a forward direction with small diffraction angles. With this
approximation the crystal can be divided in sub-slices with a thickness ∆z perpendicular to the
incident beam.
1. The crystal is divided in slices perpendicular to the electron beam
2. The electrostatic potential V (x, y) with in-plane coordinates x,y of the sliced crystal or supercell
is projected for each slice of the included atoms onto its exit surface
3. On the basis of VP (x, y) the amplitude of the electron wave function is calculated
4. Calculate the propagation of the electron wave throught all the slices
∗J.W. Cowley, A.F. Moodie, Acta Cryst. 10, 609, 1957
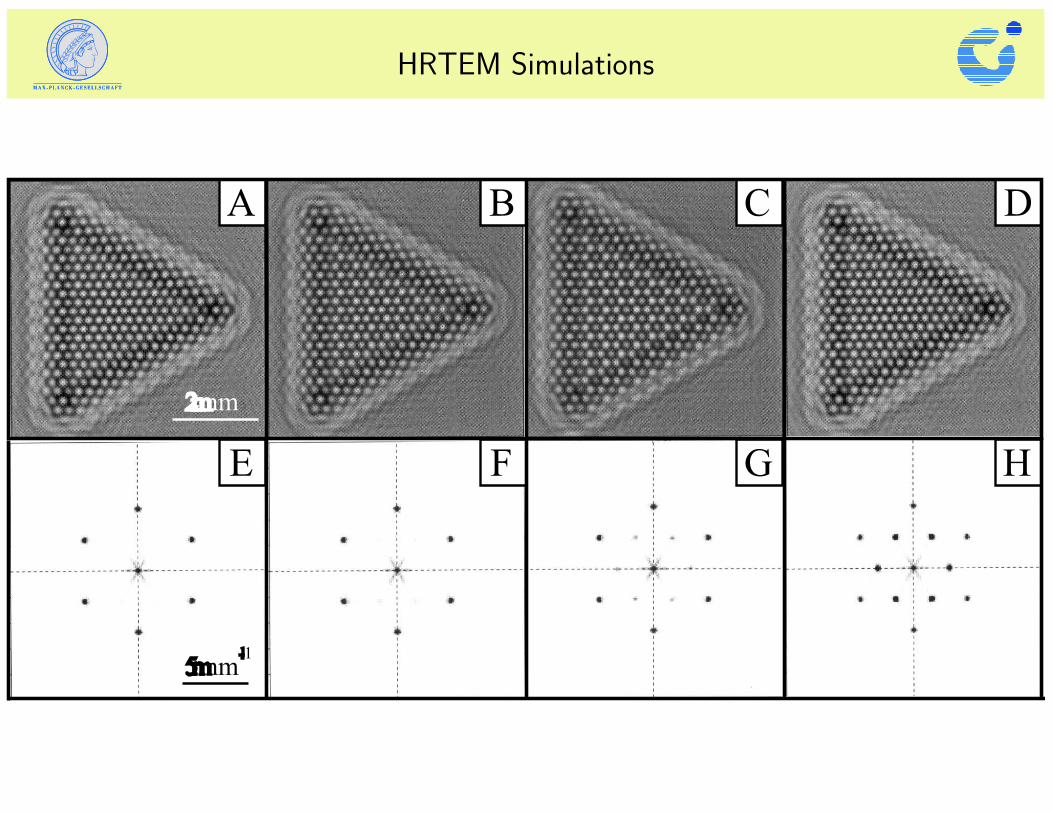
HRTEM Simulations
A
E
B
F
C
G
D
H
2 nm
5 nm-1

HRTEM Simulations
_22
_2
_12
_2 02
_2
_11
_1 01
_1
_200
_100 100 200
0_11 1
_11
0_22 1
_22 2
_22
-0.4 0.0 0.4
-0.6
-0.4
-0.2
0.0
0.2
0.4
0.6
d* (A )-1°

HRTEM Simulations

HRTEM Simulations

Copper Nanoparticles
2 nm 1 nm
A
DC
B
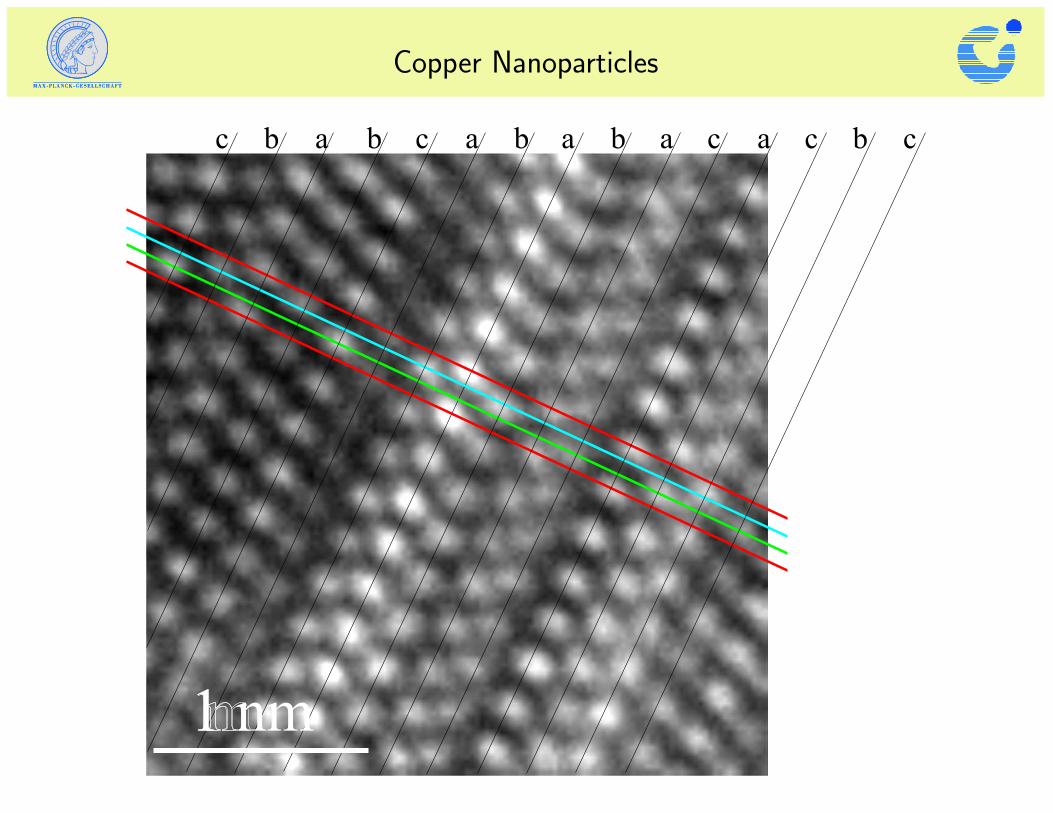
Copper Nanoparticles
a bb cc c c cb b ba a a a
1 nm

Tungstite

Tungstite

Tungstite

Tungstite

Tungstite

Oriented Attachement
a)
002
004
011013
020
b)
c)
5 nm-15 nm
[001]
J. Polleux, N. Pinna, M. Antonietti, M. Niederberger, Adv. Mat. 2004, 16, 436

Electron Energy Loss Spectroscopy
Inelastic scattering of an electron of the incident beam and the atomic electrons of the solid.
• Transition from an inner-shell (K, L M ...) to an unoccupied energy level (i.e. above the Fermi
level)
• Transition of a valence electron across the energy gap (insulator, semiconductor) or excitation of
a plasma resonance (mostly in metals metals).

Electron Energy Loss Spectroscopy

Electron Energy Loss Spectroscopy
YBa2CU3O7 Carbon allotropes
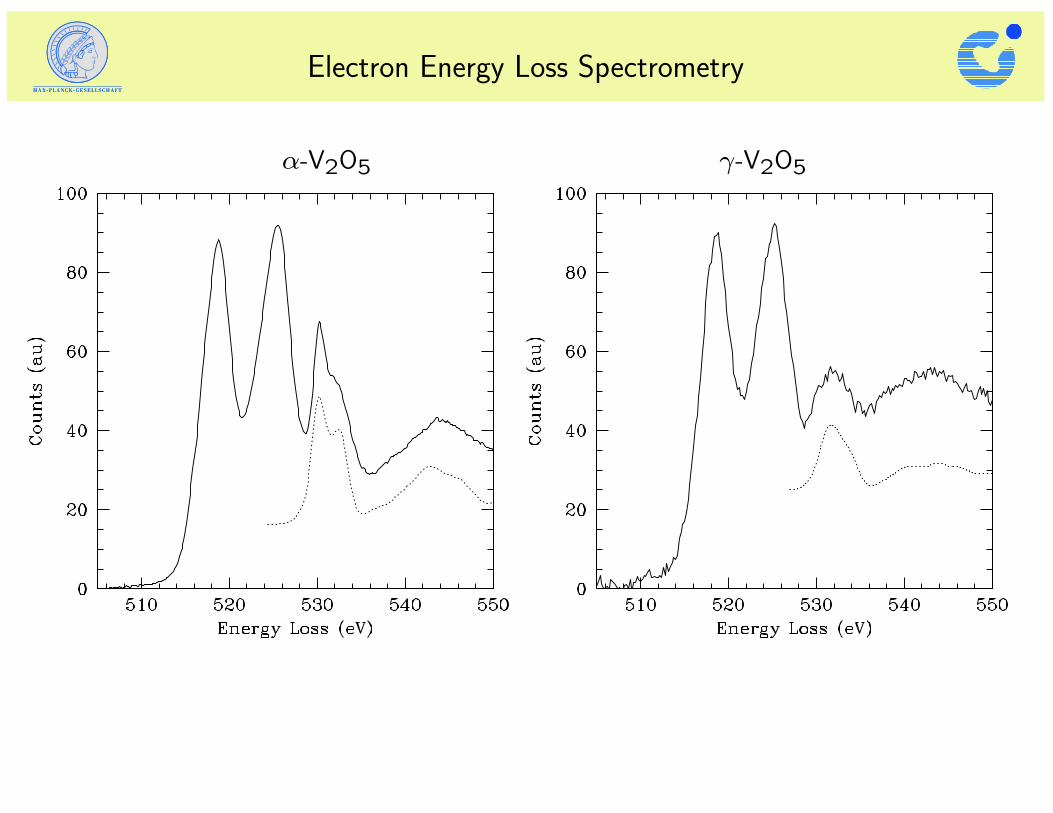
Electron Energy Loss Spectrometry
α-V2O5 γ-V2O5

Electron Energy Loss Spectrometry

Conclusion
• TEM permits the structural characterization of a collection or isolated nanoparticles
• Electron Diffraction → structure of single or many particles
• HRTEM → structure, orientation, crystallinity, defaults
• Image processing: fondamental tool for structural studies in electron microscopy
• Spectroscopy: EELS, EDX → local structure, band structure, composition
• Do not permit to study structural properties of the whole sample → Necessity to compare the
results with other techniques

X-Ray Diffraction
Particle Size Broadening
I = IeF2 ∗
sin2(π/λ)(s− s0)N1a1
sin2(π/λ)(s− s0)a1∗· · ·N2a2
· · · a2∗· · ·N3a3
· · · a3(2)
N1, N2, N3 Number of the unit cells along the
a1, a2, a3 directions
Normally N1, N2, N3 are large numbers → the
three quotients differs from zero only if the three
Laue equations are closely satisfied. If N1, N2, N3
are small, the quotients broaden.
B.E. Warren, X-Ray Diffraction, Dover

Sherrer Equation
Approximations:
1) Cubic crystal N1, N2, N3 = N
2) Crystal free from strains and faulting → peak broadening is only due to the small crystallite size
3) Each of the three quotients of equation 2 by a Gaussian function
B(2θ) =2 [(ln2)/π]1/2 λ
N a cosθ=
0.94 λ
L cosθ(3)
B(2θ): full width in radians at half maximum intensity of
the powder pattern peak.
L: cube edge dimension
Normally valid for cubic crystal but often applied to non-
cubic materials. It is not a bad approximation if for each
hkl-reflection the L value is iterpreted as an average crystal
dimension perpendicular to the reflecting plane.

Debye Scattering Equation
The intensity distribution spherical averaged over the reciprocal space is
descibed by the Debye formula:
IN(b) =N∑
n,m6=nfnfm
sin(2πbrnm)
2πbrnm(4)
b = 1d = 2sinθ
λrnm distance between atom n, m
fn, fm atomic scattering factors
• General equation valid for any form of matter in which there is a random orientation: gases,
liquids, amorphous solids, and crystalline powders.
• No limitation on the number of different kinds of atoms in the sample.
• The number of terms increases proportional to the sixth order!

Ta2O5

BaTiO3 6 nm

CeO2 2.5 nm

Final Example: HfO2
Monoclinic Structure:
a = 5.12 A b = 5.18 A c = 5.25 A
β = 98◦

Final Example: HfO2

Conclusion
X-Ray diffraction associated to calculations is a powerfull tool to study the:
• Structure
• Crystallinity
• Particle size and size distribution
• Particle shape
• Homogeneity of the whole sample
It is the perfect tool to be associated with transmission electron microscopy study