structural and optical characterization of zno ... · nanoparticles synthesized by microemulsion...
TRANSCRIPT

Structural and Optical Characterization of ZnO Nanoparticles Synthesized by Microemulsion Route
Harish Kumar*, Renu Rani
Department of Chemistry, Chaudhary Devi Lal University, Sirsa 125 055 (Haryana), India Fax. No. 01666-248123, Ph. 01666-247136 (O)
*E-mail address: [email protected]
ABSTRACT
ZnO nanoparticles were synthesized by microemulsion route in W/S ratio of 5 at room
temperature. X-ray diffraction (XRD) pattern reveals wurtzite structure of ZnO nanoparticles. Rod
shape of ZnO nanoparticles of average particle size 10.0 to 12.0 nm were observed by transmission
electron microscopy. FT-IR spectra confirmed the adsorption of surfactant molecules at the surface of
ZnO nanoparticles and presence of Zn-O bonding. Thermal studies were carried out by the differential
scanning calorimeter (DSC) techniques. In addition, UV-Visible spectra were employed to estimate
the band gap energy of ZnO nanoparticles.
Keywords: Nanostructure; Microemulsion; Powder diffraction; Optical properties
1. INTRODUCTION
In recent years, noble metal oxide nanoparticles have been the subject of focused
research due to their unique electronic, optical, mechanical, magnetic and chemical properties
that are significantly different from those of bulk counterpart1-5
. Nanostructured ZnO
materials have drawn broad attention due to its wide range of applications in ultraviolet (UV)
lasers6, power generators
7, solar cells
8, gas sensors
9, field emission devices
10, capacitors,
varistors, transparent UV resistance coating, photoprinting, electrophotography,
electrochemical and electromechanical nanodevices, sun screen lotion (cream), cosmetic and
medicated creams etc.11-14
. Zinc oxide (ZnO) is a wide band gap semiconductor with an
energy gap of 3.30, 3.28, and 3.27 eV at 300, 500, and 700 °C15
. ZnO nanocrystals or
quantum dots (QDs) have superior optical properties of the bulk crystals owing to quantum
confinement effects.
A variety of preparation routes have been reported for the preparation of metal oxide
nanoparticle3,4
notable examples include, reverse micelles process5,16
, salt reduction17
,
microwave dielectric heating reduction18
, ultrasonic irradiation19
, radiolysis20,21
, solvothermal
synthesis22
, electrochemical synthesis23,24
etc.
Compare to other methods, the reverse micelle method is one of the most promising
wet chemistry synthesis approaches of synthesis of metal oxide nanoparticles25
. This method
provides a favorable microenvironment for controlling the chemical reaction. As such the
reaction rate can be easily controlled, and it is possible to obtain a narrow nanoparticle size
distribution26
. Reverse micelle microemulsions are transparent, isotropic, and
thermodynamically stable27,28
.
International Letters of Chemistry, Physics and Astronomy Online: 2013-10-02ISSN: 2299-3843, Vol. 19, pp 26-36doi:10.18052/www.scipress.com/ILCPA.19.26© 2013 SciPress Ltd., Switzerland
SciPress applies the CC-BY 4.0 license to works we publish: https://creativecommons.org/licenses/by/4.0/

In continuation to our earlier research work29,30
, present work reports synthesis of ZnO
nanoparticles by microemulsion route. Characterization of ZnO nanoparticles were carried
out by XRD, TEM, DSC, FTIR and UV-Visible spectroscopy. Emphasis has been given on
structural and optical properties of CuO nanoparticles, etc.50-54
.
2. EXPERIMENTAL
2. 1. Materials and method
All chemicals used in experiment were of analytical grade. The stable reverse micelle
microemulsion was prepared by mixing a non-ionic surfactant, Triton X-100
[(C14H22O(C2H4O)n] (Qualigen Chem. Pvt. Ltd., Mumbai), Polyvinyl pyrollidone (PVP)
(K85-95) (Merk, India) and 1:9 ratio of cyclohexane (Qualigen Chem. Pvt. Ltd., Mumbai)
and triple distilled water (conductivity less than 1×10⁻⁶
S cm-1
). The microemulsion was
mixed rapidly with continuous stirring for five minutes. ZnSO4·6H2O (Qualigen Chem. Pvt.
Ltd., Mumbai) solution (0.5 M) was added drop by drop to microemulsion with continuous
stirring. A sky blue color mixture was obtained. PVP was used as a stabilizing agent. After
half an hour of equilibration, 2.0 M hydrazine hydrate (Qualigen Chem. Pvt. Ltd., Mumbai)
solution was added drop by drop with continuous stirring at room temperature. The reverse
micelles were broken by adding THF (Merk, India).
ZnO nanoparticles were subsequently washed with ethanol and triple distilled water to
remove residual PVP and surfactant molecules. After washing ZnO nanoparticles were dried
in oven at 100.0 °C for 48 hours.
2. 2. Characterization techniques
Structural and optical properties of the ZnO nanoparticles were determined by using
Transmission Electron Microscopy (TEM) (Hitachi: H-7500; Resolution: 2 Å), X-ray
Diffraction (XRD) (Rikagu Mini-2 using CuKα1, λ = 0.15406 nm radiations), Differential
Scaning Colorimetery (DSC) (TA Instruments USA, DSC Q10) in the range 50-600 °C,
Fourier Transform Infra-Red spectroscopy (FTIR) (Thermo-USA, FTIR-380) in the
wavelength range of 400 - 4000 cm-1
and UV-Visible spectroscopy (Systronic-2203).
3. RESULT AND DESCUSSION
3. 1. Synthesis
ZnSO4·7H2O crystallizes in the orthorhombic structure. Here six water molecules make
a highly distorted octahedron around Zn+2
ion31
. Due to the solvating action, ZnSO4·7H2O
dissolves in water to produce the colorless solution which is due to the presence of
[Zn(H2O)
7]
2+
ions.
Addition of N2H4·H2O to the aqueous solutions of zinc sulphate heptahydrate results to
production of white precipitates of Zn nanoparticles inside the miceller core. PVP act as
stabilizer for these Zn nanoparticles. The surfactant and PVP molecules adhere to the surface
of nanoparticles which serve as a protective layer to prevent the further reaction. The Zn
nanoparticles are oxidized into ZnO nanoparticles in the presence of atmospheric oxygen at
100 °C.
The reaction profile of formation ZnO nanoparticles can be illustrated as:
(1) ZnSO4(aq) + N2H4 + 2H2O(l) → 2Zn(s) + 2(N2H5)SO4(aq) + O2
(2) 2Zn(s) + O2 → 2ZnO(s)
International Letters of Chemistry, Physics and Astronomy Vol. 19 27

There are two important factors that affect the exchange rate of reverse micelles in
microemulsions; the stability of the dimer form and the size of channels between the two
dimers32
. The dimer stability, which depends on the intermicellar attractive potential,
determines the interdroplet transfer of reactants. On the other hand, the size of channels
which depends on the rigidity of interfacial film in the microemulsion, determines the
Ostwald ripening contribution33
.
3. 2. X-ray diffraction analysis
Figure 1 shows XRD diffraction pattern of ZnO nanoparticles. The peaks are indexed
as 31.82º (100), 34.54º (002), 36.42º (101), 47.46º (102), 56.74º (110), 62.92º (103), 66.06º
(200), 68.42º (112), 69.06º (201) and 78.82º (202) respectively. All diffraction peaks of
sample correspond to the characteristic hexagonal wurtzite structure of zinc oxide
nanoparticles (a = 0.315 nm and c = 0.529 nm)34
. Similar, X-ray diffraction pattern were
reported by C. Chen et. al.35
and Y. Pong et. al.36
. Average particle size of ZnO nanoparticles
is found to be 10.0 nm using Scherrer equation37
. Diffraction pattern corresponding to
impurities are found to be absent. This proves that pure ZnO nanoparticles were as
synthesized.
Fig. 1. XRD patterns of ZnO nanoparticle.
3. 3. Transmission Electron Microscopy
Figure 2 (a & b) show the TEM images of ZnO nanoparticles. Rod shape ZnO
nanoparticles were observed in TEM images of average size in the range of 10.0-12.0 nm
which is in the good agreement with the size calculated by XRD. Figure 2 (c) shows the
selected area diffraction pattern (SAED) of ZnO nanoparticles. It shows that the particles are
well crystallized. The diffraction rings on SAED image matches with the peaks in XRD
pattern which also proves the hexagonal wurtzite structure of ZnO nanoparticles38
.
28 Volume 19

Fig. 2. TEM images of ZnO nanoparticles (a, b) and its selected area electron diffraction image (c).
3. 4. FTIR spectroscopy
Figure 3 shows FTIR spectra of ZnO nanoparticles. Infrared studies were carried out in
order to ascertain the purity and nature of the metal nanoparticles. Metal oxides generally give
absorption bands in fingerprint region i.e. below 1000 cm-1
arising from inter-atomic
vibrations. The peak observed at 3452.30 and 1119.15 cm-1
are may be due to O-H stretching
and deformation, respectively assigned to the water adsorption on the metal surface. The peaks
at 1634.00, 620.93 cm-1
are correspond to Zn-O stretching and deformation vibration,
respectively. The metal-oxygen frequencies observed for the respective metal oxides are in
accordance with literature values39,40
. V. Parthasarathi and G. Thilagavathi41
reported similar
FTIR spectra observed of zinc oxide nanoparticles in their investigation.
International Letters of Chemistry, Physics and Astronomy Vol. 19 29
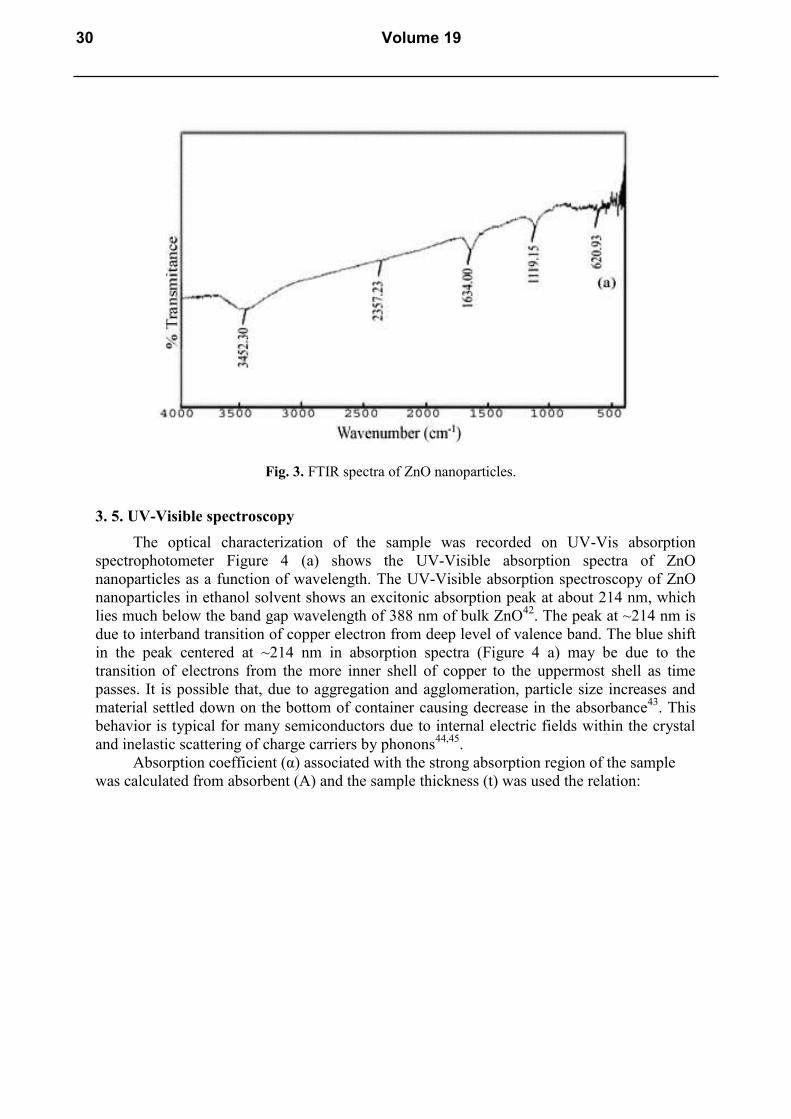
Fig. 3. FTIR spectra of ZnO nanoparticles.
3. 5. UV-Visible spectroscopy
The optical characterization of the sample was recorded on UV-Vis absorption
spectrophotometer Figure 4 (a) shows the UV-Visible absorption spectra of ZnO
nanoparticles as a function of wavelength. The UV-Visible absorption spectroscopy of ZnO
nanoparticles in ethanol solvent shows an excitonic absorption peak at about 214 nm, which
lies much below the band gap wavelength of 388 nm of bulk ZnO42
. The peak at ~214 nm is
due to interband transition of copper electron from deep level of valence band. The blue shift
in the peak centered at ~214 nm in absorption spectra (Figure 4 a) may be due to the
transition of electrons from the more inner shell of copper to the uppermost shell as time
passes. It is possible that, due to aggregation and agglomeration, particle size increases and
material settled down on the bottom of container causing decrease in the absorbance43
. This
behavior is typical for many semiconductors due to internal electric fields within the crystal
and inelastic scattering of charge carriers by phonons44,45
.
Absorption coefficient (α) associated with the strong absorption region of the sample
was calculated from absorbent (A) and the sample thickness (t) was used the relation:
30 Volume 19
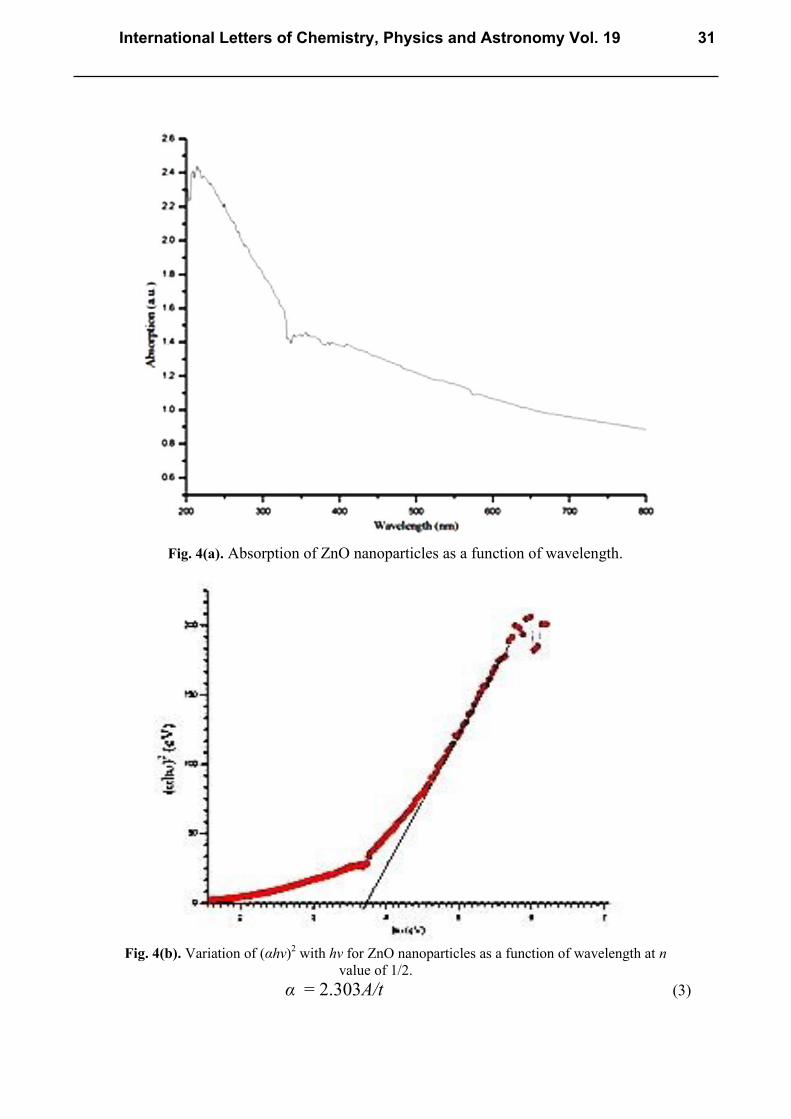
Fig. 4(a). Absorption of ZnO nanoparticles as a function of wavelength.
Fig. 4(b). Variation of (αhν)
2 with hν for ZnO nanoparticles as a function of wavelength at n
value of 1/2.
α = 2.303A/t (3)
International Letters of Chemistry, Physics and Astronomy Vol. 19 31
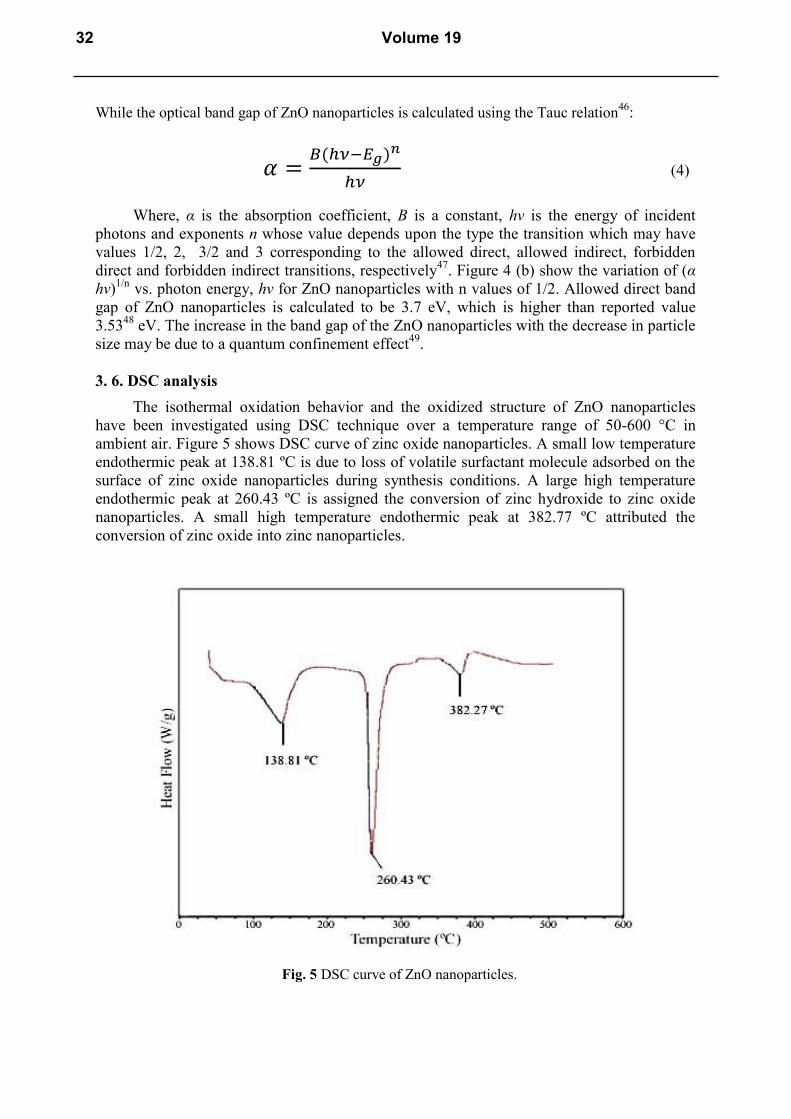
While the optical band gap of ZnO nanoparticles is calculated using the Tauc relation46
:
𝛼 =𝐵(ℎ𝜈−𝐸𝑔)
𝑛
ℎ𝜈 (4)
Where, α is the absorption coefficient, B is a constant, hν is the energy of incident
photons and exponents n whose value depends upon the type the transition which may have
values 1/2, 2, 3/2 and 3 corresponding to the allowed direct, allowed indirect, forbidden
direct and forbidden indirect transitions, respectively47
. Figure 4 (b) show the variation of (α
hν)1/n
vs. photon energy, hν for ZnO nanoparticles with n values of 1/2. Allowed direct band
gap of ZnO nanoparticles is calculated to be 3.7 eV, which is higher than reported value
3.5348
eV. The increase in the band gap of the ZnO nanoparticles with the decrease in particle
size may be due to a quantum confinement effect49
.
3. 6. DSC analysis
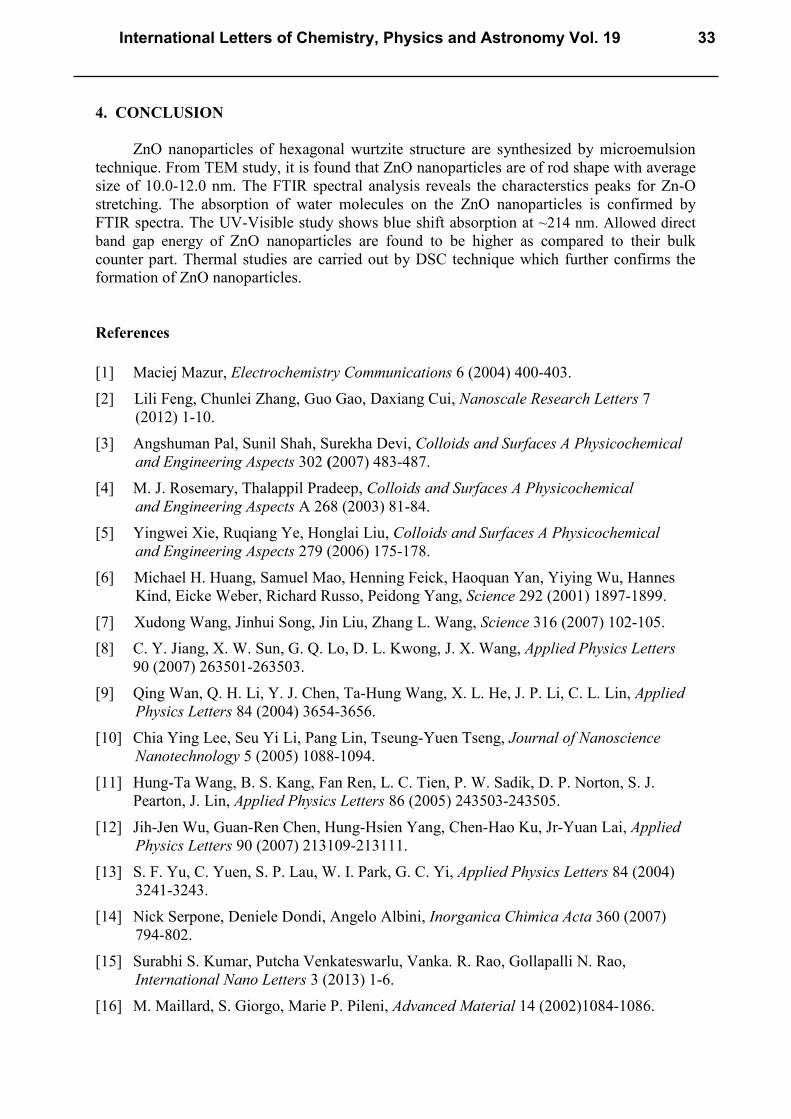
The isothermal oxidation behavior and the oxidized structure of ZnO nanoparticles
have been investigated using DSC technique over a temperature range of 50-600 °C in
ambient air. Figure 5 shows DSC curve of zinc oxide nanoparticles. A small low temperature
endothermic peak at 138.81 ºC is due to loss of volatile surfactant molecule adsorbed on the
surface of zinc oxide nanoparticles during synthesis conditions. A large high temperature
endothermic peak at 260.43 ºC is assigned the conversion of zinc hydroxide to zinc oxide
nanoparticles. A small high temperature endothermic peak at 382.77 ºC attributed the
conversion of zinc oxide into zinc nanoparticles.
Fig. 5 DSC curve of ZnO nanoparticles.
32 Volume 19
4. CONCLUSION
ZnO nanoparticles of hexagonal wurtzite structure are synthesized by microemulsion
technique. From TEM study, it is found that ZnO nanoparticles are of rod shape with average
size of 10.0-12.0 nm. The FTIR spectral analysis reveals the characterstics peaks for Zn-O
stretching. The absorption of water molecules on the ZnO nanoparticles is confirmed by
FTIR spectra. The UV-Visible study shows blue shift absorption at ~214 nm. Allowed direct
band gap energy of ZnO nanoparticles are found to be higher as compared to their bulk
counter part. Thermal studies are carried out by DSC technique which further confirms the
formation of ZnO nanoparticles.
References
[1] Maciej Mazur, Electrochemistry Communications 6 (2004) 400-403.
[2] Lili Feng, Chunlei Zhang, Guo Gao, Daxiang Cui, Nanoscale Research Letters 7
(2012) 1-10.
[3] Angshuman Pal, Sunil Shah, Surekha Devi, Colloids and Surfaces A Physicochemical
and Engineering Aspects 302 (2007) 483-487.
[4] M. J. Rosemary, Thalappil Pradeep, Colloids and Surfaces A Physicochemical
and Engineering Aspects A 268 (2003) 81-84.
[5] Yingwei Xie, Ruqiang Ye, Honglai Liu, Colloids and Surfaces A Physicochemical
and Engineering Aspects 279 (2006) 175-178.
[6] Michael H. Huang, Samuel Mao, Henning Feick, Haoquan Yan, Yiying Wu, Hannes
Kind, Eicke Weber, Richard Russo, Peidong Yang, Science 292 (2001) 1897-1899.
[7] Xudong Wang, Jinhui Song, Jin Liu, Zhang L. Wang, Science 316 (2007) 102-105.
[8] C. Y. Jiang, X. W. Sun, G. Q. Lo, D. L. Kwong, J. X. Wang, Applied Physics Letters
90 (2007) 263501-263503.
[9] Qing Wan, Q. H. Li, Y. J. Chen, Ta-Hung Wang, X. L. He, J. P. Li, C. L. Lin, Applied
Physics Letters 84 (2004) 3654-3656.
[10] Chia Ying Lee, Seu Yi Li, Pang Lin, Tseung-Yuen Tseng, Journal of Nanoscience
Nanotechnology 5 (2005) 1088-1094.
[11] Hung-Ta Wang, B. S. Kang, Fan Ren, L. C. Tien, P. W. Sadik, D. P. Norton, S. J.
Pearton, J. Lin, Applied Physics Letters 86 (2005) 243503-243505.
[12] Jih-Jen Wu, Guan-Ren Chen, Hung-Hsien Yang, Chen-Hao Ku, Jr-Yuan Lai, Applied
Physics Letters 90 (2007) 213109-213111.
[13] S. F. Yu, C. Yuen, S. P. Lau, W. I. Park, G. C. Yi, Applied Physics Letters 84 (2004)
3241-3243.
[14] Nick Serpone, Deniele Dondi, Angelo Albini, Inorganica Chimica Acta 360 (2007)
794-802.
[15] Surabhi S. Kumar, Putcha Venkateswarlu, Vanka. R. Rao, Gollapalli N. Rao,
International Nano Letters 3 (2013) 1-6.
[16] M. Maillard, S. Giorgo, Marie P. Pileni, Advanced Material 14 (2002)1084-1086.
International Letters of Chemistry, Physics and Astronomy Vol. 19 33
[17] Zeena S. Pillai, Prashant V. Kamat, The Journal of Physical Chemistry B 108 (2004)
945-951.
[18] Kirti Patel, Sudhir Kapoor, D. P. Dave, Tulsi Murherjee, Journal of Chemical Science
117 (2005) 53-60.
[19] R. A. Salkar, P. Jeevanandam, S. T. Aruna, Yuri Koltypin, A. Gedanken, Journal of
Materials Chemistry 9 (1999) 1333-1335.
[20] Behrouz Soroushian, Isabelle Lampre, Jacqueline Belloni, Mehran Mostafavi,
Radiation Physics Chemistry 72 (2005) 111-118.
[21] B. G. Ershov, E. Janata, A. Henglein, A. Fojtik, Unpubliseh report (2007).
[22] Maria Starowicz, Barbara Stypula, Jacek Banaœ, Electrochemistry Communications 8
(2006) 227-230.
[23] Jun-Jie Zhu, Xue-Hong Liao, Xiao-Ning Zhao, Hong-Yuang Hen, Material Letters 49
(2001) 91-95.
[24] S. Liu, S. Chen, S. Avivi, A. Gendanken, Journal of Non-crystalline Solids 283 (2001)
231-236.
[25] F. J. Arriagada, K. Osseo-Asare, Journal of Colloid Interface Science 211 (1999) 210-
220.
[26] Dong-Sik Bae, Eun-Jung Jungkim, Jae-Hee Bang, Sang-Woo Kim, Kyong-Sop Han,
Jong-Kyu Lee, Byang-Ik Kim, James H. Adair, Metal and Materials International 11
(2005) 291-294.
[27] Dong-Sik Bae, Sang-Whan Park, Kyon-Sop Han, James H. Adair, Metal and Materials
International 7 (2001) 399-402.
[28] Marei P. Pileni, Structure and reactivity in reverse micelles, Elsevier, Amsterdam,
New York (1989).
[29] Harish Kumar, Renu Rani, Raj K. Salar, The European conference of chemical
engineering, and European conference of civil engineering, and European conference
of mechanical engineering, and European conference on Control (ECCE-10), 30 Nov.-
2 Dec., 2010, Tennrife Insland, Spain 88-94.
[30] Harish Kumar, Renu Rani, Raj K. Salar, Research Journal of Chemical 1 (2011) 42-48.
[31] J. K. Saha, J. Podder, Journal of Bangladesh Academic Sciences 35 (2011) 203-21.
[32] S. Quintillán, C. Tojo, M. C. Blanco, M. A. López-Quintela, Langmiur 17 (2001) 7251-
7254.
[33] D. Dodoo-Arhin, M. Leoni, P. Scardi, Molecular Crystals & Liquid Crystals 555
(2012) 17-31.
34 Volume 19

[34] Joint Committee on powder diffraction standards (2000) Diffraction data file, No. 36-
1451.
[35] C. Chena, B. Yu, P. Liu, J. F. Liu, L. Wang, Journal of Ceramic Processing Research
12 (2011) 420-425.
[36] Swee-Yong Pung, Wen-Pie Lee, Azizan Aziz, International Journal of Inorganic
Chemistry 2012 (2012) 1-9.
[37] B. D. Culity, Elements of X-ray diffraction 2nd
ed, Addison-Wesley, USA,
1987
[38] G. Voicu, O. Oprea, B. S. Vasile, E. Andronescu, Digest Journal of Nanomaterials and
Biostructures 8 (2013) 667-675.
[39] C. N. R. Rao, Chemical Applications of Infrared spectroscopy, Academic Press,
New York and London, 1963.
[40] I. Markova-Deneva, Journal of the University of Chemical Technology and Metallurgy
45 (2010) 351-378.
[41] V. Parthasarathi, G. Thilagavathi, International Journal of Pharmaceutical Science 3
(2012) 1-7.
[42] Pathik Kumbhakar, Devendra Singh, Chandra S. Tiwary, Amya K. Mitra,,
Chalcogenide letters 5 (2008) 387-394.
[43] T. S. Moss, G. J. Burrell, B. Ellis, Semiconductor Opto-Electronics, Butterworth &
Co. Ltd. 1973.
[44] H. M. Honsi, S. A. Fayek, S. M. Al-Sayed, M. Roushdy, M. A. Soliman, Vacuum
81 (2006) 54-58.
[45] A. Sawby, M. S. Selim, S. Y. Marzouk, M. A. Mostafa, A. Hosny, Physica B: Physics
of Condensed Matter 405 (2010) 3412-3420.
[46] N. F. Mott, E. A. Davies, Electronic Processes in Non-Crystalline Materials,2nd
ed.,
Claredon Press, Oxford, 1979.
[47] A. N. Banerjee, K. K. Chattopadhyay, in D. Depla, S. Maheiu (Eds.), Springer-
Verlag: Berlin, Heidelberg, 2008.
[48] M. Mazhdi, P. Hossein Khani, International Journal of Nano Dimensions 2 (2012) 233-
240.
[49] J. P. Yang,, F. C. Meldrum, J. H. Fendler, Journal of Physical Chemistry 99 (1995),
5500-5504.
[50] Saad F. Oboudi, Nadir F. Habubi, Ghuson H. Mohamed, Sami S. Chiad, International
Letters of Chemistry, Physics and Astronomy 8(1) (2013) 78-86.
[51] Sujan Kumar Das, Jahid M. M. Islam, Monirul Hasan, Humayun Kabir, Md. Abdul
Gafur, Enamul Hoque, Mubarak A. Khan, International Letters of Chemistry, Physics
and Astronomy 10(1) (2013) 90-101.
International Letters of Chemistry, Physics and Astronomy Vol. 19 35

[52] J. A. Najim, J. M. Rozaiq, International Letters of Chemistry, Physics and Astronomy
10(2) (2013) 137-150.
[53] Majid H. Hassouni, Khudheir A. Mishjil, Sami S. Chiad, Nadir F. Habubi, International
Letters of Chemistry, Physics and Astronomy 11 (2013) 26-37.
[54] C. Indira Priyadharsini, A. Prakasam, P. M. Anbarasan, International Letters of
Chemistry, Physics and Astronomy 12 (2013) 82-93
( Received 13 September 2013; accepted 17 September 2013 )
36 Volume 19