structural behaviour of conventional and frp- reinforced concrete … · structural behaviour of...
TRANSCRIPT

Structural Behaviour of Conventional and FRP- Reinforced Concrete
Deep Beams
Fawzi Ali Latosh
A Thesis
in
The Department
Of
Building, Civil, and Environmental Engineering
Presented in Partial Fulfillment of the Requirements
For the Degree of
Doctor of Philosophy (Building, Civil, and Environmental Engineering) at
Concordia University
Montréal, Québec, Canada
February 2014
© Fawzi Ali Latosh, 2014

CONCORDIA UNIVERSITY
SCHOOL OF GRADUATE STUDIES
This is to certify that the thesis prepared
By: Fawzi Ali Latosh
Entitled: Structural Behaviour of Conventional and FRP- Reinforced Concrete Deep
Beams and submitted in partial fulfillment of the requirements for the degree of
DOCTOR OF PHILOSOPHY (Civil Engineering)
Complies with the regulations of the University and meets the accepted standards with
respect to originality and quality.
Signed by the final examining committee:
____________________________________Chair
Dr. Brigitte Jaumard
____________________________________External Examiner
Dr. Dagmar Svecova
____________________________________External to Program
Dr. M. Packirisamy
____________________________________Examiner
Dr. K. Galal
____________________________________Examiner
Dr. L. Lin
____________________________________Thesis Supervisor
Dr. A. Bagchi
Approved by_______________________________________________________
Dr. M. Elektorowicz, Graduate Program
Director
February 27, 2014_______________________________________________________
Dr. Christopher Trueman,
Dean of Faculty of Engineering & Computer
Science

iii
ABSTRACT
Structural Behaviour of Conventional and FRP- Reinforced Concrete Deep Beams
Fawzi Ali Latosh, Ph.D.
Concordia University, 2014
Many structural applications such as pile caps, girders, foundation walls and offshore
structures include the use of reinforced concrete deep beams as structural elements. The
structural behaviour of deep beams is affected by its span to depth ratio, type of loading,
reinforcement ratio in vertical and horizontal directions, concrete strength, and type of
cross section. Since the traditional beam theory is not applicable for designing deep
beams, the strut and tie model (STM) was developed earlier as a rational method for
estimating the capacity of a reinforced concrete deep beam and accepted in the current
codes and standards for the design of such beams. While for designing a conventional
(i.e. steel reinforced) concrete deep beams STM has been available in different codes and
standards, for FRP-reinforced concrete deep beams such provisions are not available in
most codes and standards. Only in the recent edition of the relevant Canadian standard
(i.e., CAN/CSA S-806-12) which came out much later than the commencement of the
present research, an STM approach has been provided, which is primarily based on that
of conventional deep beams with some adjustments by using FRP reinforcement’s
properties to calculate the tie capacity. One of the reasons for the lack of standards or
code provisions for such systems in other codes (e.g., ACI and Eurocode) is perhaps the
lack of adequate experimental data available on the performance of such beams. As the
use of FRP reinforced concrete structures is increasing, there is a need to the

iv
development of a design method for FRP-reinforced concrete deep beams, which could
be similar to the existing STM method available for the conventional deep beams, similar
to the approach taken by the Canadian standard. But, such provisions must be validated
and/or modified appropriately and calibrated with experimental studies.
The objectives of the present research are to: (1) Identify the critical parameters
governing the behaviour of conventional concrete deep beams; (2) Develop a design
procedure for FRP reinforced concrete deep beams; (3) Study the critical factors in FRP-
reinforced concrete deep beams and evaluate the proposed design procedure using
numerical and experimental tests; and (4) Evaluate the STM procedure outlined in the
CSA-S806-12[2012] for designing FRP reinforced deep beams. The current design
provisions for conventional concrete deep beams as provided in the following three
prominent standards that use the strut–and-tie model have been extensively reviewed:
ACI 318-08, Eurocode EN 1992-1-1-2004(E) and Canadian code CSA A23-3-04. The
influence of different variables on the ultimate strength of deep beam estimated using
STM provisions in the codes are studied. A large database of available experimental
studies on conventional deep beams has been created. The ultimate load capacity and
failure pattern for each sample in the database have been evaluated using the STM
models provided in the above three standards, and compared with the experimental
results and critical parameters that have been identified. The results of the preliminary
study show that the use of Strut and Tie model are generally appropriate method for
beams with shear-span to depth ratio less than or equal to two. Also the study confirmed
that both the shear span-to-depth ratio and the amount of shear web reinforcement have

v
the most significant effect on the behaviour of deep beams and on the codes predictions
of the ultimate strength of deep beams.
Based on the review of the STM models available for the conventional deep beams as
provided in the current standards, a similar model has been developed here to design
FRP-reinforced deep beams. Using the proposed method, a set of FRP-reinforced deep
beam has been designed and constructed. An experimental program has been carried out
to test these beams to study the applicability of the proposed method and effect of the
critical design parameters. Nine FRP reinforced concrete deep beams were divided into
three groups, based on their shear span-to-depth ratio (a/d), and tested under a single
concentrated load to investigate their behaviour and strength. The test variables were the
shear span-to-depth ratio and the quantity of web shear reinforcement. The behaviour of
deep beams is indicated by their shear strength capacity, mid span deflection, strain at the
FRP longitudinal and web reinforcement, crack propagation, and type of failure. A new
equation is presented in this study to calculate the contribution of the FRP web
reinforcement to the ultimate shear capacity of FRP-reinforced concrete deep beams. As
a new version of the CSA standard is available now which provides STM procedure for
FRP-reinforced deep beams, the test results have been compared to predictions based on
the current CSA design procedure.
This investigation reveals that the Strut and Tie model procedure in the CSA-S806-12
code provides a conservative and convenient design procedure for FRP-reinforced
concrete deep beams. However, there are some areas where the code provisions can be
improved and some inconsistencies in the way the strut capacity is determined can be
removed. In addition, the shear design procedures of the ACI 440.1R-06 Code and of the

vi
modified Strut and Tie model (STM) from Appendix A of the ACI 318-08 Code were
compared based on their test results and a modified STM procedure based on ACI 318-08
provision has been proposed for the adoption to ACI 440. This investigation reveals that
adopting the procedure in the ACI 318-08 Code and taking into consideration the
properties of FRP reinforcement provides a conservative and rational design procedure
for FRP reinforced concrete deep beams.

vii
ACKNOWLEDGEMENTS
This thesis is dedicated to the soul of my father, to my beloved Mother, my brother,
my Wife, and my children, for care and support all the time. I would like to thank my
supervisor, Dr. Ashutosh Bagchi, for his kind instructions, continuous guidance and
encouragement he has provided throughout my time as his student. I would also like to
thank Dr.Khaled Galal for his cooperation. Many thanks to the structural laboratory staff,
especially for the help from Jaime Yeargans, Brian Cooper. Many thanks are due to my
colleagues Dr.Arash Rahmatian and Mr. Hany Seif Eldin and Mr. Ram Adhikari for their
support and valuable advice. Also, big thanks to the entire civil engineering faculty staff
for an amazing five years.
Also I wish to express my gratitude and sincere appreciation to the Libyan
Government for the scholarship provided to me to pursue graduate study at Concordia.
The support of the Natural sciences and Engineering research Council of Canada
(NSERC) is gratefully acknowledged. The authors would also like to thank Pultral Inc.,
Quebec for donating the FRP materials required for the research.

viii
TABLE OF CONTENTS
LIST OF FIGURES ..................................................................................................................... xiii
LIST OF TABLES ....................................................................................................................... xxi
LIST OF SYMBOLS ................................................................................................................. xxiii
Chapter 1: Introduction ................................................................................................................... 1
1.1. Introduction: ......................................................................................................... 1
1.2. Statement of the problem: .................................................................................... 3
1.3. Objectives and scope: ........................................................................................... 4
1.4. Thesis organisation:.............................................................................................. 6
Chapter 2: Literature Review .......................................................................................................... 8
2.1. Behaviour of Deep Beams: .................................................................................. 8
2.2. Modes of Failure: ................................................................................................. 9
2.3. Review of the Strut-and-Tie Models in various codes: ...................................... 10
2.3.1 General recommendations for designing reinforced concrete deep beams: ... 10
2.3.2 The American Concrete Institute (ACI) Model: ............................................. 13
2.3.3 The Eurocode Model: ..................................................................................... 17
2.3.4 The Canadian Standard Association (CSA) Model: ....................................... 17
2.4. Available experimental studies on conventional deep beams: ........................... 19
2.5. The effect of web reinforcements on the behavior of deep beams: ................... 20
2.5.1 Beam stiffness: ............................................................................................... 21
2.5.2 Crack-control: ................................................................................................. 21
2.5.3 Modes of failure: ............................................................................................ 22
2.5.4 Ultimate shear strength: .................................................................................. 22
2.6. The effect of shear-span to depth ratio on the behavior of deep beams: ............ 23
2.7. Further development of Strut and Tie models:................................................... 24
2.8. The use of Fibre-Reinforced Polymer (FRP) in deep beams ............................. 29
Chapter 3: Research Methodology and Experimental Setup ........................................................ 37
ix
3.1. Overview: ........................................................................................................... 37
3.2. Comparison of the STM procedures for conventional deep beams provided in
the three selected codes: ................................................................................................ 38
3.3. Design methods for FRP-reinforced concrete deep beams: ............................... 40
3.3.1. The STM design procedure adopted for the test specimens based on CSA
A23.3-04 [2004] and CSA S806-02 [2002]: ................................................................. 41
3.3.2. STM procedure in the CAN/CSA-S806-12 [2012] code: .............................. 41
3.3.3. Procedure for shear design in flexural regions in the CAN/CSA-S806-12
code: ……………………………………………………………………………….44
3.3.4. Procedure of shear design in flexural regions in the ACI 440.1R-06 code: ... 45
3.3.5. Proposed procedure for design designing FRP-RC deep beams based on ACI
code: ……………………………………………………………………………… 46
3.4. Experimental Plan: ............................................................................................. 47
3.4.1. Details of Test Specimens: ............................................................................. 48
Details of Specimens of Group A: ................................................................................ 50
Details of Specimens of Group B:................................................................................. 52
Details of Specimens of Group C:................................................................................. 53
3.4.2. Materials: ........................................................................................................ 55
Concrete: ....................................................................................................................... 55
Glass FRP Reinforcement Bars: .................................................................................... 58
3.4.3. Instrumentation: .............................................................................................. 59
3.4.4. Fabrication and Casting of Beams: ................................................................. 63
3.4.5. Test Procedure: ............................................................................................... 64
3.5. Objective of the Experimental Program: ............................................................ 67
Chapter 4: Comparison of the Different Design Provisions for Conventional Deep Beams ........ 68
4.1. Introduction: ....................................................................................................... 68
4.2. Calculating the capacity using the STM procedures: ......................................... 68
4.3. Comparison between the Strut-and-Tie model and the traditional (sectional)
beam theory: .................................................................................................................. 70
4.4. The codes prediction of ultimate shear strength of deep beams: ....................... 72
4.5. Comparison between the nominal and factored capacity of shear strength of
deep beams calculated by using the code provisions: ................................................... 73

x
4.6. The effect of web reinforcement on the code predictions of the ultimate strength:
76
4.7. The effect of shear-span to depth ratio on the code predictions of the ultimate
strength: ......................................................................................................................... 81
4.8. The prediction of the failure occurrence in deep beams: ................................... 84
9.4. Proposed modification to ACI code provision: ..................................................... 86
4.10. Summary:........................................................................................................ 90
Chapter 5: Results of the Experimental Study .............................................................................. 92
5.1. Introduction: ....................................................................................................... 92
5.2. Presentation of Test Results: .............................................................................. 93
5.3. Results for the specimens in Group A:............................................................... 93
5.3.1. Response of Beam A1/00: .............................................................................. 93
Crack development and failure mode in A1/00: ........................................................... 93
Load –Deflection response of A1/00: ........................................................................... 95
Load –Strain response of the main reinforcements in A1/00: ....................................... 96
5.3.2. Response of Beam A1/50: .............................................................................. 98
Crack development and failure mode in A1/50: ........................................................... 98
Load –Deflection response of A1/50: ......................................................................... 100
Load –Strain response of the main and web reinforcements in A1/50: ...................... 100
5.3.3. Response of Beam A1/75: ............................................................................ 103
Crack development and failure mode in A1/75: ......................................................... 103
Load –Deflection response of A1/75: ......................................................................... 105
Load –Strain response of the main and web reinforcements in A1/75: ...................... 106
5.3.4. Response of Beam A1/100: .......................................................................... 110
General response of A1/100: ....................................................................................... 110
Load –Deflection response of A1/100: ....................................................................... 112
Load –Strain response of the main and web reinforcements in A1/100: .................... 112
Comparison of beam performances within group A: .................................................. 116
5.4. Response of the beam in Group B:................................................................... 119
Crack development and failure mode in B1.5/100:..................................................... 119
Load –Deflection response of B1.5/100:..................................................................... 121
xi
Load –Strain response of the main and web reinforcements in B1.5/100: ................. 122
5.5. Response of Beams in Group C ....................................................................... 124
5.5.1. Response of Beam C2/00: ............................................................................ 125
Crack development and failure mode in C2/00:.......................................................... 125
Load –Deflection response of C2/00:.......................................................................... 126
Load –Strain response of the main reinforcement in C2/00: ...................................... 127
5.5.2. Response of Beam C2/50: ............................................................................ 129
General response of C2/50: ......................................................................................... 129
Load –Deflection response of C2/50:.......................................................................... 130
Load –Strain response of the main and web reinforcements in C2/50: ...................... 131
5.6. Response of Beam C2/75: ................................................................................ 134
Crack development and failure mode in C2/75:.......................................................... 134
Load –Deflection response of C2/75:.......................................................................... 136
Load –Strain response of the main and web reinforcements in C2/75: ...................... 136
5.7. Response of Beam C2/100: .............................................................................. 139
General response of C2/100: ....................................................................................... 139
Load –Deflection response of C2/100:........................................................................ 141
Load –Strain response of the main reinforcements in C2/100: ................................... 142
Comparison of beam performances within group C: .................................................. 145
5.8. Summary: ......................................................................................................... 148
Chapter 6: Effect of the Key Factors and Validation of the Design Provisions ......................... 149
6.1. Introduction: ..................................................................................................... 149
6.2. The effect of shear span-depth ratio a/d: .......................................................... 150
6.2.1. On the load-deflection behavior: .................................................................. 150
6.2.2. On the crack developments: ......................................................................... 152
6.2.3. On the failure modes: ................................................................................... 154
6.3. The effect of web reinforcements: ................................................................... 157
6.3.1. On the load-deflection behavior: .................................................................. 157
6.3.2. On the crack development and failure mode: ............................................... 158
6.3.3. On the Ultimate shear capacity: .................................................................... 159
6.4. Comparison of test results with predicted values by design provisions:.......... 161
xii
6.5. Comparison of experimental results with predicted capacity by the proposed
design procedure for deep beams based on ACI code: ............................................... 164
6.6. Summary: ......................................................................................................... 165
6.6.1. Effect of the key factors: .............................................................................. 166
6.6.2. Comparison with the design provisions: ...................................................... 167
Chapter 7: Summary and Conclusions ........................................................................................ 168
7.1. Summary .......................................................................................................... 168
7.2. Conclusions: ..................................................................................................... 170
7.2.1. Conclusions based on the behaviour of conventional deep beams and relevant
code provisions:........................................................................................................... 171
7.2.2. Conclusions based on the present experimental study of FRP-RC deep beams
and relevant design provisions: ................................................................................... 172
7.3. Research Contributions: ................................................................................... 174
7.4. Limitations of the Current Research and Potential for Future Research: ........ 175
References ................................................................................................................................... 177
Appendix A: ................................................................................................................................ 181
Appendix B: ................................................................................................................................ 189

xiii
LIST OF FIGURES
Figure Title Page
Fig. (2.1) Modes of failure of reinforced concrete deep beams
10
Fig. (2.2) Description of the Strut and Tie model
14
Fig. (2.3) Reinforcement crossing a strut
15
Fig. (2.4) Bottom nodal zone for one layer of steel
16
Fig. (2.5) (a) Dimensions of nodal zone; (b) compression strut mechanism;
(c) vertical truss mechanism; and (d) horizontal truss mechanism
25
Fig. (2.6) Combined strut-and-tie models
25
Fig. (2.7) Strut-and-tie model for deep beam
27
Fig. (2.8) Iteration procedure for computing the ultimate strength of for
simply supported deep beams
28
Fig. (2.9) (a) Test setup and dimensions; and (b) Sectional details
31
Fig. (2.10) Typical failure mode (Beam CN-3)
32
Fig. (2.11) (a) Test setup and the dimensions; and (b) sectional details
33
Fig. (2.12) Diagonal tension failure mode: (a) associated with no concrete
splitting (Beam CH-1.7); and (b) associated with concrete
splitting (Beam GH-1.7)
34
Fig. (2.13) Dimensions of beam sections and details of reinforcement
configuration
35
Fig. (2.14) Failure of the tested deep beams
36
Fig. (3.1) Strut and Tie Models: (a) beam specimen loaded by a single point
load, (b) beam specimen loaded by two point loads
39
Fig. (3.2) Beam A1/100: (A) elevation (B) cross section
51
Fig. (3.3) Beam A1/75: (A) elevation (B) cross section
51
Fig. (3.4) Beam A1/50: (A) elevation (B) cross section
52

xiv
Figure Title Page
Fig. (3.5) Beam A1/00: (A) elevation (B) cross section
52
Fig. (3.6) Beam B1.5/100: (A) elevation (B) cross section
53
Fig. (3.7) Beam C2/100: (A) elevation (B) cross section
54
Fig. (3.8) Beam C2/75: (A) elevation (B) cross section
54
Fig. (3.9) Beam C2/50: (A) elevation (B) cross section
55
Fig. (3.10) Beam C2/00: (A) elevation (B) cross section
55
Fig. (3.11) Concrete compressive stress-strain relationship
56
Fig. (3.12) Compression test of concrete cylinder
57
Fig. (3.13) Glass FRP stress-strain relationship
58
Fig. (3.14) The installation phase of strain gages in specimen A1/50
59
Fig. (3.15-a) The location of strain gages for specimen A1/100
60
Fig. (3.15-b) The location of strain gages for specimen A1/75
60
Fig. (3.15-c) The location of strain gages for specimen A1/50
60
Fig. (3.15-d) The location of strain gages for specimen A1/00
61
Fig. (3.15-e) The location of strain gages for specimen B1.5/100
61
Fig. (3.15-f) The location of strain gages for specimen C2/100
61
Fig. (3.15-g) The location of strain gages for specimen C2/75
62
Fig. (3.15-h) The location of strain gages for specimen C2/50
62
Fig. (3.15-i) The location of strain gages for specimen C2/00
62
Fig. (3.16) The stages of specimen preparation during and after the concrete
casting
63
Fig. (3.17) Typical test setup for any beam in group A
64
Fig. (3.18) The test Arrangement for beam A1/100
66

xv
Figure Title Page
Fig. (4.1) Description of strut and tie model
69
Fig. (4.2) Use of strut and tie model and sectional mode to predict the
strengths of a series of beams l: a.) Canadian code (A23.3-04); b.)
Eurocode (EN 1992-1-1-2004E), and c.) ACI code (ACI 318-08)
71
Fig. (4.3) The percentage of samples that Vcalc/Vexp ≤1 for all Specimens
73
Fig. (4.4) The percentage of samples that Vcalc/Vexp ≤1 for all specimens
74
Fig. (4.5) The percentage of samples having Vcalc/Vexp ≤1 considering the
effect of web reinforcement
78
Fig. (4.6) The percentage of samples having Vcalc/Vexp ≤1 (for specimens
with f`c≤40 MPa)
80
Fig. (4.7) The percentage of samples having Vcalc/Vexp ≤1 (for specimens
with f`c> 40 MPa)
80
Fig. (4.8) The percentage of samples having Vcalc/Vexp ≤1 considering a/d
ratio
81
Fig. (4.9) The prediction of failure occurrence by the STM provision of
codes
85
Fig. (4.10) Ratio of actual-to-calculated shear strength versus shear span-to-
depth ratio for specimens with web reinforcement.
87
Fig. (4.11) Ratio of actual-to-calculated shear strength versus shear span-to-
depth ratio for specimens without web reinforcement.
87
Fig. (4.12) The percentage of samples having Vcalc/Vexp ≤1 considering a/d
ratio
89
Fig. (4.13) The prediction of failure modes by using the ACI STM original
and modified model
90
Fig. (5.1) The propagation of the crack patterns in the beam A1/00 at four
different loading stages
94
Fig. (5.2) Crack pattern of specimen A1/00
94
Fig. (5.3) Deflection at mid-span of specimen A1/00
95

xvi
Figure Title Page
Fig. (5.4) Strains in the middle of the main tension GFRP reinforcement of
specimen A1/00
96
Fig. (5.5) Strains in the end of the main tension GFRP reinforcement of
specimen A1/00
97
Fig. (5.6) Strains in the middle of the main top GFRP reinforcement of
specimen A1/00
97
Fig. (5.7) The propagation of the crack patterns in the beam A1/50 at four
different loading stages
99
Fig. (5.8) Crack pattern of specimen A1/50
99
Fig. (5.9) Deflection at mid-span of specimen A1/50
100
Fig. (5.10) Strain in the middle of the main tension GFRP reinforcement of
specimen A1/50
101
Fig. (5.11) Strain in the end of the main tension GFRP reinforcement of
specimen A1/50
101
Fig. (5.12) Strain in the middle of the main top GFRP reinforcement of
specimen A1/50
101
Fig. (5.13) Strain in the vertical and horizontal GFRP web reinforcement left
side of specimen A1/50
102
Fig. (5.14) Strain in the vertical and horizontal GFRP web reinforcement
right side of specimen A1/50
103
Fig. (5.15) The propagation of the crack patterns in the beam A1/75 at four
different loading stages
104
Fig. (5.16) Crack pattern of specimen A1/75
105
Fig. (5.17) Deflection at mid-span of specimen A1/75
106
Fig. (5.18) Strain in the middle of the main tension GFRP reinforcement of
specimen A1/75
107

xvii
Figure Title Page
Fig. (5.19) Strain in the end of the main tension GFRP reinforcement of
specimen A1/75
107
Fig. (5.20) Strain in the middle of the main top GFRP reinforcement of
specimen A1/75
108
Fig. (5.21) Strain in the vertical and horizontal GFRP web reinforcement
right side of specimen A1/75
109
Fig. (5.22) Strain in the vertical and horizontal GFRP web reinforcement left
side of specimen A1/75
109
Fig. (5.23) The crack intersects the web reinforcement in specimen A1/75
110
Fig. (5.24) The propagation of the crack patterns in A1/100 at different
levels of loading
111
Fig. (5.25) Crack pattern of specimen A1/100
111
Fig. (5.26) Deflection at the mid-span of specimen A1/100
112
Fig. (5.27) Strain in the middle of the main tension GFRP reinforcement of
specimen A1/100
113
Fig. (5.28) Strain in the end of the main tension GFRP reinforcement of
specimen A1/100
114
Fig. (5.29) Strain in the middle of the main top GFRP reinforcement of
specimen A1/100
114
Fig. (5.30) Strain in the vertical and horizontal GFRP web reinforcement
right side of specimen A1/100
115
Fig. (5.31) Strain in the vertical and horizontal GFRP web reinforcement left
side of specimen A1/100
115
Fig.(5.32) Load- Deflection response for all beams in Group A
118
Fig. (5.33) The crack patterns in beam B1.5/100 at four different loading
120
Fig. (5.34) Crack pattern of specimen B1.5/100
120
Fig. (5.35) Deflection at mid-span of specimen B1.5/100
121

xviii
Figure Title Page
Fig. (5.36) Strain in the middle of the main tension GFRP reinforcement of
specimen B1.5/100
122
Fig. (5.37) Strain in the end of the main tension GFRP reinforcement of
specimen B1.5/100
123
Fig. (5.38) Strain in the vertical and horizontal GFRP web reinforcement
right side of specimen B1.5/100
124
Fig. (5.39) Strain in the vertical and horizontal GFRP web reinforcement left
side of specimen B1.5/100
124
Fig. (5.40) The crack patterns in beam C2/00 at three different loading
125
Fig. (5.41) Crack pattern of specimen C2/00
126
Fig. (5.42) Deflection at mid-span of specimen C2/00
127
Fig. (5.43) Strain in the middle of the main tension GFRP reinforcement of
specimen C2/00
128
Fig. (5.44) Strain in the end of the main tension GFRP reinforcement of
specimen C2/00
128
Fig. (5.45) Strain in the middle of the main top GFRP reinforcement of
specimen C2/00
129
Fig. (5.46) The crack patterns in beam C2/50 at four different loading
130
Fig. (5.47) Crack pattern of specimen C2/50
130
Fig. (5.48) Deflection at mid-span of specimen C2/50
131
Fig. (5.49) Strain in the middle of the main tension GFRP reinforcement of
specimen C2/50
132
Fig. (5.50) Strain in the end of the main tension GFRP reinforcement of
specimen C2/50
132
Fig. (5.51) Strain in the middle of the main top GFRP reinforcement of
specimen C2/50
133
Fig. (5.52) Strain in the vertical GFRP web reinforcement left side of
specimen C2/50
133

xix
Figure Title Page
Fig. (5.53) Strain in the vertical GFRP web reinforcement right side of
specimen C2/50
134
Fig. (5.54) The propagation of the crack patterns in the beam C2/75 at four
different loading.
135
Fig. (5.55) Crack pattern of specimen C2-75
135
Fig. (5.56) Deflection at mid-span of specimen C2/75
136
Fig. (5.57) Strain in the middle of the main tension GFRP reinforcement of
specimen C2/75
137
Fig. (5.58) Strain in the end of the main tension GFRP reinforcement of
specimen C2/75
137
Fig. (5.59) Strain in the middle of the main top GFRP reinforcement of
specimen C2/75
138
Fig. (5.60) Strain in the vertical and horizontal GFRP web reinforcement
right side of specimen C2/75
138
Fig. (5.61) Strain in the vertical and horizontal GFRP web reinforcement left
side of specimen C2/75
139
Fig. (5.62) The propagation of the crack patterns in the beam C2/100 at four
different loading
140
Fig. (5.63) Crack pattern of specimen C2/100
141
Fig. (5.64) Deflection at mid-span of specimen C2/100
141
Fig. (5.65) Strain in the middle of the main tension GFRP reinforcement of
specimen C2/100
142
Fig. (5.66) Strain in the end of the main tension GFRP reinforcement of
specimen C2/100
143
Fig. (5.67) Strain in the middle of the main top GFRP reinforcement of
specimen C2/100
143
Fig. (5.68) Strain in the vertical and horizontal GFRP web reinforcement
right side of specimen C2/100
144

xx
Figure Title Page
Fig. (5.69) Strain in the vertical and horizontal GFRP web reinforcement left
side of specimen C2/100
144
Fig. (5.70) The crack intersects the web reinforcement specimen C2/100
145
Fig.(5.71) Load- Deflection response for specimens in Group C
147
Fig. (6.1) Ultimate mid-span deflection over the active depth Δ/d versus the
percentage of the ratio of web reinforcement
151
Fig.(6.2) Load deflection response of A1/100,B1.5/100 and C2/100 beams
151
Fig.(6.3) Ultimate shear stress versus Δ/d for A1/100,B1.5/100 and C2/100
beams
152
Fig. (6.4) Flexural, diagonal and ultimate shear stress versus shear span-
depth ratio (a/d).
154
Fig. (6.5) Flexural, diagonal and ultimate load versus the percentage of the
ratio of web reinforcement for beams in Group A
155
Fig. (6.6) Flexural, diagonal and ultimate load versus the percentage of the
ratio of web reinforcement for beams in Group C
155
Fig. (6.7) Load –Strain response in the middle of the main tension GFRP
reinforcement of specimens in Group A and C
158
Fig. (6.8) Use of strut and tie model and sectional mode to predict the
strengths of a series of beams
163

xxi
LIST OF TABLES
Table Title Page
(2.1) The reduction factor of the effective compressive strength for ACI318-08,
Euro code EN 1992-1-1-2004(E) and Canadian code A23-3-04
18
(2.2) Description of collected specimens
20
(2.3) Details of the available experimental studies
23
(2.4) Details of the test specimens
30
(2.5) Details of the test specimens
33
(2.6) Details of the test specimens
35
(3.1) Details of the experimental specimens
50
(3.2) Concrete mixture details
56
(3.3) Average concrete strength determined from test cylinders
57
(3.4) Manufacture’s properties of Glass FRP bars
59
(3.5) The loading rate of the beams in group A, B and C
65
(4.1) Statistical analysis of the prediction of the ultimate shear strength by
different codes
75
(4.2) Statistical analysis of the prediction of the ultimate shear strength by
different codes considering the effect of web reinforcement
79
(4.3) Statistical analysis of the prediction of the ultimate shear strength by
different codes considering the effect of shear span-to-depth ratio
83
(5.1) Summary of all experimental results
92
(5.2) The applied loads at different stages of the four beams in group A
117
(5.3) The deflection at different stages of load for all beams in Group A
119
(5.4) The applied loads at different stages of the four beams in Group C
146
(5.5) The deflection at different stages of load for all beams in Group C
148

xxii
Table Title Page
(6.1) The predictions for contribution of the FRP web reinforcement
on the ultimate shear capacity
160
(6.2) Summary of the predictions for ultimate shear strength
162
(6.3) Summary of the predictions for ultimate shear strength
164

xxiii
LIST OF SYMBOLS
a Shear span, equal to distance from center of concentrated load to either: (a) face of
support for continuous or cantilevered members, or (b) center of support for simply
supported members
αi Angle between the axis of a strut and the bars in the i-th layer of reinforcement
crossing that strut
Ac Area of concrete section resisting shear transfer
Asd b min Cross sectional area
Acs Cross-sectional area at one end of a strut in a strut-and-tie model, taken perpendicular
to the axis of the strut
Afv Amount of FRP shear reinforcement within spacing s
Anz Area of a face of a nodal zone or a section through a nodal zone
Ast Total area of nonprestressed longitudinal reinforcement (bars or steel shapes)
Atf Area of FRP reinforcement in tension tie
Atp Area of prestressing steel in a tie
b Width of compression face of member
bw Web width, or diameter of circular section
bs Width of strut
d Distance from extreme compression fiber to centroid of longitudinal tension
reinforcement
f`c Specified compressive strength of concrete
fcd Design value of concrete compressive strength
fce Effective compressive strength of the concrete in a strut or a nodal zone
fck Characteristic compressive cylinder strength of concrete at 28 days
fcu Limiting compressive stress in concrete strut

xxiv
ffb Strength of bent portion of FRP bar
ffu Design tensile strength of FRP, considering reductions for service environment
ffv Tensile strength of FRP for shear design, taken as smallest of design tensile strength
ffu Strength of bent portion of FRP stirrups ffb, or stress corresponding to 0.004Ef
fse Effective stress in prestressing steel (after allowance for all prestress losses)
fy Specified yield strength of reinforcement
Fn Nominal strength of a strut, tie, or nodal zone
Fnn Nominal strength at face of a nodal zone
Fns Nominal strength of a strut
Fnt Nominal strength of a tie
Fu Factored force acting in a strut, tie, bearing area, or nodal zone in a strut-and-tie
model
h Overall thickness or height of member
k Ratio of depth of neutral axis to reinforcement depth
K1 Coefficient
K2 Coefficient
K3 Coefficient
ln length of clear span measured face-to-face of supports
S Center-to-center spacing of items, such as longitudinal reinforcement, transverse
reinforcement, prestressing tendons, wires, or anchors,
Si Center-to-center spacing of reinforcement in the i-th layer adjacent to the surface of
the member
Vn Nominal shear strength at section
Vc Nominal shear strength provideby concrete
Vcalc Shear force at section calcoulated by code provisions

xxv
VEd Design value of the applied shear force
Vexp Mesurd shear force at section
Vf Shear resistance provided by FRP stirrups
Vn Mesurd shear force at section
Vntest
Shear force at section calcoulated by code provisions
Vu Factored shear force at section
ws Width of a strut perpendicular to the axis of the strut, mm
β Coefficient
βs Factor to account for the effect of cracking and confining reinforcement on the
effective compressive strength of the concrete in a strut
βn Factor to account for the effect of the anchorage of ties on the effective compressive
strength of a nodal zone
Δfp Increase in stress in prestressing steel due to factored loads
ε1 Principal tensile strain in cracked concrete due to factored loads
εs Strain in reinforcement
εx Longitudinal strain at mid-depth of the member due to factored loads
θ Angle between axis of strut, compression diagonal, or compression field and the
tension chord of the member
θs Smallest angle between compressive strut and adjoining tensile ties
λ Modification factor reflecting the reduced mechanical properties of lightweight
concrete
γc Partial factor for concrete
ν Strength reduction factor for concrete cracked in shear

xxvi
σRd, max Maximum stress which can be applied at the edges of the node
ϕ Resistance factor applied to a specified material
ϕc Resistance factor for concrete
ϕs Resistance factor for non-prestressed reinforced bars
ν Strength reduction factor for concrete cracked in shear
1
Chapter 1: Introduction
1.1. Introduction:
Many structural applications include the use of reinforced concrete deep beams e.g.
pile caps, girders, foundation walls and offshore structures. The structural behaviour of
deep beams is affected by its span to depth ratio, type of loading, reinforcement ratio
(vertical and horizontal), concrete strength, and the type of cross section. As the variation
in longitudinal strain is nonlinear over the depth of the cross section of the beam, the
plane sections theory that applies to the design of simple beams cannot be used in
designing deep beams. The Strut and Tie model (STM) has been adopted by the modern
codes to design the deep beams in a more effective way. The STM provides a rational
and acceptable theory for the design of deep beams which generally agrees well with the
results of experimental studies. Michael et al. [2006] reported that the first application of
STM was in the eighties in the Canadian Code [1984], followed by the Eurocode [1992]
in applying the STM to design deep beams. The first appearance of the STM in the
American Concrete Institute Code ACI 318 [2002] was at the end of the twentieth
century. It should be noted that the implementation of the STM models as provided in the
above-mentioned codes differ from each other. Some differences exist among the codes
in the implementation of STM, particularly in determining the amount of web
reinforcement and the shape of the struts.
Deep beams in many structural applications are exposed to the risk of corrosion or
to severe environmental conditions that may result in shortening of their lifespans.
Compared to conventional steel reinforcement, Fiber-Reinforced Polymer (FRP)

2
materials are stronger, lighter and free of corrosion problem. FRPs are therefore being
used as an alternative to steel reinforcement in many structural applications, including
deep beams. While, many studies have demonstrated the effectiveness of FRP bars in
concrete structural elements, not many studies are available for concrete deep beams
reinforced with FRP bars. The increasing use of this material in construction led to the
development of standards for the design and construction of building components with
Fiber-Reinforced Polymers.
The CAN/CSA-S806-02[2002], the ACI 440.1 R-06[2006] and the CAN/CSA-
S806-12 [2012] standards provide requirements for the design and evaluation of building
and building components reinforced (internally or externally) with FRPs. A design
manual has been issued by the Canadian Network of Centres of Excellence on Intelligent
Sensing for Innovative Structures (ISIS Canada Research Network [2007]) to provide
guidelines and design equations that can be used for the design of FRP-reinforced
concrete structures.
For designing normal (i.e. shallow) beams using any FRP standard, the relevant
equations for steel reinforced concrete have been adopted and modified for FRP
reinforcement. CAN/CSA-S806-02 Standard [2002], ACI 440.1 R-06[2006] and the ISIS
design manual did not provide any procedure to design deep beams reinforced with FRP
bars. Moreover, according to clause 8.6.6.4 of CAN/CSA-S806-02[2002] the strut and tie
models was not permitted in the design of beams. The present research was motivated by
the increasing use of FRP reinforcement in concrete structures and the lack of appropriate
design provisions for FRP-reinforced concrete deep beams.

3
The newer edition of the Canadian Standard, CAN/CSA-S806-12[2012] does adopt the
STM approach, originally developed for conventional (i.e. steel reinforced) deep beams,
with some adjustments that account for the properties of FRP. However, these provisions
are not adequately verified with experimental studies of FRP-reinforced concrete deep
beams. Presently, a very limited number of experimental studies are available for FRP-
RC deep beams. ACI 440.1 R-06 [2006] does not provide any design procedure for FRP-
reinforced concrete deep beams as of yet. For designing conventional deep beams, most
codes, for example the ACI 318-08 [2008], the Eurocode [2004] and the CSA [2004],
individualize the STM model with special clauses or appendixes (Appendix A, clause 6.5
and clause 11.4, respectively) to clarify STM model design procedure for deep beams.
Given the advancement in the use of FRP materials and their adoption in reinforced
concrete structures, the development of an STM-design procedure for FRP-reinforced
concrete deep beams for the ACI 440 code will be of interest. Also the effectiveness of
the STM approach in CAN/CSA-S806-12[2012] needs to be validated further with
experimental results.
1.2. Statement of the problem:
Studies on the behaviour of deep beams reinforced by FRP bars are very limited as
compared to that on steel reinforced concrete deep beams. The aim of the study is to
investigate the structural behaviour of concrete deep beams reinforced by FRP. For a
better understanding of deep beam behaviour, the proposed research consists of three
parts. The first part focuses on the review of available experimental studies on
conventional concrete deep beams and comparison of the code provisions in prominent
jurisdictions to gain an insight in the behaviour of such beams so that a design procedure

4
can be developed for them. The second part focuses on the development of an
experimental program in which a set of concrete deep beams reinforced by FRP will be
designed, constructed and tested, to study the effect of the key variables and validate the
existing provisions of the Canadian standard. The amount of the web reinforcement has
been chosen as a variable to study since the experimental results on steel-reinforced deep
beams as reported in the literature indicate that web reinforcement is very important in
controlling the mid-span deflection, crack width, failure modes, ultimate strengths and
the overall behaviour of reinforced concrete deep beams. Moreover, the shear span-to-
depth ratio will be studied because of its major effect on changing the behavior of beams
as well as on the failure mechanism.
As the existing standard on FRP-reinforced concrete structures ACI 440.1 R-
06[2006] does not provide a procedure for designing deep-beams, the present study is
aimed at understanding such beams and developing a design procedure. Also this
investigation evaluates the STM procedure of the CSA-S806-12[2012] for design of FRP
reinforced deep beams, which was adapted from the STM procedure for conventional
deep beams as provided in CSA A23.3-04.
1.3. Objectives and scope:
The objective of the present research is to understand the behaviour of FRP-reinforced
concrete deep beams. The behaviour of deep beams is indicated by their levels of
ultimate shear strength, mid span deflection, FRP reinforcement strain, crack
propagation, and by their type of failure. In addition to the main objective, this study
has the following objectives:

5
1. Review the available experimental studies on conventional reinforced concrete
deep beams and identify the critical parameters governing their behaviour.
2. Compare the STM provisions of relevant codes and standards for the design of
concrete deep beams, and verify the accuracy and the reliability of the Strut and
Tie model (STM) provisions in different codes with respect to the available
experimental studies.
3. Develop an experimental program to study the effects of the critical factors in FRP
reinforced concrete deep-beams and validate the existing design procedures.
4. Develop a design procedure or modify the existing one for FRP reinforced
concrete deep beams based on the results of the present and available experimental
studies.
The objectives 1 and 2 have been achieved by utilizing a database of existing
experimental studies on conventional deep beams. The effects of governing variables,
such as the shear span to depth ratio, amount of web reinforcement, and the compressive
strength of concrete were identified and have been explained as observed in the available
studies. The results of more than three hundred test specimens from available
experimental studies on reinforced concrete deep beams have been used to evaluate and
compare the Strut-and-Tie modeling provisions of the codes. An experimental study has
been conducted to achieve objectives 3 and, 4 and validate the current design procedure.
A design procedure of FRP- reinforced concrete deep beams have been developed based
on the design procedure available for conventional deep beams and FRP-reinforced
ordinary beams, and compared to the current design procedures.

6
1.4. Thesis organisation:
The thesis is organized in eight chapters. A general introduction, statements of the
problem, the research objectives and the thesis organization is presented in this chapter.
The second chapter presents the literature review including: i) review and discussion of
the behaviour of deep beams, and description of the modes of failure; ii) review of the
Strut-and-Tie Models in provisions of the design codes and standards in three different
jurisdictions including Canada; iii) presentation of the available experimental studies on
conventional deep beams; iv) identification of the key parameters affecting the behavior
of deep beams; and v) overview of the use of Fiber-Reinforced Polymer in deep beams
and available experimental studies on FRP reinforced deep beams. Chapter three presents
the research methodology and experimental setup. Chapter four presents the comparison
of the design Provisions for conventional deep beams in different codes. The effects of
governing variables, such as the shear span-to-depth ratio, web reinforcement, and the
compressive strength of concrete on the code predictions of the ultimate strength capacity
have also been investigated here. The effectiveness of the STM provisions of different
codes in predicting the failure modes of concrete deep beams has also been studied in this
chapter. Chapter five presents the experimental results of nine FRP reinforced concrete
deep beams. The experimental results for each tested beam are presented individually and
discussed in this chapter. Chapter six provides a synthesis of the experimental results to
highlight the effect of the shear span to depth ratio and the amount of web reinforcement
on the behavior of the FRP-RC deep beams. Chapter seven describes the design
procedure developed for designing FRP-RC deep beam in the context of Canadian (CSA)
and American (ACI) codes which have been compared and validated with the test results

7
and available provision in the current codes and standards. The summary, conclusions,
and recommendation for future work are provided in Chapter seven.

8
Chapter 2: Literature Review
2.1. Behaviour of Deep Beams:
Nawy [2005] mentioned that the behavior of deep beams is nonlinear; they behave as
two-dimensional elements subjected to a two-dimensional state of stress, the strain
distribution is nonlinear distribution, the plane sections do not remain planar after
bending, and shear deformations will become significant in deep beams, which mean that
the assumption of plan section theory cannot be applied. Different codes define deep
beams slightly differently, based on the nonlinear variation of strain distribution over the
depth of the cross section. A deep beam is defined in ACI 318-08[2008] code as a beam
that is loaded on one face and supported on the opposite face, that has a clear span, ln,
equal to or less than four times the overall member depth, and that has regions of
concentrated loads within the height of (a ≤ 2h), where a and h are the shear-span and
depth, respectively. According to the Eurocode (EN 1992-1-1-2004-E) [2004], the clear
span, ln, of the beam should be equal to or less than three times the depth, whereas the
Canadian code A23-3-04[2004] defines a deep flexure member as a beam having a clear
span to overall depth ratio less than 2. The differences between the definitions of the
deep beam in different codes are mainly due to the way the codes account for the
nonlinear variation in the strain distribution over the depth of the cross section. Deep
beams are different from the conventional beams, where the shear strength of deep beams
is a function of several variables such as the shear span to depth ratio a/d, the web
reinforcements (both in horizontal and vertical directions), concrete compressive
strength, and the loading area and support width.

9
2.2. Modes of Failure:
Michael and Oguzhan [2008], Carlos et al [2006], and Tan et al [1997a] have
observed the following failure modes in their experiments: (i) shear failure, (ii) flexural
failure, and (iii) anchorage failure (as illustrated in Fig 2-1). The first and the most
common type of failure is shear failure, which is brittle in nature. The second type is
flexural failure (tensile failure), which occurs at the bottom of the mid-span of a beam at
the position of the lower longitudinal reinforcement when there is insufficient
reinforcement. The third type is anchorage failure, which happens at the bottom of the
beam at the ends of the main reinforcement when the development length or anchorage
length is insufficient or when there is no mechanical anchorage at all. The shear failure
mode is further classified into three categories:
a) Diagonal Splitting Failure. This occurs at the middle of the depth of the beam
parallel to the strut. The cracks propagate in both directions towards the loading
plate and the bearing plate. Without sufficient reinforcement, this failure can
occur suddenly due to the splitting of a concrete strut. This type of failure cannot
be predicted by the STM provisions of any of the three selected codes;
b) Diagonal Compression (strut crushing) Failure. This occurs at a beam’s mid-
depth, longitudinally between the end of the loading plate and the beginning of a
strut, following the formation of several diagonal cracks; and
c) Shear Compression Failure (node failure). This occurs near the loading or
bearing plate.

10
Fig. (2.1) Modes of failure of reinforced concrete deep beams. Michael and Oguzhan
[2008], Carlos et al [2006] and Tan et al [1997a]
2.3. Review of the Strut-and-Tie Models in various codes:
2.3.1 General recommendations for designing reinforced concrete deep beams:
The main recommendations for deep beams as provided in these codes are
summarized here:
In the design of deep beams, the nonlinear distribution of strain needs to be
considered. Strut-and-Tie Models may be used. The ACI 318-08[2008], Eurocode
[2004] and CSA A23-3-04[2004] provide slightly different versions of the STM.
Lateral buckling shall be considered when a beam is very thin; such that the h/b
ratio is large (b is the width of the beam). This phenomenon has been investigated
by many researchers to determine the size effect on the failure shear strength, as
discussed below.

11
- In a study based on experiments, Kani [1967] has determined that with a
ratio of h/b from 0.5 to 1.8, the width, b, has no effect on the failure shear
strength. He has suggested that, in other words, the out-of-plane
deformation may have no significant effect on the beam strength.
- On the other hand, Kotosoves and Pavlovic [2004] have concluded that the
out-of-plane action has a significant effect on the beam strength when the
beam cross section is thin or slim. Zhang and Tan [2007] have reached a
similar conclusion.
The definition of the nominal shear strength capacity, Vn, for a deep beam varies
from one code to another.
- ACI 318-08[2008] defines Vn as 0.83√f`c bw d (in SI units, with bw and d
in mm, and f`c in MPa).
- In the Eurocode [2004], Vn is determined by the reaction VEd, which is
equal to 0.5bw dν fcd (in SI units). This value may be multiplied by β= a/2d
if the shear-span is between 0.5d and 2d.
- CSA [2004] does not specify any limitation on the ultimate shear force,
which is calculated from the STM.
The maximum horizontal and vertical reinforcement in the side faces of a deep
flexural member should satisfy the code requirements as discussed below.
- The provisions of ACI 318-08[2008] specify that the area of the vertical
(AV) and horizontal reinforcement (AH) should not exceed 0.0025bwS1 and
0.0015 bwS2 respectively. As shown in Figure 2.3, S1 and S2 are spacings

12
of the bars in the respective directions. The bar spacing S1 and S2 should be
less than d/5 and 12 in or 305 mm.
- The Eurocode [2004] provides that the area of skin reinforcement in the
form of the orthogonal mesh should be 0.1% of the beam cross-sectional
area, but not less than 150 mm2/m in each face and direction; and the bar
spacing, S, should be less than 2b and 300 mm.
- CSA A23-3-04[2004] specifies that web reinforcement is required if the
height of a deep beam exceeds 750 mm and shall be uniformly distributed
along the exposed side faces for a distance of [0.5h-(2h-d)] . In such a
case, the area of reinforcement should not exceed 0.002Ac in each
direction, and the bar spacing, S, should not exceed 300 mm.
Based on the equation provided in the codes given above for determining and
analyzing the beam capacity, the use of web reinforcement appears to have no
effect on the way of calculating the strength of the struts. Only in ACI 318-
08[2008], especially for a bottle-shaped strut, does the reduction factor βs become
0.75 if f`c ≤ 6000 psi or 40 MPa and if the web reinforcement satisfies equation
(A-4) of ACI 318-08[2008] code. Experimental studies, however, as discussed
below, show that the web reinforcement may play an important role in enhancing
the capacity of a concrete deep beam.
- Michael and Oguzhan [2008] have assembled a database of tests, the
results of which indicate that for a beam with an a/d ratio less than two,
the vertical web reinforcement alone is more effective than a combination
of horizontal and vertical web reinforcement.

13
- Zhang and Tan [2007] have conducted experimental tests on beams with
and without web reinforcement; their results show that the beams with
web reinforcement had higher serviceability loads.
2.3.2 The American Concrete Institute (ACI) Model:
ACI 318-08[2008] Appendix A provides the procedure for calculating the nominal
capacities of the elements of the STM, which are the strut (a compression member), nodal
zone and the tie (a tension member) as shown in Fig. (2.2).The design of the struts, ties
and nodal zone are based on: φFn≥Fu where Fu is the largest force in that element for all
loading cases, Fn is the nominal strength, and φ is a factor specified by clause 9.3.2.6 in
the code.
There are two types of struts defined in the procedure. The first type of strut has a
uniform cross sectional area over its length between the applied load and the support
plate. The nominal capacity of a strut is given by fce= 0.85 βs f`c, where βs is defined as
the efficiency factor. The efficiency factor βs is the reduction of the ultimate strength of
the strut. This factor reflects the ability of the concrete to resist loads at cracking develops
or to transfer compression across cracks in a tension zone. The value of βs ranges from
0.4 to 1 based on the type of the strut. The second type of strut is a strut with a bottle
shape as shown in Figure (2.2). The nominal capacity of this type of strut is calculated in
the same way as the straight struts, but with a different value for the efficiency factor βs.

14
Nodal Zone
"CCC"
Nodal Zone
"CCT"
Tie (bottom reinforcement)
Bottle-Shaped
StrutStrut of uniform
cross section
P
Fig. (2.2) Description of the Strut and Tie model.
For this type of strut, the βs is taken as 0.75 if f´c is not greater than 40 MPa and if the
web reinforcement satisfies Equation (A-4) of ACI 318-08[2008] as shown in Eq (2.1)
below.
(2.1)
In the above equation, Si and ASi indicate spacing and area of a bar for web reinforcement
(horizontal or vertical), and bs indicates the width of the strut as shown in Fig. (2.3).
Michael and Oguzhan [2008] have argued that it is not preferable to use this type of
strut since the web reinforcement is less than the required amount and such an amount
cannot prevent the diagonal tension crack from growing. In the case of a high-strength
concrete f`c >40 MPa, where the code does not provide any specific guideline, Carlos et
al [2006] have assumed a shallower slope of 6:1 for the spread of the compressive force
in the strut to avoid an excessive number of web reinforcement. The efficiency factor is

15
taken equal to 0.6λ for a strut without web reinforcement case and for all other cases that
do not meet the above requirements.
Fig. (2.3) Reinforcement crossing a strut. ACI 318-08 [2008]
Park and Aboutaha [2009] have compared the efficiency factors for different models
and have concluded that the results obtained using ACI 318-08 [2008] are not
conservative as compared to the experimental results in many cases. However, the code
does not specify which type of strut should be used in the design procedure. The
provisions of the code allow the designer to choose the type of strut that is used in
determining the capacity of the element. Consequently; the procedure may yield multiple
solutions.
The nominal compressive strength of a strut is given by Fns= fce *Acs, where Acs is the
cross sectional area calculated by multiplying the width of the strut (ws) by the beam
width Figure (2.4), and fce is the effective compressive strength of concrete. Fns is
Stru
t's A
xis
Stru
t Bou
ndar
y
Stru
t
a1
a2
S 2
S 1
Web Reinforcement
Vertical Reinforcement
(As1)
Horizonatl
Reinforcement
(As2)

16
calculated at each end of a strut and the lesser value is considered. The strength of the
node zone must be checked at the minimum face area of the node by following equation
Fnn= fce Anz where Anz is the area of the face of the nodal zone on which Fu acts and fce =
0.85 βn f`c ,where βn is taken as 0.6,0.8 and 1 for CTT, CCT and CCC nodes,
respectively, where C and T indicate whether an interacting member at that node is in a
compression or a tension. In the first two cases, the strength of the nodal interface is
adjusted by the strength of the strut.
Fig. (2.4) Bottom nodal zone for one layer of steel.
The strength of ties is given by following the equation Fnt = Atsfy + Atp(fse + Δfp) where
the second part of the equation is related to pre-stressed members. The code provides
some recommendations for applying the tie reinforcement which are: the axis of the
reinforcement and the axis of the tie coincide together, and shall be anchored by
mechanical devices – standard hooks-or sufficient straight bar. ACI 318-08 [2008] gives

17
the limitation for the angle θ between the axis of the strut and tie as not less than arc tan
½ = 26.5° to mitigate cracking and to avoid incompatibilities.
2.3.3 The Eurocode Model:
The compressive force in a strut is apportioned by the compression strength of the
cylindrical concrete fck. According to the Euro code, there is only one type of strut which
is the strut with a uniform cross section, as in the CSA code [2004]. However, unlike the
strut described in the CSA code [2004], this type of strut may have two different
efficiency factors based on the transverse tension within the strut. For the first category,
when the strut without transverse tension, the factor is equal to 1/γc, where γc is a partial
factor for the concrete in transient design situations and is equal to 1.5, and for accidental
design situations is equal to 1.2. For the second case, the efficient factor of a strut with
transverse tension is given by ν= 1- fck/250. The compressive strength has a large effect
on calculating the efficiency factor in the second category, for example ν=0.9 for fck=25
N/mm2
whereas ν=0.84 for fck=40 N/mm2. As stated by the Euro code EN 1992-1-1-
2004(E) [2004] there are three nodal zones CCC, CCT, and CTT that are based on the
node region and the direction that anchoring by tie. The compressive stress in these nodes
CCC, CCT and CTT should not exceed the compressive stress of concrete σRd,max ,
reducing it by K1,K2 and K3 respectively for each type of node where K1=1, K2=0.85 and
K3=0.75.
2.3.4 The Canadian Standard Association (CSA) Model:
The CSA code [2004] provides that all struts are to be assumed to have uniform cross
sections and the compressive force in a strut must not exceed c fcu Acs, where

18
fcu =f`c /(0.8+170ε1)≤0.85f`c (2.2)
and
ε1=εf+(εf+0.002)cot2Ѳs (2.3)
where, θs is the smallest angle between the strut and the adjoining tie. In the above
equation, the nominal capacity of the strut will be reduced by c / ( 8+17 ε1), which is
not to exceed 0.85 c..
Table (2.1) The reduction factor of the effective compressive strength for ACI 318-08,
Euro code EN 1992-1-1-2004(E) and Canadian code A23-3-04
Type
ACI318-08 Euro code EN 1992-1-1-2004(E) Canadian code
A23-3-04
Features ν Features ν Features ν
Uniform cross
section
occur in
compression zone 0.85
With
transverse
tension
transient
0.67
wherever
occur 0.55
occur in tension
zone 0.34
Strut
bottle- shaped
satisfying equation
(A-4) 0.64
accidental
0.83 not satisfying
equation (A-4) 0.51
not clarifying other than above 0.51
without transverse
tension for fck=40 N/mm2
0.84
CCC compression reign 0.85
compression reign for
fck=40 N/mm2
0.84 CCC 0.55
Node CCT
compression reign
+ one tie 0.68
compression reign + one
tie for fck=40 N/mm2
0.714 CCT 0.49
CTT compression reign
+ two tie or more 0.51
compression reign + two
tie or more for fck=40
N/mm2
0.63 CTT 0.43
The following three nodal zones are specified in CSA A23-3-04 [2004] based on the
node region and the direction that anchoring by tie, CCC, CCT and CTT, such that the
compressive stress in these nodes does not exceed f`c reduced by 0.85 c, 0.75 c and
0.65 c respectively. Also the tensile force in a tie should not exceed s fy Ast. The

19
Canadian code recommends that the tie reinforcements be adequately anchored and that
the angle θ between the axis of a strut and a tie be not less than 29+7000εx. Table (2.1)
contains a comparison of the reduction factors of the effective compressive strength of
struts and of the nodes as defined in the codes. The reduction factor is defined as μ= β ,
where β is the efficiency factor and Φ is the strength coefficient.
2.4. Available experimental studies on conventional deep beams:
A number of experimental studies have been conducted in the past on deep-beams to
study their behavior. An extensive literature review has been performed to collect the
information about the available experiential studies on deep beams and compile database
for the specifications of the test specimens utilized in these studies. The results of test
specimens from available experimental studies on reinforced concrete deep beams have
been used for the present study to evaluate and compare the Strut-and-Tie modeling
provisions of the codes from three different jurisdictions: Canada, USA and Europe. The
effectiveness of the Strut-and-Tie modeling provisions of the three different codes in
predicting the ultimate strength and failure modes of deep beams has been evaluated
against the actual behavior of such beams observed in experimental studies. Table (2-2)
contains a brief summary of all the specimens in the database. The detailed description
for all testes are provided in appendix A. They are deep beams subjected to one or two
concentrated loads. The experimental samples contain a wide range of the compressive
strength of concrete ( f`c from 16.5 MPa to 120 MPa). The shear-span to depth ratio of the
samples ranging from 0.27 to 3.5 has been selected in accordance with the definition of
deep beams provided in the above codes covering the entire range of deep beams and
those transitioning from deep to shallow beams.

20
Table (2.2) Description of collected specimens
Reference Number of samples f`c ( MPa) a/d ratio
Zhang and Tan [2007] 12 25.9-32.4 1.1
Nathan and Breña [2008] 12 27.0-35.6 1.0-2.0
Tan and Lu [1999] 12 30.8-49.1 0.56-1.13
Oh and Shin [2001] 53 23.72-73.6 0.50-2.0
Smith and Vantsiotis [1982] 52 16.1-22.1 0.77-2.01
Walraven and Lehwalter [1994] 12 17-21.3 1.0
Tan et al. [1997a] 19 56.2-86.3 0.85-1.69
Tan et al. [1997b] 22 54.8-74.1 0.28-3.14
Foster and Gilbert [1996] 16 77-120 0.76-1.88
Shin et al. [1999] 30 52 -73 1.5-2.5
Yang et al. [2003] 21 31.4-78.5 0.53-1.13
Kong and Rangan [1998] 42 63.6-89.4 1.51-3.30
Aguilar et al. [2002] 4 28 1.14-1.27
Tan et al. [1995] 19 41.06-58.84 0.27-1.62
Rigotti [2002] 11 16.5-34.5 1.87-2.33
Garay & Lubell [2008] 10 43-48 1.19-2.38
Total 347
2.5. The effect of web reinforcements on the behavior of deep beams:
There are many studies available in the literature that provide more information on
the effect of web reinforcements, mid-span deflection, crack width, failure modes,
ultimate strengths and the behavior of reinforced concrete deep beams. Based on the
results of the experimental studies as compiled here, the effect of web reinforcements on
the behavior of deep beams has been investigated, and it has been observed that web
reinforcements play an important role in enhancing the ultimate capacity, stiffness, etc.
The effects of web reinforcement as observed in the experimental studies are briefly
discussed below.

21
2.5.1 Beam stiffness:
Tan et al [1997a] have observed, judging from the mid-span deflection, that the web
reinforcements increase the beam stiffness, and the effect of web reinforcement on the
stiffness is more significant at a/d ≥1.13. Smith and Vantsiotis [1983] have observed that
a minimum amount of vertical and horizontal web reinforcement should be applied to
increase beam stiffness and control cracks. Also Kong et al[1970] have found that web
reinforcements have an effect on the beam stiffness, to a degree that becomes significant
based on the arrangement and amount of web reinforcement depending on L/d and a/d
ratios. They have also found that the vertical web reinforcement is more effective in
enhancing the beam stiffness when the shear span-to- depth ratio a/d ≥0.7.
2.5.2 Crack-control:
Smith and Vantsiotis [1983] have observed that at the same load level the crack
widths are smaller and more uniform for beams with web reinforcement than for those
without. Smith and Vantsiotis [1983] and Shin et al [1999] have also found that the web
reinforcement produces no effect on the propagation of cracks, where the propagation of
cracks in all beams is the same. Tan et al [1997a] have observed that web reinforcements
have a significant effect in controlling the diagonal cracks, and the beams with web
reinforcements exhibit higher serviceability loads. However, the control of the diagonal
cracks varies according to the positioning of the shear reinforcements where the web is
the most effective. Kong et al [1970] have concluded that the effect of web reinforcement
on the crack width and length is dependent on the beam stiffness.

22
2.5.3 Modes of failure:
Most of the researchers Smith and Vantsiotis [1983], Tan et al [1997a] and Shin et al
[1999] have clearly demonstrated that beams with web reinforcements exhibit the same
modes of failure as compared to the beams without web reinforcements. However,
Rogowsky et al [1986] have observed that a large amount of vertical web reinforcement
may alter the mode of failure to ductile failure.
2.5.4 Ultimate shear strength:
Smith and Vantsiotis [1983] have indicated from their test results that the vertical web
reinforcements of 0.18% to 1.25% can improve the ultimate shear strength, where the
horizontal web reinforcements of 0.23% to 0.91% have a little or no effect on the
ultimate shear strength. Smith and Vantsiotis [1983] have observed in their experimental
study that the web reinforcements increase the ultimate shear strength from 0 to 30% but
not beyond 4bd√f`c. Rogowsky et al [1986] have proved that only the vertical web
reinforcements have a significant effect on the ultimate shear strength. Tan et al [1997a]
have also confirmed that the vertical web reinforcements are more effective in increasing
the shear strength than are the horizontal web reinforcements in the case of beams with
high strength concrete. Using the test results of Tan et al [1997a] it was observed that the
contribution of web reinforcements on the ultimate shear strength for high strength
concrete varied from 0 to 50%, and the maximum contribution did not exceed 2bd√ f`c.
Oh and Shin [2001] have observed that the vertical web reinforcements increase the
ultimate shear strength slightly, and the contribution of shear reinforcement is a function
of the shear-span to depth ratio a/d. They also found that the horizontal web
reinforcement has little effect on the ultimate shear strength. Table (2.3) contains a brief

23
description of the specification (e.g., compressive strength, f`c; shear span depth ratio;
vertical reinforcements, ρv%; horizontal reinforcements, ρh%; and web reinforcement,
ρv%+ρh%) of experimental specimens used by the researchers to study the effect of web
reinforcements.
Table (2.3) Details of the available experimental studies
Reference f`c ( MPa) a/d ρv% ρh% {ρv%-ρh% }
Tan et al
[1997a,b]
56.3 to 92.7 0.85,
1.13,
1.69
0,
1.43,
2.86
0,1.59,
3.17
{0-0},
{2.86-1.59},
{1.43-1.59},
Kong et al [1970]
Avg of
22.13
0.23 to 0.7 0,
0.85,
2.45
0,
0.85,
2.45
{0-0},
{1.23-1.23}
Smith & Vantsiots
[1982]
16.07 to
22.68
0.77,
1.01,
1.34
-- -- {(0.28,0.63,1.25)-
(0.23to0.91)}
{(0.24,0.63,0.77,1.25
)-(0.23to0.91)}
{(0.18,0.31,0.56,0.77
)-(0.23to0.91)}
Oh andShin
[2001]
23 to 74 0.5,
0.85,
1.25,
2
-- -- {0-
0},{(0.12,0.22,0.34)-
0.43},{0.13-
(0.23,0.47,0.94)},{0.
13-
(0,0.023,0.47,0.94)}
Shin et al [1999]
52 & 73 1.5,
2,
2.5
-- -- {0 -0},
{(0.45to1.81)-0.5}
Rogowsky et al.
[1986]
26.1 to 46.8 1,
1.5,
2
0.0015,
0.006,
0.0019,
0,
0.0057,
0.0014.
0.0016,
0.0018,
0.0011,
0.0032,
0.0013,
0.0039
{(0.0,0.0015)-
(0.0,0.0016)},{(0.0,0.
0019)-
(0,0.0011)},{(0,0.001
4)-(0,0.0012)}
2.6. The effect of shear-span to depth ratio on the behavior of deep beams:
The shear-span to depth ratio, a/d, has a major effect on the change of the stress
pattern from linear to non-linear. The a/d ratio is an important variable that is used for

24
defining a deep beam. According to the common definition for a deep beam, the load
from a support is closer than about twice the effective depth (i.e. a/d<2). Tan and Lu
[1999] indicated that the stress-deflection curve was gentler in the beams that had higher
a/d, and they also observed that with an increase in a/d ratio the beam becomes more
flexible. MacGregor [2000] demonstrated that the a/d ratio has a major effect on the
failure mechanism, and when a/d<1, the behavior changes from beam action to truss
action. On the other hand, for the beams whose a/d ratio ranges between 1 and 2.5, failure
occurs at less than the flexure moment capacity. Nathan and Breña [2008] noted that the
influence of a/d on the crack patterns for the beams that have a/d ratio between 1 to 1.5 is
consistent with a tied-arch mechanism of load transfer, in contrast to beams with a/d=2,
where the crack formation indicates a truss mechanism of load transfer.
2.7. Further development of Strut and Tie models:
Many researchers proposed modification to the Strut and Tie models and the results
showed some improvements. A brief account of some of the proposed Strut and Tie
models for deep beams are presented below:
- Matamoros and Wong [2003] developed a STM models and calibrated them using
experimental results from 175 simply supported beams having maximum shear span to
depth ratio of 3. The forces in the strut were calculated by using four models, where the
first model (Fig 2.5 a and b) uses a direct strut neglecting the contribution of web
reinforcements, and the other two models (Fig 2.5 c and d) account for the contribution of
web reinforcement using a truss with vertical ties (Fig 2.5 c) to represent the vertical
reinforcements or horizontal ties (Fig 2.5 d) to represent the horizontal reinforcements.

25
However the fourth model (Fig 2.6) is a statically indeterminate strut-and-tie model that
represents a combination of the above three models.
Fig. (2.5) (a) Dimensions of nodal zone; (b) compression strut mechanism; (c) vertical
truss mechanism; and (d) horizontal truss mechanism. Matamoros and Wong [2003]
Fig. (2.6) Combined strut-and-tie models. Matamoros and Wong [2003]
The total shear force is carried by each of three mechanisms and can be presented by
following equation (2.4):

26
= + + (2.4)
where, Sstrut is the nominal strength of the strut by using only the contribution of the
compressive strength of the concrete , Stv is the nominal strength of the strut by using
only the contribution of the vertical web reinforcement, Sth is the nominal strength of the
strut by using only the contribution of the horizontal web reinforcements and Cc, Cwv and
Cwh are the strength parameter, vertical web reinforcement coefficient and horizontal web
reinforcements coefficient, respectively.
The resulting formula provides a comparable prediction of the shear strength according to
a guideline by the Architectural Institute of Japan (AIJ) (Aoyama 1993). The proposed
equation is also found to provide a safer estimate of capacity for beams with a/d ratio less
than one.
-Park and Kuchma [2007] proposed a strut-and-tie-based method for calculating the
strength of reinforced concrete deep beams. A strut-and-tie statically determinate model
shown in Fig (2.7) is used for describing the flow of forces of a deep beam. The model is
used in the development of a general approach that considers the compression softening
and web splitting phenomena as influenced by transverse tensile straining. The proposed
compatibility-based strut-and-tie model procedure uses an iterative secant stiffness
formulation, employs constitutive relations for concrete and steel, and considers strain
compatibility. The strain compatibility relation used in this study requires that the sum of
normal strain in two perpendicular directions is an invariant. Also they assumed that the
effective depth of the top horizontal concrete strut will be calculated by: wc = kd, where d
is the effective depth of the deep beam and k is derived from the classical bending theory

27
for a singly-reinforced beam section as: ( = ( + ). In this case, n is the
ratio of steel to concrete elastic modules and ρ is the longitudinal reinforcement ratio.
Fig. (2.7) Strut-and-tie model for deep beam. Park and Kuchma [2007]
This model was compared by Park and Kuchma [2007] with the strut-and-tie given in
ACI 318-05 and CAN/CSA A23.3-04 code provisions in predicting the capacity of 214
deep beams which were tested to failure. The comparison showed that the proposed
method consistently predicts the strengths of deep beams with a wide range of horizontal
and vertical web reinforcement ratios, concrete strengths, and shear span-to-depth ratios
(a/d) well.
-Zhang and Tan [2007] proposed a modified strut-and-tie model (STM) for determining
the shear strength of reinforced concrete deep beams. The model is a modification to the
original model proposed by Tan et al. [2003] with a direct strut-and-tie model for
pressurised deep beams, and the model proposed by Tan et al. [2003] representing a
direct method for deep beams with web reinforcements.

28
START
END
a
h
θ
ll dc
22tan
fA
Af
A
Aff ct
sc
wsswyw
sc
ssy
t
sin
)sin(
sin
sin4
fAfA
V
cstr
s
tc
ss
n
sincossin4
1
Yes
No
swc
n
bf
Vl d
tan
)2(
ll d d)2(
Fig. (2.8) Iteration procedure for computing the ultimate strength of for simply supported
deep beams - Zhang and Tan [2007]
Figure (2.8) shows the iterative procedure for calculating the ultimate strength of
deep beams by the modified model for the purpose of implementation. The assumption of
proposed model can be summarized in the following: concrete tension–stiffening
properties are used instead of concrete tensile strength to improve model prediction
consistency. The component force of tension tie in the direction of the concrete diagonal
strut is also included in the model for completeness. The softening effect of concrete
strength due to the presence of transverse tensile strain is implicitly taken into

29
consideration. The stress distribution factor k is derived from the consideration of both
force and moment equilibrium. The modified model for simply supported deep beams is
evaluated using 233 test results and it was shown to be in a better agreement with the
experimental results than the original model.
2.8. The use of Fibre-Reinforced Polymer (FRP) in deep beams
Since reinforced concrete deep beams have been used in many structural applications
where they are often exposed to severe conditions, those conditions have often led to the
deterioration of the concrete and led to the corrosion of rebars. The corrosion considered
as the main factor behind the deterioration of the majority of concrete structures. Rebar
corrosion will shorten the lifespan of a structure. Fiber-Reinforced Polymers (FRPs) have
proven to be effective in concrete structures as an alternative to steel reinforcement.
Compared to conventional steel reinforcement, Fiber-Reinforced Polymers (FRP) is up to
five or six times stronger, lighter and not susceptible to corrosion. It is also used as an
external confinement of the existing concrete structural elements to enhance the shear
strength, the axial strength and the deformability of the members.
The increasing application of fibre-reinforced polymers (FRPs) as internal
reinforcement in concrete prompted many researchers to conduct experimental and
numerical studies to understand the behaviour of FRP-reinforced concrete structures.
Further research is still needed particularly in terms of the shear behaviour of concrete
members reinforced with FRP bars. A brief review of research programs was conducted
in this chapter to investigate the behaviour of concrete members reinforced with FRP
reinforcement. It is interesting to note that while some research is available on the
behaviour of FRP-reinforced regular (shallow) beams, there are not many studies

30
available for FRP-reinforced concrete deep beams. The following review includes studies
on deep beams or beams which are close to deep beams.
-El-Sayed et al. [2006a] tested nine large-scale reinforced concrete beams without
stirrups with shear-span to depth ratio of 2.5. The test beams included three beams
reinforced with glass FRP bars, three beams reinforced with carbon FRP bars, and three
control beams reinforced with conventional steel bars. The dimensions of the beams were
3250 mm in length, 250 mm in width, and 400 mm in depth. And all beams were tested
in bending with four-point loading. The details of test specimens are given in Table (2.4)
and shown in Figure (2.9). The main variables considered were the reinforcement ratio
and the modulus of elasticity of the longitudinal reinforcing bars. The beams were
subjected to two point loads at the top.
Table (2.4) Details of the test specimens
Specimen
No
f`c
(
MPa)
b
(mm)
d
(mm)
Le
(mm) a/d
Main
reinforcement
ffu
(MPa) εfu
Vertical &
Horizontal
reinforcement
ρ (%)
SN-1 50.0 250 326 2750 3.06 7No.15 M
steel bars 460 0.0023 N/A 0.86
SN-2 50.0 250 326 2750 3.06 5No.15 M
steel bars 460 0.0023 N/A 1.24
SN-3 50.0 250 326 2750 3.06 7No.15 M
steel bars 460 0.0023 N/A 1.72
CN-1 44.6 250 326 2750 3.06 10 No. 10
CFRP bars 1536 0.0156 N/A 0.87
CN-2 44.6 250 326 2750 3.06 8 No. 13
CFRP bars 986
0.0180 N/A 1.24
CN-3 44.6 250 326 2750 3.06 11 No. 13
CFRP bars 986 0.0180 N/A 1.72
GN-1 43.6 250 326 2750 3.06 10 No. 10
GFRP bars 608 0.0120 N/A 0.87
GN-2 43.6 250 326 2750 3.06 5 No. 16
GFRP bars 754 0.0074 N/A 1.22
GN-3 43.6 250 326 2750 3.06 7 No. 16
GFRP bars 754 0.0074 N/A 1.71

31
P/2P/2
400m
m
3250mm
2501000750250 10002525
( a )
250400
326
Beam SN-1
7 No. M10
250
400
326
Beam CN-1
10 No. 10 (CFRP)
Beam GN-1
250
400
326
10 No. 10 (GFRP)
250
400
326
Beam SN-1
5 No. M15
250
400
326
Beam CN-1
8 No. 13 (CFRP)
Beam GN-1
250
400
326
5 No. 16 (GFRP)
250
400
326
Beam SN-1
7 No. M15
250
400
326
Beam CN-1
11 No. 13 (CFRP)
Beam GN-1
250
400
326
7 No. 16 (GFRP)
( b )
Fig. (2.9) (a) Test setup and dimensions; and (b) Sectional details. El-Sayed et al. [2006a]
From test results it was shown that the relatively low modulus of elasticity of FRP
bars resulted in reduced shear strength as compared to the shear strength of the control
beams reinforced with steel. The reduction of the shear strength can be attributed to the
fact that the cross section using FRP flexural reinforcement develops wider and longer
cracks as opposed to a steel reinforced section, and thus has a smaller depth to the neutral
axis. It was observed that the most dominant failure mode was diagonal tension failure
except in the control beams which experienced steel yielding simultaneous with the
diagonal tension when failure occurred. Figure (2-10) shows the crack patterns at failure
of the tested beam CN-3. A proposed modification to the current ACI 440.1R design

32
equation based on the obtained experimental results was presented and verified against
test results of other researchers.
Fig. (2.10) Typical failure mode (Beam CN-3). El-Sayed et al. [2006a]
-El-Sayed et al. [2006b] carried out investigations on the influence of concrete strength,
reinforcement ratio, and modulus of elasticity of the longitudinal reinforcing bars on six
large-scale reinforced concrete beams with high-strength concrete (HSC), and three
beams using normal-strength concrete (NSC). Carbon and glass FRP bars and
conventional steel bars were used as longitudinal reinforcement in this investigation. All
beams were without web reinforcement, and had ratio of shear-span to depth ratio of 2.5.
The beams were 3250 mm long, 250 mm wide, and 400 mm deep, and they were tested in
bending with four-point loading. The beams were tested under symmetrical loading
conditions. The details of test specimens are given in Table (2.5) and shown in Fig. (2-
11).

33
P/2P/2
400
mm
3250mm
2501000750250 10002525
250
400
326
Main reinforcement varies
Elevation view
Cross section
Fig. (2.11) (a) Test setup and the dimensions; and (b) sectional details. El-Sayed et al.
[2006b]
Table (2.5) Details of the test specimens
Specimen
No
f`c
(
MPa)
b
(mm)
d
(mm)
Le
(mm) a/d
Main
reinforcement
ffu
(MPa) εfu
Vertical &
Horizontal
reinforcement
ρ (%)
SN-1.7 35 250 326 2750 3.06 7No.15 M
steel bars 460 0.0023 N/A 1.72
CN-1.7 35 250 326 2750 3.06 11 No. 13
CFRP bars 986 0.0074 N/A 1.72
GN-1.7 35 250 326 2750 3.06 7 No. 16
GFRP bars 754 0.0180 N/A 1.71
SH-1.7 65 250 326 2750 3.06 7No.15 M
steel bars 460 0.0023 N/A 1.72
CH-1.7 65 250 326 2750 3.06 7 No. 16
CFRP bars 769
0.0074 N/A 1.71
GH-1.7 65 250 326 2750 3.06 7 No. 16
GFRP bars 754 0.0180 N/A 1.71
SH-2.2 65 250 326 2750 3.06 9No.15 M
steel bars 460 0.0023 N/A 2.21
CH-2.2 65 250 326 2750 3.06 9 No. 16
CFRP bars 769 0.0074 N/A 2.20
GH-2.2 65 250 326 2750 3.06 9 No. 16
GFRP bars 754 0.0180 N/A 2.20

34
Fig. (2.12) Diagonal tension failure mode: (a) associated with no concrete splitting (Beam
CH-1.7); and (b) associated with concrete splitting (Beam GH-1.7). El-Sayed et al.
[2006b]
Test results showed that the high-strength concrete beams exhibited slightly lower
relative shear strength as compared to normal-strength concrete beams. Figure (2.12)
shows the crack patterns at failure of the tested beams CH-1.7 and GH-1.7. Also they
concluded that the HSC beams exhibited lower normalized shear strength as compared to
the control NSC beams.

35
-Farghaly and Benmokrane [2013] undertook a study on the shear strength of 4 full-
scale deep beams reinforced with longitudinal carbon- and glass-Fiber Reinforced
Polymer (FRP) bars and without any stirrups or web reinforcements. The variables
included the longitudinal reinforcement ratio and the reinforcement type. The shear-span
to depth ratios ranged from 1.13 to 1.15. The beams were supported over a 3,000-mm
span with a projection of 1,000 mm on each side, with a cross section of 300 mm in width
and 1,200 mm in depth, and tested to failure under four-point loading. The details of test
specimens are given in Table (2.6) and shown in Fig. (2.13).
P/2P/2
1200
10001000 3000
12505001250PL 130X300
PL 228X300
1200
300 40
1200
300 40
12 CFRP
#3 & #49 GFRP
#6 & #8
U-shaped steel stirrups 10 mm diameter @ 100 mm
All dimensions in mm
Fig. (2.13) Dimensions of beam sections and details of reinforcement configuration.
Farghaly and Benmokrane [2013]
Table (2.6) Details of the test specimens
Specimen
No
f`c
(
MPa)
b
(mm)
d
(mm)
Le
(mm)
a/d
Main
reinforcement
ffu
(MPa) εfu
(%)
Vertical &
Horizontal
reinforcement
ρf (%)
G8N6 49.3 300 1097 3000 1.14 8 No.6
GFRP bars 460 1.66 N/A 0.69
G8N8 49.3 300 1088 3000 1.15 8 No. 8
GFRP bars 460 1.45 N/A 1.24
C12N3 38.7 300 1111 3000 1.13 12 No. 3
CFRP bars 380 1.33 N/A 0.26
C12N4 38.7 300 1106 3000 1.13 12 No.4
CFRP bars 380 1.32 N/A 0.46

36
It was observed that reinforcement type had no clear effect on the behavior of the
tested beams. Also it was found that the reinforcement ratio and concrete compressive
strength had a clear effect on the ultimate capacity and deflection characteristics. Figure
(2.14) shows the failure modes of the tested beams.
Fig. (2.14) Failure of the tested deep beams. Farghaly and Benmokrane [2013]
The results confirmed the formation of the tie action, where the strain in the
longitudinal reinforcement distributed nearly uniform. It is important to note that these
are the only studies available so far on FRP-RC deep beams.

37
Chapter 3: Research Methodology and Experimental
Setup
3.1. Overview:
The research methodology includes the comparison of the STM provisions of ACI
318-08 code [2008], EN 1992-1-1-2004(E) [2004] and the Canadian code CAN/CSA
A23-3-04 [2004] in designing conventional deep beams. The comparative study is
intended to capture the effect of most important variables on the estimation of the
ultimate strength of deep beams using the STM provisions of various codes. Also a
design method for FRP reinforced concrete deep beams is developed based on the
provisions for conventional RC deep beams and FRP reinforced ordinary beams. In
addition the effectiveness of the STM provisions of the CAN/CSA-S806-12[2012] in
predicting the capacity of concrete deep beams has been verified. An experimental
program was conducted to study the behaviour of FRP-reinforced concrete deep beam
and to investigate the effect of the critical variables. Based on the experimental results,
the suggested design procedure will be fine-tuned and the appropriate quantity of the FRP
web reinforcement in deep beams will be determined. The proposed design
methodology, the details of the geometry and reinforcement configurations, the material
properties and the test set up for the specimens are explained in this chapter.
The main tasks undertaken in the present research are as follows:
1. Review the existing experimental studies on reinforced concrete deep beams
and collect the detailed data on the experimental specimens and parameters.

38
2. Compare the impact of the current codes provisions for designing reinforced
concrete deep beams using STM on the capacity and failure mode with respect
to the results of the available experimental studies.
3. Identify critical parameters governing the behaviour of deep beams using
available experimental data.
4. Develop a design method for FRP-reinforced concrete deep beams and use it
in the design of the experimental specimens used in the present study.
5. Experimentally evaluate the behaviour of FRP-reinforced deep beams and
evaluate the influence of the critical parameters on their behaviour.
6. Validate the existing code provisions and update the proposed design method
using the results of the experimental study.
3.2. Comparison of the STM procedures for conventional deep beams
provided in the three selected codes:
The results of more than three hundred test specimens from available experimental
studies on reinforced concrete deep beams have been used for the present study to
evaluate and compare the Strut-and-Tie modeling provisions of the codes from three
different jurisdictions: Canada, USA and Europe. Figure (3.1) shows a typical deep beam
and possible STM configurations. The effectiveness of these code provisions in
predicting the ultimate strength and failure modes of deep beams have been evaluated
against the actual behavior of such beams observed in experimental studies.

39
Tie
Strut Strut
P
P/2P/2
(a.
P/2
P/2
Strut S
trut
Tie
Strut
P/2
P/2
(b.
Fig. (3.1) Strut and Tie Models: (a) beam specimen loaded by a single point load, (b)
beam specimen loaded by two point loads
The capacity of each specimen has been computed using the STM provisions of the
three codes as selected here. ACI-318 provides a straight and a bottle-shaped strut, while
other codes provide only straight struts. For the ACI, bottle-shaped strut has been used
here for its superior performance, and the efficiency factor βs is assumed to be 0.75 as
suggested in the code (ACI 318-08 [2008] - Appendix A).The Eurocode procedure
provided in EN 1992-1-1-2004(E) [2004] has been used with the modification of the
predicted ultimate shear force by multiplying this value by β= a/2d as suggested in the
code.

40
No modification is suggested in the Strut and Tie model procedure specified in
Canadian standard CSA A23-3-04 [2004]. The effects of governing variables, such as the
shear span to depth ratio, web reinforcement, and the compressive strength of concrete on
the capacity determined by the Strut-and-Tie Model (STM) procedures of the selected
codes have also been investigated.
3.3. Design methods for FRP-reinforced concrete deep beams:
At the beginning of this current research, the strut and tie model was not available in any
of the relevant design codes and standards for design of FRP reinforced concrete deep
beams. At that time, the existing standard on FRP-reinforced concrete structures
CAN/CSA-S806-02 [2002] did not permit FRP-RC deep-beams as relevant design
methods were not provided. Thus, a design procedure for FRP-RC deep beams was
developed in this research based on the corresponding design provisions for conventional
deep beams as provided in CSA A23.3-04 [2004], which have been modified for FRP
materials. Later, the current version of CSA-S806-12 [2012] was published which
provided an STM procedure for FRP-RC deep beams that is mostly based on the
provisions of CSA A23.3-04 applicable for conventional deep beams, but modified for
FRP materials. The ACI and Eurocode still do not provide similar methods for designing
FRP-RC deep beams. This section briefly discusses the design procedure adopted for the
test specimens prior to the publication of CSA-S806-12, the relevant provisions of CSA-
S806-12 and a proposal for an STM procedure in ACI for designing FRP-RC deep beams
based on the modified procedure for conventional RC deep beams as provided in ACI
318-08 [2008].

41
3.3.1. The STM design procedure adopted for the test specimens based on
CSA A23.3-04 [2004] and CSA S806-02 [2002]:
The STM model for concrete deep beams provided in CSA A23.3 [2004] has been
adapted to FRP reinforced concrete deep beam for strut and node elements which
represent the compression element (concrete), while the equation of the tie element is
revised to consider the rupture of the FRP that will cause the failure of a tie section. This
proposal was consistent with what was later on adopted in the new edition of the
Canadian code CAN/CSA-S806-12[2012]. The Canadian code in its new edition
CAN/CSA-S806-12[2012] adopts the STM approach of conventional beam with similar
adjustments that take into account of the properties of FRP.
Since the ACI 440.1 R-06[2006] standard does not provide a procedure for designing
RC deep beams reinforced with FRP bars as yet, an STM design procedure for FRP-
reinforced concrete deep beams is also developed here. The proposed design procedure
for FRP-reinforced concrete deep beams is similar to the STM approach for conventional
deep beams as provided in ACI 318-08 with some adjustments to account for the
properties of FRP. The design method and proposed STM for FRP-reinforced concrete
deep beams are described below.
3.3.2. STM procedure in the CAN/CSA-S806-12 [2012] code:
In the newer edition, the CSA-S806-12[2012] adopts the STM approach for conventional
RC beams, with appropriate adjustments to account for the properties of FRP. For
example the compressive force in a strut is calculated in a similar way as to CSA-A23.3-

42
04 [2004] where the strut is apportioned by the compression strength of the concrete and
the principal tensile strain in cracked concrete due to factored loads.
The force in a strut in the CSA-S806-12 [2012] procedure as given by Equation (2.2) is
calculated slightly differently from that in the CSA-A23.3-04 [2004] procedure where the
principal tensile strain ε1 is estimated based on the ultimate strain in FRP instead of steel,
but the other parameters in calculating ε1 are not changed (Equation 3.1).
ε1=εf+(εf+0.002)cot2Ѳs (3.1)
where Ѳs is the smallest angle between the strut and the adjoining tie and εf is the strain in
the FRP reinforcement.
As for nodal zones, the CSA-S806-12 [2012] still adopted the same nodal zones CCC,
CCT, and CTT (here, C and T indicate compression and tension, respectively in a
member connecting to the node) that are described in the CSA-A23.3-04 [2004] without
any change. The compressive stress in these nodes, CTT, CCT and CCC should not
exceed the compressive stress of concrete cfc', reduced by 0.65, 0.75 and 0.85,
respectively. The CSA-S806-12[2012] calculated the tensile force in a tie similarly to the
CSA A23.3-04 [2004] code but using only 65% of the tensile strength of FRP
reinforcement instead of the yield strength of steel. The strength of ties strengthened by
FRP can be calculated by using the following equation
Fnt=0.65 F AFT fFu (3.2)
where AFT is the total area of FRP reinforcement and fFu is the designed tensile strength of
the FRP.
43
Unlike to the CSA-A23.3-04[2004] which used only the yield strength of steel multiplied
by (x/ld) to calculate the limitation of the stress for straight bars extending a distance, x
beyond the critical location (ld is the development length), the CSA-S806-12[2012]
includes the area of FRP reinforcements in the corresponding equation that calculate the
stress limit, which is inconsistent.
Both the CSA-A23.3-04[2004] and the CSA-S806-12[2012] recommend application
of specified amounts of web FRP reinforcements that may enhance the beam stiffness
and satisfy the serviceability requirements. Although the FRP stirrups have lower dowel
resistance and lower modules of elasticity as compared to the steel stirrups, the FRP web
reinforcement can perform the same functions of the steel stirrups such as, restrict the
growth of diagonal cracks and provides some confinement to the concrete in the
compression zone. The difference between the two codes is in the recommended amount
of the web reinforcements. The CSA-S806-12[2012] determined this ratio to be less than
0.004 (of the normal area between two adjacent stirrups for vertical reinforcements) for
GFRP and AFRP, and 0.003 for CFRP, while CSA-A23.3-04 [2004] recommends (for
steel reinforced deep beams) the ratio not to be less than 0.002 in each direction. CSA-
S806-12[2012] requirements for the web reinforcement appear to be quite conservative
and may result in a very close spacing of the web reinforcements. For example the
minimum spacing between the GFRP stirrups for beam of width equal to 230 mm is 62
mm, while that for a beam of width 450 mm is 31mm, which is very small and not
practical.
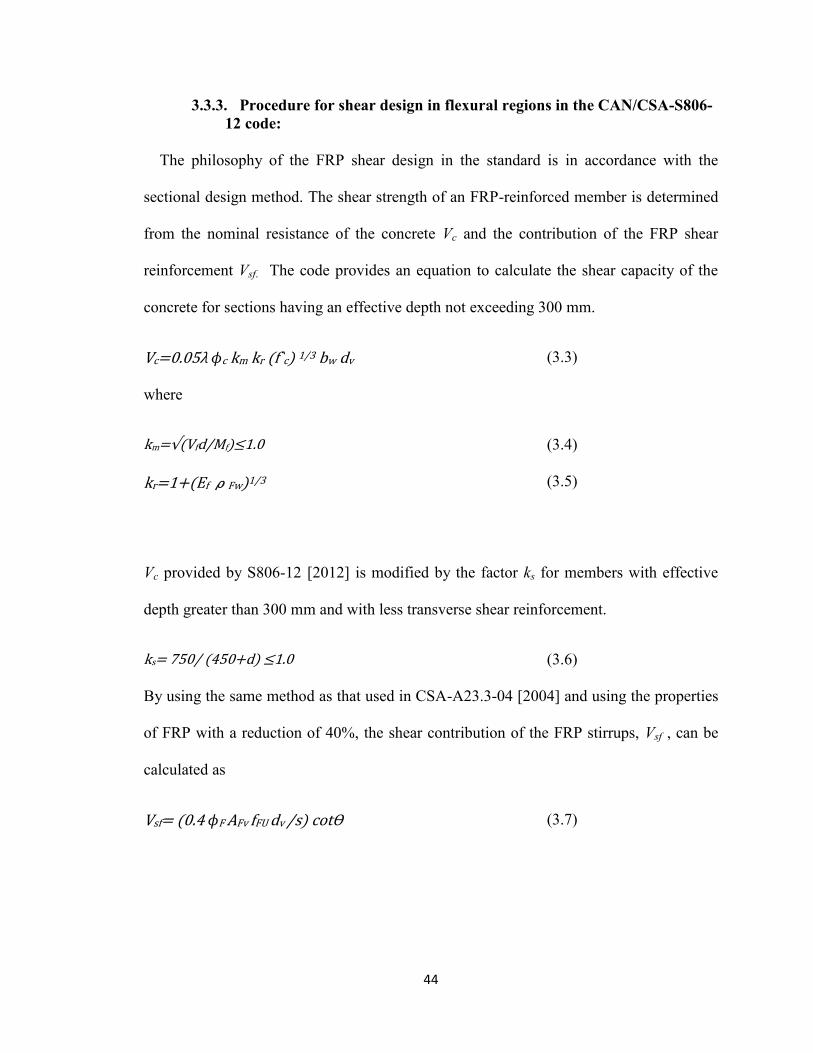
44
3.3.3. Procedure for shear design in flexural regions in the CAN/CSA-S806-
12 code:
The philosophy of the FRP shear design in the standard is in accordance with the
sectional design method. The shear strength of an FRP-reinforced member is determined
from the nominal resistance of the concrete Vc and the contribution of the FRP shear
reinforcement Vsf. The code provides an equation to calculate the shear capacity of the
concrete for sections having an effective depth not exceeding 300 mm.
Vc= 5λ c km kr (f`c) 1/3 bw dv (3.3)
where
km=√(Vfd/Mf ≤1 (3.4)
kr=1+(Ef ρFw)1/3 (3.5)
Vc provided by S806-12 [2012] is modified by the factor ks for members with effective
depth greater than 300 mm and with less transverse shear reinforcement.
ks= 75 / (45 +d ≤1 (3.6)
By using the same method as that used in CSA-A23.3-04 [2004] and using the properties
of FRP with a reduction of 40%, the shear contribution of the FRP stirrups, Vsf , can be
calculated as
Vsf= (0.4 F AFv fFU dv /s cotѲ (3.7)
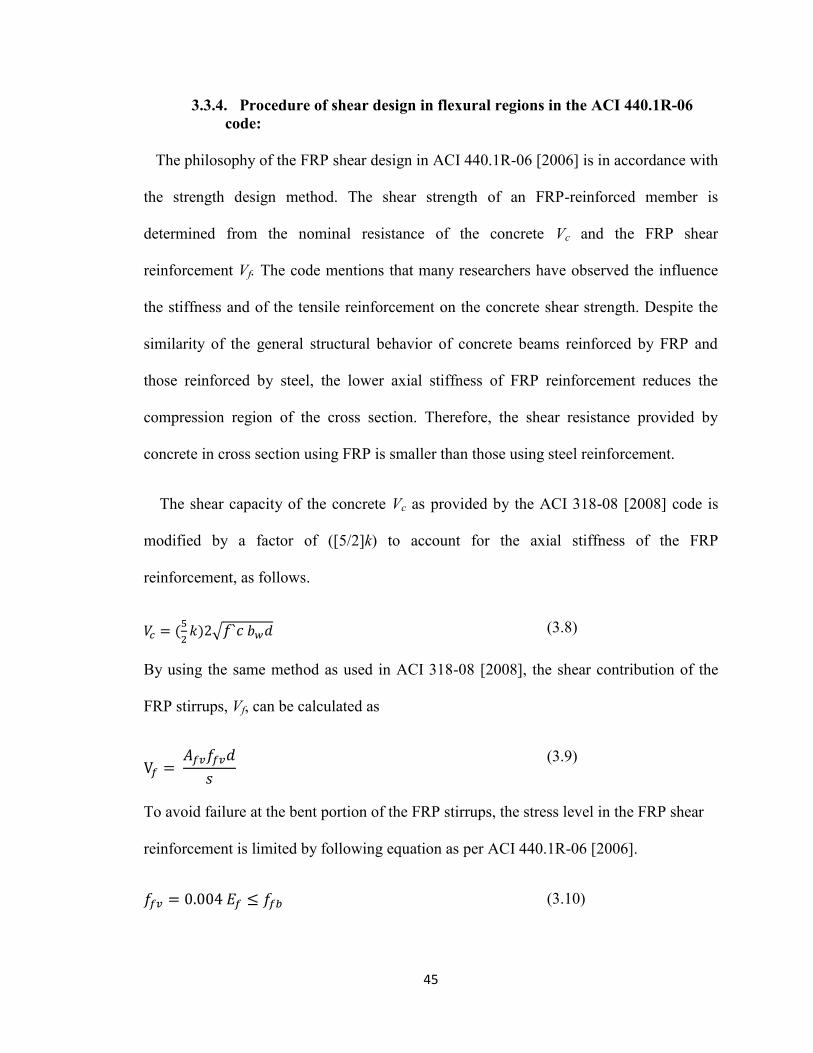
45
3.3.4. Procedure of shear design in flexural regions in the ACI 440.1R-06
code:
The philosophy of the FRP shear design in ACI 440.1R-06 [2006] is in accordance with
the strength design method. The shear strength of an FRP-reinforced member is
determined from the nominal resistance of the concrete Vc and the FRP shear
reinforcement Vf. The code mentions that many researchers have observed the influence
the stiffness and of the tensile reinforcement on the concrete shear strength. Despite the
similarity of the general structural behavior of concrete beams reinforced by FRP and
those reinforced by steel, the lower axial stiffness of FRP reinforcement reduces the
compression region of the cross section. Therefore, the shear resistance provided by
concrete in cross section using FRP is smaller than those using steel reinforcement.
The shear capacity of the concrete Vc as provided by the ACI 318-08 [2008] code is
modified by a factor of ([5/2]k) to account for the axial stiffness of the FRP
reinforcement, as follows.
= (
(3.8)
By using the same method as used in ACI 318-08 [2008], the shear contribution of the
FRP stirrups, Vf, can be calculated as
V =
(3.9)
To avoid failure at the bent portion of the FRP stirrups, the stress level in the FRP shear
reinforcement is limited by following equation as per ACI 440.1R-06 [2006].
= 4 ≤ (3.10)

46
Similar to what is applied in ACI 318-08 [2008] for the minimum requirements of shear
reinforcement to prevent brittle shear failure, ACI 440.1R-06 [2006] recommends the
application of the minimum amount of FRP shear reinforcement taking in to
consideration of the properties of the FRP.
3.3.5. Proposed procedure for design designing FRP-RC deep beams based
on ACI code:
Chapter nine of the ACI code does not provide any procedure to design deep beams
reinforced with FRP bars. The relevant procedure for conventional steel reinforced
concrete deep beams as provided in ACI 318-08 [2008] is modified here for FRP RC and
used here along with other relevant provisions of ACI 440.1R-06 [2006] code to design
the FRP-reinforced concrete deep beams. Appendix B of the ACI 318-08 [2008] provides
the procedure for calculating the nominal capacities of the elements of Strut-and-Tie
models for conventional concrete deep beams, which are the strut (a compression
member), the nodal zone and the tie (a tension member). The design of the struts, ties and
nodal zones are based on: φFn≥Fu where Fu is the largest force in that element for all
loading cases, Fn is the nominal strength, and φ is a factor specified in the code. Two
types of struts are defined in the procedure: strut of uniform cross section; and bottle
shaped strut. The nominal capacity of a strut is given by fce= 0.85 βs f`c, where βs is
defined as the efficiency factor. The value of (βs) for uniform cross section strut ranges
from 0.4 to 1 based on where the strut is placed. While for the bottle shaped strut the
efficiency factor βs can be taken as 0.75 if the web reinforcement satisfies the provisions
of ACI 318-08 [2008] as given in Eq. (2.1) in this thesis. The nominal compressive
strength of a strut can be determined as

47
= (3.11)
where Acs is the cross sectional area. To calculate the strength of a nodal zone, the
procedure in ACI 318-08 [2008] can be used as is, without any changes. The
compressive stress in these nodes, CTT, CCT and CCC, should not exceed the
compressive stress of concrete 0.85f´c reduced by 0.6, 0.8 and 1, respectively. Here, the
nodes are designated by the type of truss members meeting at the node, where T denotes
Tensions, and C denotes Compression.
The strength of ties consisting of FRP reinforcements can be calculated by using the
following equation
= (3.12)
where Atf is the total area of FRP reinforcement and ffu is the design tensile strength of
FRP, considering the reduction factors as per ACI 440.1R-06 [2006]. For deep beam
design, all the recommendations prescribed by the ACI 318.08 [2008] should be applied
and taken into consideration, for example, the application of the minimum of web
reinforcement.
3.4. Experimental Plan:
The experimental work was carried out in the Structures Laboratory of the Concordia
University. Different parameters were examined for their effect on the behaviour of the
beam specimens. These parameters were the shear span to depth ratio (a/d) and the
amount of the FRP web shear reinforcement. A total of nine concrete deep beam
specimens were tested. The beams were divided into three groups of similar shear span to
depth ratio. The first group, A, contains 4 beams with shear-span to depth ratio a/d =1
with different quantities of the FRP web shear reinforcement: ρw= 0, 44%, 68%, and

48
100%, where ρw= 100% indicates the quantity of shear reinforcement corresponding to
the maximum allowable spacing of the web reinforcement to control cracks in a beam as
required by the earlier edition of the Canadian code for GFRP reinforcements, CAN/CSA
S806-02 [2002]. It should be noted that when the present experimental study was planned
and the specimens were made, the current version of the CSA standard, CSA-S806-12
was not available and the earlier version did not provide any design provisions for FRP-
reinforced concrete deep beams (i.e., no STM procedure was available in CSA-S806).
For that reason, the web reinforcements were provided in the studied samples based on
the crack control provisions of the earlier version of CSA-S806. The present version of
the standard provides an STM model for FRP-RC deep beams, and the required amount
of web reinforcements is significantly higher than the crack control reinforcements which
seems to be overly conservative and can lead to very closely spaced web reinforcements.
The second group B, includes only one beam having shear-span to depth ratio, a/d =1.5
with 100% of required FRP web shear reinforcement ratios. The third group, C,
comprises 4 beams with shear-span to depth ratio a/d =2 and different FRP web shear
reinforcement ratios: ρw= 0, 38%, 60%, and 100%. All the beams were tested to failure
under three-point loading (i.e. one concentrated vertical load).
3.4.1. Details of Test Specimens:
All nine beams were designed according to the design procedures developed for this
research which is based on the design provisions for conventional deep beams as
provided in CSA A23.3-04. The design of the beam specimens took into consideration
the required anchorage length, the web reinforcement requirement and main
reinforcement ratio. All beams have a constant width of 230 mm, and a total span of

49
1800 mm. However, different height was utilized to obtain shear span to depth ratios
(a/d) of 1, 1.5 and 2. The depth d was varied as 328, 447 and 600 mm to achieve the three
different a/d ratios. The stress in each reinforcement layer will vary depending on its
distance from the neutral axis because the behaviour of the FRP materials is elastic up to
failure. Therefore, in case of multiple layers of reinforcement and combinations of
different FRP types, the analysis of the flexural capacity should be based on a strain-
compatibility approach. Because all the beams have two layers of the same type of FRP
reinforcement and the distance between the two layers is very small as compared to the
depth of the deep beam, the stress in the FRP reinforcement in the two layers are almost
equal. Therefore, the effective depth of the section was taken as the distance of the centre
of the layers of the main rebars from the top face of the beam. It should also be noted that
the deep beams are not expected to behave in flexure and the strain distribution is not
proportional to the distance from the neutral axis. In this case, the strain of the main
longitudinal reinforcements in different layers are expected to be very close to each other
and the bars in different layers are expected to act in a group to provide the tie effect in
the context of an STM model.
Each group has a longitudinal main GFRP reinforcement ratio ranging between ρ =1
to 1.197 percent. The stirrups were all GFRP with diameter of 6 mm. Top reinforcement
consisted of two 10 mm GFRP bars. Bearing plates at the loading point and at the
supports were of 200 mm length x 230 width x 30 mm height. The details of the
specimens are given in Table (3.1).
In order to simplify the nomenclature of the samples, the following abbreviations are
used. With each group with constant a/d, only the variable of web reinforcements is

50
changing. Each specimen is labeled in the following way: Gf/p, where G indicates the
group name, f represents the value of the a/d ratio (i.e., 1, 1.5 or 2), and p indicates the
nominal level of web reinforcement in percentage (i.e., 00, 50, 75 or 100). As for
example, the specimen in Group A which had a/d ratio of 1 and 100% of web
reinforcement will be labeled as A1/100.
Table (3.1) Details of the experimental specimens
Specimen
No
f`c
(
MPa)
b
(mm)
d
(mm)
Le
(mm) a/d
Main
reinforcement
ffu
(MPa) εfu
ρ (%)
ρv (%)
A1/100 49.8 230 621 1240 1 6 # 6(19 mm) 656 0.0153 1.197 0.141
A1/75 52.2 230 621 1240 1 6 # 6(19 mm) 656 0.0153 1.197 0.095
A1/50 52.5 230 621 1240 1 6 # 6(19 mm) 656 0.0153 1.197 0.061
A1/00 52.7 230 621 1240 1 6 # 6(19 mm) 656 0.0153 1.197 N/A
B1.5/100 51.8 230 447 1340 1.5 3 # 6(19 mm)
3# 4 (13 mm)
656
708
0.0153
0.0170 1.201 0.145
C2/100 50.8 230 328 1310 2 6 # 4(13 mm) 708 0.0170 1 0.158
C2/75 51.0 230 328 1310 2 6 # 4(13 mm) 708 0.0170 1 0.095
C2/50 51.3 230 328 1310 2 6 # 4(13 mm) 708 0.0170 1 0.061
C2/00 51.3 230 328 1310 2 6 # 4(13 mm) 708 0.0170 1 N/A
Details of Specimens of Group A:
Full detailing of specimen dimensions and reinforcement are illustrated in Figures (3.2)
through (3.5). All four beams have a width of 230 mm, the beams have effective span le
1240 mm while the total length is 1800 mm. The depth, d is 621 mm for the specimens of
group (A). Each beam has a longitudinal main FRP reinforcement ratio ρ of 1.197
percent. The specimens of group (A) consisting two rows of three 19-mm diameter FRP
rebars. However, different amount of vertical and horizontal FRP reinforcement was
applied to obtain different quantities with ρw= 0, 44, 68, and 100 percent for A1/00,
A1/50, A1/75 and A1/100 specimens, respectively. Closed-loop FRP stirrups of 6 mm

51
diameter with different spacing S of 196, 290 and 450 mm were used as the vertical
reinforcement for A1/100, A1/75 and A1/50 specimens, respectively. The FRP stirrups
were pre-fabricated by the manufacturer at the plant. Also two FRP bars with diameter of
6 mm at 190 mm spacing on each side were used as horizontal web reinforcement for
specimens A1/100. While, the specimens A1/75 and A1/50 have only one FRP bar in
each side with diameter of 10 and 6 mm at the mid height of the beam, respectively.
675
621
1800 230
30
#3
stirrups
bar 6M
#6
#2
2801240
190
190
190
675
621
1800 230
302801240
#2
stirrups 6M @ 196 mm
190
190
190
( B )( A )
620PL 180X230X10
Fig. (3.2) Beam A1/100: (A) elevation (B) cross section
675
621
2801240
1800 230
30
#3
#6
#3
stirrups 6M @ 290 mm
stirrups
bar 6M
620
307
( B )( A )
PL 180X230X10
Fig. (3.3) Beam A1/75: (A) elevation (B) cross section

52
675
621
1800 230
30
#3
#6
#2
2801240
stirrups 6M @ 450 mm
stirrups
bar 6M
620
( B )( A )
PL 180X230X10
Fig. (3.4) Beam A1/50: (A) elevation (B) cross section
675
621
1800 230
30
#3
#6
2801240
620PL 180X230X10
( B )( A )
Fig. (3.5) Beam A1/00: (A) elevation (B) cross section
Details of Specimens of Group B:
Full detailing of specimen dimensions and reinforcing are illustrated in Figure (3.6).
The beam has a width of 230 mm, also it has effective span (le) is 1340 mm while the
total length is 1800 mm. The depth, d is 447 mm for the specimen of group (B). The

53
beam has a longitudinal main FRP reinforcement ratio ρ of 1.201 percent. The
longitudinal reinforcement consists of two layers of FRP rebars; three 19-mm diameter
bars at the bottom layer, and three 13-mm diameter bars at the upper layer. The vertical
web reinforcement consists of pre-fabricated closed-loop FRP stirrups of 6 mm diameter
with a spacing S of 196 mm. Also one FRP bar with diameter of 6 mm was used in each
side of the beam as horizontal web reinforcement.
500
447
2301800 230
30
#4
#3
#6
#2
1340
stirrups 6M @ 196 mm
500
447
2301800 230
301340
( B )( A )
670PL 180X230X10
Fig. (3.6) Beam B1.5/100: (A) elevation (B) cross section
Details of Specimens of Group C:
Full details of the specimen dimensions and reinforcements are shown in Figures (3.7)
through (3.10). All four beams have a width of 230 mm, the beams have effective span le
1310 mm while the total length is 1800 mm. The depth, d is 328 mm for the specimens of
group (C). Each beam has a longitudinal main FRP reinforcement ratio ρ of 1.00 percent.
The specimens of group (C) consisting of two rows of three 13-mm diameter FRP rebars.
However, different amount of vertical and horizontal FRP reinforcements was applied to
obtain deferent quantities of web reinforcements, ρw= 0, 38, 60, and 100 percent for

54
C2/00, C2/50, C2/75 and C2/100 specimens, respectively. Pre-fabricated closed-loop
FRP stirrups of 6 mm diameter are used with a spacing S of 175, 290 and 450 mm for
C2/100, C2/75 and C2/50 specimens, respectively. Also one FRP bar with diameter of 6
mm in each side at the mid height of the beam was used as horizontal web reinforcement
for specimens C2/100 and C2/75.
375
#4
#3
2451310
1800 230
30
stirrups 6M @ 175 mm
#2
stirrups
bar 6M
375
328
245
230
30
( B )( A )
655PL 180X230X10
Fig. (3.7) Beam C2/100: (A) elevation (B) cross section
375
328
#4
#3
1800 230
302451310
stirrups 6M @ 290 mm
#2
stirrups
bar 6M
( B )( A )
655PL 180X230X10
Fig. (3.8) Beam C2/75: (A) elevation (B) cross section

55
375
328
#4
#3
1800 230
302451310
stirrups 6M @ 450 mm
stirrups
bar 6M
( B )( A )
655PL 180X230X10
Fig. (3.9) Beam C2/50: (A) elevation (B) cross section
375
328
#4
#3
1800 230
302451310
( B )( A )
655PL 180X230X10
Fig. (3.10) Beam C2/00: (A) elevation (B) cross section
3.4.2. Materials:
Concrete:
A single batch of concrete with a target compressive strength of about 35 MPa supplied
by a local ready-mix concrete company was used in the construction of the beam
specimens. Table (3.2) describes the details of the concrete mixture used in this study.

56
During the casting of the beams, eight 100 mm diameter and 200 mm high concrete
cylinders were also prepared.
Table (3.2) Concrete mixture details
Concrete mixture w/c 0.39
Water, kg/m3 161.9
Cement type Type GU
Cement content, kg/m3 415.0
Fine aggregate content, kg/m3 875.0
Coarse aggregate size 5-14 mm
Coarse aggregate content, kg/m3 870.0
Air, % 5-8%
Slump, mm 80±30 mm
Additives
Micro Air ml/m3
260.0
Glenlum 7500, ml/m3 1090.0
Fig. (3.11) Concrete compressive stress-strain relationship
f`c =52.32 Mpa f`c =53.51 Mpa
f`c =45.69 Mpa
0
10
20
30
40
50
60
0 0.001 0.002 0.003 0.004 0.005
Stre
ss (
MP
a)
Strain

57
Fig. (3.12) Compression test of concrete cylinder
The compressive strength was obtained by testing three cylinders according to
Canadian standard A23.2-9C-09 [2009] Fig. (3.12). Also two cylinders were tested for
the assessment of splitting tensile strength of concrete according to Canadian standard
A23.2-13C [2009]. The stress-strain diagram of a few concrete cylinders tested for
determining the strength of concrete is presented in Figure (3.11). As can be seen in
Figure (3.11), the stress-strain curve consists of two portions: the elastic and the inelastic
range. In the elastic range where the transition zone cracks remain stable, the curve is a
linear.
Table (3.3) Average concrete strength determined from test cylinders
Age of the sample
(days)
f`c (MPa) ft (MPa)
28 45.69 --
60 -- 6.55
112 49.61 --
166 52.92 --
The stress-strain plot in the inelastic range becomes non-linear because the cracks
begin to propagate. After the ultimate stress is reached, the stress decreases while the

58
strain grows until the failure occurred. A summary of the concrete strength is provided in
Table (3.3). Another three cylinders from the same mix were also tested, one at the
beginning and two at the end of the beam tests. A linear relationship between the
compressive strength and number of days was developed which has been used to find the
actual compressive strength for each beam.
Glass FRP Reinforcement Bars:
Only one type of glass FRP manufactured by Pultrall Inc., Quebec, was used here. The
sand coated glass FRP bars were used as flexural reinforcement with following three
sizes: No. 10, No. 13, and No. 16. The stirrups were pre-fabricated by manufacturer from
sand coated glass FRP bar with size No. 6 according to the dimensions provided based on
the design of the specimens. Figure (3.13) shows the stress-strain diagrams of the glass
FRP rebars. All the rebars show an elastic phase up to failure point in tension. The
characteristics of the glass FRP used in this study are summarized in Table (3.4)
according to the data sheet provided by the manufacturer.
Fig. (3.13) Glass FRP stress-strain relationship
874 MPa
856 MPa
708 MPa 656 MPa
0
100
200
300
400
500
600
700
800
900
1000
0 0.005 0.01 0.015 0.02
The
Te
nsi
le S
tre
ngt
h F
u (M
Pa)
The Strain εFu
bar size # 6
bar size #10
bar size #13
bar size #19

59
Table (3.4) Manufacture’s properties of Glass FRP bars
Soft Metric
Size
Diameter
(mm)
Area
(mm2)
Tensile Modulus
of Elasticity Et (GPa)
Ultimate Tensile
Strength fu (MPa)
Ultimate Strain
in Tension εFu
(%)
Poisson’s
Ratio μ
# 6 6.350 31.7 46.1 874 1.90 0.25
#10 9.525 71.3 45.4 856 1.89 0.21
#13 12.700 126.7 46.3 708 1.70 0.26
#19 19.050 285 47.6 656 1.53 0.25
3.4.3. Instrumentation:
External instrumentation for each beam consists of two linear potentiometers located at
the mid-span to record the beam deflection; where one potentiometer was connected on
each side of the beam to measure the differential displacement of the both sides during
the test. The full stroke range (F.S) of the potentiometers was 635 mm with accuracy of
0.25% of F.S. Three uniaxial strain gauges of model KFG-10-120-C1-11 with 10 mm
length were bonded on the longitudinal bars at the mid-span. Also the same type of
uniaxial strain gauge was bonded on both ends of the longitudinal bars in each beam. The
FRP web reinforcements on both sides of a beam at critical section were instrumented
with Kyowa Model KFG-2-120-C1-11 Uniaxial strain gauges with 2 mm length. The
instruments at the installation phase and their locations on the FRP are illustrated in
Figures (3.14) and (3.15).
Fig. (3.14) The installation phase of strain gages in specimen A1/50.

60
ML2 & ML3
ML1 EL4 EL5
MU6
VR7
VR8
VR9 VL15HR11
HR10
HL18
HL16
VL13
VL14
HR12
Fig. (3.15-a) The location of strain gages for specimen A1/100.
ML2 & ML3
ML1 EL4 EL5
MU6
VR7
VR8 VR9
VL12
VL13VL14
HR10 HR11HL16 HL15
Fig. (3.15-b) The location of strain gages for specimen A1/75.
ML2 & ML3
ML1 EL4 EL5
MU6
VR9
VR10
HR7 HR8
VL13
VL14
HL12 HL11
Fig. (3.15-c) The location of strain gages for specimen A1/50.

61
ML2 & ML3
ML1 EL4 EL5
MU6
Fig. (3.15-d) The location of strain gages for specimen A1/00.
VR7
VR8
VL13
VL14VL15ML2 & ML3
ML1 EL4 EL5
MU6
HR11 HR12HL18 HL17
VR9 VR10 VL16
Fig. (3.15-e) The location of strain gages for specimen B1.5/100.
ML2 & ML3
ML1 EL4 EL5
VR8
VR9 VR10
VL14
VL15
HR12 HR13HL19 HL18
VR11 VL16VL17
MU6 & MU7
Fig. (3.15-f) The location of strain gages for specimen C2/100.

62
ML2 & ML3
ML1 EL4 EL5
MU6 VR7
VR8 VR9
VL12
VL13VL14
HR10 HR11HL16 HL15
Fig. (3.15-g) The location of strain gages for specimen C2/75.
ML2 & ML3
ML1 EL4 EL5
MU6 VR7
VR8
VL9
VL10
Fig. (3.15-h) The location of strain gages for specimen C2/50.
ML2 & ML3
ML1 EL4 EL5
MU6
Fig. (3.15-i) The location of strain gages for specimen C2/00.

63
3.4.4. Fabrication and Casting of Beams:
Wood forms were used in the fabrication of the beams. The inside of the forms was
painted before the reinforcement cage was placed in its position to prevent the wood from
absorbing the water of the concrete mixture. The concrete mix was then placed and
vibrated using electrical vibrator. Next day of casting, the beams were covered with damp
canvas. The canvas was watered once daily for 14 days. The formwork was removed
after 35 days after the day of casting as shown in Figure (3.16).
Fig. (3.16) The stages of specimen preparation during and after the concrete casting.

64
3.4.5. Test Procedure:
All the specimens were simply supported as shown in Figures (3.17) and (3.18). All
the beams were tested to failure under three-point loading (i.e. one concentrated vertical
load at the mid-span). Steel roller restrained in the horizontal direction was used to ensure
that only the concentrated load would be applied at the loading point. A 2000 kN capacity
actuator was used to apply the load at the top of the mid span of the specimens. Steel
plates were placed at the point load and the support location. The bearing plates with the
dimensions of 180 mm length x 230 mm width x30 mm height were attached by plaster
paste at the loading point and at the supports to obtain uniform contact and to prevent the
plates from slipping. To reduce the possibility of a stability failure, the centralization of
the beam position and its vertical alignment were verified during the erecting process.
Both surfaces of the beam were painted white and with grids to monitor the crack
development during the test.
Fig. (3.17) Typical test setup for any beam in group A

65
All wiring of strain and deflection gauges was connected to the data acquisition
system and initialized to zero. Throughout the test procedure, the load capacity, FRP
strain and mid-span deflection data at each load increment was recorded.
Measurements were taken at half-second intervals. Global information, obtained from
the data acquisition system, photographs and recorded observations, were utilized to
interpret the results of each test. The average time to beam failure was approximately
28, 24 and 16 minutes for beams in group A, B and C, respectively. The load was
applied at a rate according to C293-08 of the ASTM standards - Section 4 -
Construction [2013]. The loading rate for flexural test of simply-supported concrete
beams with center-point loading in the ASTM standards should be constant and
calculating as followed:
r=2S h d2/ 3l (3.13)
where r is the loading rate (N/min), S is the rate of increase in the maximum stress on
the tension face (0.9-1.2 MPa/min), b is the average width (mm), h is the average
depth (mm) and l is the effective length (mm). Table (3.5) shows the minimum and
the maximum of the loading rate that should be applied to the beams in group A, B
and C according to the Equation (3.4).
Table (3.5) The loading rate of the beams in group A, B and C
Specimens
The loading rate
Min
(kN/sec)
Max
(kN/sec)
Group A 0.72 0.95
Group B 0.34 0.46
Group C 0.19 0.25

66
A constant rate of load was applied with rate of 0.36, 0.49, 0.87 and 0.93 kN/sec
for the specimens in the group A: A1/00, A1/50, A1/75 and A1/100, respectively.
While the loading rate of the beam B1.5/100 was 0.43kN/sec. the specimens in group
C: C2/00, C2/50, C2/75 and C2/100 were loaded up to failure with loading rate of
0.16, 0.23, 0.21 and 0.25kN/sec, respectively. While the loading rate is consistent
with that suggested in the relevant ASTM standard for most of the tested specimens,
it was smaller in the cases of A1/00 and A1/50 because of the manual control of
loading. However, the lower rate of loading for these two specimens was not
expected to affect the behaviour of the beams which was later conformed form the
results of the tests.
Fig. (3.18) The test arrangement for beam A1/100

67
3.5. Objective of the Experimental Program:
The objective of the experimental program was to measure the strain distribution, as
well as to monitor the load-deflection response. Also to study the structural behaviour
of FRP reinforced concrete deep beams by using the experimental data. The test
beams were designed with sufficient width to avoid the effect of lateral buckling.
Beams were also designed with and without stirrups for a different shear span-to-
depth ratio a/d to determine their effect on the deep beam behaviour and its failure
modes. The experimental results are to be used to validate the proposed and current
design methods for FRP-reinforced concrete deep beams and suggest suitable
modifications, if required.
68
Chapter 4: Comparison of the Different Design
Provisions for Conventional Deep Beams
4.1. Introduction:
A set of 347 experimental test results have been gathered from the literature and used
here to evaluate and compare the Strut-and-Tie modeling provisions of the codes from
three different jurisdictions: Canada, USA and Europe. The effect of the governing
variables such as the shear-depth to span ratio, web reinforcement and the compressive
strength of concrete on the capacity predicted by the Strut–and-Tie model (STM)
provisions of the codes have also been investigated. Also the predictions of failure
occurrence in deep beams as determined using the models have been examined. The
Canadian code (CSA A23.3-04) is found to provide the most efficient and robust
procedures for estimating the ultimate capacity of reinforced concrete deep beams using
the strut and tie model. The study also indicates that none of the selected codes provide
adequate procedures to determine the location and mode of failure accurately and reliably
as compared to the experimental results.
4.2. Calculating the capacity using the STM procedures:
The geometry of the strut and tie model is determined by calculating the maximum
lever arm, which is determined by balancing the internal compressive forces C and tensile
forces T in steel, for example. In the Canadian code, the height of the bottom node is
assumed to be 1.13 times the height of the top node and is obtained by dividing the
compressive stress of the CCT node by the compressive stress of the CCC. The

69
multiplication factors are 1.25 and 1.34 for both the ACI and the Eurocode, respectively.
Figure (4.1) shows the strut and tie model of a beam loaded by a single point load.
Tie ( bottom reinforcement) Nodal Zone CCT
Nodal Zone CCT P/2
0.850.75
a
PNodal Zone CCC
a
Strut
P/2lb
ha
lb
da
(lb/2) sin +ha cos Strut
lb sin +ha cos
Fig. (4.1) Description of strut and tie model
Thus, based on the geometry of the truss, the dimension of all struts, nodes and ties can
be calculated. From the truss geometry and the dimensions of the nodes and beam
member, the strut angles “θ” can be determined and compared with the allowable
minimum strut angle. If the calculated angle exceeds the limit, the geometry will be
modified according to the modified angle. Based on this manipulation, all the possibilities
of the applied loads and the resulting forces in each element can be determined using the
provisions of each code.
The maximum applied load (i.e. failure load) can be determined from the strength of
the weakest element. The calculation covered five different categories. The ACI cases
have been divided into two types based on the strut shape. ACI represents the strut with a
uniform cross section and the bottle-shaped struts, for which the efficiency factor βs is
different from the efficiency factor of the uniform strut. There is also Euro Option-2,
which is similar to the procedure provided in the Eurocode with modifying the prediction

70
of the ultimate shear force by multiplying this value by β= a/2d. Additionally, the
ultimate shear forces are calculated by using the Canadian code and Eurocode Option-1
without any adjustment. An example of application of the STM provisions in the
Canadian code (CSA- A23.3-04) is given in Appendix-A.
4.3. Comparison between the Strut-and-Tie model and the traditional
(sectional) beam theory:
Figure (4.2) shows a comparison between the Strut-and-Tie model and the traditional
(sectional) beam theory in predicting the dimensionless shear stress capacity (ν) of beams
as a function of the a/d ratio. To illustrate this comparison, the dimensionless shear stress
value is calculated as follows:
= / (4.1)
where, b is the beam width; d is the effective depth; and f´c is the concrete compressive
strength. The results shown in Figure (4.2) confirm the influence of this factor on the
specimens with a/d less than or equal to two, where the specimens with small shear span-
to-depth ratio has higher shear strength. And the results also emphasize the efficiency of
the Strut and Tie model in designing deep beams. In addition, it can be seen that for
a/d<3, the sectional model (i.e. traditional beam theory) in the provisions of any of the
selected codes, does not provide an accurate estimate of capacity. In this case, the STM
model, especially with the provisions of the Canadian code (CSA-A23-3-04[2004]),
provides a very good estimate of the capacity when compared to the experimental results.

71
a.)
b.)
c.)
Fig. (4.2) Use of strut and tie model and sectional mode to predict the strengths of a
series of beams l: a.) Canadian code (A23.3-04); b.) Eurocode (EN 1992-1-1-2004E), and
c.) ACI code (ACI 318-08).
0.00
0.05
0.10
0.15
0.20
0.25
0.30
0 0.5 1 1.5 2 2.5 3 3.5
Shea
r St
ress
Shear span-to-Depth Ratio a/d
Experimental Results
Strut and Tie Model
Sectional Model
0.00
0.05
0.10
0.15
0.20
0.25
0.30
0 0.5 1 1.5 2 2.5 3 3.5
Shea
r St
ress
Shear Span-to-Debth Ratio a/d
Experimental Results
Strut and Tie Model
Sectional Model
0.00
0.05
0.10
0.15
0.20
0.25
0.30
0 0.5 1 1.5 2 2.5 3 3.5
Shea
r st
ress
Shear Span-to-Depth Ratio a/d
Experimental Results
Strut and Tie Model
Sectional Model

72
The prediction of the capacity from the Canadian code is conservative as compared to
that obtained using the other two codes. It should be noted that the provisions for
determining the capacity using the sectional model varies slightly from one code to
another, as evident from Figure (4.2).
4.4. The codes prediction of ultimate shear strength of deep beams:
Figure (4.3) shows the percentage of samples for which the ratio of the predicted shear
strength calculated using the code provisions (Vcalc) to the actual shear strength from the
experimental results (Vexp) is lower than 1 indicating that Vcalc is conservative. Those
results come from all the experimental specimens, including those that are not covered by
the provisions of the codes, such as the specifications of web reinforcements and the
strength of concrete.
Based on the results, it is found that the Canadian code provides the most conservative
provisions with an average of 89.34% of the test specimens have higher capacity than
that provided in the code, while just a 66.28% and 68.01% of the total specimens exceed
the capacity predicted using the ACI and the Eurocode Option-1 respectively. Also the
results as shown in Fig. (4.3) indicate a noticeable improvement when Eurocode Option-2
is used and the percentage increased to 79.54%. The results of ACI improve only by
12.11% when bottle-shaped struts are used instead of uniform cross section struts.

73
Fig. (4.3) The percentage of samples that Vcalc/Vexp ≤1 for all specimens
4.5. Comparison between the nominal and factored capacity of shear
strength of deep beams calculated by using the code provisions:
The plot in Figure (4.4) shows a comparison between the nominal and factored shear
strength capacity calculated using the code provisions (Vcalc). The comparison was done
based on the percentage of samples for which the ratio of the nominal and factored
capacity calculated using the provisions of the three codes (Vcalc) to the actual shear
strength from the experimental results (Vexp). The results contain only the experimental
specimens that have shear span-to depth ratio less than 2.5. The results show that the
factored capacities calculated by using the Canadian code provides the most consistent
results with an average of 90.99% and 77.48% of the test specimens having higher
capacity than the capacity calculated using the code provisions considering the factored
and nominal strengths, respectively. In calculating the factored capacity, the resistance
factor of the material was taken as 0.65 for the concrete and 0.85 for reinforcing bars.
66.28%
78.39%
89.34%
68.01%
79.54%
0
20
40
60
80
100
ACI Uniform
ACI Bottle shaped
CSA Eurocode Option-1
Eurocode Option-2
The
Pe
rce
nta
ge o
f Sa
mp
les
that
V
calc
/Ve
xp ≤
1

74
The nominal capacities of the beams were found to be approximately 14% higher than the
corresponding factored capacities. The predicted capacity by using the nominal strength
of the STM in the Canadian code was found to be scattered with mean value of Vcalc/Vexp
as 0.81, standard of deviation (SD) of 0.40 and coefficient of variation (COV) of 0.49.
Considering these results, the Canadian code can be said to provide a conservative
estimate to predict the ultimate strength. When the factored strength is used in the STM
in the Canadian code, the results were quite conservative and scattered with mean values
of 0.59, SD of 0.26 and COV of 0.44.The mean, SD and COV of the result predictions of
the three codes are presented in the table (4.1).
Fig. (4.4) The percentage of samples that Vcalc/Vexp ≤1 for all specimens
Although the ACI code applied a constant reduction factor for factored force in the all
elements of the STM (struts, ties, and nodal zones), the improvement in the percentage of
the prediction by using uniform strut in the ACI code for the factor force was higher than
69.67%
79.58% 77.48%
57.96%
78.38%
84.09% 89.19% 90.99%
70.87%
82.88%
0
10
20
30
40
50
60
70
80
90
100
ACI Uniform
ACI Bottle shaped
CSA Euro option1
Euro option2
The
Pe
rce
nta
ge o
f Sa
mp
les
that
V
calc/V
exp
≤1
Factored
Nominal
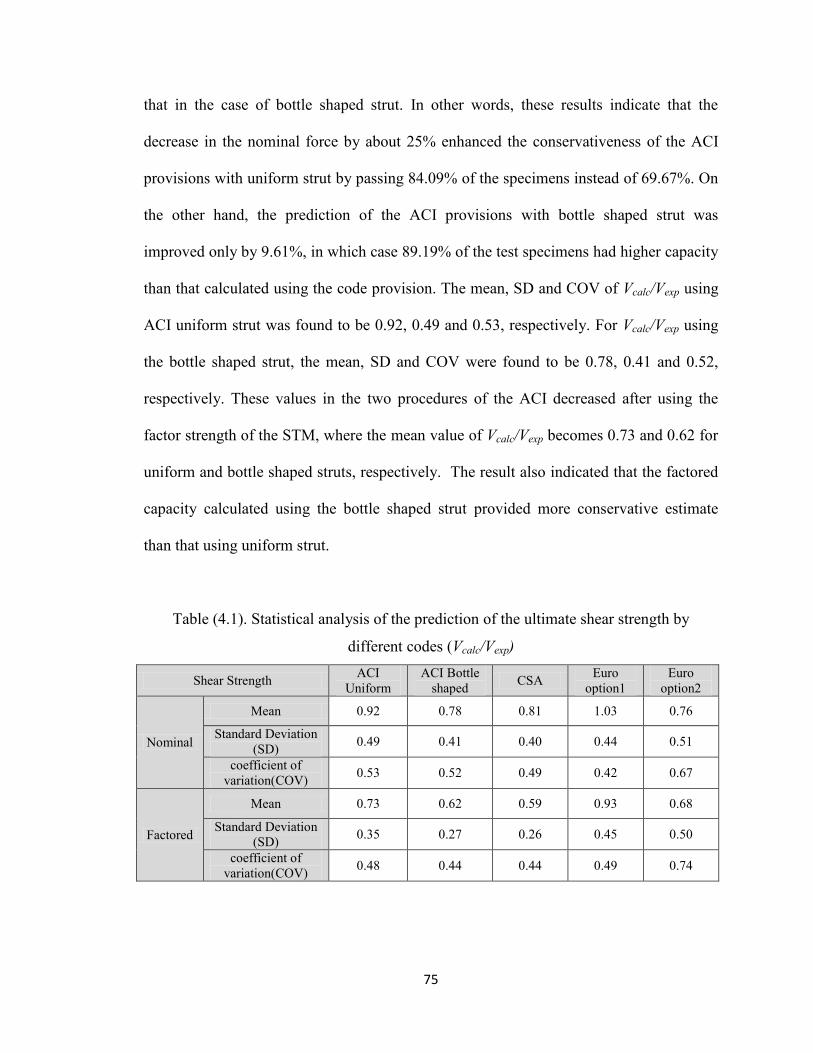
75
that in the case of bottle shaped strut. In other words, these results indicate that the
decrease in the nominal force by about 25% enhanced the conservativeness of the ACI
provisions with uniform strut by passing 84.09% of the specimens instead of 69.67%. On
the other hand, the prediction of the ACI provisions with bottle shaped strut was
improved only by 9.61%, in which case 89.19% of the test specimens had higher capacity
than that calculated using the code provision. The mean, SD and COV of Vcalc/Vexp using
ACI uniform strut was found to be 0.92, 0.49 and 0.53, respectively. For Vcalc/Vexp using
the bottle shaped strut, the mean, SD and COV were found to be 0.78, 0.41 and 0.52,
respectively. These values in the two procedures of the ACI decreased after using the
factor strength of the STM, where the mean value of Vcalc/Vexp becomes 0.73 and 0.62 for
uniform and bottle shaped struts, respectively. The result also indicated that the factored
capacity calculated using the bottle shaped strut provided more conservative estimate
than that using uniform strut.
Table (4.1). Statistical analysis of the prediction of the ultimate shear strength by
different codes (Vcalc/Vexp)
Shear Strength ACI
Uniform
ACI Bottle
shaped CSA
Euro
option1
Euro
option2
Nominal
Mean 0.92 0.78 0.81 1.03 0.76
Standard Deviation
(SD) 0.49 0.41 0.40 0.44 0.51
coefficient of
variation(COV) 0.53 0.52 0.49 0.42 0.67
Factored
Mean 0.73 0.62 0.59 0.93 0.68
Standard Deviation
(SD) 0.35 0.27 0.26 0.45 0.50
coefficient of
variation(COV) 0.48 0.44 0.44 0.49 0.74
76
The results as shown in Figure (4.4) indicate a noticeable improvement when Eurocode
Option-2 for nominal strength is used and the percentage increased to 78.38% comparing
to Eurocode Option-1. Although the two options of the Eruocode applied a similar
reduction factor for concrete to calculate the factored force, the Eruocode Option-1
improves up to 12.91% while the Eruocode Option-2 improves only 4.50% and becomes
82.88% of the test specimens having higher capacity than that provided in the code. The
least improvement in the prediction of the shear strength is found in the Eruocode
Option-2 after using factor strength. This variation between the two options of the
Eurocode clearly appeared in Table (4.1) where Eurocode Option-1 produces the mean
value of Vcalc/Vexp as1.03 with SD of 0.44 for nominal strength which shows a slight
overestimation of the shear strength; and for the mean value of Vcalc/Vexp and SD are
found to be 0.93 and 0.45, respectively for factored strength.
4.6. The effect of web reinforcement on the code predictions of the ultimate
strength:
To study the effect of web reinforcement on the ultimate shear strength and on that
estimated by using the code provisions, the samples from the database of available
experimental results (Table 2-2) as compiled in this study have been divided into four
groups depending on the distribution of web reinforcement. In this case the following
groups are formed: (1) the samples that have vertical and horizontal web reinforcements
are referred to as “only web”; (2) samples having web reinforcements in the vertical
direction only are referred to as “only vertical”; (3) samples having web reinforcement in
the horizontal direction only are referred to as “only horizontal”; and (4) the samples
without any web reinforcement are referred to as “without web”. Figure (4.5) shows the
77
percentage of samples that have (Vcalc/Vexp ≤1) for the above four groups. The only
variable taken into consideration in producing the results shown in Figure (4.5) is the
distribution of web reinforcement regardless of the shear-span to depth ratio and the
compressive strength of concrete. When using Eurocode Option-1 or ACI (uniform strut)
for determining the shear strength capacities of the available samples with web
reinforcement, 86.52% and 87.23% samples, respectively, have been found to have
Vcalc/Vexp≤1 (Fig. (4.5)).
Using the bottle-shaped strut instead of the uniform strut section, the results are found
to be improved to 96.45%. Similar improvement in the Vcalc/Vexp ratio is obtained using
Eurocode Option-2 in which case 97.87% of the samples are found to have a capacity
higher than the predicted capacity using the code procedure (i.e., Vcalc/Vexp≤1). In the case
of the Canadian code provisions, 98.58% of the samples are found to have Vcalc/Vexp≤1,
indicating that the CSA procedure yields the most conservative estimate of the shear
strength capacity of concrete deep beams with web reinforcements.
From Figure (4.5) it is observed that, in the case of concrete deep beams with only
vertical or horizontal web-reinforcements, and also in the case of no web-reinforcements,
the Canadian code provisions still yield conservative estimates the shear strength capacity
as compared to the other code provisions. The mean, SD and COV of the estimated
ultimate shear strength by different codes considering the effect of web reinforcement are
presented in the Table (4-2). The predictions by using the Canadian code for specimens
with web reinforcement scattered with mean values of Vcalc/Vexp as 0.52, SD of 0.18 and
COV of 0.34. The mean value of Vcalc/Vexp, SD and COV considering the nominal
strength for the ACI uniform strut are found to be 0.77, 0.23 and 0.21, respectively.

78
While using the bottle shaped strut, the mean, SD and COV are found to be 0.71, 0.21
and 0.30, respectively. The mean (Vcalc/Vexp), SD and COV of the predictions by using the
Eruocode Option-1 are obtained as 0.77, 0.23 and 0.30, respectively. With Eruocode
Option-2 the estimated Vcalc/Vexp is found to be lower and scattered with mean value of
0.48, SD of 0.20 and COV of 0.42.
Fig. (4.5) The percentage of samples having Vcalc/Vexp ≤1 considering the effect of web
reinforcement
Eruocode Option-2 and ACI bottle shaped strut provided less conservative estimate
of the ultimate shear strength as compared to Eruocode Option-1 and ACI uniform strut.
ACI uniform and Eurocode Option-1 produces more conservative results, especially in
the cases when vertical or horizontal web reinforcement are used (Figure 4.5). The
Canadian code is found to provide the most conservative estimate of the ultimate strength
considering the available experimental results.
87
.23
%
51
.13
%
27
.27
%
58
.06
%
96
.45
%
60
.90
%
36
.36
%
79
.03
% 9
8.5
8%
78
.20
% 1
00
.00
%
90
.32
%
86
.52
%
54
.14
%
27
.27
%
62
.90
%
97
.87
59
.40
%
54
.55
%
85
.48
%
0
20
40
60
80
100
only web only vertical only horizontal
without web
The
Pe
rce
nta
ge o
f Sa
mp
les
hav
ing
V
calc
/Ve
xp ≤
1
ACI Uniform
ACI Bottle shaped
CSA
Eurocode Option-1
Eurocode Option-2

79
Table (4.2). Statistical analysis of the prediction of the ultimate shear strength by
different codes considering the effect of web reinforcement
Distribution of the web
reinforcement
ACI
Uniform
ACI Bottle
shaped CSA
Eurocode
option-1
Eurocode
option-2
only web
Mean 0.77 0.71 0.52 0.77 0.48
Standard Deviation
(SD) 0.23 0.21 0.18 0.23 0.20
coefficient of
variation(COV) 0.30 0.29 0.34 0.30 0.42
only vertical
Mean 1.02 0.85 0.65 0.94 0.80
Standard Deviation
(SD) 0.58 0.48 0.31 0.60 0.64
coefficient of
variation(COV) 0.57 0.56 0.48 0.64 0.80
only
horizontal
Mean 1.22 1.18 0.67 1.23 0.82
Standard Deviation
(SD) 0.44 0.41 0.16 0.48 0.51
coefficient of
variation(COV) 0.36 0.35 0.25 0.39 0.62
without web
Mean 0.95 0.74 0.61 0.86 0.52
Standard Deviation
(SD) 0.40 0.38 0.27 0.42 0.36
coefficient of
variation(COV) 0.42 0.51 0.44 0.49 0.69
Figures (4.6) and (4.7) show the effect of the web reinforcement with respect to
the compressive strength of concrete. As can be observed from the figures, the provisions
of all three codes yield conservative results when the compressive strength is equal to or
less than 40 MPa. With the ACI bottle-shaped strut, fewer than 5% of the samples exhibit
the actual capacities to be less than the predicted capacities calculated using the code
provisions (Figure (4.6)), which is contrary to the findings of Michael and Oguzhan
[2007].

80
Fig. (4.6) The percentage of samples having Vcalc/Vexp ≤1
(for specimens with f`c≤40 MPa)
Fig. (4.7) The percentage of samples having Vcalc/Vexp ≤1
(for specimens with f`c> 40 MPa)
For high-strength concrete samples where the compressive strength of concrete is
assumed to be equal to or more than 40 MPa, the results are very conservative. In this
85
.53
%
10
0.0
0%
68
.57
%
98
.68
%
10
0.0
0%
97
.14
%
98
.68
%
10
0.0
0%
10
0.0
0%
84
.21
%
10
0.0
0%
74
.29
%
98
.68
%
10
0.0
0%
97
.14
%
0
20
40
60
80
100
web only vertical without web
The
Pe
rce
nta
ge o
f Sa
mp
les
hav
ing
Vca
lc/V
exp
≤1
ACI Uniform
ACI Bottle shaped
CSA
Eurocode Option-1
Eurocode Option-2
89
.23
%
42
.98
%
30
.00
%
44
.44
%
93
.85
%
54
.39
%
40
.00
%
55
.56
%
98
.46
%
74
.56
% 1
00
.00
%
77
.78
%
89
.23
%
46
.49
%
30
.00
% 48
.15
%
96
.92
%
52
.63
%
60
.00
%
70
.37
%
0
20
40
60
80
100
only web only vertical only horizontal
without web
The
Pe
rce
nta
ge o
f Sa
mp
les
hav
ing
Vca
lc/V
exp ≤
1
ACI Uniform
ACI Bottle shaped
CSA
Eurocode Option-1
Eurocode Option-2

81
case, Eurocode Option-2, the ACI bottle-shaped strut and the CSA code produce a
conservative estimate of capacity for 96.92%, 93.85%, and 98.46% of the samples,
respectively (Figure (4.7)).
4.7. The effect of shear-span to depth ratio on the code predictions of the
ultimate strength:
To study the effect of the shear-span to depth ratio on the code provisions in
predicting the ultimate strength, the samples of the experimental results are divided into
four categories. The beam samples grouped according to the a/d ratio, as follows: (1)
specimens having (a/d ≤ 1), (2) specimens having (1<a/d ≤ 2), (3) specimens having
(2<a/d ≤ 2.5), and (4) specimens having (a/d > 2.5). For the available experimental
specimens having (a/d ≤ 1), the capacity estimated by using the code provisions is found
to be conservative as compared to the actual capacity.
Fig. (4.8) The percentage of samples having Vcalc/Vexp ≤1 considering a/d ratio
As observed in Fig. (4.8), the code provisions, especially the Eurocode Option-2 and
the Canadian Code underestimate the capacity for 100% and 99.08% of the samples,
92
.66
%
69
.19
%
19
.23
%
97
.25
%
82
.56
%
32
.69
%
35
.71
%
99
.08
%
96
.51
%
55
.77
%
50
.00
%
95
.41
%
68
.60
%
26
.92
%
10
0.0
0
88
.95
%
26
.92
%
0
20
40
60
80
100
a/d≤1 1<a\d≤2 2<a\d≤2.5 a\d>2.5
The
Pe
rce
nta
ge o
f Sa
mp
les
hav
ing
Vca
lc/V
exp ≤
1
a/d Shear span- dept ratio
ACI Uniform
ACI Bottle shaped
CSA
Eurocode Option-1
Eurocode Option-2

82
respectively. The best results for the specimens with an a/d ranging between 1 and 2 are
represented by the Canadian provisions, with 96.51% of the specimens having a higher
capacity than that predicted using the code provisions (Fig. (4.8)).
For the specimens with (a/d > 2), the capacity predicted using the code provisions is not
conservative in many cases (Figure (4.8)). The capacity of 50% of the samples is
overestimated using the provisions of the Canadian code when the a/d ratio is higher than
2.5, whereas the provisions of the other codes produce even worse results, as shown in
Figure (4.8). The above results indicate that the STMs available in the selected codes are
not applicable when (a/d > 2).
Table (4.3) compares between the mean, the standard of deviation and the coefficient
of variation of the predictions of the ultimate shear strength, Vcalc/Vexp by different codes
considering the effect of shear span-to-depth ratio. The predictions by using the STM in
the Canadian code for beams with a/d≤1 and 1<a/d≤2 were almost similar with mean
values of Vcalc/Vexp as 0.57 and 0.52, SD of 0.21 and 0.20 and COV of 0.37 and 0.39,
respectively. On the other hand, for beams with 2<a/d≤2.5 and a/d≥2.5, the predictions
by using the STM in the Canadian code produced the mean values of Vcalc/Vexp as 0.87
and 0.79, SD of 0.37 and 0.35 and COV of 0.42 and 0.44, respectively.
The higher standard deviation indicates higher scatter in the predicted values (using
the code provisions) of the ultimate strength of the beams with shear span-to-depth ratio
higher than two, as shown in Figure (4.8). The bottle shaped strut provides a lower mean
value of Vcalc/Vexp and SD as compared to the ACI uniform strut to predict the ultimate
strength of the beams a/d≤1 and 1<a/d≤2 which shows an increased number of the test

83
specimens having higher capacity than that provided by ACI bottle shaped strut (Figure
4.8).
Table (4.3). Statistical analysis of the prediction of the ultimate shear strength by
different codes considering the effect of shear span-to-depth ratio
Shear span-to-depth ratio ACI
Uniform
ACI Bottle
shaped CSA
Eurocode
option-1
Eurocode
option-2
a/d≤1
Mean 0.76 0.69 0.57 0.68 0.37
Standard Deviation
(SD) 0.26 0.26 0.21 0.23 0.21
coefficient of
variation(COV) 0.35 0.38 0.37 0.34 0.56
1<a/d≤2
Mean 0.88 0.75 0.52 0.87 0.60
Standard Deviation
(SD) 0.40 0.36 0.20 0.43 0.35
coefficient of
variation(COV) 0.45 0.47 0.39 0.50 0.59
2<a/d≤2.5
Mean 1.44 1.12 0.87 1.29 1.29
Standard Deviation
(SD) 0.64 0.53 0.37 0.70 0.70
coefficient of
variation(COV) 0.45 0.48 0.42 0.54 0.54
a/d≥2.5
Mean 1.28 0.87 0.79 1.24 1.24
Standard Deviation
(SD) 0.49 0.53 0.35 0.53 0.53
coefficient of
variation(COV) 0.38 0.61 0.44 0.43 0.43
In contrast, the two procedures of the ACI provides un-conservative results for the
beams with 2<a/d≤2.5 and with a/d≥2.5. For the beams with 2<a/d≤2.5 and a/d≥2.5,
both procedures have the mean value of Vcalc/Vexp higher than 1 except the ACI bottle
shaped strut which produces the mean value of Vcalc/Vexp as 0.87. Table (4-3) shows that
the predicted capacity by the Eurocode Option-1 and Option-2 which are found to be un-
conservative for the beams with 2<a/d≤2.5 and with a/d≥2.5 and gave similar results as
in the cases of AQCI provisions. The similarity is caused due to parameter β that
modifies the ultimate shear force provided in Eurocode Option-1, and it is equal to one

84
for all the specimens with a/d≥2. Compared to the above results, the Canadian code
provides a conservative estimate to predict the ultimate strength for all cases that have
different shear span-to-depth ratio.
4.8. The prediction of the failure occurrence in deep beams:
Figure (4.9) shows the level of accuracy with which the failure mode and its location
can be predicted for 310 specimens using the code provisions. A total of 213 [68.71%]
test specimens failed in the second category (i.e., diagonal compression) of the first type
of failure mode (i.e., shear failure), resulting in strut crushing as reported in the
experimental studies. Using the uniform strut section of the of the ACI code [2008]
provision, only 53 [24.88%] specimens were correctly predicted to fail by strut-crushing
failure (Figure (4.9)). When the bottle-shaped strut was used in the ACI provisions, the
accuracy of the prediction of the failure mode improved where 155 [72.77%] specimens
were found to have failed by strut-crushing. These results indicate that the decrease in the
efficiency factor βs by about 25% in the case of bottle-shaped struts instead of the
uniform strut section significantly enhanced the accuracy of the prediction of the strut-
crushing failure mode. Using the provisions of the CSA code [2004], 138 [64.79%]
specimens were predicted to fail in the strut-crushing mode, whereas only 57 [26.76%]
specimens were predicted correctly by Eurocode [2004] (Option-1) to have the same
failure mode. There was no significant change when Eurocode Option-2 was applied, and
the total number of specimens that were predicted correctly to have the strut-crushing
mode of failure was found to be just 58 [27.23%]. Figure (4.9) shows the accuracy of the
prediction of the failure mode for the failure at the bearing plate (regardless of its
location, whether at the loading plate or the support plates). Using the provisions of the

85
Canadian Code [2004] for only 22 out of 44 specimens [50.00%], the bearing plate
failure was predicted correctly. However, a good accuracy was achieved when the ACI
[2008] provisions (uniform strut) were used, where 35 [79.55%] specimens were
correctly predicted to have failure at the bearing plate. By using the bottle-shaped strut in
the ACI provisions only 27.27% (12 specimens out of 44 specimens) of the failure mode
can be predicted correctly.
Fig. (4.9) The prediction of failure occurrence by the STM provision of codes.
The use of the bottle-shaped strut in the ACI provisions produced a far worse result
than did the uniform strut in predicting the failure at a bearing plate. In the case of the
Eurocode provisions, the failure at the bearing plate was correctly predicted for only 26
specimens [59.09%] even after it was adjusted (i.e. Option-2). For the tension failure
mode, using the provisions of ACI [2008] with uniform strut sections, 37 [69.81%]
specimens were correctly predicted to have failed in that mode, whereas 24 [45.28%]
specimens were correctly predicted by the provisions of the Eurocode [2004] (Option-1).
24
.88
%
79
.55
%
69
.81
%
72
.77
%
27
.27
% 4
9.0
6%
64
.79
%
50
.00
%
26
.42
%
26
.76
%
59
.09
%
45
.28
%
27
.23
%
59
.09
%
45
.28
%
0
20
40
60
80
100
Failure of Strut Crushing
Failure at Bearing plate
Tension failure
The
Pe
rce
nta
ge o
f Sa
mp
les
hav
ing
V
calc
/Ve
xp ≤
1
ACI Uniform
ACI Bottle shaped
CSA
Eurocode Option-1
Eurocode Option-2
86
Using the provisions of the Canadian Code A23-3-04[2004], only 14 [26.42%] specimens
were correctly predicted for the failure at the tie member. Therefore, unlike its
conservativeness in predicting the shear strength capacity of a deep beam, the CSA code
provisions are not found to be effective in predicting the failure mode in deep beams. In
fact, none of the codes predicted the failure mode and its location in concrete deep beams
accurately. While the bottle-shaped strut of ACI provisions is useful in predicting the
strut-crushing mode of failure, it is not effective in predicting the failure at the bearing
plates or ties (i.e., tension failure), in which cases the uniform strut option is found to
work better. The Eurocode provisions were not at all effective in predicting any of the
failure modes as shown in Fig. (4.9).
4.9. Proposed modification to ACI code provision:
Based on the study presented earlier in this chapter, the STM model provided in the
ACI code with bottle shaped strut was found to perform better than that with uniform
strut. The ACI version of the STM procedure with bottle shape strut is investigated
further here to improve its performance. One of the key parameters in this case is the
efficiency factor. The efficiency factor for each element calculated by ACI bottle shaped
strut will be determined according to the results of the collected data.
To determine the efficiency factor βs for a bottle shape, the actual capacity of the
experimental specimens were compared to that calculated by the ACI STM procedure
and plotted in Fig. (4.10). The results of the experimental studies indicate that the shear
span depth ratio factor has important effect on the efficiency factor βs. This observation
is consistent with that reported in Foster and Malik [2002]. Foster and Malik [2002]
found that the shear span-to-depth ratio factor is a significant factor affecting the

87
efficiency factor and is more dominant than the influence of concrete strength.
.
Fig. (4.10) Ratio of actual-to-calculated shear strength versus shear span-to-depth ratio
for specimens with web reinforcement.
Fig. (4.11) Ratio of actual-to-calculated shear strength versus shear span-to-depth ratio
for specimens without web reinforcement.
βs =0.763 -0.126 a/d ≤0.7
Original βs
Modified βs 0.0
0.5
1.0
1.5
2.0
2.5
3.0
0.0 0.5 1.0 1.5 2.0 2.5 3.0
Eff
eci
ncy
fac
tor
a/d Shear span- dept ratio
Original βs
βs =0.6 -0.3 a/d ≥0.3
Modified βs
0.0
0.5
1.0
1.5
2.0
2.5
0.0 0.5 1.0 1.5 2.0 2.5 3.0 3.5
Effe
cin
cy f
acto
r
a/d Shear span- dept ratio

88
Figure (4.10) shows the plot of efficiency factor against a/d for all the specimens that
had web reinforcement and satisfied the provisions of of ACI 318-08 [2008] and failed in
a shear compression (diagonal splitting or strut crushing failure). The efficiency factor βs
for a bottle shape strut that satisfies Eq (2.1) can be determined as function of the a/d
according to the following equation (Eq. 4.2):
βs = 0.763 - 0.126(a/d) ≤ 7 (4.2)
Figure (4.11) shows the plot of the efficiency factor against a/d for all the specimens
that had no web reinforcement or did not satisfy Eq. (2.1) and failed in a shear
compression (diagonal splitting or strut crushing failure). The efficiency factor βs for a
bottle shape strut which does not satisfy Eq. (2.1) can be modified from 0.6 to be also
calculated as function of the a/d according to the following equation:
βs = 0.6 - 0.3(a/d) 0.3 (4.3)
Fig (4.12) shows the comparison of the capacity of the beams obtained from the tests
and that calculated using original and modified ACI STM models bottle shaped struts. As
can be observed from Figure 4.10, the capacity estimated by using the modified model is
slightly improved as compared to the original model. The modified model
underestimates the capacity of 100% of the samples with a/d ratio less than one. But for
the specimens with a/d ranging between 1 and 2, the modified model underestimates the
capacity of only 94.25% of the samples which is higher than the results obtained by using
the original model. When the a/d is less than 2, the modified model yields conservative
estimate of the capacity for 96.44% samples which is 8.18% higher than that obtained
using the original model.

89
Fig. (4.12) The percentage of samples having Vcalc/Vexp ≤1 considering a/d ratio
Considering all specimens taken together, the original model predicts the capacity of
only 78.93% of samples conservatively, while the modified model yields conservative
estimate of the capacity for 96.83% of the samples, highlighting its improvement. Based
on the results provided in Figure (4.12), it can be concluded that the suggested
modification in the efficiency factor as a function of a/d provides a more conservative
estimate of the capacity of a deep beam when ACI bottle shaped strut is considered. The
prediction of the failure modes and locations using the original ACI bottle shaped struts
and the modified model are shown in Fig. (4.13). The modified procedure with the bottle
shaped struts provide a better prediction of the failure mode than the original model when
the most common mode of failure (i.e., strut crushing) occurs. The modified STM
predicts the failure by strut crushing 13.42% more than the original STM (86.19%).
However, for the other types of failure, the modified procedure does not perform as well,
and in these cases the prediction is worse than that by the original model.
100% 94.19% 96.44% 96.83%
97.25%
82.56% 88.26%
78.93%
0 10 20 30 40 50 60 70 80 90
100
a/d <=1 1<a/d <=2 a/d <=2 all
The
Pe
rce
nta
ge o
f Sa
mp
les
hav
ing
V
calc/V
exp ≤
1
a/d Shear-span to depth ratio
ACI Bottled shape modefid
ACI Bottled shape

90
Fig. (4.13) The prediction of failure modes by using the ACI STM original and modified
model
4.10. Summary:
The effectiveness of the Strut and Tie Model of reinforced concrete deep beams as
provided in the design codes from Canada (CSA A23.3-04 [2004]), USA (ACI 318-08
[2008]) and Europe (EN 1992-1-1-2004E [2004]) has been evaluated based on the
experimental results of 397 test samples compiled from the literature. The influence of
certain variables on the codes’ ability to predict the ultimate strength of deep beams is
also studied. The investigation confirms that the Strut and Tie model is in general an
appropriate method for the design and evaluation of beams with shear span-to-depth ratio
less than or equal to two. It has been found that the code provisions are more accurate for
beams with web reinforcement. The CSA code provisions appear to be very robust in
estimating the capacity of deep beams, as compared to the other two codes. However, the
provisions of all the selected codes do not have the ability to predict the failure mode and
location accurately and reliably. The STM procedure in ACI code in bottle shaped strut is
found to be more suitable than the uniform strut in predicting the ultimate capacity.
86.19%
32.14%
18.60%
72.77%
49.06%
27.27%
0
10
20
30
40
50
60
70
80
90
100
Failure of Strut
Crushing
Failure at Bearing
plate
Tension failure
The
Pe
rce
nta
ge o
f Sa
mp
les
hav
ing
V
calc
/Ve
xp ≤
1
ACI Bottled shape modefid
ACI Bottled shape

91
Based on the database of the experimental results, a modification has been suggested in
the way the efficiency factor is calculated for the ACI bottle shaped struts, as function of
shear span-to-depth ratio. With the suggested modification to the efficiency factor of
bottle shaped struts a conservative estimate of the capacity of reinforced concrete deep
beams can be obtained. The modified procedure is found to provide an improved
prediction of the most common failure mode (i.e. strut crushing) as compared to the
original model. In contrast, the modified procedure does not provide an accurate
prediction for the other two failure modes. However, since the other two failure modes
are less common than the strut crushing mode of failure, the proposed modification
represents an improvement on the existing procedure for determining the failure modes.

92
Chapter 5: Results of the Experimental Study
5.1. Introduction:
In this chapter the experimental results are presented for nine FRP reinforced concrete
deep beams described in chapter three. The load-deflection and the load-strain response
for all the strain gages and LVDTs are provided in graphs presented in this chapter for
each beam tested individually. The crack patterns of each experimental specimen were
charted in this chapter. Also, the loads measured at different stages of the experimental
tests (e.g., first flexural crack, first diagonal crack and failure) are presented.
Table (5.1) Summary of all experimental results
Specimen No f`c
( MPa) a/d
Vcr
( kN)
Vmax
( kN)
Δ
( mm)
Mode of Failure
Visual Observation Measured Data
Initial
Flexural
Crackin
g
Initial
Strut
Crackin
g
Initial
Flexural
Crackin
g
Initial
Strut
Crackin
g
A1/100 49.8 1 105.85 205.85 100.50 192.05
560.25 8.22 Shear
Compression
A1/75 52.2 1 125.35 220.85 108.35 172.70
552.39 8.43 Shear
Compression
A1/50 52.5 1 115.85 212.85 112.80 193.50 493.69 10.33 Diagonal splitting
A1/00 52.7 1 109.85 172.35 105.10 175.70 416.89 8.91 Diagonal splitting
B1.5/100 51.8 1.5 67.48 117.48 52.96 77.21
322.38 11.93 Shear
Compression
C2/100 50.8 2 39.86 71.86 27.72 60.62
125.91 12.04 Shear
Compression
C2/75 51.0 2 39.36 74.36 22.07 50.32 98.68 8.12 Strut Crushing
C2/50 51.3 2 36.11 66.86 27.12 69.27 102.71 9.12 Strut Crushing
C2/00 51.3 2 28.36 54.36 25.42 56.22 93.47 10.36 Strut Crushing

93
5.2. Presentation of Test Results:
The Results for each of the individual specimens with crack patterns are provided in
section 3 to 12 of chapter four. The result summaries of the tested FRP reinforced
concrete deep beams are presented in Table (5.1). Table (5.1) contains the material
properties, modes of failure; the shear strength at the initial crack formation (flexural and
diagonal). Vcr; and the ultimate shear strength, Vmax of all the specimens.
5.3. Results for the specimens in Group A:
The beams in this group had a/d ratio of 1, and except for the amount of web
reinforcement, all four specimens in this group are identical. The amount of web
reinforcement, ρw provided in A1/00, A1/50, A1/75 and A1/100 is 0, 44, 68, and 100%,
respectively; where, 100% indicates the minimum web reinforcements required for crack
control.
5.3.1. Response of Beam A1/00:
Crack development and failure mode in A1/00:
The formation of the first flexural crack at mid-span appears at 213 kN of loading. The
formation of new flexural cracks began to appear and lengthened toward the loading plate
as the load increased. Initial diagonal cracks occurred after a load level of 340 kN. The
initial diagonal cracks formed approximately at the interior edge of the support
propagating toward the loading plate and to a distance lower than the mid height of the
specimen. A new diagonal cracks formed in the general direction between supports and
load point on the mid-depth of the beam. By increasing the load, more flexural cracks and
diagonal cracks were developed.

94
Fig. (5.1) The propagation of the crack patterns in the beam A1/00 at four different
loading stages
578578
790
705
578578
705
340
640340
640 442
442
790
640
380
265 302
213
640302
302213
340
640
213790
340265640
806
640
340
265
419
213
705
340442
640
640
578
705
380640 640
302380
265
Fig. (5.2) Crack pattern of specimen A1/00

95
When the load reached 827.1 kN, the beam failed suddenly due to the splitting of the
concrete strut (Diagonal splitting failure). The failure occurred at the middle-depth of the
beam parallel to the strut. Since there was no web reinforcement in this beam, this type of
failure was expected. Figure (5.1) shows the pictures of the propagation of crack patterns
for beam A1/00 at four different loading stages, while, Figure (5.2) illustrates the crack
patterns at failure with the load level when each crack was first observed. The cracks that
caused the failure are marked in bold lines.
Load –Deflection response of A1/00:
The deflection reading was taken at each load increment. When the maximum load
was reached, the deflections at the mid span were 8.9 mm and 9.9 mm recorded from the
LVDTs placed on for both sides of the beam. After reaching Pmax and the occurrence of
failure, the load started to drop with a decrease in the deflection. The deflections at the
mid span were 8.2mm and 8.8 mm as recorded on both sides. The load versus mid-span
deflection curves of specimen A1/00 is shown in Figure (5.3).
Fig. (5.3) Deflection at mid-span of specimen A1/00
LVDT1 LVDT2
0
200
400
600
800
1000
1200
0 2 4 6 8 10 12
Tota
l Lo
ad (
kN)
Deflection (mm)

96
Load –Strain response of the main reinforcements in A1/00:
The strains located on the middle of the upper and the lower main GFRP longitudinal
reinforcement for loading stages is shown in Figure (5.4). At a load level of 196.8 kN, the
tensile strains began to increase as loading was increased. This level of loads
approximately corresponds to the formation of the initial flexural crack as observed from
the experimental test. Figure (5.5) shows the strains in the extension edge of the bottom
FRP rebars beyond the supporting plate (the nodal zone). From the Figure (5.5) it can be
observed that the strain in the rebars in the end node region was within 19.1%, which is
much lower than the ultimate strain of GFRP rebar as specified in the manufacturer’s data
sheet, indicating that the anchorage of the rebar was satisfactory.
Fig. (5.4) Strains in the middle of the main tension GFRP reinforcement of specimen
A1/00
0
200
400
600
800
1000
-0.005 0 0.005 0.01 0.015 0.02
Load
(kN
)
Strain ε
ML1
ML2
ML3

97
Fig. (5.5) Strains in the end of the main tension GFRP reinforcement of specimen A1/00
The action of the compression zone (node) formed at the supporting plate confirmed
that the rebar were subjected to lateral pressure and higher bond stresses developed. The
strain-load response at a top longitudinal GFRP rebar is shown in Figure (5.6), and it
indicates that the strain in a top rebar is very small and has reached only 0.9% of the
ultimate strain of GFRP rebar. Also the negative and small value of the strain indicates
that the zone between the loading plate and the action of the two loading compression
strut is exposed to negligible stress.
Fig. (5.6) Strains in the middle of the main top GFRP reinforcement of specimen A1/00
0
200
400
600
800
1000
-0.005 0 0.005 0.01 0.015 0.02
Load
(kN
)
Strain ε
EL4
EL5
0
200
400
600
800
1000
-0.005 0 0.005 0.01 0.015 0.02
Load
(kN
)
Strain ε
MT6

98
5.3.2. Response of Beam A1/50:
Crack development and failure mode in A1/50:
The first flexural crack at mid-span appeared at 225 kN of loading. The new flexural
cracks began to appear and lengthened toward the loading plate as the load increased.
The propagation rate of flexural cracks in the specimen A1/50 is much lower than that in
case of the previous specimen, A1/00. The initial diagonal cracks occurred after 419 kN
load was applied. The Initial diagonal cracks formed approximately at the interior edge of
the support plate and propagated towards the loading plate to a distance lower than the
mid height of the specimen. By increasing the load, more flexural cracks and diagonal
cracks developed and the existing ones widened or lengthened toward the compression
face of the beams. The formation of new cracks eventually stopped and the existing ones
widened, particularly after reaching 65% of Pmax. A sudden thunderous sound was heard
at 75% of Pmax, indicating a sudden release of energy.
When the load reached the maximum level, 980.68 kN, the beam failed in the same
manner as in the case of the previous specimen by splitting of the diagonal strut
(Diagonal splitting failure). The failure took place at the middle-depth of the beam
parallel to the strut between the end of the loading plate and the support. Figure (5.7)
shows the pictures of the crack patterns for beam A1/50 at four different loading stages,
while Figure (5.8) illustrates the crack patterns at failure with the load level when each
crack was first observed. The cracks that caused the failure are marked in bold lines.

99
Fig. (5.7) The propagation of the crack patterns in the beam A1/50 at four different
loading stages
625
419352285
361
635
420
507361
258
225
392
285325
325
361
395
415
419537623
460
361
392
Fig. (5.8) Crack pattern of specimen A1/50

100
Load –Deflection response of A1/50:
The deflection reading was taken at each load increment. When the maximum load
was reached, the deflections at mid span were 10.3 mm and 11.6 mm at both sides. After
reaching Pmax, the load started to drop for increased deflection until failure occurred. The
maximum deflections at mid span were 10.85 mm and 11.68 mm on each side. The load
versus mid-span deflection curves of specimen A1/50 is plotted in Figure (5.9).
Fig. (5.9) Deflection at mid-span of specimen A1/50
Load –Strain response of the main and web reinforcements in A1/50:
The mid-span strains ML 1, 2 & 3 in main GFRP longitudinal reinforcement at the
upper and the lower faces of the beam A1/50 at loading stages are shown in Figure
(5.10). At the load of 212.2 kN, the tensile strains began to increase as loading was
increased. This load level is in approximate agreement with initial flexural crack that was
observed from the experimental test. Figure (5.11) shows the response of strains at the
extension edge of the rebar beyond the supporting plate (the nodal zone).
0
200
400
600
800
1000
1200
0 2 4 6 8 10 12 14
Tota
l Lo
ad (
kN)
Deflection (mm)

101
Fig. (5.10) Strain in the middle of the main tension GFRP reinforcement of specimen
A1/50
Fig. (5.11) Strain in the end of the main tension GFRP reinforcement of specimen A1/50
Fig. (5.12) Strain in the middle of the main top GFRP reinforcement of specimen A1/50
0
200
400
600
800
1000
1200
-0.005 0 0.005 0.01 0.015 0.02
Load
(kN
)
Strain ε
ML1
ML2
ML3
0
200
400
600
800
1000
1200
-0.005 0 0.005 0.01 0.015 0.02
Load
(kN
)
Strain ε
EL4
EL5
0
200
400
600
800
1000
1200
-0.005 0 0.005 0.01 0.015 0.02
Load
(kN
)
Strain ε
MT6

102
From the Figure (5.11) can be observed that only 30.2% of the ultimate strain of GFRP
rebar has been reached, indicating that the anchorage of the rebar was satisfactory. The
strain-load response of the longitudinal GFRP reinforcement located at the top is
illustrated in Figure (5.12). Only 6.9% of the ultimate strain of GFRP rebar in the top
rebars has been reached. The strains in the vertical and the horizontal GFRP web
reinforcement on both sides of the beam at different loading stages are shown in Figures
(5.13) and (5.14). After reaching a load level of 373.6 kN, the tensile strain in the region
of the assumed direction of the main struts began to increase as loading was further
increased.
Fig. (5.13) Strain in the vertical and horizontal GFRP web reinforcement left side of
specimen A1/50
0
200
400
600
800
1000
1200
-0.005 0 0.005 0.01 0.015 0.02
Load
(kN
)
Strain ε
VL11
VL12
HL13
HL14

103
Fig. (5.14) Strain in the vertical and horizontal GFRP web reinforcement right side of
specimen A1/50
This level of load (i.e., 373.6 kN) is less than the initial diagonal crack load that was
observed from the experimental test. The formation of the rebars of web reinforcement
whether horizontally or vertically in the left side were similar to those in the right side.
As can be seen from the two figures, the FRP web reinforcement on the left side
indicated higher stress than those on the right side because of the different support
conditions (i.e., hinge at the left end and roller on the right end). From Figure (5.13), it
can be observed that the strain in the GFRP web reinforcements reached about 70.4% of
the ultimate tensile strain, εFu because of the lower quantity of web reinforcements.
5.3.3. Response of Beam A1/75:
Crack development and failure mode in A1/75:
The formation of the first flexural crack at mid-span appears at 244 kN of loading. The
new flexural cracks began to appear and lengthen toward the loading plate as the load
increased. The propagation rate of flexural cracks in the specimen A1/75 is much lower
0
200
400
600
800
1000
1200
-0.005 0 0.005 0.01 0.015 0.02
Load
(kN
)
Strain ε
VR7
VR8
HR9
HR10

104
comparing to the two previous specimens. Initial diagonal cracks occurred after 435 kN
of load was applied. The initial diagonal cracks formed approximately at the interior edge
of the support and propagated towards the loading plate and to a distance less than the
mid height of the specimen. On further increase in the load, the formation of the new
flexural cracks stopped and the existing ones widened or lengthened toward the
compression face of the beam. New diagonal cracks formed and existing ones propagated
in the direction towards the loading plate up to a load of approximately 505 kN.
Fig. (5.15) The propagation of the crack patterns in the beam A1/75 at four different
loading stages

105
350
330
280280
330435
330
244
280480
435350
435
505
350
330
280280
330435
330
244
280480
435350
435
505
435350
330
280280
330435
330
244
280480
435350
435
505
350
330
280280
330435
330
244
280480
435350
435
505
Fig. (5.16) Crack pattern of specimen A1/75
In contrast to the other two previous beams, Specimen A1/75 failed in shear
compression failure. When the ultimate load of 1098.1 kN was reached, the concrete at
the end of one of the main struts at the loading plate failed by crushing and was
accompanied by thunderous sound. The shear compression failure occurred near the
loading which is indicated by cross-hatchings in the Figures (5.16). Figure (5.15) shows
pictures of the propagation of crack patterns for beam A1/75 at four different loading
stages, while Figure (5.16) illustrates the crack patterns at failure with the load level
when each crack was first observed. The cracks that caused the failure are marked in bold
lines.
Load –Deflection response of A1/75:
The deflection reading was taken at each load increment. When the maximum load was
reached, the deflections at mid span were 8.4 mm and 8.6 mm for both sides. After
reaching Pmax, the load started to drop for increased deflection, until failure occurred. The

106
maximum deflections at mid span were 9.9 mm and 10 mm at the two sides. The load
versus mid-span deflection curves of specimen A1/75 is plotted in Figure (5.17).
Fig. (5.17) Deflection at mid-span of specimen A1/75
Load –Strain response of the main and web reinforcements in A1/75:
The mid-span strains in the main GFRP longitudinal reinforcements at the upper and
the lower faces of the beam at different loading stages are shown in Figure (5.18). At the
load of 203.3 kN, the tensile strains began to increase as loading was further increased.
This load is less than the load corresponding to the initial flexural crack that appeared in
the experimental test. The initial flexural crack appeared to be longer than in the previous
two samples that had no or lower amount of web reinforcement. For better accuracy, the
initial flexural cracking load and the initial diagonal cracking load recorded from the
strain gauges have been used for analyzing all the results of this study. However, in
practise, due to economic considerations, most of the structural elements are evaluated
and investigated visually by observation of the appearance of the cracks.
LVDT1 LVDT2
0
200
400
600
800
1000
1200
0 2 4 6 8 10 12
Tota
l Lo
ad (
kN)
Deflection (mm)

107
Figure (5.19) shows the strain response of a main rebar at the extension edge of the
rebar beyond the supporting plate (the nodal zone). It can be observed from Figure (5.19)
that the strain in the part of the GFRP main rebar reached only 20.5% of the ultimate
strain, which indicates that the anchorage of the rebar was adequate. The strain-load
response of the top longitudinal GFRP reinforcement is shown in Figure (5.20).
Fig. (5.18) Strain in the middle of the main tension GFRP reinforcement of specimen
A1/75
Fig. (5.19) Strain in the end of the main tension GFRP reinforcement of specimen A1/75
0
200
400
600
800
1000
1200
-0.005 0 0.005 0.01 0.015 0.02
Load
(kN
)
Strain ε
ML1
ML2
ML3
0
200
400
600
800
1000
1200
-0.005 0 0.005 0.01 0.015 0.02
Load
(kN
)
Strain ε
EL4
EL5

108
Fig. (5.20) Strain in the middle of the main top GFRP reinforcement of specimen A1/75
The negative strains formed in the rebar at the loading plate in the nodal zone (node)
confirmed that this zone was subjected to lateral pressure from the loading plate and the
action of the two compression struts. Nevertheless the failure occurred in this zone, but
the rebar was still not deformed or damaged yet and only 9.2% of the ultimate strain of
GFRP rebar has been reached.
The strains in the vertical and the horizontal GFRP web reinforcement located on the
both sides of the beam at different loading stages are shown in Figures (5.21) and (5.22).
At the load of 332.4 kN, the tensile strains in the web reinforcement in the left end of the
beam at the assumed direction of main struts began to increase as loading was increased.
This load level is in approximate agreement with initial diagonal crack that was observed
from the experimental test near the left end of the beam. While on the right end, the
increase in the strain in the web reinforcement started at 472 kN which approximately
corresponds to the appearance of the diagonal crack on that side as observed in the
experimental test. It can be observed from Figure (5.21) that the strain in the vertical and
0
200
400
600
800
1000
1200
-0.005 0 0.005 0.01 0.015 0.02
Load
(kN
)
Strain ε
MT6

109
horizontal GFRP reinforcements reached only 52.9% and 49.5% of the ultimate strain,
respectively.
Fig. (5.21) Strain in the vertical and horizontal GFRP web reinforcement right side of
specimen A1/75
Fig. (5.22) Strain in the vertical and horizontal GFRP web reinforcement left side of
specimen A1/75
Before the failure occurred, some of the strain gauges stopped working as their lead
wires intersected with the cracks and got damaged or cut. Nevertheless, the big cracks
0
200
400
600
800
1000
1200
-0.005 0 0.005 0.01 0.015 0.02
Load
(kN
)
Strain ε
VR7
VR8
VR9
HR11
0
200
400
600
800
1000
1200
-0.005 0 0.005 0.01 0.015 0.02
Load
(kN
)
Strain ε
VL12
VL13
VL14
HL15
HL16

110
occurred in the strut and intersected with the web reinforcements, which did not deform
much or get damaged as showed in Figure (5.23).
Fig. (5.23) The crack intersects the web reinforcement in specimen A1/75
5.3.4. Response of Beam A1/100:
General response of A1/100:
The formation of the first flexural crack at mid-span was at 205 kN of loading. The
new flexural cracks began to appear and lengthened toward the loading plate as the load
increased. The formation of new flexural cracks eventually stopped and existing ones
became wider, particularly after reaching 360 kN. Initial Diagonal cracks occurred after
405 kN of load was applied. New diagonal cracks formed and existing ones propagated in
the direction towards the loading plate up to a load of approximately 800 kN. The beam
failed in the same manner as in the case of the previous specimen, A1/75 by shear
compression failure.

111
The shear compression failure (node failure) occurred near the loading which is
indicated by cross-hatchings in the Figures (5.25). When the load reached the maximum
level, 1113.8 kN, the concrete at the loading plate zone crushed. Figure (5.24) shows
pictures of the propagation of crack patterns for beam A1/100 at four different loading
stages, while Figure (5.25) illustrates the crack patterns at failure with the load level
when each crack was first observed.
Fig. (5.24) The propagation of the crack patterns in A1/100 at different levels of loading
800
405320
360320
205
255
360 485
360320
360
460
225360
320
320
800
460
Fig. (5.25) Crack pattern of specimen A1/100

112
Load –Deflection response of A1/100:
The deflection reading was taken at each load increment. When the maximum load was
reached, the deflections at mid span were 8.2 mm and 7.9 mm for both sides. After
reaching Pmax, the load started to drop for increased deflection, until failure occurred. The
maximum deflections at mid span were 11.1 mm and 10.7 mm at the two sides. The load
versus mid-span deflection curves of specimen A1/100 is plotted in Figure (5.26).
Fig. (5.26) Deflection at the mid-span of specimen A1/100
Load –Strain response of the main and web reinforcements in A1/100:
The mid-span strains in the main GFRP longitudinal reinforcement at the upper and
the lower faces of the beam at different loading stages are shown in Figure (5.27). At the
load of 187.6 kN, the tensile strains began to increase as loading was further increased.
This load is less than the load corresponding to the initial flexural crack that was visually
detected in the experimental test. However, strain gauges picked up the formation of the
initial micro-cracks much earlier that the cracks became visually detectable. Thus, the
variation in the strain gage readings indicates the initiation of a flexural crack more
reliably.
LVDT1 LDVT2
0
200
400
600
800
1000
1200
0 2 4 6 8 10 12
Tota
l Lo
ad k
N)
Deflection (mm)

113
Fig. (5.27) Strain in the middle of the main tension GFRP reinforcement of specimen
A1/100
Figure (5.28) shows the strain response of a main rebar at the extension edge of the
rebar beyond the supporting plate (the nodal zone). It can be observed from Figure (5.28)
that the strain in the end of the GFRP main rebar reached only 15.16% of the ultimate
strain, which indicates that the anchorage of the rebar was adequate. The strain-load
response of the top longitudinal GFRP reinforcement is shown in Figure (5.29). The
negative strains formed in the rebar at the loading plate in the nodal zone (node)
confirmed that this zone was subjected to lateral pressure from the loading plate and the
action of the two compression struts. Nevertheless the failure occurred in this zone, but
the rebar was not found to be deformed yet and only 15.5% of the ultimate strain of
GFRP rebar was reached.
0
200
400
600
800
1000
1200
-0.005 0 0.005 0.01 0.015 0.02 Lo
ad (
kN)
Strain ε
ML1
ML2
ML3

114
Fig. (5.28) Strain in the end of the main tension GFRP reinforcement of specimen A1/100
Fig. (5.29) Strain in the middle of the main top GFRP reinforcement of specimen A1/100
The strains in the vertical and the horizontal GFRP web reinforcement located on the
both sides of the beam at different loading stages are shown in Figures (5.30) and (5.31).
At the load of 370.7 kN, the tensile strains in the web reinforcements in the left and right
end of the beam at the assumed direction of main struts began to increase as loading was
increased. This load level was less than the load corresponding to the initial diagonal
crack that was observed from the experimental test near the left end of the beam. This
variation of the results was due to the same reason that was mentioned previously in the
0
200
400
600
800
1000
1200
-0.005 0 0.005 0.01 0.015 0.02
Load
(kN
)
Strain ε
EL4
0
200
400
600
800
1000
1200
-0.005 0 0.005 0.01 0.015 0.02
Load
(kN
)
Strain ε
MT6

115
initial flexural cracks. It can be observed from Figure (5.30) that the strain in the vertical
and horizontal GFRP reinforcement reached only 26.14% and 14.5% of the ultimate
strain, respectively.
Fig. (5.30) Strain in the vertical and horizontal GFRP web reinforcement right side of
specimen A1/100
Fig. (5.31) Strain in the vertical and horizontal GFRP web reinforcement left side of
specimen A1/100
0
200
400
600
800
1000
1200
-0.005 0 0.005 0.01 0.015 0.02
Load
(kN
)
Strain ε
VR7
VR8
VR9
VR10
HR11
HR12
0
200
400
600
800
1000
1200
-0.005 0 0.005 0.01 0.015 0.02
Load
(kN
)
Strain ε
VL13
VL14
VL15
VL16
HL18

116
As can be seen from the results, it is clear that the beam with 100% of web reinforcement
A1/100 exhibited quite similar behaviour as of A1/75, but had a slightly higher
magnitude of the failure load than that of A1/75 specimen.
Comparison of beam performances within group A:
In the early stages of loading approximately at 24, 22, 19 and 17% of the ultimate
load for four specimens: A1/00, A1/50 A1/75 and A1/100, respectively, similar
characteristics of crack patterns were observed. Flexural cracks were initiated vertically
in the region of pure bending between the two supports where the shear stress is zero.
Additional flexural cracks began to appear in the mid-span of the beam and lengthened
toward the loading plate as the load increased. After reaching approximately 55, 50, and
44% of the ultimate load in specimens A1/50 A1/75 and A1/100, respectively, the
flexural cracks were stabilized, and stopped propagating. While the propagation of
flexure cracks in the beam A1/00 continued until they were very close to the failure load.
For all beams, diagonal cracking occurred after the flexural cracking.
The first diagonal crack appeared between the loading point and support at 41, 38, 30
and 33% of the maximum loading for four specimens: A1/00, A1/50 A1/75 and A1/100,
respectively. Because of the dominance of the shear stresses, the cracks in the region of
the shear span were inclined (diagonal) and propagated toward the loading points. As the
load increased at approximately 50 to70% of Pmax, the formation of new diagonal cracks
eventually stopped and existing ones widened until failure occurred. In contrast, the
propagation of diagonal cracks continued in beam A1/00 until they were very close to the
failure load.

117
In general, the crack patterns of the four beams within group A at failure are quite
similar; however, the beams A1/00 and A1/50 were more extensively cracked than the
other two beams with higher web reinforcement. The failure mode of all four beams in
this group was brittle. Two types of brittle failure (shear compression and diagonal splitting
failure) were observed. The beams with less or without web reinforcement showed sudden
failure without any caution and failed with diagonal-splitting failure. In beams with web
reinforcement of 75% and 100% failure mode was shear compression failure manifested
by crushing of concrete at the end of one of the main struts and was accompanied by a
thunderous sound. The above observation confirms that sufficient web reinforcement had
helped avoiding the sudden shear failure the beams in these cases. Table (5.2) shows
comparison between the applied loads at different stages in the four beams. The results
of beams in group A indicated that an increase in amount of web reinforcement resulted
in an increase in the capacity up to 26%.
Table (5.2) The applied loads at different stages of the four beams in group A.
Specimens
Initial Flexure crack Initial Diagonal crack Failure Load
(kN) Occurred at
% of Pmax
Continued up to
% of Pmax
Occurred at
% of Pmax
Continued up to
% of Pmax
A1/00 23.7% Failure 41.1% Failure 827.1
A1/50 21.6% 54.8% 38.1% 64.7% 980.7
A1/75 18.48% 39.6% 30.0% 50.1% 1098.1
A1/100 17.1% 43.8% 33.3% 71.8% 1113.8
The load versus mid-span deflection curves of the all specimens beams in Group A,
are shown in Fig. (5.32). As can be seen from these curves, the failure loads (Pmax) were
1113.8, 1098.1, 980.7 and 827.1 kN for beams A1/100, A1/75, A1/50 and A1/00,

118
respectively. After reaching the failure loads (Pmax) in most of the specimens the load
started to drop. When the maximum load was reached, the deflections at mid span were
8.22, 8.43, 10.33and 8.91 mm for beams A1/100, A1/75, A1/50 and A1/00, respectively.
In general, the mid-span deflection at the maximum load for beams with web
reinforcement is lower than that with less or without web reinforcement.
Fig.(5.32) Load- Deflection response for all beams in Group A
The serviceability limitations for deflection were determined by CSA standard A23.3
and expressed as fraction of the clear span. In this study, the applied loading
corresponding to the permissible deflection of l/360 and l/180 were analyzed and
compared. The deflection limit of l/360 was reached at percentage between 43 to 54% of
Pmax, while the second limit of l/180 was reached at larger percentage of Pmax from 78 to
90%. Table (5.3) compared between the deflection at maximum loads and at permissible
deflection limits of beams in group A.
0
200
400
600
800
1000
1200
0 2 4 6 8 10 12 14 16
Tota
l lo
ad (
kN)
Deflection (mm)
A1/00
A1/50
A1/75
A1/100

119
Table (5.3) The deflection at different stages of load for all beams in Group A.
Specimens
Δ at Pmax
at mid-span
( mm)
Load at permissible deflection
(kN)
% of Pmax
(kN)
l/360 l/180 l/360 l/180
A1/00 8.22 605.4 1002.46 54% 90%
A1/50 8.43 579.2 974.6 52% 88%
A1/75 10.33 584.1 842.3 59% 85%
A1/100 8.91 363.2 648.2 43% 78%
5.4. Response of the beam in Group B:
In Group B with a/d ratio of 1.5, only specimen, B1.5/100 was constructed with ρw
equal of 100%. The main focus of the present study was to cover the boundary cases of
the deep beam with a low a/d (i.e., Beams in Group A with a/d = 1) and high a/d (i.e.,
Beams in Group C with a/d = 2). Beam B1.5/100 serves to verify the behaviour of FRP-
RC beep beams with web reinforcements, with an intermediate value of a/d ratio.
Crack development and failure mode in B1.5/100:
The first flexural crack at mid-span appeared at 130 kN of loading. The new flexural
cracks began to appear and lengthened toward the loading plate as the load increased.
Initial Diagonal cracks occurred after 230 kN of load was applied. The Initial Diagonal
cracks formed approximately at the interior edge of the support, propagating toward the
loading plate, and to a distance less than the mid-height of the specimen. The formation
of new flexural cracks eventually stopped and existing ones become wider, particularly
after reaching 260 kN.

120
Fig. (5.33) The crack patterns in beam B1.5/100 at four different loading.
230 360
230230
205
190
205230
130
150
230220
260
205
230
170
150437
260
230
300360 430
Fig. (5.34) Crack pattern of specimen B1.5/100
A new diagonal cracks formed and existing ones propagated in the direction towards
the loading plate up to a load of approximately 430 kN. By increasing the load, a sudden
thunderous sound was heard at 82.2% of Pmax. When the ultimate load 639.8 kN was
reached, the concrete at the loading plate zone crushed (shear compression failure). At

121
the same time, the main concrete strut failed followed by several diagonal cracks.
Specimen B1.5/100 exhibited a similar pattern of failure as Specimen A1/75, but had a
slightly less magnitude of the failure load. Figure (5.33) shows pictures of the crack
patterns for beam B1.5/100 at four different loading stages, while Figure (5.34) illustrates
the crack patterns at failure with the load level when each crack was first observed. The
cracks that caused the failure are marked in bold lines in Figure (5.34).
Load –Deflection response of B1.5/100:
When the maximum load was reached, the deflections at mid span were 11.9 mm and
12.5 mm for both sides. After reaching Pmax, the load started to drop with increased
deflection, until failure occurred. The maximum deflections at mid span were 13.7 mm
and 14.5 mm at the two sides. The load versus mid-span deflection curves of specimen
B1.5/100 are plotted in Figure (5.35).
Fig. (5.35) Deflection at mid-span of specimen B1.5/100
LVDT1 LVDT2
0
100
200
300
400
500
600
700
0 2 4 6 8 10 12 14 16
Tota
l Lo
ad (
kN)
Deflection (mm)

122
Load –Strain response of the main and web reinforcements in B1.5/100:
The mid-span strains in the main GFRP longitudinal reinforcements at the upper and
the lower faces of the beam at different loading stages are shown in Figure (5.36). At the
load level of 96 kN, the tensile strains began to increase as loading was increased. Also it
can be noted from the figure that the average strain increased at a higher rate at the loads
of 96 to 171kN and the strain rate stabilized. The opening of the cracks occurred at that
level of loads which lead to the elongation in the rebar resulting in a higher strain rate.
Fig. (5.36) Strain in the middle of the main tension GFRP reinforcement of specimen
B1.5/100
Figure (5.37) shows the strain response of the rebar at the extension edge of beyond
the supporting plate (the nodal zone). From the Figure (5.37) it can be observed that the
strain in the GFRP rebars at this region reached only 46.7% of the ultimate strain,
indicating that the anchorage of the rebar was sufficient. The strain gauge installed on the
top longitudinal GFRP reinforcement did not work in this case.
0
100
200
300
400
500
600
700
-0.005 0 0.005 0.01 0.015 0.02
Load
(kN
)
Strain ε
ML1
ML2
ML3

123
Fig. (5.37) Strain in the end of the main tension GFRP reinforcement of specimen
B1.5/100
The strains in the vertical and the horizontal GFRP web reinforcements located on the
both sides of the beam for different loading stages are shown in Figures (5.38) and (5.39).
At the load of 144.5 kN, the tensile strain in gauge VR8 (Fig. 5.38) in a stirrup located
near the right support but crossing a main strut, began to increase as the loading was
increased. On the other hand, the strain gauge VR9, which is located on a stirrup left of
strain gage VR8 recorded the strain increase later at 205.7 kN. The diagonal crack in the
region appeared between the two load levels. The strain gage VR9 is located clearly
within the assumed direction of main strut. Therefore, the convergence between the
experimental observation and the reading of strain gage VR9 is consistent. From the
Figure (5.38) can be observed that the strain in the vertical GFRP reinforcement reached
only 66.82% of the ultimate strain, while in the horizontal web reinforcements, it reached
only 25.07% of εFu.
0
100
200
300
400
500
600
700
-0.005 0 0.005 0.01 0.015 0.02
Load
(kN
)
Strain ε
EL4
EL5

124
Fig. (5.38) Strain in the vertical and horizontal GFRP web reinforcement right side of
specimen B1.5/100
Fig. (5.39) Strain in the vertical and horizontal GFRP web reinforcement left side of
specimen B1.5/100
5.5. Response of Beams in Group C
The beams in this group had a/d ratio of 2, and except for the amount of web
reinforcement, all four specimens in this group are identical. The amount of web
reinforcements, ρw provided in C2/00, C2/50, C2/75 and C2/100 are 0, 38, 60, and 100 %,
respectively; where, 100% indicates the minimum web reinforcements required for crack
control.
0
100
200
300
400
500
600
700
-0.005 0 0.005 0.01 0.015 0.02
Load
(kN
)
Strain ε
VR7
VR8
VR9
VR10
HR11
HR12
0
100
200
300
400
500
600
700
-0.005 0 0.005 0.01 0.015 0.02
Load
(kN
)
Strain ε
VL13
VL14
VL15
VL16
HL17
HL18

125
5.5.1. Response of Beam C2/00:
Crack development and failure mode in C2/00:
The formation of the first flexural crack at the bottom of the mid-span appears at 30%
of maximum loading. The new flexural cracks began to appear and lengthened toward the
loading plate as the load increased. Initial Diagonal cracks occurred after approximately
53% of the maximum load was applied. The initial diagonal cracks formed close to the
interior edge of the support, propagating toward the loading plate to the mid-height of the
specimen. New diagonal cracks formed in the general direction between the supports and
the load point, at the mid-depth of the beam. The formation of new flexural cracks
eventually stopped after reaching 57.3% of Pmax.
Fig. (5.40) The crack patterns in beam C2/00 at three different loading.

126
10597
126
15097
105
65
55
97
85
10585
97
97
65
85
85
97150
15597
85
85
97126
Fig. (5.41) Crack pattern of specimen C2/00
By increasing the load, more diagonal cracks were developed in the directions parallel
to the axes of the strut. Developing a new diagonal cracks was stopped after reaching
84.6% of Pmax and the existing ones widened or lengthened until the failure occurred.
The beam failed by crushing of strut when the load reached maximum level of 183.2
kN. The failure occurred at the mid-depth of the beam, longitudinally between the end of
the loading plate and the beginning of a strut, following the formation of several diagonal
cracks. This type of failure (strut crushing failure) occurred since there was no web
reinforcement provided in the beam. Figure (5.40) shows the pictures of the crack
patterns for beam C2/00 at four different loading stages, while, Figure (5.41) illustrates
the crack patterns at failure with the loads at each crack marked when first observed. The
cracks that caused the failure are marked in bold lines in Figure (5-40).
Load –Deflection response of C2/00:
When the maximum load was reached, the deflections at mid span were 10.4 mm and
10.2 mm at the two sides. As can be seen from Figure (5.42), the maximum deflection

127
coincided with Pmax which is in contrast with specimens in group A. The load versus mid-
span deflection curves of specimen C2/00 are plotted in Figure (5.42).
Fig. (5.42) Deflection at mid-span of specimen C2/00
Load –Strain response of the main reinforcement in C2/00:
The mid-span strains in the upper and the lower main GFRP longitudinal
reinforcement at different loading stages are shown in Figure (5.43). At the load of 43.4
kN, the tensile strain began to increase as loading was increased. This load level is in
approximate agreement with initial flexural crack that was observed from the
experimental test. Figure (5.44) shows the strain response of a bottom rebars at the
extension edge beyond the supporting plate (the nodal zone). From Figure (5.44) it can be
observed that the strain of the rebar in that region reached 26.5% of the ultimate strain of
GFRP rebar, indicating that the anchorage of the rebar was satisfactory. The strain-load
response located at the top longitudinal GFRP reinforcement is shown in Figure (5.45).
LDVT2 LDVT1
0
50
100
150
200
250
0.00 2.00 4.00 6.00 8.00 10.00 12.00
Tota
l Lo
ad (
kN)
Deflection (mm)

128
Fig. (5.43) Strain in the middle of the main tension GFRP reinforcement of specimen
C2/00
Fig. (5.44) Strain in the end of the main tension GFRP reinforcement of specimen C2/00
0
20
40
60
80
100
120
140
160
180
200
-0.005 0 0.005 0.01 0.015 0.02
Load
(kN
)
Strain ε
ML1
ML2
ML3
0
50
100
150
200
-0.005 0 0.005 0.01 0.015 0.02
Load
(kN
)
Strain ε
EL4
EL5

129
Fig. (5.45) Strain in the middle of the main top GFRP reinforcement of specimen C2/00
5.5.2. Response of Beam C2/50:
General response of C2/50:
The crack pattern, load-deflection response, and the strain-load response of the beam
C2/50 are illustrated in Figures (5. 46, 47, 48, 49, 50 and 51). As can be seen from the
results, it is clear that the beam with 38 % of web reinforcement C2/50 exhibits relatively
similar behaviour and has higher loads than that observed from the previous beam C2/00.
The propagation rate of flexural cracks of this beam is higher than that observed in the
previous beam. Although beam C2/50 failed in the same manner as C2/00, the pre-failure
damage appears to be less severe than that in C2/00.
0
50
100
150
200
-0.02 -0.015 -0.01 -0.005 3E-17 0.005 0.01 0.015 0.02
Load
(kN
)
Strain ε
MT6

130
Fig. (5.46) The crack patterns in beam C2/50 at four different loading.
165
165180
145
145
125
125
12511511570
115
95
115125165
95
70
95
125
115
145
125125
125
125
125165130
195180
180180
195 145
130130
130
13095
145
145
Fig. (5.47) Crack pattern of specimen C2/50
Load –Deflection response of C2/50:
The deflection reading was taken at each load increment. When the maximum load
was reached, the deflections at mid span were 9.03 mm and 9.04 mm for both sides. After
reaching Pmax, the load started to drop for increased deflection, until failure occurred. The

131
maximum deflections at mid span were 10.5 mm and 10.4 mm at the two sides. The load
versus mid-span deflection curves of specimen A1/75 are plotted in Figure (5.48).
Fig. (5.48) Deflection at mid-span of specimen C2/50
Load –Strain response of the main and web reinforcements in C2/50:
The mid-span strains in the upper and the lower main GFRP longitudinal
reinforcement at different loading stages are shown in Figure (5.49). At the load of 46.79
kN, the tensile strain began to increase as loading was increased. This load level is less
than that corresponding to the initial flexural crack that was observed from the
experimental test. Figure (5.50) shows the strain response of a bottom rebars at the
extension edge beyond the supporting plate (the nodal zone). From Figure (5.50) it can be
observed that the strain of the rebar in that region reached 10% of the ultimate strain of
GFRP rebar, indicating that the anchorage of the rebar was satisfactory. The strain-load
response located at the top longitudinal GFRP reinforcement is shown in Figure (5.51).
LVDT1 LVDT2
0
50
100
150
200
250
0 2 4 6 8 10 12
Tota
l Lo
ad (
kN)
Deflection (mm)

132
Fig. (5.49) Strain in the middle of the main tension GFRP reinforcement of specimen
C2/50
Fig. (5.50) Strain in the end of the main tension GFRP reinforcement of specimen C2/50
0
50
100
150
200
250
-0.005 0 0.005 0.01 0.015 0.02 Lo
ad (
kN)
Strain ε
ML1
ML2
ML3
0
50
100
150
200
250
-0.005 0 0.005 0.01 0.015 0.02
Load
(kN
)
Strain ε
EL4
EL5

133
Fig. (5.51) Strain in the middle of the main top GFRP reinforcement of specimen C2/50
The strains in the vertical and horizontal GFRP web reinforcement on the both sides
of the beam at different loading stages are shown in Figures (5.52) and (5.53). At the load
of 131.1 kN, the tensile strains recorded by gauges VL7 and VL8 located in the region in
of the assumed direction of main struts began to increase as loading was increased. This
load approximately corresponds to the diagonal crack observed from the experimental
test. From the Figures (5.52) and (5.53) we can see that level of strain in the vertical
GFRP reinforcement was limited to 67% of the ultimate strain.
Fig. (5.52) Strain in the vertical GFRP web reinforcement left side of specimen C2/50
0
50
100
150
200
250
-0.005 0 0.005 0.01 0.015 0.02
Load
(kN
)
Strain ε
MT6
0
50
100
150
200
250
-0.005 0 0.005 0.01 0.015 0.02
Load
(kN
)
Strain ε
VR7
HR8

134
Fig. (5.53) Strain in the vertical GFRP web reinforcement right side of specimen C2/50
5.6. Response of Beam C2/75:
Crack development and failure mode in C2/75:
The first flexural crack at mid-span appeared at 80 kN of loading. New flexural cracks
began to appear and lengthened toward the loading plate as the load increased. The
propagation rate of flexural cracks in specimen C2/75 is much lower compared to the two
previous specimens. Initial diagonal cracks occurred after 115 kN of load was applied.
The initial diagonal cracks formed between the support and load point at the mid-depth of
the beam. The formation of new flexural cracks eventually stopped after reaching 67.1%
of Pmax.
By increasing the load, more diagonal cracks were developed in the directions
parallel to the axes of the strut. New diagonal cracks formed and existing ones
propagated in the directions parallel to the axes of the strut up to the failure. When the
ultimate load 193.6 kN was reached, the beam C2/75 failed by crushing of strut. Figure
(5.54) shows the pictures of the crack patterns for beam C2/75 at four different loading
0
50
100
150
200
250
-0.005 0 0.005 0.01 0.015 0.02
Load
(kN
)
Strain ε
VL9
VL10

135
stages, while Figure (5.55) illustrates the crack patterns at failure with the loads at each
crack marked when first observed. The cracks that caused the failure are marked in bold
lines in Figure (5.55).
Fig. (5.54) The propagation of the crack patterns in the beam C2/75 at four different
loading.
90 166155
14590
115
115100
80
100
90
130115
120
90130
192
192
100
130
Fig. (5.55) Crack pattern of specimen C2-75

136
Load –Deflection response of C2/75:
When the maximum load was reached, the deflections at mid span were 8.12 mm and
8.96 mm on both sides. After reaching Pmax, the load started to drop for increased
deflection, until failure occurred. The maximum deflections at mid span were 9.18 mm
and 10.3 mm at the two sides. The load versus mid-span deflection curves of specimen
C2/75 are plotted in Figure (5.56).
Fig. (5.56) Deflection at mid-span of specimen C2/75
Load –Strain response of the main and web reinforcements in C2/75:
The mid-span strains in the upper and the lower main GFRP longitudinal
reinforcement at different loading stages are shown in Figure (5.57). At the load of 36.71
kN, the tensile strains in these bars (gauges ML2 and ML3) began to increase as loading
was increased. While the tensile strain recorded by ML1 began to increase after applying
58.39 kN of load. These loads are less than that corresponding to the initial flexural crack
that was observed from the experimental test.
LVDT1 LVDT2
0
50
100
150
200
250
0 5 10 15
Tota
l Lo
ad (
kN)
Deflection (mm)

137
Fig. (5.57) Strain in the middle of the main tension GFRP reinforcement of specimen
C2/75
Fig. (5.58) Strain in the end of the main tension GFRP reinforcement of specimen
C2/75
Figure (5.58) shows the strain response of a tensile rebar at the extension edge beyond
the supporting plate (the nodal zone). From the results it can be observed that strain in the
GFRP rebar in this region reached up to 10.6% of the ultimate strain, indicating that the
anchorage of the rebar was satisfactory. The strain-load response of the top longitudinal
GFRP reinforcement is shown in Figure (5.59). The lateral pressure from the loading
0
50
100
150
200
250
-0.005 0 0.005 0.01 0.015 0.02 Lo
ad (
kN)
Strain ε
ML1
ML2
ML3
0
50
100
150
200
250
-0.005 0 0.005 0.01 0.015 0.02
Load
(kN
)
Strain ε
EL4
EL5

138
plate and the action of the two loading compression strut at the nodal zone (node) make
strain in the top rebar very small.
Fig. (5.59) Strain in the middle of the main top GFRP reinforcement of specimen C2/75
The strains in the vertical and the horizontal GFRP web reinforcement on both sides
of the beam at different loading stages are shown in Figures (5.60) and (5.61). At the load
of 80.3 and 93.2 kN, the tensile strains in the web reinforcement near the left and the
right support region and crossing the main struts in the assumed direction, began to
increase as the loading was increased.
Fig. (5.60) Strain in the vertical and horizontal GFRP web reinforcement right side of
specimen C2/75
0
50
100
150
200
250
-0.005 0 0.005 0.01 0.015 0.02
Load
(kN
)
Strain ε
MT6
0
50
100
150
200
250
-0.005 0 0.005 0.01 0.015 0.02
Load
(kN
)
Strain ε
VR7
VR8
VR9
HR10
HR11

139
Fig. (5.61) Strain in the vertical and horizontal GFRP web reinforcement left side of
specimen C2/75
These loads are less than that for the first diagonal crack as observed from the
experimental test. From the Figures (5.60) and (5.61) it can be observed that the strain in
the vertical and horizontal web reinforcement reached only 42.9% and 19.0% of the
ultimate strain of GFRP, respectively.
5.7. Response of Beam C2/100:
General response of C2/100:
The first flexural crack at mid-span appeared at 80 kN of loading. The new flexural
cracks began to appear and lengthened toward the loading plate as the load increased.
Initial diagonal cracks occurred after 140 kN of load was applied. The initial diagonal
cracks formed approximately at the interior edge of the support propagated towards the
loading plate. The propagation rate of flexural cracks in Specimen C2/100 was found to
be similar to that of Specimen C2/75, but much lower compared to the other two
specimens with less or without web reinforcement. On further increase in the load up to
74.6% of Pmax, both the formation of the new flexural cracks and the new diagonal cracks
0
50
100
150
200
250
-0.005 0 0.005 0.01 0.015 0.02 Lo
ad (
kN)
Strain ε
VL12
VL13
VL14
HL15
HL16

140
stopped and the existing ones widened up to the failure. Contrary to the other three
previous beams of group C, Specimen C2/100 failed in shear compression failure.
When the ultimate load of 248.1 kN was reached, the concrete at the end of one of the
main struts at the loading plate failed by crushing. Figure (5.62) shows pictures of the
propagation of crack patterns for beam C2/100 at four different loading stages. The shear
compression failure occurred near the loading plate which is indicated by cross-hatchings
in Figure (5.63). Figure (5.63) illustrates the crack patterns at failure with the loads at
each crack marked when first observed.
Fig. (5.62) The propagation of the crack patterns in the beam C2/100 at four different
loading.

141
80 100
100
115 240
165140
140
115
122
115
80
80
100185
122
115185
100
122
140
185
Fig. (5.63) Crack pattern of specimen C2/100
Load –Deflection response of C2/100:
When the maximum load was reached, the deflections at mid span were 12.04 mm and
12.23 mm on both sides. After reaching Pmax, the load started to drop for increased
deflection, until failure occurred. The maximum deflections at mid span were 14.31 mm
and 14.51 mm at the two sides. The load versus mid-span deflection curves of specimen
C2/75 are plotted in Figure (5.64).
Fig. (5.64) Deflection at mid-span of specimen C2/100
LVDT1 LDVT2
0
50
100
150
200
250
300
0 2 4 6 8 10 12 14 16
Tota
l Lo
ad (
kN)
Deflection (mm)

142
Load –Strain response of the main reinforcements in C2/100:
The mid-span strains in the upper and the lower GFRP longitudinal reinforcement at
different loading stages are shown in Figure (5.65). At the load of 48.0 kN, the tensile
strain began to increase as loading was increased. This load is less than that
corresponding to the first flexural crack as observed from the experimental test. Figure
(5.66) shows the strain response of a bottom rebars at the extension edge beyond the
supporting plate (the nodal zone). From Figure (5.66) it can be observed that the strain of
the rebar in that region reached 11.76% of the ultimate strain of GFRP rebar, indicating
that the anchorage of the rebar was satisfactory. The strain-load response for top
longitudinal GFRP reinforcement at the mid-span is shown in Figure (5.67). While the
failure occurred in this zone, the rebar was not found to be deformed yet, and only
19.83% of the ultimate strain of GFRP rebar has been reached.
Fig. (5.65) Strain in the middle of the main tension GFRP reinforcement of specimen
C2/100
0
50
100
150
200
250
300
-0.005 0 0.005 0.01 0.015 0.02
Load
(kN
)
Strain ε
ML1
ML2
ML3

143
Fig. (5.66) Strain in the end of the main tension GFRP reinforcement of specimen C2/100
Fig. (5.67) Strain in the middle of the main top GFRP reinforcement of specimen C2/100
The strains in the vertical and the horizontal GFRP web reinforcements on both sides
of the beam at different loading stages are shown in Figures (5.68) and (5.69). At the load
of 113.8 and 125.1 kN, the tensile strains in the web reinforcement near the left and the
right support regions and at the crossing the main struts in the assumed direction, began
to increase as the loading was increased. These loads were found to be less than that for
the first diagonal crack as observed from the experimental test. From Figures (5.68) and
(5.69) it can be observed that the strain in the vertical and horizontal web reinforcement
reached only 52.6% and 55.6% of the ultimate strain of GFRP, respectively.
0
50
100
150
200
250
300
-0.005 0 0.005 0.01 0.015 0.02
Load
(kN
)
Strain ε
EL4
EL5
0
50
100
150
200
250
300
-0.02 -0.01 0
Load
(kN
)
Strain ε
MT6
MT7
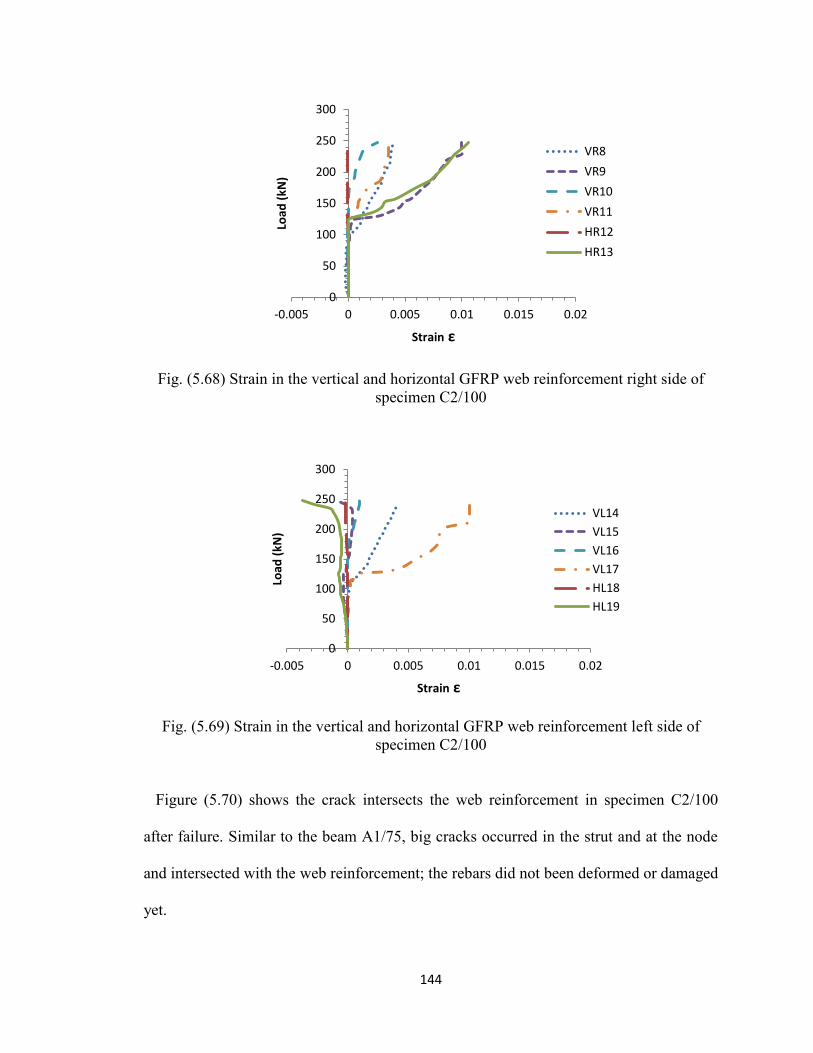
144
Fig. (5.68) Strain in the vertical and horizontal GFRP web reinforcement right side of
specimen C2/100
Fig. (5.69) Strain in the vertical and horizontal GFRP web reinforcement left side of
specimen C2/100
Figure (5.70) shows the crack intersects the web reinforcement in specimen C2/100
after failure. Similar to the beam A1/75, big cracks occurred in the strut and at the node
and intersected with the web reinforcement; the rebars did not been deformed or damaged
yet.
0
50
100
150
200
250
300
-0.005 0 0.005 0.01 0.015 0.02
Load
(kN
)
Strain ε
VR8
VR9
VR10
VR11
HR12
HR13
0
50
100
150
200
250
300
-0.005 0 0.005 0.01 0.015 0.02
Load
(kN
)
Strain ε
VL14
VL15
VL16
VL17
HL18
HL19

145
Fig. (5.70) The crack intersects the web reinforcement specimen C2/100
Comparison of beam performances within group C:
In the early stages of loading approximately at 24, 13, 30 and 19% of the ultimate
load for four specimens: C2/00, C2/50 C2/75 and C2/100, respectively, similar
characteristics of crack patterns were observed. Flexural cracks were initiated vertically
in the region of pure bending between the two supports where the shear stress is zero.
Additional flexural cracks began to appear in the mid-span of the beam and lengthened
toward the loading plate as the load increased. After reaching approximately 52, 64, 48
and 50% of the ultimate load in specimens C2/00, C2/50, C2/75 and C2/100,
respectively, the flexural cracks were stabilized, and stopped propagating.
The first diagonal crack between the loading point and support appeared at 57, 85, 67
and 75% of maximum loading for four specimens: C2/00, C2/50 C2/75 and C2/100,

146
respectively. Because of the dominance of the shear stresses, the cracks in the region of
the shear span were observed to be inclined and propagated toward the loading point.
After reaching approximately 62 and 75% of the ultimate load in specimens C2/00 and
C2/100, respectively, the diagonal cracks were stabilized, and stopped propagating.
While the propagation of flexure cracks in the beam C2/50 and C2/75 continued until
they were very close to the failure load. Generally, the failure crack patterns of the four
beams within group C were almost similar; however, Beams C2/00 and C2/50 were more
extensively cracked than the other two beams with higher web reinforcement.
The failure mode of all four beams in this group was brittle. Two types of brittle
failure (strut crushing and shear compression) were observed. The beams C2/00, C2/50,
and C2/75 failed by crushing of the strut since there were no sufficient web
reinforcements provided in the beams. On the other hand, the beam specimen with 100%
of web reinforcement failed in shear compression mode of failure.
Table (5.4) shows a comparison among the specimens in Group C at different stages
of the applied loads. It is noted that an increase in the amount of web reinforcement
resulted in an increase in the capacity up to 26%.
Table (5.4) The applied loads at different stages of the four beams in Group C.
Specimens
Initial Flexure crack Initial Digonal crack Failure Load
(kN) Occurred at
% of Pmax
Continued up
to % of Pmax
Occurred at
% of Pmax
Continued up
to % of Pmax
C2/00 23.70% 53.00% 57.3% 62% 183.2
C2/50 23.00% 65.00% 85.2% Failure 201.7
C2/75 30.20% 48.10% 67.1% Failure 193.6
C2/100 19.40% 50.40% 74.6% 74.6% 248.1

147
The load versus mid-span deflection curves of the all specimens in Group C are shown
in Fig. (5.71). As can be seen from these curves, the failure loads (Pmax) were 183.2,
201.7, 193.6and 248.1 kN for beams C2/00, C2/50, C2/75 and C2/100, respectively.
After reaching the failure loads (Pmax) in most of the specimens, the load started to drop.
When the maximum load was reached, the deflections at mid span were 10.36, 9.12, 8.12
and 12.04 mm for beams C2/00, C2/50, C2/75 and C2/100, respectively. In general, the
mid-span deflection at the maximum load for beams with web reinforcement was lower
than that with less or no web reinforcement.
Fig.(5.71) Load- Deflection response for specimens in Group C
The applied loading corresponding to the permissible deflection limits l/360 and l/180
were analyzed and compared. The deflection limit of l/360 was reached at percentage
between 53 to 68% of Pmax,, while the second limit of l/180 was reached at larger
percentage of Pmax from 76 to 97%. These results coincided with the results of the beams
in Group A. Table (5.5) shows the comparison of the deflection at maximum loads and at
permissible deflection limits for all beams in Group C.
0
50
100
150
200
250
300
350
400
0 2 4 6 8 10 12 14 16
Tota
l lo
ad (
kN)
Deflection (mm)
C2/00
C2/50
C2/75
C2/100

148
Table (5.5) The deflection at different stages of load for all beams in Group C.
Specimens
Δ at Pmax
at mid-span
( mm)
Load at permissible deflection
(kN)
% of Pmax
(kN)
l/360 l/180 l/360 l/180
C2/00 10.36 113.2 169.4 62% 93%
C2/50 9.12 130.7 179.5 65% 89%
C2/75 8.12 131.9 188.0 68% 97%
C2/100 12.04 130.3 187.6 53% 76%
5.8. Summary:
The beams exhibit three types of shear failure mode: shear-compression failure, diagonal-
splitting failure, and strut crushing failure. The failure mode of these three types is brittle
failure. For Group A specimens, Beams A1/00 and A1/50 failed with diagonal-splitting
failure. This failure was observed because there was insufficient web reinforcement to
resist the tensile stresses in cracked concrete. The concrete at the end of one of the main
struts of specimen A1/75 failed in a shear compression failure by crushing and was
accompanied by a thunderous sound. Beam A1/100, exhibits relatively similar failure
mode and accommodated higher loads than that observed from beam A1/75. In contrast
to the beams in Groups A, three beams in group C, C1/00, C1/50 and C1/75 failed by
strut crushing failure. While the beam C2/100 failed by crushing of the concrete at the
end of one of the main struts (shear compression failure). Although the beam with 100%
of web reinforcement C2/100 exhibited relatively similar crack propagation and had
higher loads than that observed from the beam C2/75, the beam C2/100 failed by
crushing of the concrete at the end of one of the main struts (shear compression failure).

149
Chapter 6: Effect of the Key Factors and Validation of the Design Provisions
6.1. Introduction:
A synthesis of the experimental results has been provided in this chapter to highlight
the effects of the key factors such as, the shear span to depth ratio and the amount of web
reinforcement on the behavior of the FRP-RC deep beams. As shown in Chapter 3 for
conventional RC deep beams, the shear-span to depth ratio and the amount of web
reinforcement is the key factors governing the behaviour of a deep beam. These two
parameters are expected to be important for FRP-RC deep beams as well. The
experimental plan was thus developed to understand the effects of these two parameters
in the behaviour of FRP-RC deep beams. This chapter also presents the comparison of
the test results with the design procedure developed for designing FRP-RC deep beam in
the context of Canadian (CSA) and (ACI) codes.
Two design procedures in the CAN/CSA-S806-12[2012] code are compared in this
chapter to assess their safety and accuracy to estimate the ultimate shear strengths of 13
specimens. These specimens include the nine beams in this research and another four
specimens that were tested by Farghaly and Benmokrane [2013]. The procedures
included here are the STM model and the shear design procedure in flexural regions in
the CAN/CSA-S806-12[2012] code. Also an STM design procedure for FRP-reinforced
concrete deep beams is developed in this chapter since the ACI 440.1 R-06[2006]
standard does not provide a procedure for designing deep beams reinforced with FRP
bars. The design procedure for FRP-reinforced concrete deep beams is similar to the
STM approach for conventional beams with some adjustments that account for the

150
properties of FRP. The suitability of these modified STM design procedures in
predicting the ultimate strength of RC deep beams has been verified with the results of
the experimental study. The ultimate shear capacity of each specimen as determined
experimentally was compared to that estimated using the modified STM provided in ACI
318-08[2008] with adjustment for FRP. They are also compared with the shear capacities
calculated using the procedures given in ACI 440.1 R-06 [2006] for normal beams.
6.2. The effect of shear span-depth ratio a/d:
A number of experimental studies have been conducted on steel reinforced concrete
deep beams to study the effect the span/depth ratio on their behaviour. As mentioned in
this thesis, these studies have indicated that the shear span depth ratio and has played a
big role on effecting their behaviour. The effect of the shear span-to-depth ratio on the
behaviour of concrete deep beams reinforced by FRP has been investigated according to
the experimental results. The effect of the shears pan-to-depth ratio a/d on the behavior of
the beams was assessed by comparing the load-deflection response, cracking pattern, and
failure mode of the current experimental specimens.
6.2.1. On the load-deflection behavior:
In general, the mid-span deflection at the maximum load in group A is lower than that
of the specimens in group C. For easy comparison and to study the effect of the variables,
the ultimate mid-span deflection over the effective depth, Δ/d versus the percentage of the
ratio of web reinforcement is plotted in Fig. (6.1). Generally, the group C beams with
a/d=2 sustained greater ultimate mid-span deflection over the effective depth Δ/d ratio

151
as compared to the group A beams, i.e., the beams become more flexible with an increase
in the shear span-to-depth ratio a/d.
The load versus the mid-span deflection curves of the three beams A1/100, B1.5/100
and C2/100 are plotted in Fig (6.2). The mid-span deflection at the maximum load of
specimen A1/100 is much lower than the two other specimens. After reaching Pmax and
failure, the load started to drop, with a simultaneous increase of the deflection in all
samples.
Fig. (6.1) Ultimate mid-span deflection over the active depth Δ/d versus the percentage of
the ratio of web reinforcement
Fig.(6.2) Load deflection response of A1/100,B1.5/100 and C2/100 beams.
Group A
Group C
0
0.01
0.02
0.03
0.04
0.05
0% 20% 40% 60% 80% 100%
Δ/d
ρ w%
Beam C2/100
Beam A1/100
Beam B1.5/100
0
200
400
600
800
1000
1200
0 2 4 6 8 10 12 14 16
Tota
l lo
ad (
kN)
Deflection (mm)

152
As can be seen from the Figure (6.2), beam A1/100 exhibited the steepest load–
deflection curve while beam C2/100 had the curve with the shallowest slope. Generally,
beams with a higher shear span-to-depth ratio a/d had a gentler load deflection curve.
For the three beams, the ultimate mid-span deflection over the effective depth Δ/d
versus the dimensionless load 2V/fc`bwd is plotted in Fig. (6.3).The deflection gradually
increased for beams with higher shear-span to depth ratio, i.e., with increasing a/d ratio,
the beam becomes more flexible. These results are in agreement with the experimental
investigation by Tan and Lu [1997a] on steel reinforced concrete deep beams. Tan and
Lu [1997a] indicated that the stress-deflection curve was gentler in the beams that had a
higher a/d, and they also observed that the beam becomes more flexible with an increase
in the a/d ratio.
Fig.(6.3) Ultimate shear stress versus Δ/d for A1/100,B1.5/100 and C2/100 beams.
6.2.2. On the crack developments:
The formation of the first flexural crack at the bottom of the mid-span appears at 18, 20
and 30% of maximum loading for the three specimens: A1/100, B1.5/100 and C2/100,
respectively. The propagation rate of flexural cracks is very similar for the three beams.
a/d=1
a/d=1.5
a/d=2
0
0.02
0.04
0.06
0.08
0.1
0.12
0.14
0.16
0.00 0.01 0.02 0.03 0.04
2V
/bd
f`c
Δ/d

153
Initial diagonal cracks in beams A1and B1.5 occurred after approximately 35% of the
maximum load was applied, while it appeared at 56% of Pmax in specimen C2/100.
Comparing the behaviour of the two groups A and C, the formation of the first flexural
crack at mid-span for group A appears at approximately of 20% of the ultimate load,
while for group C, the first flexural crack at mid-span appears at approximately 30% of
the ultimate load. For all of the specimens, new formation of flexural cracks began to
appear and lengthened towards the loading plate as the load increased. After varying
durations in the two groups, an initial diagonal crack occurred, approximately at the
interior edge of the support propagating toward the loading plate. More flexural cracks
and diagonal cracks developed as the load increased. In general, the failure crack patterns
of the four beams within each group are similar; however, the beams without web
reinforcement are more extensively cracked than the beams with web reinforcement.
In general, the propagation rates of the flexural cracks in group A are much higher than
those of the beams in group C, indicating the effect of the shear span-to-depth ratio a/d
on the crack propagation. By increasing the load, more flexural cracks and diagonal
cracks were developed and the existing ones widened or lengthened toward the
compression face of the beams. Especially in group A, after reaching approximately 65%
of (Pmax), the formation of new cracks eventually stopped and existing ones widened until
failure occurred. In contrast, the propagation of cracks continued in the group C beams
until they were very close to the failure load.
The dimensionless initial cracking load, diagonal cracking load and failure load
(2V/fc`bwd) are plotted against a/d for three beams in Fig. (6.4). As can be seen from the
graph, all of the beams exhibit the flexural behavior under almost the same dimensionless

154
load 2V/fc`bwd. The dimensionless load in large-sized beams, especially at the failure
stage, is higher than for smaller beams.
It can also be observed that the load-resisting capacity after the first diagonal crack
increases whenever the shear-span to depth ratio is smaller. In other words, beams with
smaller (a/d) have more reserve strength. The reserve strength is the load-bearing
capacity developed in deep beams after diagonal cracking occurred.
Fig. (6.4) Flexural, diagonal and ultimate shear stress versus shear span-depth ratio (a/d).
6.2.3. On the failure modes:
Figures (6.5) and (6.6) show the load levels corresponding to the initial flexural crack,
initial diagonal crack and the failure for the tested beams (Groups A and C) with different
percentages of web reinforcement. The ultimate load in the beams Group A, especially at
the failure stage, is higher than the maximum load for the beams in Beam C because of
their relative section sizes, which also can be observed for the beams in the same group
where the ultimate load of the beams with web reinforcement is higher than for the un-
reinforced beams.
0
0.02
0.04
0.06
0.08
0.1
0.12
0.14
0.16
0 0.5 1 1.5 2 2.5
2V
/bd
f`c
a/d
failure
Diagonal cracking
flexural cracking

155
Fig. (6.5) Flexural, diagonal and ultimate load versus the percentage of the ratio of web
reinforcement for beams in Group A.
Fig. (6.6) Flexural, diagonal and ultimate load versus the percentage of the ratio of web
reinforcement for beams in Group C.
It can also be observed from Figures (6.4), (6.5) and (6.6) that the load-resisting
capacity after the first diagonal crack increases whenever the shear span-depth to ratio
decreases. In other words, beams with smaller a/d ratios have more reserve strength. It
should also be noted that the load levels in Group A beams corresponding to the flexural
cracking and the diagonal cracking exhibited approximately the same level of load, While
0
200
400
600
800
1000
1200
0% 20% 40% 60% 80% 100%
Load
(kN
)
ρ w%
Failure Load
Diagonal Cracking
Flexural Cracking
0
50
100
150
200
250
300
0% 50% 100%
Load
(kN
)
ρ w%
Failure Load
Diagonal Cracking
Flexural Cracking

156
the load level corresponding to failure increases with the increasing amount of web
reinforcement.
The last column of Table (5.1) indicates the failure modes of all the specimens. As can
be observed from (cracks pattern figures in chapter 5), shear failure was the common
failure mode in all specimens, with varying severity in the type and level of damage. The
beams exhibit three types of brittle failure mode: shear-compression failure, diagonal-
splitting failure, and strut crushing failure. For group A specimens, Beams A1/00 and
A1/50 failed with diagonal-splitting failure. The concrete at the end of one of the main
struts of specimen A1/75 and A1/100 failed by crushing and was accompanied by a loud
noise. In contrast to the beams in Groups A, three beams in group C, C1/00, C1/50 and
C1/75 failed by strut crushing. Shear compression failure was the failure mode of beam
C1/100, with a level of damage that was less severe than that of the two beams A1/75 and
A1/100.
By comparing the failure modes within two groups, it can be observed that each group
exhibits different type of failure mode, indicating the effect of the shear span depth ratio
a/d in beams’ failure modes. The load levels in Group C beams were corresponding to
flexural exhibited approximately the same level of load, while the load levels
corresponding to diagonal cracking decreases with the amount of 75 % web
reinforcement which is unexpected and the load starts increasing with the amount of 100
% web reinforcement. However, the failure load levels increase with the amount of
increase in web reinforcement.

157
6.3. The effect of web reinforcements:
Earlier works by Smith and Vantsiotis [1983], Tan et al [1997a], Shin et al[1999],
Kong et al [1970] and Rogowsky et al[1986] on the effect of web reinforcement on the
various aspects of deep-beam (conventional) behaviour showed that web reinforcement
have a significant effect on the mid-span deflection, crack-width, failure modes and
ultimate strengths. Many researchers have observed that web reinforcement increases
beam stiffness, and that this influence becomes significant according to the arrangement
and amount of web reinforcement, and on the L/d and a/d ratios. Despite the divergent
views in determining the effect of web reinforcements on crack control, the majority has
concluded that the effect of web reinforcements on crack width and crack control is akin
to its effect on beam stiffness. Most of the researchers clarified that beams with web
reinforcement exhibit the same modes of failure as compared to the beams without web
reinforcement. For beams with web reinforcement the ultimate shear strength of deep
beams is slightly increased as compared to those without; this contribution of shear
reinforcement has not yet been determined as it has in conventional deep beams.
The effect of FRP shear reinforcement on the behavior of the beams was assessed by
comparing the load-deflection response, load-strain response cracking pattern, and failure
mode of specimens within A and C groups.
6.3.1. On the load-deflection behavior:
As can be observed from Figure (6.1), the ultimate deflection gradually increased for
beams with web reinforcement in two groups A and C. It is mainly due to increased
capacity of the beams with higher amount of web reinforcement. These results show that
the web reinforcement has played significant role on affecting the beam stiffness.

158
6.3.2. On the crack development and failure mode:
By comparing crack patterns of the two groups, the formation of the first flexural
crack at mid-span for group A appears at approximately 17 to 24% of the ultimate load
according to the amount of the web reinforcement, while for group C, the first flexural
crack at mid-span appears at approximately 13 to 24% of the ultimate load. The failure
crack patterns of the four beams within each group are similar; however, the beams
without web reinforcement are more extensively cracked than the beams with web
reinforcement. The mid-span strain response of the main GFRP longitudinal
reinforcements at different loading stages for specimens in group A and C are shown in
Figs (6.7).
Fig. (6.7) Load –Strain response in the middle of the main tension GFRP reinforcement
of specimens in Group A and C
When the flexural crack initiated, the tensile strains began to increase as the loading
was increased. The initial flexural crack for the beams with more web reinforcement
appeared to be longer than that observed in other cases; this is because the effect of the
A1/100 A1/50
A1/00 A1/75
C2/100 C2/75 C2/50
C2/00
0
200
400
600
800
1000
1200
0 0.005 0.01 0.015 0.02
Load
(kN
)
Strain ε

159
web reinforcements in increasing the beams stiffness (the beam rigidity). And the beam
rigidity is expressed here in the study as the resistance of the deformation that produced
from the applied loads.
The results of beams A1/100, A1/75, A1/50 and A1/00 indicated that the strain in the
tensile rebars reached only 54.2%, 50.3% 50.4 % and 44.4% of the ultimate strain,
respectively. For group C, the results of beams C2/100, C2/75, C2/50 and C2/00
indicated that the strain in the tensile rebars reached only 52.3%, 41.2% 40.3% and
52.0% of the ultimate strain, respectively. According to clause 8.5.3.1 of the CAN/CSA-
S806-12[2012], the ultimate tensile strength Fu should be reduced by about 65% to
calculate the tie strength. Compared to the experimental results, this reduction suggested
by the code is reliable.
The splitting failure was observed in beam A1/00 and A1/50 because there was not
sufficient web reinforcement to resist tensile stresses in cracked concrete. While in group
C, the beam C2/100 exhibited shear compression failure but the other three beams failed
by crushing of the strut. This difference of the failure modes of the beams in group A and
C indicates that the failure mode is affected by both the web reinforcement and a/d ratio.
6.3.3. On the Ultimate shear capacity:
Beams in a group which had 100% of FRP web reinforcement had the highest ultimate
shear capacity. The ultimate shear capacities of the specimens with and without web
reinforcement were compared to calculate the contribution of the FRP web reinforcement
on the ultimate shear capacity of a beam. The contribution of the FRP web reinforcement
in the two groups A & C is equal to 143.4 kN and 32.4 kN, respectively. The results show
that FRP web reinforcement increase the ultimate shear capacity of FRP reinforced

160
concrete deep beams by about 26% as compared to the beams without web
reinforcement. This contribution of the web reinforcement can be expressed as a function
of the geometry, web reinforcement details and the shear span-to-depth ratio, as proposed
below.
=
(
(6.1)
Where the ΦF FRP strength reduction factor, Afv is the amount of FRP shear
reinforcement within spacing s, d is the effective depth, ffu is the design tensile strength of
FRP and s is the stirrup spacing.
By using this equation (Eq (6.1)), the contribution of the web reinforcements was
found to be 131.7 kN and 39.0 kN for specimens A1/100 and C2/100, respectively. These
values are consistent with the experimental results. On the other hand, the contribution
calculated by using the provisions of CAN/CSA-S806-12[2012] for specimens A1/100
and C2/100 are 47.40 kN and 56.07 kN, respectively. Clearly, these values are lower than
that obtained based on the test results.
Table (6.1) The predictions for contribution of the FRP web reinforcement
on the ultimate shear capacity
Specimens Vweb contrcalc/ Vweb contr
TEST
Proposed equation
Vweb contrcalc/ Vweb contrTEST
Equation (8-22) of the
CAN/CSA-S806-12 code
Beam A1 0.92 0.33
Beam C2 1.20 1.73
Mean 1.06 1.03
SD 0.20 0.99
COV 0.19 0.96

161
Table (6.1) shows the comparison between the prediction of the contribution of the
FRP web reinforcement on the ultimate shear capacity Vweb contrTEST
by using Eq [9] that
proposed here and the equation (8-22) of the CAN/CSA-S806-123 code. From Table
(6.1), the contribution Vweb contrcalc/ Vweb contrTEST
by using the proposed equation
are 0.92 and 1.20 for beams A1 and C2, respectively. As for the equation (8-22) of the
CAN/CSA-S806-123 code, the contribution Vweb contrcalc/ Vweb contrTEST
are 0.33 and 1.73
for beams A1 and C2, respectively. The equation (8-22) of the CAN/CSA-S806-
12[2012] code gives unconservative estimation for the contribution of the web
reinforcements when compared to the test results especially when a/d equal to one. And
with decreasing a/d, the contribution is overestimated by using the CAN/CSA-S806-
12[2012] code. In general, the mean value of Vweb contrcalc/ Vweb contrTEST
by using the code
equation is 1.03, with a standard deviation (SD) equal to 0.99 and a coefficient of
variation (COV) of 0.96. While the proposed equation gives a mean value of 1.06, the
lowest standard derivation of 0.20 and the lowest coefficient of variation of 0.19,
indicating that the equation gives the reliable and acceptable results for the contribution
of FRP web reinforcement.
6.4. Comparison of test results with predicted values by design provisions:
Table (6.2) shows the ultimate shear strength predictions for the nine beams and
Farghaly and Benmokrane [2013] beams according to the two design procedures and
compared to the actual shear capacity. The ultimate shear capacity of the eight specimens
was determined by using the STM provisions in CAN/CSA-S806-12[2012].

162
Table (6.2) Summary of the predictions for ultimate shear strength.
Reference Specimen No
Vcalc/VuTEST
STM S806-12
Vcalc/Vu TEST
Sectional Model S806-12
Current study
A1/100 0.45 0.29
A1/75 0.46 0.29
A1/50 0.51 0.30
A1/00 0.61 0.32
B1.5/100 0.82 0.48
C2/100 0.55 1.07
C2/75 0.70 1.17
C2/50 0.67 1.02
C2/00 0.74 0.92
Farghaly and
Benmokrane12
G8N6 0.94 0.28
G8N8 0.93 0.21
C12N3 0.94 0.39
C12N4 0.93 0.31
Mean 0.71 0.54
SD 0.19 0.36
COV 0.262 0.660
The ultimate shear capacity of an STM was determined by using the capacity of the
weakest element of a simple assumed truss. The prediction of ultimate shear strength
calculated by using the procedure of shear design in flexural regions in CAN/CSA-S806-
12[2012] is obtained from equations 6 and 8 for normal beams, which represents the
contribution of two parts: concrete, Vc and FRP shear reinforcement, Vcf.
Table (6.2) also shows the mean, the standard deviation (SD) and the coefficient of
variation (COV) for shear capacity predicted using the code provisions. The results show
that the prediction of the procedure of shear design considering a shallow beam is quite
conservative, especially for beams with lower (a/d) ratios, while for beams with (a/d)
ratios equal to two, the procedure overestimates the capacity.
The prediction of the ultimate shear strength for specimens without web reinforcement
was reliable, while for the specimens with web reinforcement the shear capacity was
overestimated. These overestimated predictions were due to the way the contribution of

163
the shear reinforcements is calculated for shallow beams using CAN/CSA-S806-12[2]
provisions. Compared to the predictions for the beams in the current study, the
predictions of the beams tested by Farghaly and Benmokrane [2013] were slightly more
conservative.
For easy comparison between the STM Model and the sectional model, the
dimensionless shear stress capacity ν as computed using Equation (6.2) below has been
plotted against the shear span-to-depth a/d ratio as shown in Fig (6.8).
ν = Vcalc/bd f`c (6.2)
Fig. (6.8). Use of strut and tie model and sectional mode to predict the strengths of a
series of beams
The STM model provides a very good estimate of the capacity when compared to the
experimental results, while the sectional model (i.e., the procedure of shear design of
shallow beams) does not provide an accurate estimate of capacity as expected. The results
shown in Figure (6.8) and Table (6.2) confirm that the STM model procedure in the
0
0.01
0.02
0.03
0.04
0.05
0.06
0.07
0.08
0.09
0.8 1 1.2 1.4 1.6 1.8 2 2.2
ν=V
calc/b
df`
c
a/d
Current experimental results
Farghaly and Benmokrane
CSA Code (STM)
CSA (Sectional Model)

164
CAN/CSA-S806-12[2012] code provides a conservative and convenient design method
for FRP-reinforced concrete deep beams.
6.5. Comparison of experimental results with predicted capacity by the
proposed design procedure for deep beams based on ACI code:
Table (6.3) shows the comparison of the ultimate shear strength and the nominal
design strength of the three beams using the thin beam theory of ACI 440.1R-06[2006]
and the proposed design procedure for deep beams based on the modification to ACI
318.08[2008] procedure. In ACI 440.1R-06[2006], the ultimate shear strength of thin
FRP-reinforced beams has the contribution of two parts, shear strength provided by
concrete Vc, and by FRP shear reinforcement Vf. For the STM model a simple truss was
assumed to calculate the capacity. All the possibilities of the applied loads and the
resulting forces in each element were calculated by using the modified provision of STM
in ACI318.08 [2008] using both uniform and bottle shaped struts. The ultimate shear
capacity was determined by using the capacity of the weakest element. The results show
that the ACI 440.1R-06[2006] code prediction using the traditional thin beam theory is
very conservative for each of the beams, as expected.
Table (6.3) Summary of the predictions for ultimate shear strength.
Specimen No
Vn / VnTEST
ACI 440.1R-06
Vn / VnTEST
Mod-ACI 318-08
(Uniform cross
section strut)
Vn / VnTEST
Mod-ACI 318-08
(bottle shaped
strut)
A1/100 0.16 0.74 0.5
B1.5/100 0.21 0.64 0.64
C2/100 0.21 0.86 0.86
Mean 0.19 0.75 0.67
SD 0.03 0.11 0.18
COV 0.15 0.15 0.27

165
The predictions using the STM of ACI 318[2008] with the proposed modification for
FRP-reinforcements show acceptable and conservative results for both uniform and bottle
shaped struts. The STM model provided in the Canadian code, which is not discussed
here, was also found to provide acceptable and conservative results. The nominal
capacity of Specimen A1/100 was slightly more conservative than that of B1.5/100 and
C2/100. These results are encouraging while considering the possibility of adopting the
STM procedure for FRP reinforced concrete deep beams in the ACI code. The STM
procedure as provided in ACI 318.08[2008] code can be adapted to design FRP-
reinforced concrete deep beams, taking into consideration the properties of the FRP. To
that end, further tests with different ratios of the key variables that affect deep beam
behavior would be required.
6.6. Summary:
The experimental results of FRP reinforced concrete deep beams are summarized in
this chapter. Based on the comparison of the experimental results of different FRP
reinforced concrete deep beam groups, the influence of critical variables on the behaviour
of FRP reinforced concrete deep beams have been studied. The experimental results are
also used for validating the current and proposed design procedures for FRP-RC deep
beams. It is found that the Canadian provisions are generally adequate, while there are
scopes for improvement. The proposed procedure for designing FRP-RC deep beams
adapted from the ACI code provisions for conventional deep beam is also found to work
well. These aspects are discussed below in more details.

166
6.6.1. Effect of the key factors:
The behavior of the beams with higher shear span-to-depth ratio a/d becomes more
flexible. The rigidity of the three beams A1/100, B1.5/100 and C2/100 was gradually
increased respectively, whenever the shear span depth ratio decreased. Also the beam
stiffness is affected by the web reinforcement where the rigidity of the tested beams was
increased due to the web reinforcement in the two groups of beams A and C. It has been
found that the influence of shear behavior becomes dominant when the shears span-to-
depth ratio a/d decreases. In addition, the load-resisting capacity is increased after the
first diagonal crack in the specimens with a small shear span-to-depth ratio. The
experimental results also indicate that the web reinforcement significantly influences the
behavior of the FRP reinforced concrete deep beams. This influence can be seen on the
beam stiffness where the deflection gradually increased for beams with web
reinforcement in the two groups of beams studied in detail (i.e., A and C).
The pre-failure damage appears to be more severe in beams without or with less web
reinforcement indicating the influence of the web reinforcement on controlling crack
propagation. Also the ultimate shear strength is affected by web reinforcement where the
capacity of the tested beams was increased due to the web reinforcement. Based on the
experimental results, an equation has been proposed to calculate the contribution of the
FRP web reinforcement to the ultimate shear capacity of FRP-reinforced concrete deep
beams. When compared to the test results, the equation gives the reliable and acceptable
results compared to that calculated by using Equation (8-22) of the CAN/CSA-S806-12
[2012]. As for the failure modes of the beams, it is mainly affected by the shear span-to-
depth ratio a/d and by the web reinforcement. The experimental study also indicates that

167
the reduction of the ultimate tensile strength Fu according to clause 8.5.3.1 of the
CAN/CSA-S806-12[2012] code was sufficient when compared to the experimental
results.
6.6.2. Comparison with the design provisions:
The study shows that the STM design procedure in the CAN/CSA-S806-12 code
[2012] provides a conservative and convenient design method for FRP-reinforced
concrete deep beams. There are some aspects of the provisions that are inconsistent, for
example, the way strut capacity is calculated, and the stress limit in a straight FRP bar is
defined. Also there is a concern about the required minimum quantity of web
reinforcements specified in the standard, which seems quite conservative and may lead to
very close spacing. In general, the predictions of the capacity using the Modified STM
procedure for the ACI code showed acceptable and conservative results. After modifying
the tie strength according to FRP properties, the STM design procedures in Appendix A
of the ACI 318-08 code [2008] constitute a practical design method for FRP-reinforced
concrete deep beams. The code provisions of ACI 440.1R-06[2006] produce very
conservative results to predict the ultimate shear strength as compared to the
experimental studies. The investigation reveals that adopting the procedure in the ACI
318-08 Code [2008] and taking into consideration the properties of FRP reinforcement
provides a reliable design procedure for FRP reinforced concrete deep beams.

168
Chapter 7: Summary and Conclusions
7.1. Summary
There are many studies available in the literature that demonstrate the effectiveness of
FRP bars as internal reinforcement in concrete structural elements. However, there are
not many studies available on the use of internal FRP reinforcement in concrete deep
beams. Therefore, a set of nine FRP-RC deep beam specimens have been tested in the present
study to understand their behaviour and assess the effect of the key parameters.
The increasing use of this material in construction led to the development of standards
for the design and construction of building components with Fiber-Reinforced Polymers.
The CAN/CSA-S806-02[2002], the ACI 440.1 R-06[2006] and the CAN/CSA-S806-
12[2012] standards provide requirements for the design and evaluation of building
components made of fiber-reinforced polymers (FRP) in buildings, as well as for building
components reinforced with FRP materials. A design manual has been issued by the ISIS
Canada Research Network to provide guidelines and design equations that can be used
for the design of FRP-reinforced concrete structures. Neither the CAN/CSA-S806-
02[2002] nor the ACI 440.1 R-06[2006] standards provided a procedure for designing
deep beams reinforced with FRP bars. In the newer edition, the CAN/CSA-S806-
12[2012] does adopt the STM approach for conventional beams with some adjustments to
account for the properties of FRP. Such an approach has not been adopted in the ACI
440.1 R-06[2006] for deep beams as yet. A design procedure for FRP-reinforced concrete
deep beams similar to the STM-based procedure for conventional deep beams still

169
remains to be developed. This test program seeks to assess the suitability of the
adaptation of the STM design procedures provided in ACI 318-08 [2008] code for
designing FRP reinforced concrete deep beams after modifying the tie strength according
to FRP properties.
In the beginning of this research, a parametric study has been conducted on the
behaviour of conventional concrete deep beams based on the available experimental data
collected from the literature review. The objective of this part of the research was to
understand the behaviour of the conventional deep beams, relevant code provisions and
key factor in order to develop similar design procedures for FRP-RC deep beams. At that
time (prior to 2012) no design procedure was available for such beams in Canada and
elsewhere. This study reviews and compares the design provisions for concrete deep
beams provided in the three prominent design codes for reinforced concrete using the
Strut-and-Tie Model. The effectiveness of the STM provisions of different codes in
predicting the capacity and failure modes of concrete deep beams has been studied in a
large number of available experimental studies. The influence of key variables on the
capacity of deep beams predicted by Strut-and-Tie Model (STM) provisions in codes,
such as the shear span-to-depth ratio, the web reinforcement, and the compressive
strength of concrete, has also been studied. The findings of the present study are expected
to be useful to both design practitioners and to code-development authorities.
Based on the above study and review of the code provisions for conventional deep
beams and FRP-reinforced ordinary beams, a design procedure for FRP-reinforced
concrete deep beams was developed and a set of nine beams was designed and
constructed for experimental evaluation of their behaviour. The above design procedure

170
was developed for the Canadian jurisdiction based on the provisions of CSA A23.3-04
standard applicable for conventional deep beams and the provisions of CSA-S806-02
applicable for FRP-RC ordinary beams. The CSA S806-12 provisions that were available
later had a similar procedure except for the amount of the web reinforcement. The results
of the present experimental study and those reported in Farghaly and Benmokrane [2013]
were used for studying the effect of key factors on the behaviour of FRP-RC deep beams,
and validating the effectiveness of the STM design procedures in the CSA-S806-12
[2012] code for designing FRP reinforced concrete deep beams. In addition, a design
procedure for FRP-RC deep beams similar to that provided in ACI 318-08 was also
proposed for possible adoption in a future version of ACI 440. The results of the present
and available experimental studies were used for validating the effectiveness of that
procedure as well.
7.2. Conclusions:
A total of nine full-scale concrete deep beam specimens with shear span to depth
ratios a/d of 1, 1.5 and 2 were constructed and tested under three-point loading to failure.
The studied variables were the shear span to depth ratio and the quantity of web shear
reinforcement. The behaviour of deep beams is indicated by their levels of ultimate shear
strength, mid deflection, FRP reinforcement strain, crack propagation, and by their type
of failure. The test results are also compared to predictions based on the design
procedures of the ACI and the CSA design and construction code for building structures
with fibre-reinforced polymers. Based on the review of available experimental studies
and comparison of code provisions for conventional deep beams, and the experimental
study conducted on FRP-RC deep beams, the following conclusions were drawn.

171
7.2.1. Conclusions based on the behaviour of conventional deep beams and
relevant code provisions:
The Strut and Tie Models as provided in three prominent codes, namely ACI-318-
08 [2008], CSA-A23.3-04 [2004], and Eurocode EN1992-1-1 [2004], are generally
found to be appropriate methods for the design and evaluation of the shear strength
capacity of concrete deep beams with a shear–span to depth ratio less than or equal
to two.
Although the effect of web reinforcement is not accounted for in some of the code
provisions, experimental studies show that such reinforcements improve the
capacity of concrete deep beams.
The code provisions may not produce accurate results in the prediction of the
mode and location of failure as observed in the experimental studies.
The provisions of the Canadian Code appear to be the most conservative in
estimating the capacity of concrete deep beams.
When the Eurocode method is modified by multiplying the ultimate load by a
factor β as provided in the code, it provides a reasonable and conservative estimate
of capacity similar to that obtained by using the provisions of the Canadian code.
The procedure of ACI improves significantly when bottled-shaped struts are used
instead of uniform cross-section struts, and shows conservative results. However,
the code does not provide guidance on when to use the bottle-shaped or the
uniform strut sections.
The STM design procedures in Appendix A of the ACI 318-085 codes, after
modifying the efficiency factors of bottled shape struts and calculated as function

172
of shear span-to-depth ratio as proposed in the present work, provides an
improvement in the conservative estimate of the capacity of a concrete deep beam.
7.2.2. Conclusions based on the present experimental study of FRP-RC deep
beams and relevant design provisions:
The deflection gradually increases for beams with higher shear span-to-depth ratio
a/d, i.e. the behavior of beams with higher shear span-to-depth ratio a/d becomes
more flexible.
When the shear-span to depth ratio a/d decreases, the influence of the shear
behavior becomes dominant.
The higher load-resisting capacity was observed after the first diagonal crack for
beams with the smaller shear span depth ratio.
Although the three specimens A1, B1.5and C2 with 100% of web reinforcement
failed in shear-compression mode, the effect of the a/d ratio was reflected in the
severity of the pre-failure damage.
Web reinforcement has a significant effect on controlling the crack propagation,
and the pre-failure damage appears to be more severe for beams without or with
less web reinforcement.
The ultimate shear strength of the tested beams was increased due to the web
reinforcement.
Web reinforcement has a significant effect on the beam stiffness, where the
deflection gradually increased for beams with web reinforcement in two groups (A
and C).
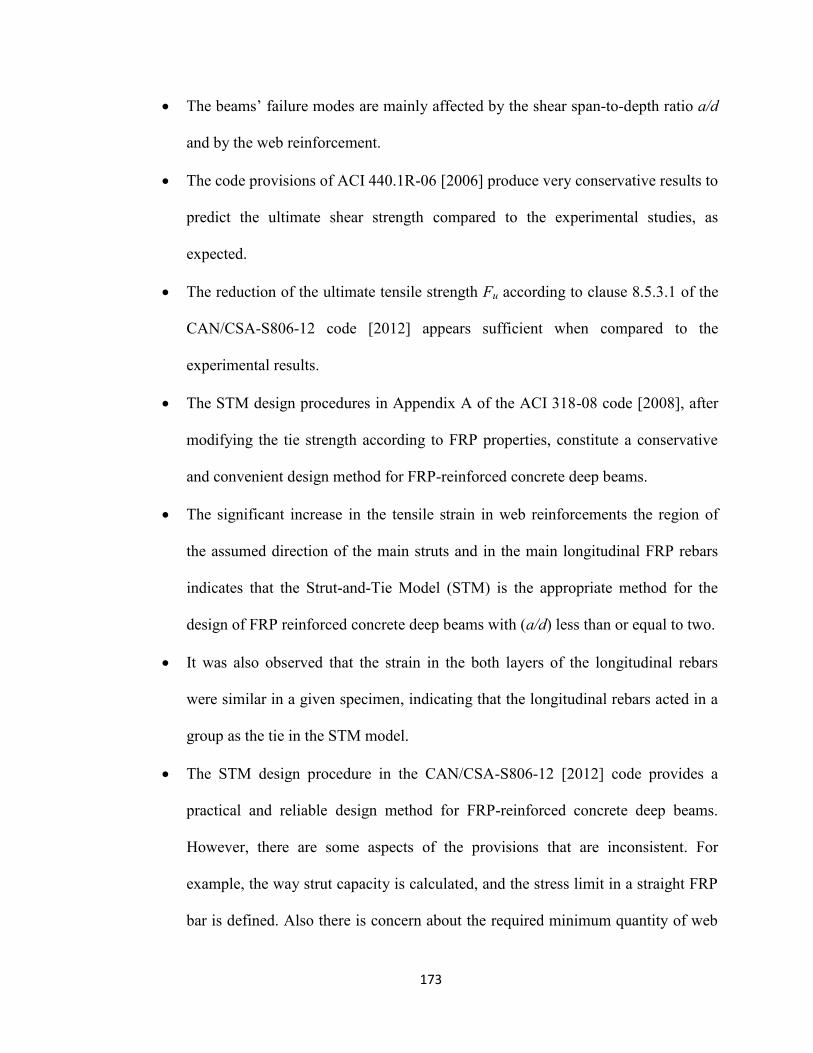
173
The beams’ failure modes are mainly affected by the shear span-to-depth ratio a/d
and by the web reinforcement.
The code provisions of ACI 440.1R-06 [2006] produce very conservative results to
predict the ultimate shear strength compared to the experimental studies, as
expected.
The reduction of the ultimate tensile strength Fu according to clause 8.5.3.1 of the
CAN/CSA-S806-12 code [2012] appears sufficient when compared to the
experimental results.
The STM design procedures in Appendix A of the ACI 318-08 code [2008], after
modifying the tie strength according to FRP properties, constitute a conservative
and convenient design method for FRP-reinforced concrete deep beams.
The significant increase in the tensile strain in web reinforcements the region of
the assumed direction of the main struts and in the main longitudinal FRP rebars
indicates that the Strut-and-Tie Model (STM) is the appropriate method for the
design of FRP reinforced concrete deep beams with (a/d) less than or equal to two.
It was also observed that the strain in the both layers of the longitudinal rebars
were similar in a given specimen, indicating that the longitudinal rebars acted in a
group as the tie in the STM model.
The STM design procedure in the CAN/CSA-S806-12 [2012] code provides a
practical and reliable design method for FRP-reinforced concrete deep beams.
However, there are some aspects of the provisions that are inconsistent. For
example, the way strut capacity is calculated, and the stress limit in a straight FRP
bar is defined. Also there is concern about the required minimum quantity of web

174
reinforcements specified in the standard, which seems quite conservative and may
lead to very close spacing.
Based on the work presented in this thesis an equation has been proposed to
calculate the contribution of the FRP web reinforcement to the ultimate shear
capacity of FRP-reinforced concrete deep beams.
7.3. Research Contributions:
The contributions of the current research include the following:
The code provisions have been evaluated by using a database of available
experimental results of more than three hundred test specimens compiled in the
present study.
The effectiveness of the STM provisions of the codes in predicting the capacity
and failure modes of deep beams has been studied.
In addition, the effects on the capacity of deep beams of various parameters, such
as the web reinforcement, shear-span to depth ratio, and the strength of concrete,
have been investigated using the results of the experimental studies.
The behavior and strength of FRP reinforced concrete deep beams are
investigated in an experimental study.
This investigation reveals that adopting the procedure in the ACI 318-08 Code
[2008] and taking into consideration the properties of FRP reinforcement provides
a conservative and convenient design procedure for FRP reinforced concrete deep
beams.

175
The shear design procedures of the ACI 440.1R-06 Code [2006] and of the
modified Strut and Tie model (STM) from Appendix A of the ACI 318-08 Code
[2008] were compared based on their test results.
A new equation is presented in this study to calculate the contribution of the FRP
web reinforcement to the ultimate shear capacity of FRP-reinforced concrete deep
beams.
The test results are also compared to predictions based on the current CSA design
and construction code for building structures with fibre-reinforced polymers.
This investigation reveals that the Strut and Tie model procedure in the CSA-
S806-12 code [2012] provides a conservative and convenient design procedure for
FRP-reinforced concrete deep beams.
7.4. Limitations of the Current Research and Potential for Future Research:
The present study provides and extensive review of literature and available experimental
studies with a comparison of code provisions for the design of conventional RC deep
beams, and an experimental study on FRP-RC deep beams to understand their behavior
and validate the current and proposed design procedures. However, there are some
limitations in the present work that should be considered for future research.
The test specimens were designed and constructed prior to the publication of
current CSA standard (CSA S806-12) and thus could not its provisions. However,
the design method developed for these specimens were very similar to the current
provisions except in the ways how web reinforcements are provided and the strut
strength is calculated. Further experimental studies are required with specimens
adhering to the current code provisions.

176
All the beam specimens were tested in three-point loading since the available
experimental studies on conventional deep beams indicate similar behaviour in
beams tested in three-point or four-point loading tests. However, further
experimental studies are required for FRP-RC deep beams tested in four-point
loading.
Additional experimental work, analytical studies and finite element analysis are needed to
enhance the reliability and suitability of the STM model both in the CSA code and the
proposed provisions intended for ACI code to design the FRP-reinforced concrete deep
beams.
The current research could be expanded by changing the horizontal and vertical
web reinforcement patterns and higher quantity.
Investigating the structural behaviour of FRP-reinforced concrete deep beams
with shear spans to depth ratios less than one.
Studying the effect of other variables that not included in this study such as:
longitudinal FRP reinforcement ratio (ρ) and concrete compressive strength (f´c).
Investigating the effect of presence of opening on the behaviour of FRP-
reinforced concrete deep beams.
Conducting numerical analyses on the FRP reinforced concrete deep beams to
assist performing parametric study using the calibrated numerical models.

177
References ACI Committee 318,[2002] “Building Code Requirements for Structural Concrete,”
American Concrete Institute, Farmington Hills, MI, 443 pgs.
ACI Committee 318, [2008]“Building Code Requirements for Structural Concrete (ACI
318-08) and Commentary (318R-08), American Concrete Institute, Farmington Hills,
MI, 430 pp.
ACI Committee 440 [2006] “Guide for the Design and Construction of Concrete
Reinforced with FRP Bars (ACI 440.1R-06).” ), American Concrete Institute,
Farmington Hills, MI, 44 pp.
Aguilar, G.; Matamoros, A.; Parra-Montesinos, G.; Ramirez, J.; and Wight, J. K.,[2002]
“Experimental Evaluation of Design Procedures for Shear Strength of Deep Reinforced
Concrete Beams”, ACI Structural Journal, V. 99, No. 4, pp. 539-548.
ASTM Standard section 4[2013] “ASTM Book of Standards - Section 4 – Construction,”
American Society for Testing and Materials book, V. 04.02, 1068 pp.
CSA Standard A23.3-84, [1984] “Design of Concrete Structures,” Canadian Standards
Association, Rexdale, ON,Canada.
CAN/CSA Standard A23.3-04, [2004], “Design of Concrete Structures for Buildings with
Explanatory Notes,” Canadian Standards Association, Rexdale, ON, Canada.
CAN/CSA-S806-02, [2002] “Design and Construction of Building Components with
Fibre-Reinforced Polymers”, Canadian Standards Association, Toronto, Ontario,
Canada.
CAN/CSA S806-12, [2012] “Design and construction of building components with fiber-
reinforced polymers.” Canadian Standards Association, Mississauga, Ontario, Canada,
208 pp.
CAN/CSA Standard A23.1-09/A23.2-09, [2009] “Concrete materials and methods of
concrete construction/Test methods and standard practices for concrete” Canadian
Standards Association, Rexdale, ON, Canada, 647 pp.
Carlos, G. Q. F., Gustavo, P. M., and James, k. W., [2006] “Strength of Struts in Deep
Concrete Members Designed Using Strut-and-Tie Method,” ACI Structural Journal, V.
103, No. 4, pp. 577-586.
Collins, M.P. and Mitchell, D.“Prestressed Concrete Structures.” Prentice-Hall, 5th
edition, 2001,766 pp.

178
ACI Committee 318, “Building Code Requirements for Structural Concrete (ACI 318-02)
and Commentary (318R-02), American Concrete Institute, Farmington Hills, MI, 2002,
443 pp.
Edward .G. Nawy., [2005]“Reinforced Concrete: A Fundamental Approach.” ACI 318-
05 code 6th edition, Prentice Hall, 824 pp.
El-Sayed A. K., El-Salakawy. E. F., and Benmokrane.B., [2006a] “ Shear Strength of
FRP Reinforced Concrete Beams without Transverse Reinforcement,” ACI Structural
Journal, V. 103, No. 2, pp. 235-243.
El-Sayed A. K., El-Salakawy. E. F., and Benmokrane.B., [2006b] “Shear Capacity of
High-Strength Concrete Beams Reinforced with FRP Bars,” ACI Structural Journal, V.
103, No. 3, pp. 383-389.
European Standard DD ENV 1992-1-1,[1992] “Design of Concrete Structures General
Rules for Buildings (together with United Kingdom National Application Document),”
European Committee for Standardization, CEN. 274 pgs.
European Standard EN1992-1-1, [2004] “Euro code 2: Design of Concrete Structures –
Part 1-1: General Rules and Rules for Buildings,” European Committee for
Standardization, CEN.
[12] Farghaly, A., Benmokrane, B., “Shear Behavior of FRP-Reinforced Concrete Deep
Beams without Web Reinforcement,” Journal of Composites for Construction, V. 17, Issue.
6, Dec 2013, pp. 04013015-1to10.
Foster, S. J., and Gilbert, R. I., [1998] “Experimental studies on high strength concrete
deep beams", ACI Structural Journal, V.95, No. 4, pp. 382-390.
Foster, S.J and R. Malik, A.R.,[2002] “Evaluation of Efficiency Factor Models used in
Strut-and-Tie Modeling of Nonflexural Members,” Journal of Structural Engineering,
V.128, Issue 5, pp. 569–577
Kong, F. K., Robins, P. J., Cole, D. F., [1970] “Web Reinforcement Effects on Deep
Beams", ACI Structural Journal, V.67, No. 12, pp. 1010-1018.
Garay-Moran, J. D., and Lubell, A. S., [2008] “Behaviour of Concrete Deep Beams with
High-Strength Reinforcement,” Structural Engineering Report No.277, Department of
Civil and Environmental Engineering, University of Alberta, Edmonton, AB, Canada,
283 pp.
ISIS Canada Corporation, [2007] “Design Manual No. 3: reinforcing concrete structures
with fibre-reinforced polymers”, University of Manitoba, Winnipeg, MB, Canada, V.2,
151 pp.

179
Jung-Keun Oh, Sung-Woo Shin, [2001] “Shear strength of reinforced high-strength
concrete deep beams”, ACI Structural Journal,. Vol.98, No.2, pp.164-173.
Kani, G. N. J., “How Safe Are Our Large Reinforced Concrete beams,” ACI Journal,
Proceedings V. 64, No.3, Mar.1967, pp. 128–141.
Keun-Hyeok Yang, Heon-Soo Chung,Eun-Taik Lee, Hee-Chang Eun, [ 2003] “Shear
characteristics of high-strength concrete deep beams without shear reinforcements”,
Engineering Structures, Vol.25,pp.1343-1352.
Kong, P. Y. L., and Rangan, B.V., [1998] “Shear strength of high performance concrete
beams”, ACI Structural Journal, V. 95, No. 6, pp.677–688.
Kotosoves, M. D., and Pavlovic, M. N., [2004] “Size Effects in Beams with Small Shear
Span-to-Depth Ratios,” Computer & Structures, V. 82, Issues 2-3, pp.143-156.
MacGregor, J. G., [2000] “Reinforced Concrete, Mechanics and Design.” 2nd Edition,
Prentice Hall, ,848 pp.
Matamoros, A., and Wong, K. H., [2003] “Design of Simply Supported Deep Beams
Using Strut-and-Tie Models,” ACI Structural Journal, V. 100, No. 6, pp. 704-712.
Michael, D. Brown, and Oguzhan, B., [2008] “Design of Deep Beams Using Strut-and-
Tie Model _ Part I: Evaluating U.S Provisions,” ACI Structural Journal, V. 105, No.4,
pp. 395–404.
Michael, D. B., Cameron, L. S., Oguzhan, B., James, O. J., John, E. B., Sharon. L. W.,
“Design for Shear in Reinforced Concrete Using Strut-and-Tie Models,” Center for
Transportation Research , University of Texas at Austin, Report. 0-4371-2, Jan-Apr.
2006, 330 pp.
Nathan, C. R., and Sergio, F. B., [2008] “Behaviour of Deep Beams with Short
Longitudinal Bar Anchorages,” ACI Structural Journal, V.105, No.4, pp.460-470.
Park. JW, Kuchma. D, [2007] “Strut-and-Tie Model Analysis for Strength Prediction of
Deep Beams,” ACI Structural Journal, V. 104, No.6, pp. 657–666.
Park, S., and Aboutaha, R. S., [2009] “Strut-and-Tie Method for CFRP Strengthened
Deep RC Members,” Journal of Structural Engineering, V. 135, No.6, pp. 632–643.
Rigotti, M., [2002]"Diagonal cracking in reinforced concrete deep beams:
an experimental investigation". Concordia University, PhD thesis , 235pp .
Rogowsky, D. M., MacGregor, J. G., and Ong. S. Y., [1986]"Tests of Reinforced
Concrete Deep Beams," ACI Structural Journal, V. 83, No. 4, pp. 614-623.

180
Shin, S. W., Lee, K. S., Moon, J., and Ghosh, S. K., [1999] “Shear strength of reinforced
high-strength concrete beams with shear span-to-depth ratios between 1.5 and 2.5”, ACI
Structural Journal, V. 96, No. 4, pp. 549-556.
Smith, K. N., and Vantsiotis, A. S., [1983] “Shear strength of deep beams, ” ACI
Structural Journal, V. 79, No. 3, pp. 201–213.
Tan, K. H., and Lu, H.Y., [1999] “Shear behaviour of large reinforced concrete deep
beams and code comparisons,” ACI Structural Journal, V. 96, No. 5, pp. 836–845
Tan, K. H., Kong, F. K., Teng, S., and Weng, L. W., [1997a] “Effect of Web
Reinforcement on High Strength Concrete Deep Beams ", ACI Structural Journal, V. 94,
No. 5, pp. 572-581.
Tan, K.H., Teng, S., Kong, F.K. and Lu, H.Y., [1997b] “Main tension steel in high
strength concrete deep and short beams", ACI Structural Journal, V. 94, No. 6, pp. 752-
768.
Tan, K.H., Kong, F. K., Teng, S., and Guan, L., [1995] "High-Strength Concrete Deep
Beams with Effective Span and Shear Span Variations." ACI Structural Journal, V. 92,
No. 4, pp. 395 – 405.
Walraven, J., and Lehwalter, N., [1994] “Size effects in short beams loaded in shear, ”
ACI Structural Journal, V. 91, No. 5, pp. 585–593.
Zhang, N., and Tan, K. H., [2007] “Size effect in RC deep beams: Experimental
investigation and STM verification,” Engineering Structures, V.29, pp.3241-3254.
Kani, G. N. J., “How Safe Are Our Large Reinforced Concrete beams,” ACI Journal,
Proceedings V. 64, No.3, Mar.1967, pp. 128–141.

181
Appendix A:
Reference No
deep beam ID
f`c (Mpa)
h (mm)
d (mm)
b (mm)
le (mm)
a/d
Ρ (%)
ρsv
(%) ρsh (%)
Vu on each load failure mode
Zhang and Tan 1 1DB35bw 25.9 350 313 80 1050 1.10 1.250 0.400 0.000 100 Shear Compression
2 1DB50bw 27.4 500 454 115 1500 1.10 1.280 0.390 0.000 187 Shear Compression
3 1DB70bw 28.3 700 642 160 2100 1.10 1.220 0.450 0.000 427 Shear Compression
4 1DB100bw 28.7 1000 904 230 3000 1.10 1.200 0.410 0.000 775 Shear Compression
5 2DB35 27.4 350 314 80 1050 1.10 1.250 0.000 0.000 85 Shear Compression
6 2DB50 32.4 500 459 80 1500 1.10 1.150 0.000 0.000 136 Shear Compression
7 2DB70 24.8 700 650 80 2100 1.10 1.280 0.000 0.000 156 Shear Compression
8 2DB100 30.6 1000 926 80 3000 1.10 1.260 0.000 0.000 242 Shear Compression
9 3DB35b 27.4 350 314 80 1050 1.10 1.250 0.000 0.000 85 Shear Compression
10 3DB50b 28.3 500 454 115 1500 1.10 1.280 0.000 0.000 167 Shear Compression
11 3DB70b 28.7 700 642 160 2100 1.10 1.220 0.000 0.000 361 Shear Compression
12 3DB100b 29.3 1000 904 230 3000 1.10 1.200 0.000 0.000 672 Shear Compression
Nathan and Breña 13 DB 1.0-1.00 33.3 635 581 152 1220 1.00 0.453 0.080 0.058 339 Crushing of strut
14 DB 1.0-0.75 31.7 635 581 152 1220 1.00 0.453 0.080 0.058 372 Crushing of strut
15 DB 1.0-0.50 30.6 635 581 152 1220 1.00 0.453 0.080 0.058 365 Crushing of strut
16 DB 1.0-0.32 27.0 635 581 152 1220 1.00 0.453 0.080 0.058 334 Crushing of strut
17 DB 1.0-0.75L 29.9 635 581 152 1220 1.00 0.643 0.080 0.058 371 Crushing of strut
18 DB 1.0-0.28L 29.4 635 581 152 1220 1.00 0.643 0.080 0.058 321 Anchorage failure
19 DB 1.5-0.75 32.7 457 405 152 1220 1.50 0.650 0.111 0.084 230 Crushing of strut
20 DB 1.5-0.50 34.1 457 405 152 1220 1.50 0.650 0.111 0.084 212 Crushing of strut
21 DB 1.5-0.38 33.8 457 405 152 1220 1.50 0.650 0.111 0.084 214 Anchorage failure
22 DB 2.0-0.75 34.7 356 303 152 1220 2.00 0.869 0.142 0.134 157 Crushing of strut
23 DB 2.0-0.50 33.0 356 303 152 1220 2.00 0.869 0.142 0.134 149 Crushing of strut
24 DB 2.0-0.43 35.6 356 303 152 1220 2.00 0.869 0.142 0.134 133 Anchorage failure Tan and Lu 25 1-500/0.5 49.1 500 444 140 1500 0.56 2.600 0.000 0.000 850 Crushing of strut
26 1-500/0.75 42.5 500 444 140 1750 0.84 2.600 0.000 0.000 700 Crushing of strut
27 1-500/1.00 37.4 500 444 140 2000 1.13 2.600 0.000 0.000 570 Crushing of strut
28 2-1000/0.5 31.2 1000 884 140 2000 0.56 2.600 0.120 0.120 875 Shear Compression
29 2-1000/0.75 32.7 1000 884 140 2480 0.84 2.600 0.120 0.120 650 Shear Compression
30 2-1000/1.00 30.8 1000 884 140 3000 1.13 2.600 0.120 0.120 435 Shear Compression
31 3-1400/0.5 32.8 1500 1251 140 2410 0.56 2.600 0.120 0.120 1175 Diagonal splitting
32 3-1400/0.75 36.2 1500 1251 140 3100 0.84 2.600 0.120 0.120 950 Diagonal splitting
33 3-1400/1.00 35.3 1500 1251 140 3840 1.13 2.600 0.120 0.120 800 Diagonal splitting
34 4-1750/0.5 42.6 2000 1559 140 2760 0.56 2.600 0.120 0.120 1636 Crushing of strut
35 4-1750/0.75 40.4 2000 1559 140 3640 0.84 2.600 0.120 0.120 1240 Shear Compression
36 4-1750/1.00 44.8 2000 1559 140 4520 1.13 2.600 0.120 0.120 1000 Diagonal splitting
Oh and Shin 37 N4200 23.72 560 500 130 2000 0.85 1.560 0.000 0.000 297 Shear Compression
38 N42A2 23.72 560 500 130 2000 0.85 1.560 0.120 0.430 318 Crushing of strut
39 N42B2 23.72 560 500 130 2000 0.85 1.560 0.220 0.430 422 Crushing of strut
40 N42C2 23.72 560 500 130 2000 0.85 1.560 0.340 0.430 400 Crushing of strut
41 H4100 49.1 560 500 130 2000 0.50 1.560 0.000 0.000 719 Shear Compression
42 H41A2(1)* 49.1 560 500 130 2000 0.50 1.560 0.120 0.430 799 Shear Compression
43 H41B2 49.1 560 500 130 2000 0.50 1.560 0.220 0.430 791 Shear Compression

182
Reference No deep beam
ID f`c
(Mpa) h
(mm) d
(mm) b
(mm) le
(mm) a/d
Ρ
(%) ρsv
(%) ρsh (%)
Vu on each load
failure mode
44 H41C2 49.1 560 500 130 2000 0.50 1.560 0.340 0.430 794 Shear Compression
45 H4200 49.1 560 500 130 2000 0.85 1.560 0.000 0.000 449 Shear Compression
46 H42A2(1) 49.1 560 500 130 2000 0.85 1.560 0.120 0.430 547 Crushing of strut
47 H42B2(1) 49.1 560 500 130 2000 0.85 1.560 0.220 0.430 511 Crushing of strut
48 H42C2(1) 49.1 560 500 130 2000 0.85 1.560 0.340 0.430 471 Crushing of strut
49 H4300 49.1 560 500 130 2000 1.25 1.560 0.000 0.000 378 Crushing of strut
50 H43A2(1) 49.1 560 500 130 2000 1.25 1.560 0.120 0.430 389 Crushing of strut
51 H43B2 49.1 560 500 130 2000 1.25 1.560 0.220 0.430 427 Crushing of strut
52 H43C2 49.1 560 500 130 2000 1.25 1.560 0.340 0.430 451 Crushing of strut
53 H4500 49.1 560 500 130 2000 2.00 1.560 0.000 0.000 126 Crushing of strut
54 H45A2 49.1 560 500 130 2000 2.00 1.560 0.120 0.430 236 Crushing of strut
55 H45B2 49.1 560 500 130 2000 2.00 1.560 0.220 0.430 266 Crushing of strut
56 H45C2 49.1 560 500 130 2000 2.00 1.560 0.340 0.430 264 Crushing of strut
57 H41A0 50.67 560 500 120 2000 0.50 1.290 0.130 0.000 389 Shear Compression
58 H41A1 50.67 560 500 120 2000 0.50 1.290 0.130 0.230 446 Shear Compression
59 H41A2(2) 50.67 560 500 120 2000 0.50 1.290 0.130 0.130 549 Shear Compression
60 H41A3 50.67 560 500 120 2000 0.50 1.290 0.130 0.130 509 Shear Compression
61 H42A2(2) 50.67 560 500 120 2000 0.85 1.290 0.130 0.130 439 Crushing of strut
62 H42B2(2) 50.67 560 500 120 2000 0.85 1.290 0.240 0.240 404 Crushing of strut
63 H42C2(2) 50.67 560 500 120 2000 0.85 1.290 0.370 0.370 419 Crushing of strut
64 H43A0 50.67 560 500 120 2000 1.25 1.290 0.130 0.130 239 Crushing of strut
65 H43A1 50.67 560 500 120 2000 1.25 1.290 0.130 0.130 292 Crushing of strut
66 H43A2(2) 50.67 560 500 120 2000 1.25 1.290 0.130 0.130 310 Crushing of strut
67 H43A3 50.67 560 500 120 2000 1.25 1.290 0.130 0.130 326 flexure failure
68 H45A2(2) 50.67 560 500 120 2000 2.00 1.290 0.130 0.130 185 flexure failure
69 U41A0 73.6 560 500 120 2000 0.50 1.290 0.130 0.130 491 Shear Compression
70 U41A1 73.6 560 500 120 2000 0.50 1.290 0.130 0.130 625 Shear Compression
71 U41A2 73.6 560 500 120 2000 0.50 1.290 0.130 0.130 614 Shear Compression
72 U41A3 73.6 560 500 120 2000 0.50 1.290 0.130 0.130 612 Shear Compression
73 U42A2 73.6 560 500 120 2000 0.85 1.290 0.130 0.130 468 Crushing of strut
74 U42B2 73.6 560 500 120 2000 0.85 1.290 0.240 0.240 460 Crushing of strut
75 U42C2 73.6 560 500 120 2000 0.85 1.290 0.370 0.370 457 Crushing of strut
76 U43A0 73.6 560 500 120 2000 1.25 1.290 0.130 0.130 326 Crushing of strut
77 U43A1 73.6 560 500 120 2000 1.25 1.290 0.130 0.130 347 Crushing of strut
78 U43A2 73.6 560 500 120 2000 1.25 1.290 0.130 0.130 379 Crushing of strut
79 U43A3 73.6 560 500 120 2000 1.25 1.290 0.130 0.130 373 flexure failure
80 U45A2 73.6 560 500 120 2000 2.00 1.290 0.130 0.130 239 flexure failure
81 N33A2 23.72 560 500 120 1500 1.25 1.560 0.120 0.120 236 Crushing of strut
82 N43A2 23.72 560 500 120 2000 1.25 1.560 0.120 0.120 263 Crushing of strut
83 N53A2 23.72 560 500 120 2500 1.25 1.560 0.120 0.120 214 Crushing of strut
84 H31A2 49.1 560 500 120 1500 0.50 1.560 0.120 0.120 771 Shear Compression
85 H32A2 49.1 560 500 120 1500 0.85 1.560 0.120 0.120 548 Crushing of strut
86 H33A2 49.1 560 500 120 1500 1.25 1.560 0.120 0.120 390 Crushing of strut
87 H51A2 49.1 560 500 120 2500 0.50 1.560 0.120 0.120 726 Shear Compression
88 H52A2 49.1 560 500 120 2500 0.85 1.560 0.120 0.120 587 Crushing of strut
89 H53A2 49.1 560 500 120 2500 1.25 1.560 0.120 0.120 375 Crushing of strut
Smith and Vantsiotis
90 0A0-44 20.5 356 305 102 813 0.77 1.490 0.000 0.000 140 Crushing of strut
91 0A0-48 21 356 305 102 813 0.77 1.490 0.000 0.000 136 Crushing of strut
92 1A1-10 18.7 356 305 102 813 0.77 1.490 0.003 0.002 161 Crushing of strut
93 1A3-11 18.1 356 305 102 813 0.77 1.490 0.003 0.005 148 Crushing of strut
94 1A4-12 16.1 356 305 102 813 0.77 1.490 0.003 0.007 141 Crushing of strut
95 1A4-51 20.6 356 305 102 813 0.77 1.490 0.003 0.007 171 Crushing of strut
96 1A6-37 21.1 356 305 102 813 0.77 1.490 0.003 0.009 184 Crushing of strut
97 2A1-38 21.7 356 305 102 813 0.77 1.490 0.006 0.002 175 Crushing of strut
98 2A3-39 19.8 356 305 102 813 0.77 1.490 0.006 0.005 171 Crushing of strut
99 2A4-40 20.3 356 305 102 813 0.77 1.490 0.006 0.007 172 Crushing of strut
100 2A6-41 19.1 356 305 102 813 0.77 1.490 0.006 0.009 162 Crushing of strut
101 3A1-42 18.5 356 305 102 813 0.77 1.490 0.013 0.003 161 Crushing of strut
102 3A3-43 19.2 356 305 102 813 0.77 1.490 0.013 0.005 173 Crushing of strut

183
Reference No
deep beam ID
f`c (Mpa)
h (mm)
d (mm)
b (mm)
le (mm)
a/d
Ρ (%)
ρsv
(%) ρsh (%)
Vu on each load failure mode
103 3A4-45 20.8 356 305 102 813 0.77 1.490 0.013 0.007 179 Crushing of strut
104 3A6-46 19.9 356 305 102 813 0.77 1.490 0.013 0.009 168 Crushing of strut
105 0B0-49 21.7 356 305 102 940 1.01 1.490 0.000 0.000 149 Crushing of strut
106 1B1-01 22.1 356 305 102 940 1.01 1.490 0.002 0.002 147 Crushing of strut
107 1B3-29 20.1 356 305 102 940 1.01 1.490 0.002 0.005 144 Crushing of strut
108 1B4-30 20.8 356 305 102 940 1.01 1.490 0.002 0.007 140 Crushing of strut
109 1B6-31 19.5 356 305 102 940 1.01 1.490 0.002 0.009 153 Crushing of strut
110 2B1-05 19.2 356 305 102 940 1.01 1.490 0.004 0.002 129 Crushing of strut
111 2B3-06 19 356 305 102 940 1.01 1.490 0.004 0.005 131 Crushing of strut
112 2B4-07 17.5 356 305 102 940 1.01 1.490 0.004 0.007 126 Crushing of strut
113 2B4-52 21.8 356 305 102 940 1.01 1.490 0.004 0.007 150 Crushing of strut
114 2B6-32 19.8 356 305 102 940 1.01 1.490 0.004 0.009 145 Crushing of strut
115 3B1-08 16.2 356 305 102 940 1.01 1.490 0.006 0.002 131 Crushing of strut
116 3B1-36 20.4 356 305 102 940 1.01 1.490 0.008 0.002 159 Crushing of strut
117 3B3-33 19 356 305 102 940 1.01 1.490 0.008 0.005 158 Crushing of strut
118 3B4-34 19.2 356 305 102 940 1.01 1.490 0.008 0.007 155 Crushing of strut
119 3B6-35 20.7 356 305 102 940 1.01 1.490 0.008 0.009 166 Crushing of strut
120 4B1-09 17.1 356 305 102 940 1.01 1.490 0.013 0.002 153 Crushing of strut
121 0C0-50 20.7 356 305 102 1118 1.34 1.490 0.000 0.000 116 Crushing of strut
122 1C1-14 19.2 356 305 102 1118 1.34 1.490 0.002 0.002 119 Crushing of strut
123 1C3-02 21.9 356 305 102 1118 1.34 1.490 0.002 0.005 123 Crushing of strut
124 1C4-15 22.7 356 305 102 1118 1.34 1.490 0.002 0.007 131 Crushing of strut
125 1C6-16 21.8 356 305 102 1118 1.34 1.490 0.002 0.009 122 Crushing of strut
126 2C1-17 19.9 356 305 102 1118 1.34 1.490 0.003 0.002 124 Crushing of strut
127 2C3-03 19.2 356 305 102 1118 1.34 1.490 0.003 0.005 104 Crushing of strut
128 2C3-27 19.3 356 305 102 1118 1.34 1.490 0.003 0.005 115 Crushing of strut
129 2C4-18 20.44 356 305 102 1118 1.34 1.490 0.003 0.007 125 Crushing of strut
130 2C6-19 20.8 356 305 102 1118 1.34 1.490 0.003 0.009 124 Crushing of strut
131 3C1-20 21 356 305 102 1118 1.34 1.490 0.006 0.002 141 Crushing of strut
132 3C3-21 16.5 356 305 102 1118 1.34 1.490 0.006 0.005 125 Crushing of strut
133 3C4-22 18.3 356 305 102 1118 1.34 1.490 0.006 0.007 128 Crushing of strut
134 3C6-23 19 356 305 102 1118 1.34 1.490 0.006 0.009 137 Crushing of strut
135 4C1-24 19.6 356 305 102 1118 1.34 1.490 0.008 0.002 147 Crushing of strut
136 4C3-04 18.5 356 305 102 1118 1.34 1.490 0.006 0.005 129 Crushing of strut
137 4C3-28 19.2 356 305 102 1118 1.34 1.490 0.008 0.005 152 Crushing of strut
138 4C4-25 18.5 356 305 102 1118 1.34 1.490 0.008 0.007 153 Crushing of strut
139 4C6-26 21.2 356 305 102 1118 1.34 1.490 0.008 0.009 159 Crushing of strut
140 0D0-47 19.5 356 305 102 1473 2.01 1.490 0.000 0.000 73 Crushing of strut
141 4D1-13 16.1 356 305 102 1473 2.01 1.490 0.004 0.002 87 Crushing of strut Walraven
and Lehwalter
142 V711 18.1 200 160 250 680 1.00 1.100 0.000 0.000 165 flexure failure
143 V022 19.9 400 360 250 1030 1.00 1.100 0.000 0.000 270 Crushing of strut
144 V511 19.8 600 560 250 1380 1.00 1.100 0.000 0.000 350 Crushing of strut
145 V411 19.4 800 740 250 1780 1.00 1.100 0.000 0.000 365 Crushing of strut
146 V711/4 19.5 200 160 250 680 1.00 1.100 0.150 0.000 207 flexure failure
147 V022/4 18.2 400 360 250 1030 1.00 1.100 0.150 0.000 317 Crushing of strut
148 V511/4 18.7 600 560 250 1380 1.00 1.100 0.150 0.000 465 Crushing of strut
149 V411/4 17 800 740 250 1780 1.00 1.100 0.150 0.000 467 Crushing of strut
150 V711/3 19.6 200 160 250 680 1.00 1.100 0.300 0.000 380 flexure failure
151 V022/3 19.6 400 360 250 1030 1.00 1.100 0.300 0.000 380 Crushing of strut
152 V511/3 21.3 600 560 250 1380 1.00 1.100 0.300 0.000 580 Crushing of strut
153 V411/3 19.8 800 740 250 1780 1.00 1.100 0.300 0.000 665 Crushing of strut

184
Reference No
deep beam ID
f`c (Mpa)
h (mm)
d (mm)
b (mm)
le (mm)
a/d
Ρ (%)
ρsv
(%) ρsh (%)
Vu on each load
failure mode
Tan et all 154 I-1/0.75 56.3 500 442.5 110 1750 0.85 2.580 0.000 0.000 500 Diagonal splitting
155 I-2N/0.75 56.2 500 442.5 110 1750 0.85 2.580 2.860 0.000 760 Crushing of strut
156 I-3/0.75 59.2 500 442.5 110 1750 0.85 2.580 0.000 1.590 560 Crushing of strut
157 I-4/0.75 63.8 500 442.5 110 1750 0.85 2.580 0.000 1.590 580 Shear Compression
158 I-5/0.75 57.6 500 442.5 110 1750 0.85 2.580 0.000 3.170 775 Crushing of strut
159 I-6S/0.75 59.7 500 442.5 110 1750 0.85 2.580 2.860 1.590 775 Diagonal splitting
160 II-1/1.00 77.6 500 442.5 110 2000 1.13 2.580 0.000 0.000 255 Diagonal splitting
161 II-2N/1.0 77.6 500 442.5 110 2000 1.13 2.580 1.430 0.000 520 Diagonal splitting
162 II-3/1.00 78 500 442.5 110 2000 1.13 2.580 0.000 1.590 390 Diagonal splitting
163 II-4/1.00 86.3 500 442.5 110 2000 1.13 2.580 0.000 1.590 330 Diagonal splitting
164 II-5/1.00 86.3 500 442.5 110 2000 1.13 2.580 0.000 3.170 470 Diagonal splitting
165 II-6N/1.00 75.3 500 442.5 110 2000 1.13 2.580 1.430 1.590 670 Crushing of strut
166 III-1/1.50 77.6 500 442.5 110 2500 1.69 2.580 0.000 0.000 185 Diagonal splitting
167 III-2N/1.50 77.6 500 442.5 110 2500 1.69 2.580 1.430 0.000 335 Diagonal splitting
168 III-2S/1.50 77.6 500 442.5 110 2500 1.69 2.580 1.430 0.000 400 Shear Compression
169 III-3/1.50 78 500 442.5 110 2500 1.69 2.580 0.000 1.590 200 Diagonal splitting
170 III-4/1.50 86.3 500 442.5 110 2500 1.69 2.580 0.000 1.590 190 Diagonal splitting
171 III-5/1.50 86.3 500 442.5 110 2500 1.69 2.580 0.000 3.170 265 Diagonal splitting
172 III-6N/1.50 78.9 500 442.5 110 2500 1.69 2.580 1.430 1.590 460 Shear Compression
Tan et all 173 1-2.00/0.75 71.2 500 448.2 110 1750 0.84 2.000 0.480 0.000 545 Shear Compression
174 1-2.00/1.00 71.2 500 448.2 110 2000 1.12 2.000 0.480 0.000 500 Shear Compression
175 1-2.00/1.50 72.1 500 448.2 110 2500 1.67 2.000 0.480 0.000 250 Diagonal splitting
176 1-2.00/2.50 74.1 500 448.2 110 3500 2.79 2.000 0.480 0.000 195 flexure failure
177 2-2.58/0.25 69.9 500 442.5 110 1250 0.28 2.580 0.480 0.000 835 Shear Compression
178 2-2.58/0.50 64.6 500 442.5 110 1500 0.56 2.580 0.480 0.000 740 Shear Compression
179 2-2.58/0.75 64.6 500 442.5 110 1750 0.85 2.580 0.480 0.000 530 Shear Compression
180 2-2.58/1.00 68.1 500 442.5 110 2000 1.13 2.580 0.480 0.000 250 Diagonal splitting
181 2-2.58/1.50 68.1 500 442.5 110 2500 1.69 2.580 0.480 0.000 150 Diagonal splitting
182 2-2.58/2.00 69.9 500 442.5 110 3000 2.26 2.580 0.480 0.000 130 Diagonal splitting
183 2-2.58/2.50 54.7 500 442.5 110 3500 2.82 2.580 0.480 0.000 155 flexure failure
184 3-4.08/0.25 69.9 500 420 110 1250 0.30 4.080 0.480 0.000 925 Shear Compression
185 3-4.08/0.50 64.6 500 420 110 1500 0.60 4.080 0.480 0.000 720 Shear Compression
186 3-4.08/0.75 64.6 500 420 110 1750 0.89 4.080 0.480 0.000 670 Shear Compression
187 3-4.08/1.00 68.1 500 420 110 2000 1.19 4.080 0.480 0.000 520 Crushing of strut
188 3-4.08/1.50 68.1 500 420 110 2500 1.79 4.080 0.480 0.000 150 Diagonal splitting
189 3-4.08/2.00 69.9 500 420 110 3000 2.38 4.080 0.480 0.000 190 Diagonal splitting
190 3-4.08/2.50 54.8 500 420 110 3500 2.98 4.080 0.480 0.000 135 flexure failure
191 4-5.80/0.75 71.2 500 397.5 110 1750 0.94 5.800 0.480 0.000 700 Crushing of strut
192 4-5.80/1.00 71.2 500 397.5 110 2000 1.26 5.800 0.480 0.000 530 Shear Compression
193 4-5.80/1.50 72.1 500 397.5 110 2500 1.89 5.800 0.480 0.000 390 Diagonal splitting
194 4-5.80/2.50 74.1 500 397.5 110 3500 3.14 5.800 0.480 0.000 265 flexure failure

185
Reference No
deep beam ID
f`c (Mpa)
h (mm)
d (mm)
b (mm)
le (mm)
a/d
Ρ (%)
ρsv
(%) ρsh (%)
Vu on each load
failure mode
Foster and Gilbert
195 B1.2-1 91 1200 1124 125 1450 0.76 1.281 0.604 0.259 1000 Crushing of strut
196 B1.2-2 96 1200 1124 125 1450 0.76 1.281 0.604 0.259 1000 Crushing of strut
197 B1.2-3 80 1200 1124 125 1450 0.76 1.281 0.604 0.259 1300 shear-flexure failure
198 B1.2-4 80 1200 1124 125 1450 0.76 1.281 0.604 0.259 1050 Crushing of strut
199 B2.0-1 83 700 624 125 1400 1.32 2.308 0.604 0.340 795 shear-flexure failure
200 B2.0-2 120 700 624 125 1400 1.32 2.308 0.604 0.340 825 flexure failure
201 B2.0-3 78 700 624 125 1400 1.32 2.308 0.604 0.340 700 flexure failure
202 B2.0A-4 86 700 624 125 1400 0.88 2.308 0.604 0.340 950 flexure failure
203 B2.0B-5 89 700 624 125 1400 1.32 2.308 0.000 0.000 585 flexure failure
204 B2.0C-6 93 700 624 125 1400 1.32 2.308 0.906 0.000 730 flexure failure
205 B2.0D-7 104 700 624 125 1400 1.32 2.308 0.604 0.000 720 flexure failure
206 B3.0-1 80 700 624 125 2100 1.88 2.308 0.604 0.340 510 flexure failure
207 B3.0-2 120 700 624 125 2100 1.88 2.308 0.604 0.340 525 flexure failure
208 B3.0-3 77 700 624 125 2100 1.88 2.308 0.604 0.340 525 flexure failure
209 B3.0A-4 88 700 624 125 2100 1.28 2.308 0.604 0.340 775 flexure failure
210 B3.0B-5 89 700 624 125 2100 1.88 2.308 0.000 0.000 435 flexure failure
Shin et all 211 MHB1.5-0 52 250 215 125 645 1.50 3.770 0.000 0.000 131 flexure failure
212 MHB1.5-25 52 250 215 125 645 1.50 3.770 0.450 0.000 182 Diagonal splitting
213 MHB1.5-50 52 250 215 125 645 1.50 3.770 0.910 0.000 242 Diagonal splitting
214 MHB1.5-75 52 250 215 125 645 1.50 3.770 1.360 0.000 279 Shear Compression
215 MHB1.5-100 52 250 215 125 645 1.50 3.770 1.810 0.000 299 Shear Compression
216 MHB2.0-0 52 250 215 125 645 2.00 3.770 0.000 0.000 102 flexure failure
217 MHB2.0-25 52 250 215 125 645 2.00 3.770 0.450 0.000 129 Diagonal splitting
218 MHB2.0-50 52 250 215 125 645 2.00 3.770 0.910 0.000 202 Diagonal splitting
219 MHB2.0-75 52 250 215 125 645 2.00 3.770 1.360 0.000 216 Shear Compression
220 MHB2.0-100 52 250 215 125 645 2.00 3.770 1.810 0.000 225 Shear Compression
221 MHB2.5-0 52 250 215 125 645 2.50 3.770 0.000 0.000 66 flexure failure
222 MHB2.5-25 52 250 215 125 645 2.50 3.770 0.450 0.000 115 Diagonal splitting
223 MHB2.5-50 52 250 215 125 645 2.50 3.770 0.910 0.000 161 Diagonal splitting
224 MHB2.5-75 52 250 215 125 645 2.50 3.770 1.360 0.000 185 Shear Compression
225 MHB2.5-100 52 250 215 125 645 2.50 3.770 1.810 0.000 191 Shear Compression
226 HB1.5-0 73 250 215 125 645 1.50 3.770 0.000 0.000 165 flexure failure
227 HB1.5-25 73 250 215 125 645 1.50 3.770 0.450 0.000 249 Diagonal splitting
228 HB1.5-50 73 250 215 125 645 1.50 3.770 0.910 0.000 286 Diagonal splitting
229 HB1.5-75 73 250 215 125 645 1.50 3.770 1.360 0.000 309 Shear Compression
230 HB1.5-100 73 250 215 125 645 1.50 3.770 1.810 0.000 326 Shear Compression
231 HB2.0-0 73 250 215 125 645 2.00 3.770 0.000 0.000 116 flexure failure
232 HB2.0-25 73 250 215 125 645 2.00 3.770 0.450 0.000 166 Diagonal splitting
233 HB2.0-50 73 250 215 125 645 2.00 3.770 0.910 0.000 228 Diagonal splitting
234 HB2.0-75 73 250 215 125 645 2.00 3.770 1.360 0.000 268 Shear Compression
235 HB2.0-100 73 250 215 125 645 2.00 3.770 1.810 0.000 282 Shear Compression
236 HB2.5-0 73 250 215 125 645 2.50 3.770 0.000 0.000 93 flexure failure
237 HB2.5-25 73 250 215 125 645 2.50 3.770 0.450 0.000 134 Diagonal splitting
238 HB2.5-50 73 250 215 125 645 2.50 3.770 0.910 0.000 173 Diagonal splitting
239 HB2.5-75 73 250 215 125 645 2.50 3.770 1.360 0.000 194 Shear Compression
240 HB2.5-100 73 250 215 125 645 2.50 3.770 1.810 0.000 214 Shear Compression
Yang et all 241 L5-40 31.4 400 355 160 1000 0.56 1.000 0.000 0.000 447 Crushing of strut
242 L5-60 31.4 600 555 160 2100 0.54 0.980 0.000 0.000 535 Crushing of strut
243 L5-60R 31.4 600 555 160 1500 0.54 0.980 0.000 0.000 479 Crushing of strut
244 L5-75 31.4 750 685 160 1350 0.55 1.000 0.000 0.000 597 Crushing of strut
245 L5-100 31.4 1000 935 160 1600 0.53 0.900 0.000 0.000 582 Crushing of strut
246 L10-40 31.4 400 355 160 1400 1.13 1.000 0.000 0.000 192 Crushing of strut
247 L10-40R 31.4 400 355 160 1400 1.13 1.000 0.000 0.000 312 Crushing of strut
238 HB2.5-50 73 250 215 125 645 2.50 3.770 0.910 0.000 173 Diagonal splitting
239 HB2.5-75 73 250 215 125 645 2.50 3.770 1.360 0.000 194 Shear Compression
240 HB2.5-100 73 250 215 125 645 2.50 3.770 1.810 0.000 214 Shear Compression

186
Reference No
deep beam ID
f`c (Mpa)
h (mm)
d (mm)
b (mm)
le (mm)
a/d
Ρ (%)
ρsv
(%) ρsh (%)
Vu on each load
failure mode
Yang et all 241 L5-40 31.4 400 355 160 1000 0.56 1.000 0.000 0.000 447 Crushing of strut
242 L5-60 31.4 600 555 160 2100 0.54 0.980 0.000 0.000 535 Crushing of strut
243 L5-60R 31.4 600 555 160 1500 0.54 0.980 0.000 0.000 479 Crushing of strut
244 L5-75 31.4 750 685 160 1350 0.55 1.000 0.000 0.000 597 Crushing of strut
245 L5-100 31.4 1000 935 160 1600 0.53 0.900 0.000 0.000 582 Crushing of strut
246 L10-40 31.4 400 355 160 1400 1.13 1.000 0.000 0.000 192 Crushing of strut
247 L10-40R 31.4 400 355 160 1400 1.13 1.000 0.000 0.000 312 Crushing of strut
238 HB2.5-50 73 250 215 125 645 2.50 3.770 0.910 0.000 173 Diagonal splitting
239 HB2.5-75 73 250 215 125 645 2.50 3.770 1.360 0.000 194 Shear Compression
240 HB2.5-100 73 250 215 125 645 2.50 3.770 1.810 0.000 214 Shear Compression
Yang et all 241 L5-40 31.4 400 355 160 1000 0.56 1.000 0.000 0.000 447 Crushing of strut
242 L5-60 31.4 600 555 160 2100 0.54 0.980 0.000 0.000 535 Crushing of strut
243 L5-60R 31.4 600 555 160 1500 0.54 0.980 0.000 0.000 479 Crushing of strut
244 L5-75 31.4 750 685 160 1350 0.55 1.000 0.000 0.000 597 Crushing of strut
245 L5-100 31.4 1000 935 160 1600 0.53 0.900 0.000 0.000 582 Crushing of strut
246 L10-40 31.4 400 355 160 1400 1.13 1.000 0.000 0.000 192 Crushing of strut
247 L10-40R 31.4 400 355 160 1400 1.13 1.000 0.000 0.000 312 Crushing of strut
248 L10-60 31.4 600 555 160 2100 1.08 0.980 0.000 0.000 375 Crushing of strut
249 L10-75 31.4 750 685 160 2100 1.09 1.000 0.000 0.000 272 Crushing of strut
250 L10-75R 31.4 750 685 160 2100 1.09 1.000 0.000 0.000 330 Crushing of strut
251 L10-100 31.4 1000 935 160 2600 1.07 0.900 0.000 0.000 544 Crushing of strut
252 UH5-40 78.5 400 355 160 1000 0.56 1.000 0.000 0.000 733 Crushing of strut
253 UH5-60 78.5 600 555 160 2100 0.54 0.980 0.000 0.000 823 Crushing of strut
254 UH5-75 78.5 750 685 160 1350 0.55 1.000 0.000 0.000 1010 Crushing of strut
255 UH5-100 78.5 1000 935 160 1600 0.53 0.900 0.000 0.000 1029 Crushing of strut
256 UH10-40 78.5 400 355 160 1400 1.13 1.000 0.000 0.000 499 Crushing of strut
257 UH10-40R 78.5 400 355 160 1400 1.13 1.000 0.000 0.000 385 Crushing of strut
258 UH10-60 78.5 600 555 160 2100 1.08 0.980 0.000 0.000 573 Crushing of strut
259 UH10-75 78.5 750 685 160 2100 1.09 1.000 0.000 0.000 338 Crushing of strut
260 UH10-75R 78.5 750 685 160 2100 1.09 1.000 0.000 0.000 361 Crushing of strut
261 UH10-100 78.5 1000 935 160 2600 1.07 0.900 0.000 0.000 769 Crushing of strut
Kong and Rangan
262 S1-1 63.6 350 292 250 1960 2.50 2.803 0.157 0.000 228 Crushing of strut
263 S1-2 63.6 350 292 250 1960 2.50 2.803 0.157 0.000 208 Crushing of strut
264 S1-3 63.6 350 292 250 1960 2.50 2.803 0.157 0.000 206 Crushing of strut
265 S1-4 63.6 350 292 250 1960 2.50 2.803 0.157 0.000 278 Crushing of strut
266 S1-5 63.6 350 292 250 1960 2.50 2.803 0.157 0.000 253 Crushing of strut
267 S1-6 63.6 350 292 250 1960 2.50 2.803 0.157 0.000 224 Crushing of strut
268 S2-1 72.5 350 292 250 1960 2.50 2.803 0.105 0.000 260 Crushing of strut
269 S2-2 72.5 350 292 250 1960 2.50 2.803 0.126 0.000 233 Crushing of strut
270 S2-3 72.5 350 292 250 1960 2.50 2.803 0.157 0.000 253 Crushing of strut
271 S2-4 72.5 350 292 250 1960 2.50 2.803 0.157 0.000 219 Crushing of strut
272 S2-5 72.5 350 292 250 1960 2.50 2.803 0.209 0.000 282 Crushing of strut
273 S2-6 72.5 350 292 250 1960 2.50 2.803 0.262 0.000 359 flexure failure
274 S3-1 67.4 350 297 250 1980 2.49 1.659 0.101 0.000 209 Crushing of strut
275 S3-2 67.4 350 297 250 1980 2.49 1.659 0.101 0.000 178 Crushing of strut
276 S3-3 67.4 350 293 250 1960 2.49 2.793 0.101 0.000 229 Crushing of strut
277 S3-4 67.4 350 293 250 1960 2.49 2.793 0.101 0.000 175 Crushing of strut
278 S3-5 67.4 350 299 250 1940 2.41 3.692 0.101 0.000 297 Crushing of strut
279 S3-6 67.4 350 299 250 1940 2.41 3.692 0.101 0.000 283 Crushing of strut
280 S4-1 87.3 600 542 250 3100 2.40 3.020 0.157 0.000 354 Crushing of strut
281 S4-2 87.3 500 444 250 2640 2.41 2.959 0.157 0.000 573 Crushing of strut
282 S4-3 87.3 400 346 250 2160 2.40 2.849 0.157 0.000 243 Crushing of strut
283 S4-4 87.3 350 292 250 1960 2.50 2.803 0.157 0.000 258 Crushing of strut
284 S4-5 87.3 300 248 250 1680 2.38 2.968 0.157 0.000 321 flexure failure

187
Reference
No deep beam ID
f`c (Mpa)
h (mm)
d (mm)
b (mm)
le (mm)
a/d
Ρ (%)
ρsv
(%) ρsh (%)
Vu on each load
failure mode
285 S4-6 87.3 250 198 250 1500 2.53 2.788 0.157 0.000 203 Crushing of strut
286 S5-1 89.4 350 292 250 2260 3.01 2.803 0.157 0.000 242 Crushing of strut
287 S5-2 89.4 350 292 250 2100 2.74 2.803 0.157 0.000 260 Crushing of strut
288 S5-3 89.4 350 292 250 1960 2.50 2.803 0.157 0.000 244 Crushing of strut
289 S5-4 89.4 350 292 250 1660 1.99 2.803 0.157 0.000 477 Crushing of strut
290 S5-5 89.4 350 292 250 1520 1.75 2.803 0.157 0.000 573 Crushing of strut
291 S5-6 89.4 350 292 250 1380 1.51 2.803 0.157 0.000 648 flexure failure
292 S7-1 74.8 350 294 250 2440 3.30 4.468 0.105 0.000 217 Crushing of strut
293 S7-2 74.8 350 294 250 2440 3.30 4.468 0.126 0.000 205 Crushing of strut
294 S7-3 74.8 350 294 250 2440 3.30 4.468 0.157 0.000 247 Crushing of strut
295 S7-4 74.8 350 294 250 2440 3.30 4.468 0.196 0.000 274 Crushing of strut
296 S7-5 74.8 350 294 250 2440 3.30 4.468 0.224 0.000 304 Crushing of strut
297 S7-6 74.8 350 294 250 2440 3.30 4.468 0.262 0.000 311 Crushing of strut
298 S8-1 74.6 350 292 250 1960 2.50 2.803 0.105 0.000 272 Crushing of strut
299 S8-2 74.6 350 292 250 1960 2.50 2.803 0.126 0.000 251 Crushing of strut
300 S8-3 74.6 350 292 250 1960 2.50 2.803 0.157 0.000 310 Crushing of strut
301 S8-4 74.6 350 292 250 1960 2.50 2.803 0.157 0.000 266 Crushing of strut
302 S8-5 74.6 350 292 250 1960 2.50 2.803 0.196 0.000 289 Crushing of strut
303 S8-6 74.6 350 292 250 1960 2.50 2.803 0.224 0.000 284 Crushing of strut
Aguilar et all
304 ACI-I 28 915 791 305 4020 1.16 1.094 0.305 0.458 1357 flexure failure
305 STM-I 28 915 719 305 4020 1.27 1.094 0.305 0.153 1134 flexure failure
306 STM-H 28 915 801 305 4020 1.14 1.094 0.305 0.103 1285 Crushing of strut
307 STM-M 28 915 801 305 4020 1.14 1.094 0.305 0.000 1277 Crushing of strut
Tan et all 308 A-0.27-2.15 58.84 500 463 110 1000 0.27 1.230 0.480 0.000 675 Crushing of strut
309 A-0.27-3.23 51.62 500 463 110 1500 0.27 1.230 0.480 0.000 630 Crushing of strut
310 A-0.27-4.30 53.85 500 463 110 2000 0.27 1.230 0.480 0.000 640 Crushing of strut
311 A-0.27-5.38 57.31 500 463 110 2500 0.27 1.230 0.480 0.000 630 Crushing of strut
312 B-0.54-2.15 55.98 500 463 110 1000 0.54 1.230 0.480 0.000 468 Crushing of strut
313 B-0.54-3.23 45.68 500 463 110 1500 0.54 1.230 0.480 0.000 445 Crushing of strut
314 B-0.54-4.30 53.85 500 463 110 2000 0.54 1.230 0.480 0.000 500 Crushing of strut
315 B-0.54-5.38 52.99 500 463 110 2500 0.54 1.230 0.480 0.000 480 Crushing of strut
316 C-0.81-2.15 51.15 500 463 110 1000 0.81 1.230 0.480 0.000 403 Crushing of strut
317 C-0.81-3.23 43.96 500 463 110 1500 0.81 1.230 0.480 0.000 400 Crushing of strut
318 D-1.08-2.15 48.2 500 463 110 1000 1.08 1.230 0.480 0.000 270 Crushing of strut
319 D-1.08-3.23 44.12 500 463 110 1500 1.08 1.230 0.480 0.000 280 shear-flexure
320 D-1.08-4.30 46.81 500 463 110 2000 1.08 1.230 0.480 0.000 290 shear-flexure
321 D-1.08-5.38 48.03 500 463 110 2500 1.08 1.230 0.480 0.000 290 flexure failure
322 E-1.62-3.23 50.56 500 463 110 1500 1.62 1.230 0.480 0.000 290 Crushing of strut
323 E-1.62-4.30 44.6 500 463 110 2000 1.62 1.230 0.480 0.000 190 shear-flexure
324 E-1.62-5.38 45.33 500 463 110 2500 1.62 1.230 0.480 0.000 173 flexure failure
325 F-2.16-4.30 41.06 500 463 110 2000 2.16 1.230 0.480 0.000 150 shear-flexure
326 G-2.70-5.38 42.8 500 463 110 2500 2.70 1.230 0.480 0.000 105 shear-flexure Marco Rigotti
327 B150S6 28.9 356 305 95 1269 1.87 3.710 0.390 0.000 186 Crushing of strut
328 B250S6 34.5 356 305 95 1269 1.87 3.710 0.390 0.000 248 Crushing of strut
329 B350S6 28.9 356 305 95 1269 1.87 3.710 0.390 0.000 211 Crushing of strut
330 B150S19 28.9 356 305 95 1269 1.87 3.710 0.000 0.000 178 Crushing of strut
331 B250S19 28.9 356 305 95 1269 1.87 3.710 0.000 0.000 189 Crushing of strut
332 B350S19 25.5 356 305 95 1269 1.87 3.710 0.000 0.000 156 Crushing of strut
333 B160S6 28.9 356 305 95 1549 2.33 3.710 0.390 0.000 196 Crushing of strut
334 B260S6 28.9 356 305 95 1549 2.33 3.710 0.390 0.000 186 Crushing of strut
335 B360S6 34.5 356 305 95 1549 2.33 3.710 0.390 0.000 178 Crushing of strut
336 B160S25 16.5 356 305 95 1549 2.33 3.710 0.000 0.000 85 Crushing of strut
337 B260S25 34.5 356 305 95 1549 2.33 3.710 0.000 0.000 178 Crushing of strut

188
Reference
No deep beam ID
f`c (Mpa)
h (mm)
d (mm)
b (mm)
le (mm)
a/d
Ρ (%)
ρsv
(%) ρsh (%)
Vu on each load
failure mode
Garay & Lubell
338 MS1-1 46 607 501 300 1700 1.19 0.520 0.333 0.241 626 flexure failure
339 MS1-2 44 607 503 300 1700 1.19 1.130 0.333 0.412 1071 flexure failure
340 MS1-3 44 607 506 300 1700 1.19 2.290 0.333 0.237 1374 Diagonal splitting
341 MS2-2 47 607 503 300 2300 1.79 1.130 0.333 0.412 716 flexure failure
342 MS2-3 43 607 506 300 2300 1.79 2.290 0.333 0.403 1028 flexure-splitting strut
343 MS3-2 48 607 503 300 2900 2.38 1.130 0.444 0.412 577 flexure failure
344 NS1-4 23 607 507 300 1700 1.18 1.770 0.262 0.412 784 Diagonal splitting
345 NS2-4 25 607 507 300 2300 1.80 1.770 0.430 0.412 206 Diagonal splitting
346 MW1-2 39 607 503 300 1700 1.19 1.130 0.000 0.412 784 flexure-splitting strut
347 MW3-2 43 607 503 300 2900 2.38 1.130 0.000 0.412 539 flexure failure

189
Appendix B: An example for application of the STM provisions of the Canadian Code:
To illustrate the procedure of calculating the ultimate shear strength and prediction of
failure location for specimen No II-5/1.00 in the experimental study Tan et al. [1997a] by
the Canadian Code Fig.A-1.
After selecting the appropriate truss model according to the number of loading points, the
height of bottom node can be calculated by
= ( (A1.1)
where H is the beam height and is the effective depth
= (5 44 5 = 115
500
4 bars
#6
Dia.10 mm
high-strength
deformed bars
442
1102000
PL 150X110500
PL 100X110PL 100X110
Fig. (A-1) The Detailing of Beam No II-5/1.00 (Tan et al. [1997a]).
Since C=T and to limit stresses in the nodal zones the height of top node is produced
=
=
115 = 1 1 47
Due to those dimensions the strut angle α can be determined
= t ( / /

190
= t (44 5 1 1 47/ /5 5 = 8 7
which is not to exceed the minimum allowable angle which is = + 7 = 7 .
According Equations (11-22) and (11-23) of Canadian code CSA A23.3-04, the limiting
compressive stress in strut has been calculated as 31.14 /
Also the width of the strut at the top and bottom nodes can be calculated as
= ( cos + ( s
= (1 1 47 cos 8 7 + (15 s 8 7 = 17 7
= ( cos + ( s
= (115 cos 8 7 + (1 s 8 7 = 15
The strut strength is governed by the least strut width
=
where is beam width
= 1 14 15 11 1 = 5 1 5
The maximum magnitude of the applied load predicted from the strut strength can be expressed
as follows
1 = s
1 = 5 1 5 s 8 7 = 1 48
The stresses at the top nod is calculated at both faces vertical and horizontal as follows
= 85

191
where is Material safety factor is 0.65
= 85 5 8 1 1 47 11 1 = 5
= 85
= 85 5 8 15 11 1 = 78 7
The applied load predicted from the top node can be expressed as follows
= t
= 5 t 8 7 = 7 47
= = 78 7
Also the stresses at bottom nod is calculated at both faces, vertical and horizontal, as follows
= 75
= 75 5 8 115 11 1 = 5
= 75
= 75 5 8 1 11 1 = 4 78
The applied load predicted from the bottom node can be expressed as follows
4 = t
4 = 5 t 8 7 = 7 47
5 = = 78 7
The tie strength equal to
= 85

192
where As is the area of longitudinal steel reinforcement and fy is yield strength of steel
= 85 1 55 4 8 1 = 5 1 5
= t
= 5 1 5 t 8 7 = 78
The ultimate load that can be applied to the beam is governed by P1 which is the least
value of the P that calculated from the strength of different elements of the truss in STM.
Also the failure occurred at that location corresponding to the element with the least
strength. In this case, the results indicate that the beam will fail by strut crushing at
ultimate shear strength Vcalc equal to 321.48 KN.
For calculating the nominal capacity, the resistance factors and are taken as 1.0 in the
above procedure.