material laws of frp strengthened reinforced
TRANSCRIPT

MATERIAL LAWS OF FRP STRENGTHENED REINFORCED
CONCRETE UNDER UNIAXIAL TENSION AND BIAXIAL
TENSION-COMPRESSION STRESS FIELDS
A Dissertation
Presented to
the Faculty of the Department of Civil and Environmental Engineering
University of Houston
In Partial Fulfillment
of the Requirements for the Degree
Doctor of Philosophy
in Civil Engineering
by
Guang Yang
August 2015

MATERIAL LAWS OF FRP STRENGTHENED REINFORCED
CONCRETE UNDER UNIAXIAL TENSION AND BIAXIAL
TENSION-COMPRESSION STRESS FIELDS
Guang Yang
Approved:
Chair of the Committee
Dr. Abdeldjelil Belarbi, Hugh Roy and
Lillie Cranz Cullen Distinguished Professor,
Civil and Environmental Engineering
Committee Members:
Dr. Ashraf Ayoub, Professor and Royal
Academy of Eng. Pell Frischmann Chair,
Civil Engineering,
City University London
Dr. Yi-Lung Mo, Professor,
Civil and Environmental Engineering
Dr. Bora Gencturk, Assistant Professor,
Civil and Environmental Engineering
Dr. Lu Gao, Assistant Professor,
Construction Management
Dr. Suresh K. Khator, Associate Dean, Cullen College of Engineering
Dr. Roberto Ballarini
Thomas and Laura Hsu Professor and Chair,
Civil and Environmental Engineering

iv
ACKNOWLEDGMENTS
I would like to express great gratitude and respect to my advisor, Prof. Abdeldjelil
Belarbi, for his patience, support and advice throughout this research study. Special thanks
are given to other committee members Prof. Ashraf Ayoub, Prof. Yi-Lung Mo, Prof. Bora
Gencturk, and Prof. Lu Gao for their criticism and advices.
The experiments in this dissertation were funded by the National Science
Foundation Grant No. 1100930. Steel reinforcements and FRP materials were donated by
Gerdau Ameristeel Co. and Fyfe Co., respectively. Their support is greatly acknowledged.
I would like to acknowledge my colleague Mehdi Zomorodian for his help during
the experimental tests. Special thanks are given to the lab technicians Gerald McTigret and
Jeffrey Miller for their support and guidance on lab work. Also, I would like to thank my
colleagues Moheb Labib, and Yashar Moslehy for their advice and guidance on the Panel
Tester operation. Special thanks are also given to my undergraduate helpers: Ridwan Ajala,
Mohammad Amini, Diego Salinas, Andres Villarreal, Damilola Sanni, Jaime Haro, and
Ayatullah Muhammad for their help.
Finally, I would like to sincerely thank my wife, Shuang Zhou, my mom, and my
friends for their love and support during my study, without which this dissertation would
not have been possible.

v
MATERIAL LAWS OF FRP STRENGTHENED REINFORCED
CONCRETE UNDER UNIAXIAL TENSION AND BIAXIAL
TENSION-COMPRESSION STRESS FIELDS
An Abstract
of a
Dissertation
Presented to
the Faculty of the Department of Civil and Environmental Engineering
University of Houston
In Partial Fulfillment
of the Requirements for the Degree
Doctor of Philosophy
in Civil Engineering
by
Guang Yang
August 2015

vi
ABSTRACT
Well established analytical models and design guidelines are already available for
analyzing and designing FRP strengthened structures under flexural and axial-confinement
actions. However, the understanding of the behavior of such members under in-plane stress
field remains a subject of on-going discussion among several researchers and practitioners.
Several analytical models have been proposed to predict the gain and upgrade of shear
capacity due to FRP strengthening, among which, most models resulted in large
discrepancies and produced large scatter when compared to experimental database. This is
due to the lack of accurate constitutive models for strengthened reinforced concrete (RC)
with FRP (FRP-RC) members. An efficient method to study the overall response of an RC
member is to identify the characteristic behavior and the contribution of each material
constituting the structure, the behavior of that specific element can be predicted by taking
into account the inherent characteristics and material laws of the constituents that leads to
understanding the global shear response of the structure.
As a first step of developing a shear model of FRP-RC elements, constitutive laws
of each material component, namely concrete, steel reinforcement, and FRP sheets were
studied in this research project through experimental and analytical investigations. Thirteen
full-scale prismatic specimens and six full-scale panels were tested using the Universal
Panel Tester (UPT) to study the stress-strain relationships of concrete, steel and FRP in
tension as well as concrete in compression and the Poisson effect resulting from the biaxial
loading. The results indicate that compared to the un-strengthened RC element, the
presence of the externally bonded FRP material typically alters the main characteristics of

vii
the stress-strain relationships for each components in FRP-RC element. These newly
developed material laws will be used to further develop a model to predict the behavior of
FRP strengthened RC elements subjected to shear and torsion. The results from both
experimental and analytical study in this research project will provide a promising
contribution to the prediction of the behavior of FRP-RC members under shear that will
ultimately improve the accuracy of the available design guidelines.

viii
TABLE OF CONTENTS
ACKNOWLEDGMENTS ................................................................................................. iv
ABSTRACT ....................................................................................................................... vi
TABLE OF CONTENTS ................................................................................................. viii
LIST OF FIGURES ......................................................................................................... xiv
LIST OF TABLES ........................................................................................................... xix
NOTATIONS .................................................................................................................... xx
CHAPTER 1 INTRODUCTION ..................................................................................... 1
1.1 GENERAL ........................................................................................................... 1
1.2 PROBLEM DEFINITION AND RESEARCH APPROACH ............................. 3
1.3 RESEARCH OBJECTIVES ................................................................................ 8
1.4 OUTLINE OF DISSERTATION ......................................................................... 8
CHAPTER 2 LITERATURE REVIEW ........................................................................ 10
2.1 INTRODUCTION .............................................................................................. 10
2.2 STUDIES ON SHEAR STRENGTHENING USING FRP ............................... 10
2.2.1 General ........................................................................................................ 10
2.2.2 Shear Models for FRP RC Members .......................................................... 12
2.2.2.1 Models Based on the Truss Model Approaches ........................................ 14
2.2.2.2 Models Based on the Non-uniform Strain Distribution in FRP ................. 26
2.2.2.3 Models Based on the Mechanics-based Approaches ................................. 28
2.2.3 Shear Models in Codes and Design Guidelines .......................................... 30
2.2.3.1 ACI 440.2R-08 (2008) ......................................................................... 30
2.2.3.2 AASHTO FRPS-1 (2012) .................................................................... 32

ix
2.2.3.3 fib-TG 9.3 Bulletin 14 (2001) .............................................................. 33
2.2.3.4 Canadian Code ..................................................................................... 34
2.2.3.5 ISIS Design Manual No. 4 (2001) ....................................................... 35
2.2.3.6 JSCE Recommendations (2001) .......................................................... 36
2.2.3.7 Great Britain Technical Report 55 (2004) ........................................... 36
2.2.4 Shear Interaction in the FRP RC Members................................................. 36
2.2.4.1 Shear Interaction between Vc and Vf ................................................... 37
2.2.4.2 Shear Interaction between Vs and Vf ................................................... 38
2.3 DEVELOPMENT OF TRUSS MODEL THEORIES ....................................... 42
2.4 DEVELOPMENT OF MATERIAL LAWS OF RC ELEMENT ...................... 45
2.4.1 Concrete in Compression ............................................................................ 45
2.4.2 Concrete in Tension .................................................................................... 48
2.4.3 Steel Reinforcement in Tension .................................................................. 50
2.4.4 Shrinkage Effect on Material Laws ............................................................ 51
2.4.5 Hsu/Zhu Ratio ............................................................................................. 53
2.5 STUDIES ON THE MATERIAL LAWS OF FRP RC ELEMENT .................. 54
2.5.1 Experimental Investigations........................................................................ 55
2.5.2 Analytical Investigations ............................................................................ 57
2.6 LITERATURE GAPS AND SUMMARY ......................................................... 59
CHAPTER 3 UNIVERSAL PANEL TESTER ............................................................. 62
3.1 INTRODUCTION .............................................................................................. 62
3.2 GENERAL DESCRIPTION .............................................................................. 62
3.3 SERVO-CONTROLLED HYDRAULIC SYSTEM ......................................... 64

x
3.4 STRAIN MEASUREMENT .............................................................................. 67
3.5 CONTROL ARRANGEMENT ......................................................................... 68
3.5.1 Uniaxial Tension Test ................................................................................. 69
3.5.2 Biaxial Tension-Compression Test ............................................................. 70
3.6 SUMMARY ....................................................................................................... 75
CHAPTER 4 EXPERIMENTAL PROGRAM ............................................................. 76
4.1 GENERAL DESCRIPTION .............................................................................. 76
4.2 MATERIAL ....................................................................................................... 77
4.2.1 Concrete ...................................................................................................... 77
4.2.2 Steel Reinforcements .................................................................................. 79
4.2.3 FRP Sheets .................................................................................................. 81
4.3 UNIAXIAL TENSION TEST ............................................................................ 82
4.3.1 General Introduction ................................................................................... 82
4.3.2 Fabrication of the Specimen ....................................................................... 84
4.3.2.1 Casting ................................................................................................. 84
4.3.2.2 Application of the FRP Sheets............................................................. 86
4.3.3 Experimental Setup ..................................................................................... 88
4.3.4 Instrumentation ........................................................................................... 89
4.3.4.1 Measurement Instrumentation ............................................................. 90
4.3.4.2 DIC system .......................................................................................... 90
4.4 BIAXIAL TENSION-COMPRESSION TEST ................................................. 93
4.4.1 Introduction ................................................................................................. 93
4.4.2 Fabrication of Test Specimens .................................................................... 94

xi
4.4.3 Experimental Setup ..................................................................................... 95
4.4.4 Instrumentation Methods ............................................................................ 96
4.4.5 Loading Procedures .................................................................................... 97
4.4.5.1 Softening Test ...................................................................................... 97
4.4.5.2 Hsu/Zhu Ratio Test .............................................................................. 97
4.5 SUMMARY ....................................................................................................... 98
CHAPTER 5 ANALYSIS OF THE TEST RESULTS ................................................. 99
5.1 GENERAL ......................................................................................................... 99
5.2 CONCRETE IN TENSION ............................................................................. 102
5.2.1 Prior to Cracking ....................................................................................... 102
5.2.2 Post-cracking Behavior ............................................................................. 105
5.2.3 Shrinkage .................................................................................................. 108
5.2.4 Effect of Different Parameters on Concrete in Tension ............................ 110
5.2.4.1 Effect of Steel Reinforcement Ratio .................................................. 110
5.2.4.2 Effect of FRP Reinforcement Ratio................................................... 112
5.2.4.3 Effect of Wrapping Scheme .............................................................. 114
5.2.5 Proposed Equations ................................................................................... 115
5.2.6 Verification of Proposed Equations .......................................................... 119
5.3 STEEL IN TENSION ....................................................................................... 121
5.3.1 Apparent Yielding Point ........................................................................... 121
5.3.2 Proposed Equations ................................................................................... 123
5.3.3 Verification of Proposed Equations .......................................................... 126
5.4 RESULTS FROM DIC SYSTEM.................................................................... 127
xii
5.5 CONCRETE IN COMPRESSION ................................................................... 129
5.5.1 General ...................................................................................................... 129
5.5.2 Test Results ............................................................................................... 131
5.5.3 Proposed Equations ................................................................................... 133
5.6 MODIFIED HSU/ZHU RATIO ....................................................................... 136
5.6.1 General ...................................................................................................... 136
5.6.2 Data Analysis Method............................................................................... 139
5.6.3 Effect of FRP Reinforcement Ratio on 21 .............................................. 140
5.6.4 Effect of FRP Reinforcement Ratio on 12 .............................................. 141
5.6.5 Proposed Equations ................................................................................... 143
5.7 CASE STUDY OF SMM WITH MODIFIED CONSITUTIVE LAWS ......... 146
5.8 SUMMARY ..................................................................................................... 152
CHAPTER 6 CONCLUSIONS AND RECOMMENDATIONS ................................ 155
6.1 GENERAL ....................................................................................................... 155
6.2 SUMMARY OF MODIFIED CONSTITUTIVE LAWS ................................ 156
6.2.1 Concrete in Tension .................................................................................. 156
6.2.2 Steel in Tension ......................................................................................... 157
6.2.3 Softening Coefficient ζf ........................................................................... 157
6.2.4 Modified Hsu/Zhu Ratios ......................................................................... 158
6.3 CONCLUSIONS .............................................................................................. 158
6.4 UPCOMING WORK ON DEVELOPMENT OF SHEAR MODEL ............... 160
6.5 LIMITATIONS AND FUTURE WORK ......................................................... 163
6.5.1 Future Work on Shear Modeling of Beams .............................................. 163

xiii
6.5.2 Limitations and Future Work on Constitutive Modeling .......................... 164
REFERENCES ............................................................................................................... 166
APPENDIX I ANALYZED DATA OF TEST SPECIMENS .................................. 183
APPENDIX II SHRINKAGE CALCULATION USING EUROCODE 2 ................ 226

xiv
LIST OF FIGURES
Fig. 1.1 Examples of Deterioration of the Civil Infrastructures ......................................... 1
Fig. 1.2 Examples of Strengthening of Structure Members Using FRPs ........................... 2
Fig. 1.3 Comparison of FRP Contribution to Shear Capacity Using Different Models and
Codes (Adopted from NCHRP Report 678) ....................................................................... 3
Fig. 1.4 Shear Contribution and Interaction of the Components in FRP RC Members ..... 4
Fig. 1.5 An Efficient Method to Study the Behavior of the Structures Using Elements .... 5
Fig. 1.6 Beam Shear Element with In-plane Stresses ......................................................... 6
Fig. 1.7 Work Plan of the Project and Contribution of the Author ..................................... 7
Fig. 2.1 Outline of Literature Review ............................................................................... 11
Fig. 2.2 Different Wrapping Schemes for Shear Strengthening Using FRP Sheets
(Adopted from Belarbi and Bora, 2013) ........................................................................... 12
Fig. 2.3 Different Configurations for Shear Strengthening Using FRP Sheets ................ 12
Fig. 2.4 Effective Strain of FRP, fe in Terms in Terms of (Adopted from
NCHRP Report 678) ......................................................................................................... 40
Fig. 2.5 Ratio of Effective FRP Strain to Ultimate FRP Strain, /fe fuR , in Terms of
– Beams Failed by FRP Debonding (Adopted from NCHRP Report 678) 41
Fig. 2.6 Ratio of Effective FRP Strain to Ultimate FRP Strain, /fe fuR , in Terms of
– Beams Failed by FRP Rupture (Adopted from NCHRP Report 678) .... 41
Fig. 2.7 Example of a Proposed Model for Softening Coefficient (Adopted from Hsu and
Mo, 2010) .......................................................................................................................... 45
2/3
'/f f cE f
2/3
'/f f cE f
2/3
'/f f cE f

xv
Fig. 2.8 Tensile Stress Strain Curve of Concrete .............................................................. 48
Fig. 2.9 Tensile Stress Strain Curve of Steel .................................................................... 50
Fig. 2.10 Comparison of a Case Considering Shrinkage and Ignoring Shrinkage ........... 52
Fig. 2.11 Hsu/Zhu Ratio 12 and 21 under Biaxial Loading .......................................... 53
Fig. 2.12 Test Specimen for Ueda et al. (2002) ................................................................ 55
Fig. 2.13 Test Setup for Ceroni et al. Tests (2004) (25.4 mm=1 in) ................................ 56
Fig. 2.14 Comparison of Stress-strain Curve of Concrete between the Proposed Model
(Farah and Sato., 2011) and Experimental Results (Ueda et al., 2002) ............................ 58
Fig. 2.15 Comparison of the Stress-strain Curve for steel in tension between the Proposed
Model (Farah and Sato, 2011) and Experimental Results (Ueda et al., 2002) ................. 59
Fig. 3.1 North and South View of the UPT ...................................................................... 63
Fig. 3.2 Illustration of the Load Application for Jacks (Adopted from Belarbi, 1991) .... 63
Fig. 3.3 Schematic Diagram of Control System ............................................................... 65
Fig. 3.4 Details of the Closed-loop Servo-control System ............................................... 66
Fig. 3.5 LVDT Arrangement for the Panel Test ............................................................... 68
Fig. 3.6 Control Arrangement for the Uniaxial Tension Test ........................................... 70
Fig. 3.7 Cable Arrangement for the Uniaxial Tension Test .............................................. 71
Fig. 3.8 Control Arrangement for the Biaxial Tension-compression Test ....................... 73
Fig. 3.9 Cable Arrangement for the Biaxial Tension-compression Test .......................... 74
Fig. 4.1 Outline of the Experimental Program .................................................................. 77
Fig. 4.2 Typical Stress-strain Curve from Concrete Cylinder Compression Test ............ 78
Fig. 4.3 Typical Stress-strain Curves of the Rebars .......................................................... 80
Fig. 4.4 Method of Calculating Es and fy for No. 4 and No. 5 Rebar ............................... 80

xvi
Fig. 4.5 Pull-off Tests for the FRP-concrete Interface ...................................................... 82
Fig. 4.6 Specimen of the Uniaxial Tension Test ............................................................... 83
Fig. 4.7 Layout of the Formwork for Uniaxial Tension Test............................................ 85
Fig. 4.8 Formwork for the Prismatic Specimen ................................................................ 85
Fig. 4.9 Wrapping Scheme and FRP Anchor Details ....................................................... 87
Fig. 4.10 Typical Procedure of FRP Anchor Application ................................................ 88
Fig. 4.11 Test Setup of the Uniaxial Tension Test ........................................................... 89
Fig. 4.12 Typical Setup for Uniaxial Tension Test ........................................................... 89
Fig. 4.13 Pattern on the Concrete Surface ........................................................................ 91
Fig. 4.14 ARAMIS 3D Sensor Setup ................................................................................ 92
Fig. 4.15 Layout of the Panels .......................................................................................... 93
Fig. 4.16 Formwork of the Panels ..................................................................................... 95
Fig. 4.17 Test Frame for the Biaxial Tension-compression Test ...................................... 96
Fig. 4.18 Strain Gage Layout of the Test Panels .............................................................. 97
Fig. 4.19 Load Pattern for the Softening Test ................................................................... 98
Fig. 4.20 Load Pattern for the Hsu/Zhu Ratio Test........................................................... 98
Fig. 5.1 Stress Diagram for FRP RC Element Subjected to In-plane Stresses ............... 100
Fig. 5.2 Comparison of the Test Results and Eqn. (5-5) & (5-6) ................................... 105
Fig. 5.3 Schematic Distribution of Force, Stress and Strain for Cracked FRP RC under
Unaxial Tension Stress Field (adopted from Belarbi and Hsu, 1994) ............................ 106
Fig. 5.4 Tension Stiffening for Specimens with Various Steel Reinforcement Ratios ... 111
Fig. 5.5 Tension Stiffening for Specimens with Various FRP Reinforcement Ratios ... 112
Fig. 5.6 Tension Stiffening for S-3 Series (Farah and Sato, 2011) ................................. 113

xvii
Fig. 5.7 Average Bond Stress for S-3 Series (Farah and Sato, 2011) ............................. 114
Fig. 5.8 Tension Stiffening for Specimen with Different Wrapping Schemes ............... 115
Fig. 5.9 Relationships between expc and the Wrapping Scheme ..................................... 118
Fig. 5.10 Relationships between expc and the Ratio of FRP and Steel Stiffness ............. 118
Fig. 5.11 Comparison between the Proposed Equation for expc and Experimental Results
......................................................................................................................................... 118
Fig. 5.12 Comprasion of Stress-strain Curve for Concrete in Tension between the
Experimental Results and Eqns. (5-19)-(5-23) ............................................................... 119
Fig. 5.13 Comprasion of Proposed Model and Test Results by Farah and Sato (2011) . 120
Fig. 5.14 Average Stress Strain Curve of Steel in Tension ............................................ 122
Fig. 5.15 Crack Patterns for S3 Series at Average Tensile Strain of 0.002 .................... 123
Fig. 5.16 Comparison of Proposed Equations and Test Results for the Stress-strain
Relationships in Steel ...................................................................................................... 125
Fig. 5.17 Stress-strain Relationships for Steel in Tension (Farah and Sato, 2011) ........ 126
Fig. 5.18 Comparison of the Stress-strain Relationships in Steel between Proposed
Equations and Test Results by Farah and Sato (2011) ................................................... 127
Fig. 5.19 Tensile Strain Field from DIC for Specimen S5-025-FA ................................ 128
Fig. 5.20 Debonding of FRP Sheets at Ultimate Stage ................................................... 129
Fig. 5.21 Example of a Proposed Model for Softening Coefficient (Adopted from Hsu
and Mo, 2010) ................................................................................................................. 129
Fig. 5.22 Comparison between the Softening Coefficients for RC (Belarbi and Hsu, 1995)
and FRP RC .................................................................................................................... 132

xviii
Fig. 5.23 Comparison between the Softening Coefficients for RC (Belarbi and Hsu, 1995)
with Envelop of Test Data and FRP RC ......................................................................... 132
Fig. 5.24 Comparison of the Softening Coefficient between Model Proposed by Moslehy
(2010) and Test Data ....................................................................................................... 134
Fig. 5.25 Regression of Test Data for f4(FRP) ................................................................ 135
Fig. 5.26 Comparison of the Softening Coefficient between the Proposed Eqn. (5-37) and
Test Data ......................................................................................................................... 135
Fig. 5.27 Illustrative Plot for Hsu/Zhu Ratio 12 and 21 ............................................. 136
Fig. 5.28 Hsu/Zhu Ratios for RC (Adopted from Zhu and Hsu, 2002) .......................... 138
Fig. 5.29 Loading Procedure for PR-025 ........................................................................ 139
Fig. 5.30 Method of Data Collection in Hsu/Zhu Ratio Test ......................................... 140
Fig. 5.31 Hsu/Zhu Ratio 21 in This Study ..................................................................... 141
Fig. 5.32 Comparison of Hsu/Zhu Ratio 12 between FRP RC and RC ......................... 142
Fig. 5.33 Bending Effect on the Cracked Specimen in the Hsu/Zhu Ratio Test ............ 142
Fig. 5.34 Relationship between and FRP Stiffness ................................................... 143
Fig. 5.35 Comparison of 21 between Experimental Data and Prediction of Eqn. (5-47)
......................................................................................................................................... 144
Fig. 5.36 Comparison of 12 between Experimental Data and Prediction of Eqns. (5-44)-
(5-46)............................................................................................................................... 145
Fig. 5.37 Pure Shear Test Specimen Layout ................................................................... 147
Fig. 5.38 FRP RC Element under In-plane Stress .......................................................... 148
12

xix
Fig. 5.39 Comparison between Test Results and SMM with Original and Modified
Constitutive Laws ........................................................................................................... 152
Fig. 6.1 Outline of the Whole Project ............................................................................. 162

xx
LIST OF TABLES
Table 2.1 Summary of Experimental Tests (Updated Based on NCHRP Report 678) .... 15
Table 4.1 Mechanical Properties of the Rebars ................................................................ 80
Table 4.2 Material Properties of the Uniaxial Tension Test ............................................. 84
Table 4.3 Constants and Studied Variables in Uniaxial Tension Test .............................. 84
Table 4.4 Material Properties of the Biaxial Tension-Compression Test ......................... 94
Table 5.1. Test Results for Specimens at Cracking Stage .............................................. 104
Table 5.2 Shrinkage Stress and Strain for the Test Specimen ........................................ 109
Table 5.3 Test Specimens and the Variables Studied for Concrete in Tension .............. 110
Table 5.4 Test Results for 12 at Post-yielding Stage ..................................................... 143

xxi
NOTATIONS
1 direction of applied principal tensile stress
2 direction of applied principal compressive stress
cA area of concrete
fA area of FRP sheet
sA area of steel bars
B factor for calculating apparent yielding stress
c coefficient for tension stiffening
expc coefficient for tension stiffening from regression of test data
d effective depth of beam
bd diameter of rebar
fd effective depth of FRP
frpD stress distribution factor
cE elastic modulus of concrete
fE elastic modulus of FRP sheet
sE elastic modulus of bare steel bars
'
cf cylinder compressive strength of concrete
cKf specified characteristic cylinder compressive strength
cmf mean cylinder compressive strength of concrete
crf cracking tensile strength of concrete
ctmf mean tensile strength of concrete

xxii
fef effective stress of FRP
pull offf pull-off strength for concrete-FRP interface
sf smeared (average) stress in embedded mild steel bars
uf tensile strength of steel rebar
,u FRPf tensile strength of FRP sheet
yf yield stress of bare steel bars
'
yf apparent yield stress of steel bars
'
yf depth of beam
fG facture energy
h effective depth
k factor calculating Hsu/Zhu ratio
/f sK factor for FRP/steel stiffness ratio
wK factor for wrapping scheme
l direction of longitudinal steel bars
L effective length of FRP
el effective length of FRP
M bond parameter
/f sn ratio of Young’s Modulus between FRP and steel
P applied tensile load
crP cracking load
R reduction factor
fs spacing of FRP strip

xxiii
( )s x slip at a distance x from the loaded end
t direction of transverse steel bars
st direction of transverse steel bars
ft width of FRP sheet
vT shear contribution of the transverse steel reinforcement
cV concrete contribution to the shear capacity
fV FRP contribution to the shear capacity
,frp dV FRP contribution to the shear capacity
nV nominal shear strength
pV shear force provided by the FRP reinforcement
sV steel contribution to the shear capacity
angle of transverse reinforcement relative to the longitudinal axis
deviation angle
1ε change of strain in principal 1-direction
2ε change of strain in principal 2-direction
1ε smeared (average) tensile strain in principal 1-direction
εca autogenously shrinkage strain
εcd drying shrinkage strain
εcr cracking tensile strain of concrete
,εc sh strain in concrete due to shrinkage
ε f strain in FRP
ε fe effective strain in FRP
xxiv
ε fu ultimate strain in FRP
ε ( )f x strain in the FRP sheet at a distance x from the crack
ε cu effective strain in FRP
ε s smeared (average) strain of steel bars
εsf smeared (average) strain of steel bars that yield first
ε ( )s x strain in the steel bars at a distance x from the crack
ε y yielding strain in bare steel bars
'ε y yielding strain in steel bars in smeared model
,εs sh strain in steel bars due to shrinkage of concrete
εsh shrinkage strain of plain concrete
F resistance factor of FRP
,f d safety factor for strength of FRP
12 Hsu/Zhu ratio (ratio of resulting tensile strain to source compressive strain)
21 Hsu/Zhu ratio (ratio of resulting compressive strain to source tensile strain)
angle of diagonal compression
e equivalent reinforcement ratio
f FRP reinforcement ratio
s steel reinforcement ratio
1σ smeared (average) tensile stress in principal 1-direction
σc smeared (average) tensile stress in concrete
,σc sh stress in concrete due to shrinkage
σ f smeared (average) tensile stress in FRP sheet

xxv
σ ( )f x stress in the FRP sheet at a distance x from the crack
σ p peel-off stress of the FRP sheets
σs smeared (average) tensile stress in steel bars
,σs sh stress in steel rebar due to shrinkage
σ ( )s x stress in the steel bars at a distance x from the crack
( )x shear stress at a distance x from the loaded end
ave average shear stress along FRP
ζ softening coefficient
ζ f softening coefficient considering FRP sheet
1
CHAPTER 1 INTRODUCTION
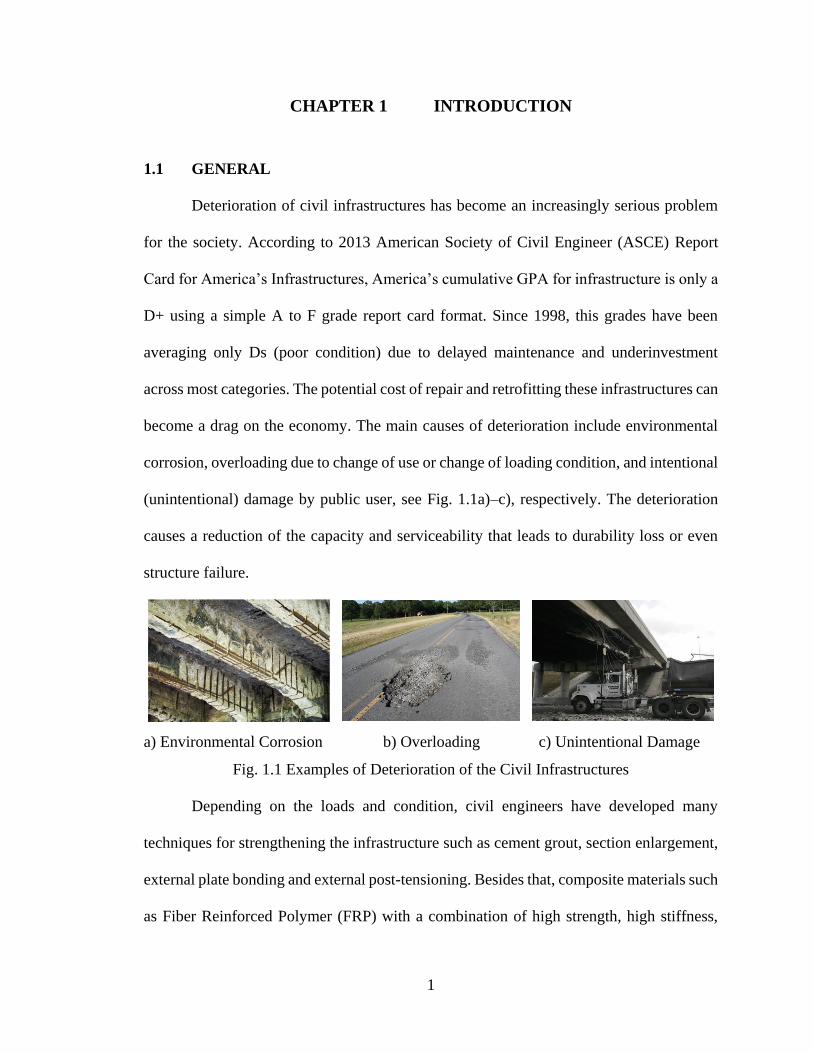
1.1 GENERAL
Deterioration of civil infrastructures has become an increasingly serious problem
for the society. According to 2013 American Society of Civil Engineer (ASCE) Report
Card for America’s Infrastructures, America’s cumulative GPA for infrastructure is only a
D+ using a simple A to F grade report card format. Since 1998, this grades have been
averaging only Ds (poor condition) due to delayed maintenance and underinvestment
across most categories. The potential cost of repair and retrofitting these infrastructures can
become a drag on the economy. The main causes of deterioration include environmental
corrosion, overloading due to change of use or change of loading condition, and intentional
(unintentional) damage by public user, see Fig. 1.1a)–c), respectively. The deterioration
causes a reduction of the capacity and serviceability that leads to durability loss or even
structure failure.
a) Environmental Corrosion b) Overloading c) Unintentional Damage
Fig. 1.1 Examples of Deterioration of the Civil Infrastructures
Depending on the loads and condition, civil engineers have developed many
techniques for strengthening the infrastructure such as cement grout, section enlargement,
external plate bonding and external post-tensioning. Besides that, composite materials such
as Fiber Reinforced Polymer (FRP) with a combination of high strength, high stiffness,

2
light weight, and corrosion resistance properties, became very attractive since early 1960s.
In 1970s, lower-cost of fabrication methods appeared due to the high market demand
(Bakis et al., 2002). By the late 1980s, FRP started being used in civil engineering
applications. To date, FRP has been widely used practically in strengthening or building
the civil engineering structures under flexural, axial load and shear, see Fig. 1.2.
a) Flexural Strengthening b) Confinement c) Shear Strengthening
Fig. 1.2 Examples of Strengthening of Structure Members Using FRPs
Extensive experimental and analytical investigations have been conducted to study
the complex behavior of FRP strengthened structures. In the current literature, well
established analytical models are already available for analyzing and designing
strengthened beams and columns under flexural and axial-confinement actions. However,
the behavior of such members under in-plane shear stress field remains a subject of on-
going discussion among several researchers and practitioners due to the high complexity
of the mechanism and the failure modes associated with the behavior (Lee and Kim, 2008).
Several analytical models were proposed to predict the gain in shear capacity due to the
use of FRP for strengthening. However, most models resulted in large discrepancies and
produced large scatter when compared to experimental results, and the analytical models
for estimating the shear capacity of FRP strengthened Reinforced Concrete (RC) members
were mostly developed based on results of simply supported beam tests (Belarbi et al.,
2011). Such tests cannot give a full understanding of shear behavior due to the presence of

3
flexural effects. As a case study in NCHRP report 678 (Belarbi et al., 2011), the FRP
contribution to the shear capacity of a rectangular RC beam with U-wrap method (cross
section shown in Fig. 1.3) was predicted using 11 models and four code provisions. The
vertical axis shows the shear stress contribution due to FRPs, horizontal axis gives the axial
rigidity of FRP. The comparison shown in Fig. 1.3 illustrates that there are quite significant
differences in the predictions.
Fig. 1.3 Comparison of FRP Contribution to Shear Capacity Using Different Models and
Codes (Adopted from NCHRP Report 678)
1.2 PROBLEM DEFINITION AND RESEARCH APPROACH
The difference of predictions from various models as shown in Fig. 1.3 is partly
due to the high level of complexity associated with the shear behavior, but more
importantly to the lack of accurate constitutive models for FRP strengthened reinforced

4
concrete (FRP RC) elements. In the previous proposed models, the stress strain
relationships of concrete, steel and FRP were derived independently. For the currently used
code and design guidelines, the shear capacity of the FRP RC members are calculated as a
superposition of the shear contribution of concrete (Vc), steel (Vs), and FRP (Vf). However,
a high level of interaction between these components exists and different parameters that
might influence this interaction need to be taken into account (Bousselham and Chaallal,
2008; Chen et al., 2010). To rationally describe the behavior and predict the capacity of
FRP RC element in shear, constitutive models of each component and the interactions
among them have to be carefully investigated, see Fig. 1.4.
Fig. 1.4 Shear Contribution and Interaction of the Components in FRP RC Members
An efficient method to assess the overall response of an RC member is to identify
the characteristic behavior and the contribution of each material constituting the structure.
As shown in Fig. 1.5, reinforced concrete members can be considered as an assemblage of
elements. If the behavior of such element can be well understood, the behavior of the whole
member, even the whole structure can be obtained through finite element method.

5
Fig. 1.5 An Efficient Method to Study the Behavior of the Structures Using Elements
This method could be applied to investigate the shear behavior of the FRP RC under
shear stress field. As an example, an element from a girder strengthened by FRP sheets that
is subjected to shear force can be isolated and the behavior of that specific element can be
predicted by taking into account the inherent characteristics and material laws of the
constituents that leads to understanding the global shear response of the girder (Fig. 1.6).
To investigate the behavior of this shear element, a set of equilibrium equations,
compatibility conditions, and materials laws are required for steel and FRP reinforcements
in the longitudinal (l) and transverse (t) directions as well as the concrete in tension and
compression in the principal directions 1 and 2, respectively.

6
Fig. 1.6 Beam Shear Element with In-plane Stresses
The study of shear behavior of structure element can be conducted by testing full-
scale panel elements using the unique Universal Panel Tester (UPT) at the University of
Houston (UH). The UPT can apply various combination of in-plane and out-of-plane
stresses to the element (Hsu et al., 1995).
The research work conducted by the author is part of an on-going NSF project with
the aim of developing the analytical models for FRP strengthened RC elements under shear
stress field including membrane stresses. Fig. 1.7 shows the work plan of the project and
the contribution of the author. As the first step of developing a shear model of FRP RC
elements, constitutive laws of each material component were studied in this research
project through experimental and analytical investigations.

7
Fig. 1.7 Work Plan of the Project and Contribution of the Author

8
1.3 RESEARCH OBJECTIVES
To rationally describe the behavior of FRP RC element in shear, the stress strain
relationships of each component and the interactions among them have to be carefully
investigated. The main objective of this investigation is to derive the uniaxial and biaxial
material laws of concrete, steel and FRP required in the truss model theory to predict the
behavior of the FRP RC element under in plane shear stress field.
The proposed work in this research includes the following specific objectives:
a) to investigate the parameters affecting the material laws of concrete, steel in
uniaxial tension and biaxial tension-compression.
b) to recommend the mathematical expressions for material laws of concrete, steel
and FRP in tension, the softening coefficient, and the modified Hsu/Zhu ratio
needed for rational prediction of the truss model theory.
The accuracy of the shear model highly depends on the constitutive laws. By
carefully investigating these constitutive laws, the research in this study is expected to
enhance the understanding of this complex phenomenon that will ultimately improve the
accuracy of the available design guidelines.
1.4 OUTLINE OF DISSERTATION
This dissertation is organized in six chapters as
Chapter 1: Presents the statement of problems and the objective of the research.
Chapter 2: Presents the literature review of: a) researches on shear strengthening using
externally bonded FRP sheets; b) development of the truss model theories; c)
development of the constitutive modeling for RC elements with and without

9
FRP sheets under uniaxial and biaxial loading. The research gap is also
presented in this chapter.
Chapter 3: Presents a brief introduction on the Universal Panel Tester and the detail
information of the servo-control system in this particular test program.
Chapter 4: Presents the details of experimental program, including the fabrication of the
specimen, test setup, instrumentation method and the loading procedure for the
three types of tests in this study.
Chapter 5: Presents the test results and analytical studies of the constitutive modeling. The
analysis involves the study on different variables affecting the constitutive laws
of the components in FRP RC elements, and development of the mathematical
expressions for constitutive laws of concrete, steel in tension, as well as the
softened coefficient for concrete and the modified Hsu/Zhu ratio for the FRP
RC element.
Chapter 6: Presents conclusions, limitations and recommendations for future research.

10
CHAPTER 2 LITERATURE REVIEW
2.1 INTRODUCTION
In this chapter, a comprehensive review on the existing knowledge of shear
strengthening of RC members using FRP is presented. The flowchart in Fig. 2.1 shows the
outline of the presentation in this chapter. It can be seen that the review includes three main
parts: review of the experimental and analytical investigations on shear strengthening of
RC using FRPs, review of development of the truss model approaches, and review of the
constitutive laws of each components in FRP RC members. As the main research topic in
this study, the constitutive laws is reviewed in detail in this chapter, including concrete in
tension (tension stiffening), steel in tension, FRP in tension; concrete in compression
(softening coefficient); and Poisson effect (Hsu/Zhu ratio). Finally, the research gaps
related to shear strengthening of RC members using FRP is addressed.
2.2 STUDIES ON SHEAR STRENGTHENING USING FRP
2.2.1 General
The FRPs have been proven as an effective material that considerably increases the
strength as well as ductility of the member without significantly affecting the stiffness of
the structure (Bakis et al., 2002). Externally bonded FRP materials is one of the effective
ways to strengthen the members in shear. The most common wrapping methods include
fully (complete) wrapping, U-wrap, and side bonding as shown in Fig. 2.2a)–c),
respectively.

11
Fig
. 2.1
Outl
ine
of
Lit
erat
ure
Rev
iew

12
The FRP sheets can be applied as continuous sheets along the span or as discrete
strips. The fibers in the FRP sheets can also be oriented at various angles to meet a range
of strengthening requirements, see Fig. 2.3a)-c).
a) Fully Wrap b) U-Wrap c) Side Bonding
Fig. 2.2 Different Wrapping Schemes for Shear Strengthening Using FRP Sheets
(Adopted from Belarbi and Bora, 2013)
a) Strips (=90°) b) Strips (<90°) c) Continuous Sheet
Fig. 2.3 Different Configurations for Shear Strengthening Using FRP Sheets
2.2.2 Shear Models for FRP RC Members
The most commonly used analytical approaches to calculate the shear contribution
of FRP include truss model approach (Triantafillou, 1998; Khalifa et al., 1998 and 1999;
Triantafillou et al., 2000; Chaallal et al., 2002; Pellegrino et al., 2002; Hsu et al., 2003;
Chen et al., 2013), mechanics-based model (Malek and Saadatmanesh, 1998; Deniaud and
Cheng, 2001, 2004; Monti and Liotta, 2005; Sim et al., 2005) and non-uniform strain
distribution approach (Caroline and Taljsten, 2005b; Chen and Teng, 2003a and 2003b;
Cao et al., 2005).
Bousselham and Chaallal (2004) reviewed 250 specimens of the shear tests with
FRP to study the effect of different parameters. The reported failure modes includes: (a)
debonding failure due to delamination, adhesive failure, or concrete substrate failure (e.g.

13
Deniaud and Cheng, 2001; Kalifa and Nanni, 2002; Triantafillou, 1998); and (b) FRP
rupture (e.g. Berset, 1992; Chajes et al., 1995; Funakawa et al., 1997, Challal et al., 2002,
Mitsui et al., 1998, and Umezu et al., 1997). The failure modes are affected mainly by:
shear span-to-depth ratio, beam depth, internal and externally shear reinforcement ratio,
concrete strength, and material properties of FRP (Teng et al., 2004; Bousselham and
Chaallal, 2004).
Most of the analytical models have the following format in calculating the shear
capacity of the FRP RC members, which defines the nominal shear capacity (Vn) as the
summation of three components: concrete (Vc), steel shear reinforcement (Vs), and external
FRP shear reinforcement (Vf), as shown in Eqn. (2-1):
n c s fV V V V . (2-1)
In the equation, Vc attributes to the shear force in the compression zone, the
aggregate interlock and friction along the cracks, and the dowel action of the steel flexural
reinforcements, while Vs and Vf attribute to the force in stirrups and FRP reinforcements,
respectively. Basically, the shear resistances for concrete and steel shear reinforcement in
FRP RC members are assumed to be the same as the un-strengthened RC structures. The
FRP sheets are often assumed to work analogously as the stirrups. The FRP sheets are
considered as ties to resist the tensile stresses between the concrete struts. However, the
effectiveness of the FRP in resisting these tensile stresses is much more complex than
stirrups due to: (1) the bond behavior in the concrete-FRP interface, (2) the material
properties of the FRP laminates, (3) FRP sheets geometry, (4) shear failure modes, and (5)
anchorage system provided.

14
Most analytical models express the contribution of FRP in terms of the effective
strain in FRP, fe , which is expressed as a fraction of the ultimate tensile strain and is
significantly affected by the failure mode. For the case of rupture of FRP, the effective
strain is close but smaller than the ultimate tensile strain of FRP due to a concentration of
strains in the FRP; for the case of FRP debonding, the effective strain in the FRP tends to
be much lower than the ultimate tensile strain of FRP. The equations used to calculate the
effective strain in FRP fe have been developed and improved by many researchers with
more updated experimental data (Belarbi et al., 2011). The factors determining the effective
strain are mainly the stiffness of FRP, the strength of the concrete, the FRP strengthening
scheme, and failure modes.
As a summary, Table 2.1 lists the general information of all up-to-date experimental
results. Table 2.1 is based on NCHRP 678 and updated with the recent tests between 2011
and 2014. In the following section, several most important analytical models are reviewed
in detail categorized by different approaches. The tests related to these analytical models
are also presented respectively.
2.2.2.1 Models Based on the Truss Model Approaches
Al-Sulaimani et al. (1994) was the first group of researchers that came up with a
set of equations for shear contribution of FRP. They tested sixteen RC beams (5.9 × 5.9 ×
49 in) strengthened with FRP using different bonding schemes including shear strips (side-
bonded discrete FRP strips), shear wings (side-bonded continuous FRP sheets), and U-
jackets (U-wrapped continuous FRP sheets), with 0.12 in thick fiberglass plates. All beams

15
Table 2.1 Summary of Experimental Tests (Updated Based on NCHRP Report 678)
Rec
tangula
r S
ection
T-S
ection
Bea
m S
pan
nin
g L
< 7
ft
Bea
m S
pan
nin
g 7
ft <
L<
13 f
t
Bea
m S
pan
nin
g L
>13 f
t
Reg
ula
r B
eam
s (a
/d>
2.5
)
Dee
p B
eam
s
Sca
le E
ffec
t
Pre
crac
kin
g
Concr
ete
Str
ength
Longitudin
al R
einfo
rcem
ent
Tra
nsv
erse
Rei
nfo
rcem
ent
Car
bon
Ara
mid
Gla
ss
Tw
o-S
ide
Bondin
g
U-W
rap
Com
ple
te W
rap
Conti
nuous
Str
ips
Angle
to L
ong. A
xis
=90°
Angle
to L
ong. A
xis
≠90°
Berset 1992 2
Uji 1992 4
Al-Sulaimani et
al.1994 4
Ohuchi et al. 1994 13
Chajes et al. 1995 5
Sato et al. 1996 3
Araki et al. 1997 8
Funakawa et
al.1997 3
Kamiharako et
al.1997 1
Miyauchi et al. 1997 4
Sato et al. 1997 2
Taerwe et al. 1997 3
Taljsten 1997 3
Umezu et al. 1997 15
Chaallal et al. 1998 2
Mitsui et al. 1998 6
Triantafillou 1998 9
Khalifa et al. 1999 6
Kachlakev and
Barnes1999 3
Khalifa et al. 2000 4
Deniaud and
Cheng2001 5
Li et al. 2001a 5
Li et al. 2001b 9
Park et al. 2001 2
Chaallal et al. 2002 10
Khalifa and
Nanni2002 4
Li et al. 2002 9
Micelli et al. 2002 10
Pellegrino and
Modena2002 9
Beber 2003 28
Diagana et al. 2003 8
Hsu et al. 2003 3
Author YearN
um
ber
of
Tes
ts
Properties and Parameters
GeometryType of
Beam
Concrete
and Steel
Type of
FRPStrengthening Scheme

16
Table 2.1 (Continued)
Rec
tangula
r S
ection
T-S
ection
Bea
m S
pan
nin
g L
< 7
ft
Bea
m S
pan
nin
g 7
ft <
L<
13
Bea
m S
pan
nin
g L
>13 f
t
Reg
ula
r B
eam
s (a
/d>
2.5
)
Dee
p B
eam
s
Sca
le E
ffec
t
Pre
crac
kin
g
Concr
ete
Str
ength
Longitudin
al R
einfo
rcem
ent
Tra
nsv
erse
Rei
nfo
rcem
ent
Car
bon
Ara
mid
Gla
ss
Tw
o-S
ide
Bondin
g
U-W
rap
Com
ple
te W
rap
Conti
nuous
Str
ips
Angle
to L
ong. A
xis
=90°
Angle
to L
ong. A
xis
≠90°
Taljsten 2003 6
Adhikary et al. 2004 8
Xue Song et al. 2004 12
Cao et al. 2005 10
Carolin and
Taljsten2005a 18
Miyajima 2005 4
Monti and
Liotta2005 16
Sim et al. 2005 9
Zhang and Hsu 2005 10
Barros and
Dias2006 5
Bousselham
and Chaallal2006a 20
Pellegrino and
Modena2006 8
Lees and Kesse 2007 8
Leung et al. 2007 12
Alrousan et al. 2009 4
Arteaga et al. 2009 15
Gamino et al. 2009 7
Rizzo and De
Lorenzis2009 1
Bukhari et al. 2010 7
El-Ghandour 2011 7
Mefidi et al. 2011 14
Belarbi et al. 2012 15
Murphy et al. 2012 16
Dong et al. 2013 14
Mostofinejad
et al. 2013 32
Panigrahi et al. 2014 12
Baggio et al. 2014 9
Colalillo and
Sheikh 2014 15
Type of
FRPStrengthening Scheme
Author YearN
um
ber
of
Tes
ts
Properties and Parameters
GeometryType of
Beam
Concrete
and Steel

17
were tested as simply supported beams with a span of 47 in and a shear span of 15.7 in.
The proposed model is based on an assumed shear crack angle of 45°. Based on the test
results, three equations for different strengthening schemes were proposed:
22 2
(for shear strips)
2 2 (for shear wings)2
2 2 (for U-jackets)2
s save
p
p
p p
wp p ave
j
p p ult
t hd
F dV
S S
dhV F
dhV F
,
(2-2)
where Vp is the shear force provided by the FRP reinforcement; ts is the width of the strip;
hs, hw and hj are the effective depths of the FRP sheets; d is the effective depth of the beam,
ave is the average shear stress and Sp is the spacing of the FRP strips. The shear contribution
of FRP highly depends on the value of ave , but in the model, enough explanation wasn’t
given on how to decide this value. Also, in the equation, the FRP material properties were
not chosen as studied parameter since there is only one type of fiber glass was tested.
Chajes et al. (1995) tested 16 specimens without transverse steel reinforcements
under four-point bending. U-wrap was used as the wrapping scheme with two different
angle of fiber direction of 45° and 90° with respected to the longitudinal axis. By assuming
a perfect bond (i.e. failure happens in the concrete), two equations were proposed as
for FRP oriented at 0/90 degrees
2 for FRP oriented at 45/135 degrees
f f f cu
f f f cu
V A E d
V A E d
, (2-3)

18
where cu is the effective strain of the FRP sheets; Af is the area of the FRP sheets; Ef is
the modulus of elasticity of the FRP sheets.
In the equation, the ultimate vertical tensile strain of FRP was taken as 0.005, which
cannot account for the differences in ultimate strain resulting from using different FRP and
different orientations of wrapping. Also, in this model, the non-uniformity of the strain
along the FRP was not taken into account. Last but not least, the assumption of perfect
bond is questionable due to different failure modes occurred in practical cases.
Triantafillou (1998a) was one of the first researchers that proposed the shear
contribution of FRP in terms of effective FRP strain ( ,frp e ). Triantafillou (1998a) tested 9
rectangular RC beams strengthened with side bonded FRP sheets at 90°. Based on the test
results and a database of 33 other tests (Berset, 1992; Uji, 1992; Dolan et al., 1992; Al-
Sulaimani et al., 1994; Ohuchi et al., 1994; Chajes et al., 1995; Malvar, 1995; Sato et al.,
1996; and Triantafillou, 1997), the equations were proposed in a Eurocode format as
, ,
2
,
,
0.9(1 cot )sin
0.0119 0.0205( ) 0.0104( ) when 0 1GPa
0.00065( ) 0.00245 when >1GPa
frp d frp frp frp e w
frp
frp e frp frp frp frp frp frp
frp e frp frp frp frp
V E b d
E E E
E E
,
(2-4)
where Vfrp,d is the shear capacity provide by FRP sheets; frp and Efrp are the reinforcement ratio
and the modulus of elasticity of the FRP sheets, respectively; is the angle of applied FRP sheets
in respect of longitudinal axis; frp is the proposed effective strain of the FRP sheets.
The model presented two equations to calculate the effective strain of FRP, and it
is the first time that FRP rigidity was involved into the equation for calculating effective

19
strain. By regression, it was found that the effective strain decreases with the increase of
FRP rigidity.
Based on Triantafillou’s original model (Triantafillou, 1998b), Khalifa et al. (1998)
considered further the effect of shear crack opening and loss of aggregate interlock as well
as the FRP types into the equations. Additional experimental data were updated to the
database for regression (Araki et al., 1997; Chajes et al., 1995; Funakawa et al., 1997;
Ohuchi et al., 1994; Sato et al., 1996; Triantafillou, 1997; Umezu et al., 1997; and Uji,
1992). A modified effective strain was proposed based on both fiber rupture and debonding
failure by introducing a reduction factor R:
2
2/3'
0.58
0.5622( ) 1.2188( ) 0.778 0.50 (FRP rupture)
0.0042 (debonding failure)
f f f f
c fe
f f fu f
R E E
f wR
E t d
, (2-5)
where tf is the thickness of FRP; wfe is the width of FRP; and df is the effective depth of
the FRP reinforcement.
For calculating the capacity in the case of debonding failure, a concept of effective
bond length (Le) has been adopted by Maeda et al. (1997). The model suggests to use only
the portion of FRP extending past the crack by the effective bond length Le to calculate the
shear strength. The effective width was calculated based on 45° truss model.
(U-jacket configuration) and
2 (sheet bonded only on two faces).
fe f e
fe f e
w d L
w d L
(2-6)
20
This equation in ACI format is
(sin cos ),
where: .
f fe f
f
f
fe fu
A f dV
s
f Rf
(2-7)
An upper limitation of spacing sf,max of FRP strips was proposed by the author so
that all the shear crack will intercept at least one FRP strip:
,max4
f f
ds w . (2-8)
Later in 2000, Khalifa and Nanni modified the reduction factor as the least of
2
2/3'
6
0.5622( ) 1.2188( ) 0.778 0.50
738.93 4.06( ) 10
0.006.
f f f f
c fe
f frp
fu f
fu
R E E
f wR t E
d
R
(2-9)
In 2000, Triantafillou and Antonopoulos proposed an updated model in which the
effective strain was calibrated based on the results of more than 75 tests (Berset, 1992; Uji,
1992; Al-Sulaimani et al., 1994; Ohuchi et al., 1994; Chajes et al., 1995; Sato et al., 1996;
Antonopoulos, 1996; Miyauchi et al., 1997; Taerwe et al., 1997; Funakawa et al., 1997;
Umezu et al., 1997; Araki et al., 1997; Sato et al., 1997a; Ono et al., 1997; and Taljsten,
1997). The 2/3
'
cf was involved as a parameter to consider the effect of concrete
strengthened in tension. Regression was conducted to determine different values of
effective strains for different failure modes and different FRP types:

21
2/33
,
0.302/3
, ,
Debonding failure mode:
0.65 10 .
Shear-tension failure combined with or followed by CFRP fracture:
0.17 .
Shear-tension failure combined with or follow
cf e
f f
cf e f u
f f
f
E
f
E
0.472/3
, ,
ed by AFRP fracture:
0.048 .cf e f u
f f
f
E
(2-10)
Based on Khalifa et al. (1998), several researchers have proposed different
equations for calculating the reduction factor R. Hsu et al. (2003) tested 15 beams in a
three-point bending. Hsu et al. (Hsu et al., 2003 and Zhang and Hsu, 2005) proposed an R
factor considering the effect of the concrete compressive strength. Also, in this model the
regression was based on '/f f cE f instead of the axial rigidity f fE :
0.7488
'=1.8589 / .f f cR E f
(2-11)
Pellegrino and Modena (2002) tested 11 rectangular RC beams with and without
the internal steel reinforcement ratio. The FRP wrapping method is side bond only. Based
on the results, new R factors were proposed based on the bond mechanism modified by
Miller (1999). An additional reduction factor R* was introduced to account the effect of
the transverse steel reinforcement ratio:
22
2
0.58* 2/3
*
,
0.5622( ) 1.2188( ) 0.778 0.50 or
0.0042( ) /
0 0.53ln +0.29 1 or
0.006
f f f f
cm fe f f fu
s f
fu
R E E
R R f w E t d
R
R
,
(2-12)
where fcm is the mean concrete cylinder compressive strength; s,f is the ratio between the
axial rigidities of the transverse steel and FRP sheets.
Chaallal et al. (2002) investigated the effect of transverse steel reinforcement on
the FRP effectiveness by testing 12 RC beams that were half-scale T girders. The FRP
were multi-layer and fully wrapped in an angle of 90°. A new term called total shear
reinforcement ratio was introduced. Also, the author compared the test results with
Triantifillou (1998a)’s equations, but the results showed large scatter. The author pointed
out that the main reason is due to the factor that Triantifillou (1998a)’s equations are based
on the results of small-scale shallow beam. To account for the effect of deep beam, the
following equations were recommended:
5 0.6522
,
3 10 ,
New deep beam coefficient:
1 2 / 1 2 /, max (1000 0.6) 1,
12 12
f
f tot f eff f
f
eff tot tot f s
tot tot
AaV f E d
d s
n
a a d a df
d
,
(2-13)
where tot is the total shear reinforcement ratio; n is the ratio between the modulus of
elasticity of the transverse steel and FRP sheets.

23
Colotti and Swamy (2011) proposed a model to predict the ultimate load capacity
of RC beams strengthened by externally bonded FRP plates/sheets. The approach is based
on truss model approach as well as the theory of plasticity and is refined to consider:
variable angle crack, non-uniform stress distribution on FRP over the crack, and shear
span/depth ratio. The model varies for different failure modes. It is worth mentioning that
in the model, mechanics-based approach was also applied when calculate the bond strength
(Dai et al., 2006). The prediction of the proposed model was compared with 73 RC beam
test in literature and have a well agreement with a mean experimental/theoretical failure
load ratio of 1.05.
Chen et al. (2013) proposed a new shear strength model considering the shear
interaction among concrete, steel and FRP reinforcements. The main interaction effect that
was considered caused an overestimate of the Vs term in the design equations. Since
debonding usually happens at a relatively small shear crack width, the internal steel
reinforcement may not reach the yielding strain and consequently, the strength of the
internal steel reinforcement may not be fully utilized. The shear resistance can be expressed
as
,u c s y sv f f e frpV V K f A K f A . (2-14)
Ks and Kf are called mobilization factors and defined as
, /s s e yK f and (2-15)
, ,/f f e y eK f . (2-16)

24
s,e and f,e are the average stresses in the steel stirrups and FRP strips intersected by the
critical shear crack, respectively. The general expression of Vf is shown as
,
,
, ,max
,max
,max
max e
,max
max e
,
max
,
(sin cos )sin2
min
2 L L
2sin L < L
2
for side strips2sin
sin
f e
f f e f f
f
f e f frp
f
f
db
f f
f
db
f f
e f
f e t b
f e t b
hV f t w
s
f D
f
E G
t
E GL
L t
h h h
Lh h h
for U strips
,
(2-17)
where D is the stress distribution factor; Gf is the facture energy; Lmax is the maximum
bonding length of FRP.
The new model showed a good performance in prediction the shear contribution of
FRP by comparing with the tests results in a large databases. However, the proposed
equation, as mentioned by Chen et al. (2012), should be modified in a simpler format for
practical applications.
Nehdi and Nikopour (2010) proposed a new model for predicting the shear
contribution of FRP using the so-called Genetic Algorithm (GA) method. The GA method
is used in computing both exact and approximate solution. This method was applied to 212
RC beams strengthened with externally bonded FRP sheets in the literature. The factors in

25
the equation were derived by GA method from the test data in literature. The general format
of the proposed design equations was proposed as
4
' 11 2
3
2/3
(sin cos )/
( / )
.
f f fe fv steeln c w
f
C
fe f fu
f f
f
c
f
f
f
A E dA f dV C f C b d
a d s s
C
E
f a d
A
bs
(2-18)
Belarbi et al. (2012) tested 15 full-scale RC T-beam strengthened with externally
bonded FRP sheets. The parameters studied includes transverse steel reinforcement and
mechanical anchorage system. The test results showed that the FRP strengthened beams
with mechanical anchorages exhibited an increase in shear capacity about 23%-26% when
compared to the control beam without anchorages. Also, the FRP shear strengthening was
more efficient for the tested beams with a greater stirrup spacing (12 in) than for those with
smaller spacing (8 in), which indicates that there is an interaction between the internal steel
reinforcement and the externally bonded FRP sheets.
Murphy et al. (2012) tested 16 full-scale AASHTO type prestressed I-girders to
investigate the parameters of size of the girder, transverse reinforcement, FRP orientation,
anchorage systems and the pre-cracking. One of the important conclusion drawn from the
test results is that the failure modes of the tested beam highly depends on the cross-sectional
shape and shear reinforcement schemes. It was found that debonding of the FRP sheets
reduced the web thickness which lead to web crushing failure. Also, the mechanical
anchorage was found to postpone the debonding and provided additional capacity

26
compared to the beams without anchorages. The shear gain of the test specimen were also
compared with the predictions from 17 analytical models and none of the model can
accurately predict the FRP contribution or the total shear resistance of the tested beams in
the study due to the complexity of the shear behavior and the different failure modes.
Mofidi and Chaallal (2014) proposed a model to calculate the contribution of FRP
to the shear resistance of RC beams strengthened in shear with externally bonded FRPs.
The diminishing effect of the stirrups and the distributed pattern of the shear cracks are
quantified. The effective strain was given as
'
0.31 0.005.c L w eff e c
fe c L w
f f f f
k k k L fk k k
t E t E
(2-19)
The coefficient kL and kw were given separately for side bond and U-jack. The total
contribution of FRP was given in the format of truss model theory and the maximum
effective strain in the FRP is limited to 0.005.
2.2.2.2 Models Based on the Non-uniform Strain Distribution in FRP
Extensive experimental work was conducted by Chen and Teng (2003a and 2003b)
by investigating effective stress distribution along FRPs. Assumption was made that the
stress distribution in the FRP along the shear crack is non-uniform, and it is affected by:
(a) the variation in shear crack width along its length; (b) material properties of FRP; and
(c) the bond behavior in the FRP-concrete interface. The contribution of FRP to the shear
capacity was calculated by
,
,
(sin cos )2 .
frp e f
f frp e frp frp
frp
h dV f t w
s
(2-20)
27
For the debonding limit state, the non-uniform stress distribution in the FRP is taken
into account by introducing a stress distribution factor ( frpD ) as
, ,max
,
, ,max
,
where: .
frp e frp frp
zb
frp zzt
frp
frp e frp
f D
dzD
h
(2-21)
The proposed model was compared with the 46 experimental tests failed by
debonding and 58 experimental tests failed by FRP rupture (Uji, 1992: Al-Sulaimani et al,
1994; Chajes et al., 1995;, Kage et al., 1997; Sato et al., 1997a; Taerwe et al., 1997; Araki
et al., 1997; Funakawa et al.; 1997; Kamiharako et al., 1997; Ono et al., 1997; Umezu et
al., 1997; Triantafillou, 1998a; Khalifa et al., 1998; Chaallal et al., 1998b; Mitsui et al.,
1998; Kachlakev and Barnes, 1999b;Hutchinson and Rizkalla, 1999; Mutsuyoshi et al.,
1999; and Khalifa and Nanni, 2000). The model shows a good agreement with the test
results.
Carolin and Taljsten (2005) derived a model based on a database of 23 rectangular
RC beam. The database includes tests with and without internal steel reinforcement and
with full wrapping, side bonding FRP in an angel of 45 and 90 degrees. The model is shown
as
2
2
max
cos
sin
min cos
cos .
f cr f f f
fu
cr bond
c
V E t r z
(2-22)

28
Cao et al. (2005) tested 12 pre-cracked rectangular RC beams with complete wrap,
CFRP/GFRP at an angle of 90-degree. They proposed the first model that considers the
effects of pre-cracking. A new expression of the distribution factor fD
is given as
2
1 for 1.4
2 11 for 1.4< 3
1 0.2( 1.4)
2.05 for 3,
where is the normalized FRP bond length
f
frp
frp
D
(2-23)
2.2.2.3 Models Based on the Mechanics-based Approaches
Using a data base of 35 test results, Deniaud and Cheng (2001b) developed a model
based on a strip method and shear friction approach. In this model, the interaction between
concrete, steel and FRP was addressed. The equation is shown as
2 '
max
0.25 ( 1)
sin cos sin
sr c w FRP
FRPFRP f f f L
FRP s
dV k f b h T n nT
ns
w sT d t E R
S d
,
(2-24)
where Tv is the shear contribution of the transverse steel reinforcement.
Monti and Liotta (2005 and 2007) tested 24 FRP strengthened RC beams with
different wrapping schemes (U-wrap, side bond and fully wrap), and proposed an equation
with closed-form based on mechanics. In this model, fV is a function of the strengthening
schemes and some parameters related to geometry and mechanics. This model was based
on the assumptions: (a) the cracks are uniformly distributed along the beam axis, with an
angle (θ), (b) crack depth equals the internal lever arm (0.9d) at the ultimate limit state, and
(c) the shear mechanism is based on the Mörsch’s truss model for U-wrap and fully wrap

29
schemes and on crack-bridging for side bonding. Two failure criterions are considered in
the development of the model. The effective bond length ( el ) and debonding strength ( fddf )
can be determined as
2/3
,
2
where: 0.27
20.80
where: 0.03
2 / 1
1 / 400
min(0.9 , )sin( ) / sin
f f
e
ctm
ctm ck
f Fk
fdd
f d f
Fk b ck ctm
f f
b
f
f
E tl
f
f R
Ef
t
k f f
wk
w
w d hw
,
(2-25)
where fck is the specified characteristic cylinder compressive strength; fctm is the mean
axial tensile strength; and f,d is the safety factor for strength of FRP.
Colalillo and Sheikh (2014) proposed a new analytical method to predict the load-
deformation response of FRP strengthened beams and also presented a revision of the FRP
strain limits for the design codes when debonding is the failure mode. The bond behavior
was model by Yu et al. (2004) and Mohamad Ali et al. (2005). The proposed strain limit
can be calculated as
maxfe f fD . (2-26)
And in accordance with Cao et al. (2005), the distribution factor was given as
,0 0
max max
( )=
ln
ff iif
f f
x dxD
n l
. (2-27)

30
The distribution factors were give for side-bond, U-wrap and closed wrap
strengthening systems. Also the effective debonding strain and effective rupture strain were
also given. A total of 119 experimental tests were analyzed and compared with the results
of proposed model, ACI 440 2R-08 and CAN/CSA S6-06. It was found that the predictions
of the rupture failure for fully wrap are most accurate by the proposed model and the use
of the design strain limit 0.004 is overly conservative predictions for the specimens in the
database.
2.2.3 Shear Models in Codes and Design Guidelines
Several codes and design provisions have addressed the design method for
evaluating the shear contribution of the FRP to the shear capacity of the RC members.
Compared with the results from individual researchers, the results in the design codes
contains a larger database and provides a wider range of application (Belarbi et al., 2011).
In the following section, review is conducted on several widely used design codes that has
specifications regarding the shear design of the FRP RC member.
2.2.3.1 ACI 440.2R-08 (2008)
ACI 440.2R-08 proposes the shear model based on 45 degree truss model. This
code is to date the most comprehensive. ACI 440.2R-08 calculates the shear contribution
of FRP reinforcement by the failure modes. The effective strain of FRP is calculated based
on different wrapping schemes and is limited to 0.4%. Also, limits for total reinforcement
including FRP and steel stirrups is given. The shear capacity of the FRP is
(sin cos )fv fe f
f
f
A f dV
s
. (2-28)

31
The effective stress depends on the effective strain:
fe f fef E . (2-29)
The effective strain is determined by different FRP configurations:
0.004 0.75 for fully wrapfe fu . (2-30)
For the U-wrap and side bond, effective bond length is introduced to consider the
reduction of the bond. The effective strain is calculated by
1 2
0.58
1
0.004
0.75 (SI)11,900
23,300 (SI)
( )
for U-wrap
2 for side bonded.
fe v fu
ev
fu
e
f f
f e
f
f e
f
k
k k Lk
Lnt E
d L
dk
d L
d
(2-31)
In ACI, mechanical anchorages can be used to develop larger tensile forces (Khalifa
et al., 1999). The effectiveness of the anchorage has to be verified by physical testing and
the effective strain should be, in no cases, exceed 0.004. ACI 440 2R also has a
reinforcement limits for the total shear strength provided by both FRP and steel shear
reinforcements. The sum of shear strengthen should be limited by
'+ 8f s c wV V f b d in in-lb units and (2-32)
'+ 0.66f s c wV V f b d in SI units. (2-33)

32
2.2.3.2 AASHTO FRPS-1 (2012)
Based tests results of RC T-beams and AASHTO type PC I-girders in NCHRP
Project 12-75, relevant changes have been suggested to AASHTO LRFD Bridge Design
Specifications. The effective FRP strain was expressed by two separate design expression
based on different predominant failure modes, namely FRP rupture (complete wrap or U-
wrap with anchors) and FRP rupture (side bonding or U-wrap).
The shear contribution follows the
(cot cot )sin=
,
f fe f
f
f
fe fe f
A f dV
s
f E
(2-34)
where is the angle of diagonal compression and is the angle of transverse
reinforcement relative to the longitudinal axis of the member.
For the cases with complete wrap or U-wrap with anchors:
0.67
/
4 1.0,
fe fu
fu fu f
f f
R
E
R E
(2-35)
where f fE is in ksi units and limited to 300 ksi.
For the cases with side bonding or U-wrap without anchors or the “full-anchorage”
is not provided:
0.67
0.012
/
3 1.0.
fe fu
fu fu f
f f
R
E
R E
(2-36)

33
Since the effective strain fe is highly dependent on failure modes. Therefore, the
experimental databased contained in NCHRP Report 678 was grouped by the failure modes
of the experimental tests. The expressions of R in Eqn. (2-35) and (2-36) are then obtained
by regression of test data in each group.
2.2.3.3 fib-TG 9.3 Bulletin 14 (2001)
fib-TG 9.3 Bulletin 14 calculates the shear contribution of FRP based on
Triantafillou and Antonopulos’s model (2000). The code provides different safety factors
to account for the difference for preformed FRP and wet lay-up FRP system. Debonding is
considered using a simplified bilinear bond model. The shear contribution of FRP was
proposed as
,0.9 (cot cot )sinfd fd e fu f wV E b d . (2-37)
The design value for effective strain is calculated by multiplying effective strain by a
reduction factor k as
, , ,
where 0.8.
fd e f ek
k
(2-38)
The effective strain is given for different FRP types and configurations of FRP:

34
0.302/3
0.56 0.302/3 2/3
3
,
2/3
0.17 for fully wrap (or properly anchored) CFRP
min 0.65 10 ,0.17 for U-wrap and side bonded CFRP
0.048
cmfu
fu f
cm cmf e fu
fu f fu f
cm
fu
f
E
f f
E E
f
E
0.47
for fully wrap AFRP.fu
f
(2-39)
2.2.3.4 Canadian Code
Canadian Codes for Building (CAN/CSA S806, 2002) and Bridges (CAN/CSA S6-
06, 2006) used a similar equations as ACI 440.2R-08. The shear contribution of FRP is
calculated for different failure modes. The maximum strain of FRP is also limited to 0.4%.
The shear capacity from FRP is calculated as
F F F F f
f
F
A E dV
s
, (2-40)
where F is the resistance factor of FRP. The code also proposed assumed values for F if
there is no precise information: 1) for U-shaped wrapping, F is assumed to be 4000 ; 2)
for side bonding, F is assumed to be 2000 .
The new version of Canadian Codes for Building (CAN/CSA S806, 2012) calculate
the contribution of FRP using:
(cot cot )sinF F F F v F Ff
F
A E dV
s
, (2-41)

35
where F is the orientation angle of the fibers with respect to the longitudinal axis of the
member. The values of F is calculated as follows:
0.006 0.75 (for fully wrap)
0.005 0.75 (for U-wrap with proven anchoring system)
0.75 (for U-wrap without anchoring or side-bond),
F Fu
F Fu
F v Fu Fuk
(2-42)
where vk is calculated as
1 2 0.7511900
ev
Fu
k k Lk
, (2-43)
where the factor 1k is related to concrete strength:
2/3'
127
cfk
, (2-44)
the factor 2k is related to effective bond length:
2F e
F
d Lk
d
and (2-45)
0.58
23300
( )e
F F F
Ln t E
. (2-46)
2.2.3.5 ISIS Design Manual No. 4 (2001)
The design provisions in the document “Strengthening Reinforced Concrete
Structures with Externally-Bonded FRP” (ISIS, 2001) is based on the aforementioned

36
CAN/CSA S6-06 and CAN/CAS S806-02. Design examples and guidance are given in this
report.
2.2.3.6 JSCE Recommendations (2001)
JSCE Recommendations used a performance-based approach to design the RC
structures strengthened by externally bonded FRP sheets. The Vf is calculated as
z(sin cos )f fud f f
fd
f
A fV K
s
, (2-47)
where z is the lever arm length set to d/1.15, and K is the shear reinforcing efficiency,
which is a function of elastic modulus and the FRP reinforcement ratio:
2/3 1/3
1/4
'
1.68 0.67 however, 0.4 K 0.8
1 however, 0.5 2.0.
fud
f f
f cd
K R
fR E R
E f
(2-48)
2.2.3.7 Great Britain Technical Report 55 (2004)
This reports gives the same design suggestion as fib-TG 9.3 Bulletin 14, and also
addressed many issues related to practice in application of FRP materials. The suggested
equations are based on truss model approach, and 45-degree was assumes as the crack
incline angle. Maximum design value for effective strain is limited to half of the ultimate
strain of the material and in no cases exceeds 0.004.
2.2.4 Shear Interaction in the FRP RC Members
In this section, a review of the study related to shear interaction between different
components in FRP RC members are presented. For un-strengthened RC members under
shear, interaction have been found between Vc and Vs (Bower and Viest, 1960; Bazant and

37
Kazemi, 1991; Pang and Hsu, 1996; Yoon et al., 1996; Frosch, 1999; Angelakos et al.,
2001; Tompos et al., 2002). With the existence of FRP sheets, additional interactions have
been observed between Vc and Vf and beween Vs and Vf.
2.2.4.1 Shear Interaction between Vc and Vf
The shear contribution of concrete mainly comes from three parts: the interlock and
friction along the cracks; the shear force in the un-cracked compression section; and the
dowel action. In order to understand the shear interaction between Vc and Vf, the effect of
FRP sheets on the mechanism of Vc has to be carefully studied.
It has been widely accepted that the shear contribution of concrete (Vc) trends to
decrease for the cases with fully wrap FRP sheets (Trantalillou and Antonopoulos, 2000).
The failure mode for the members with fully wrap FRP sheets is mainly FRP rupture, which
results in a larger effective strain developed in the FRP material. And it is reasonably
assumed that the shear crack width is proportional to the effective strain. Thus, a larger
crack width was developed in this failure state, which compromised the shear resistance
mechanism in concrete, which is mainly the friction and aggregate interlock along the
cracks.
Since the magnitude of strain along the FRP affects the shear resistance of Vc, the
beam size is another factor that affects Vc. A beam with a larger size normally means a
longer FRP strip length for deformation in the case of FRP wraps, resulting in a smaller
FRP strain for a given crack width. The current code normally recommends a strain limit
of about 0.004-0.006 to prevent a significant degradation of the concrete shear resistance
mechanism (Khalifa et al., 1998), but does not necessarily prevent the wide cracks.

38
Another aspect to consider the interaction between Vc and Vf is by the concrete
strength. Concrete strength has an influence on the performance of shear strengthening
with FRP from both the local and the global points of view. From the local point of view,
this influence impacts the bonding performance at the FRP-concrete interface. A higher
concrete strength will delay the failure by debonding. From the global point of view, this
influence is linked to the failure scenarios proposed, that can differ depending on the
concrete strength. A low concrete strength will have early crushing of concrete in the
compression zone or in the diagonal struts (Bousselham and Chaallal, 2006a) while it will
decrease bond strength at the FRP-concrete interface. However, despite its importance with
regards to the performance of shear strengthening with FRP, the effect of concrete strength
has not been carefully studied. It should be noted that the guidelines for the design of RC
structures strengthened with externally bonded FRPs consider the concrete strength while
calculating the FRP contribution to shear resistance (ACI 440.2R-08, 2008; and fib-TG 9.3,
2001). Therefore, it may be useful to document this influence analytically and
experimentally.
2.2.4.2 Shear Interaction between Vs and Vf
Although the majority of the existing research (Chajes et al, 1995; Khalifa et al,
1998; Triantafillou, 1998; Triantafillou and Antonopoulos, 2000; Taljsten, 2003; Chen and
Teng, 2003a, 2003b; Monti and Liotta, 2007) and the main design guidelines (ACI 440-
2R-08, CNR-DT 200/2004; ISIS, 2001; fib-TG 9.3, 2001; JSCE, 2001) have adopted the
assumption that the total shear resistance Vn is a summation of Vc, Vs and Vf. But the
validity of this assumption has been questioned by many researchers (Park et al., 2001;
39
Khalifa and Nanni, 2000, 2002; Teng et al., 2004; Pellegrino and Modena, 2002; Denton
et al., 2004; Oehlers et al., 2005; Bousselham and Chaallal, 2004, 2006, 2008).
RC beams with side bonding or U-wraps commonly fail due to the debonding of
the FRP sheets from the side of the beam (Chen and Teng, 2003a, 2003b). In this case, the
crack width of critical shear crack may not be fully developed. Thus, the shear contribution
of concrete Vc normally won’t be affected when debonding failure happens. However,
since the crack width of the critical shear crack is not large when the debonding failure
occurs, the strain in the stirrups that intersects with the shear crack may not reach the
yielding strain, which means the stirrups will contribute less than what is predicted using
the existing shear design models.
Moreover, the amount of the stirrups was also found to have a significant effect on
the shear contribution of FRP sheets, especially for FRP U-wrap (Khalifa and Nanni, 2002;
Bousselham and Chaallal, 2004, 2006; Caroline and Taljsten, 2005a; Pellegrino and
Modena, 2006) The Vf was found to decrease with the increase of the axial rigidity ratio
between the internal steel shear reinforcement and externally bonded FRP sheets
(Bousselham and Chaallal, 2004; Pellegrino and Modena, 2006). Since accurately
measurement of Vs and Vf in the experimental tests is difficult, the mechanism of shear
interaction is not yet well understood (Bousselham and Chaallal, 2004, 2008). In the
NCHRP Report 678, available data (include more than 500 tests carried out worldwide)
has been summarized to study this interaction. In this study, the updated test results (141
tests) up to 2014 were added, the additional tests were listed in Table 2.1 at the beginning
of the chapter. Fig. 2.4 shows the effective strain in FRP for different steel reinforcement
ratio. It can be clearly observed that the shear gain increases with the decrease of the

40
transverse steel reinforcement. The data points were also grouped by the failure mode of
the tests. As shown in Fig. 2.5 and 2.6, the aforementioned trend is more significant in the
specimens failed by FRP debonding when compared to specimens failed by FRP rupture.
Although the influence of the transverse steel reinforcement on the shear contribution of
FRP is shown by experimental evidence, the mechanisms that can explain the physical
inside of this phenomenon steel remains to be discovered. All figures from Fig. 2.4-2.6
follow fE in ksi and '
cf in psi.
Fig. 2.4 Effective Strain of FRP, fe in Terms in Terms of (Adopted from
NCHRP Report 678)
2/3
'/f f cE f

41
Fig. 2.5 Ratio of Effective FRP Strain to Ultimate FRP Strain, /fe fuR , in Terms of
– Beams Failed by FRP Debonding (Adopted from NCHRP Report
678)
Fig. 2.6 Ratio of Effective FRP Strain to Ultimate FRP Strain, /fe fuR , in Terms of
– Beams Failed by FRP Rupture (Adopted from NCHRP Report
678)
2/3
'/f f cE f
2/3
'/f f cE f

42
2.3 DEVELOPMENT OF TRUSS MODEL THEORIES
In this section, a summary of the development of the shear model based on truss
model approach is addressed.
As one of the main approaches to study the shear behavior of the RC members,
truss model concept was by Ritter (1899) and Morsch (1902). The model has a basic
assumption the concrete was separated by diagonal cracks into several concrete “struts”.
The shear resistance mechanism includes the concrete strut that takes the compression and
the internal steel reinforcement (longitudinal and transverse) that takes the tension. Due to
the fact that the angle of the cracks were assumed to be 45 degrees to the beam axis, the
model was called the “45-degree truss model”.
Robinson and Demorieux (1968) are the first to realize that the concrete struts are
subjected to biaxial tension-compression stress condition, which could have significant
difference when subjected to uniaxial compression. They observed and discovered that the
concrete becomes “softened” in compressive direction when there is tensile force applying
on the perpendicular direction. They called this phenomenon “softening phenomenon”.
This phenomenon was essential for accurately predict the shear behavior using truss model
approach. However, they could not evaluate the value of the softening coefficient.
Followed up their work, Vecchio and Collins (1981) studied the softening
coefficient used the facility so-called “shear rig”, and then developed the Compression
Field Theory (CFT), which was able to predict the whole stress-strain curve of the
specimen up to failure points. The main assumption of the CFT is that the direction of the
principal stress is the same with the direction of the principal strain, also the crack direction
is the direction of the principal direction of the concrete. The CFT satisfied the three

43
Navier’s Principles, which are equilibrium, compatibility and material laws. It represents
a major breakthrough in the shear modeling of RC element. The shortcoming of this model
is the tensile contribution of the concrete was ignored, i.e., the concrete was assumed to
take zero force in the tensile direction. By that time, several tests have proven that the
concrete in tension (tension stiffening) exists and significantly affects the stiffness of the
RC members in the post-cracking stage. By apply this into the CFT, Vecchio and Collins
(1986) developed the modified compression field theory (MCFT). However, two
deficiencies were pointed out by Hsu (1998). First, the MCFT violated the basic principle
of mechanics by imposing concrete shear stresses in the principal directions. Second, it was
found by several researchers (Okamura et al., 1985; Shima et al., 1987; Tamai et al., 1987;
Belarbi and Hsu, 1994) that the tensile behavior of the embedded steel rebar is different
than that of a bare rebar. A phenomenon called apparent yielding was observed in several
tests.
The so-called Rotating-Angle Softened Truss Model (RA-STM) was developed at
the University of Houston (Belarbi and Hsu, 1994 and 1995; Pang and Hsu, 1995). The
model illustrates the inside of the softened truss model: the model is all based on smeared
stress/strain concept, which means all the material laws used in the model should be
smeared stress/strain relationships. In order to obtain the accurate “smeared” constitutive
laws of the concrete and the steel in uniaxial tension and biaxial tension-compression, a
Universal Panel Tester (UPT) was built at UH to test full-scale RC panel elements. New
expressions of the constitutive laws of concrete in tension, in compression and steel in
tension were proposed (Belarbi and Hsu, 1994 and 1994) and applied into the RA-STM
(Pang and Hsu, 1995). Compared to the MCFT, the RA-STM has a clearer concept in

44
mechanics and is easier to apply into finite element analysis to further predict the shear
behavior of the whole structure. Later on, Hsu modified the theory and proposed a new
model called Fixed-Angle Softened Truss Model (FA-STM) for considering Vc, shear
contribution of concrete. In this model, the direction of cracks is assumed to be the same
as the direction of the principal direction of the whole member, which is fixed when the
externally applied stresses increase proportionally.
Vecchio (2000 and 2001a) developed the Disturbed Stress Field Model (DSFM),
which included shear slips along crack surfaces and requires a “crack check” as in the
MCFT. Although the DSFM was more complicated when compared with the MCFT
(Vecchio and Collins 1986), the predictions by DSFM and MCFT were found to be similar
for most cases.
Belletti et al. (2001) proposed a fixed crack model considering the stress-strain
relationships of concrete and steel, aggregate interlock, and dowel action. The softening
coefficient ζ proposed by Pang and Hsu (1995) was adopted. The proposed model was used
to predict the panel tests at the University of Toronto (Vecchio and Collins 1982 and 1986;
Collins et al. 1985; Bhide and Collins 1989) and at the University of Houston (Belarbi and
Hsu 1995; Pang and Hsu 1995 and 1996; Hsu and Zhang 1996). The prediction shows a
good agreement with all these shear panel tests.
Although the previous models predicted well in the pre-peak stage, none of them
can accurately capture the descending branch. The first model that can predict the whole
stress strain curve was developed by Hsu and Zhu (2002). The model Softened Membrane
Model (SMM) introduced the Hsu/Zhu ratio to describe the Poisson Effect of the RC
members under biaxial loading, which is the key for predicting the descending portion. The

45
Hsu/Zhu ratio is applicable to RC element in pre- and post- cracking stages based on the
smear stress/strain approaches. The evaluation of Hsu/Zhu ratio was conducted based on
12 panel tests (Zhu and Hsu, 2002). The SMM has been proven to be capable of predicting
the entire stress strain curves including the descending portion.
2.4 DEVELOPMENT OF MATERIAL LAWS OF RC ELEMENT
2.4.1 Concrete in Compression
Softening phenomenon of concrete was first recognized by Robinson and
Demorieux in 1968. They found the web concrete was softened due to its biaxial tension-
compression stress state. The softening coefficient, was proposed to describe the
softening phenomenon. Fig. 2.7 shows an example of stress strain relationship of concrete
under compression considering the softening coefficient.
Fig. 2.7 Example of a Proposed Model for Softening Coefficient (Adopted from Hsu and
Mo, 2010)
Several researchers have investigated the behavior through web crushing tests and
biaxial membrane tests. Vecchio and Collins (1981) studied the softening coefficient by
testing 17 reinforced concrete panels and a softened stress strain curve for concrete in
compression was proposed. Later on in 1982, they modified the equation based on 13 extra

46
panel tests. In the equation they proposed, softening coefficient is only a function of the
tensile strain. Miyahara et al. (1987) conducted experimental tests using hollow cylinders
made of reinforced concrete. They proposed a bilinear equation for the stress strain curve.
Based on same test data, Izumo et al. (1991) proposed a trilinear model. The models
proposed by Miyahara and Izumo both have a constant value of softening coefficient
(0.6) after a strain level, which seems unreasonable due to the fact that with an
extremely large tensile strain, the softening coefficient should approach zero. In University
of Houston, Belarbi and Hsu (1995) studied the effect of five variables on the softening
coefficient, by testing full scale RC panels. The variables include: 1) the principal tensile
strain, 2) the presence of tensile stress at failure, 3) the loading path (sequential and
proportional), 4) spacing of reinforcing, 5) the amount of main longitudinal reinforcement.
They confirmed that the principal tensile strain is the dominant variable. The presence of
tensile stress at failure has no effect on the softening coefficient. The load path, the spacing
of reinforcing bars and the amount of longitudinal reinforcement have a small effect, but
can be neglected for simplicity. Pang and Hsu (1996) studied the behavior of 2-D elements
subjected to pure shear. The test specimens were reinforced with various amounts of steel
bars. The test results of 13 panel specimens confirmed the following equation for the
softening coefficient:
1
0.9ζ
1 400
for Proportional Loading and (2-49)
1
0.9ζ
1 250
for Sequential Loading. (2-50)

47
Later on, many panel tests and analytical studies have been conducted by other
researchers (Zhang and Hsu, 1998; Wang, 2006), different parameters were then included
in the equation for softening coefficient. The parameters that proved to be effective are
namely: concrete strength f’c, and the deviation angle. So the equation of calculating is
expressed as
'
1
5.8 1ζ 0.9 1
241 250c
f
. (2-51)
In 2010, Moslehy (2010) investigated the softening coefficient considering the
contribution of FRP reinforcement with 8 full-scale panel tests experimentally. The extra
variable studied was FRP reinforcement ratio. It was observed from the tests that the
softening coefficient increased with the existence of FRP reinforcement. By regression of
the test data, a new term which represents the contribution of FRP is added into Eq. (2-34):
4'
1
5.8 1ζ 0.9 1
241 250f
c
ff
FRP
and (2-52)
2
3
1
1
4
1 1.12 16 with FRP50,000
1 without FRP.
f fE t
f FRP
(2-53)
By far, this is the only research study related to the softening coefficient of concrete
in FRP RC elements. More tests are needed to validate and evaluate this effect.

48
2.4.2 Concrete in Tension
The stress strain relationship of plain concrete in tension was considered as a linear
elastic curve followed by a brittle failure. For a long period of time, the descending branch
or softening portion of the stress strain diagram could not be observed mostly due to the
limitation of test facilities (Belarbi, 1994). Immediately after the first cracking occurs, the
stress decreases suddenly and drops to zero, which was a challenging task for researchers
to monitor the sudden release of the absorb elastic energy due to cracking. After
modification of the test machines conducted by researchers (Hughes and Chapman, 1966;
Evans and Marathe, 1968; Gopalaratnam and Shah, 1985), the descending portion of the
stress-strain curve was obtained, this portion of the behavior is also known as tension
softening curve, see Fig. 2.8.
Fig. 2.8 Tensile Stress Strain Curve of Concrete
For RC members under tension load, the stress strain curve is linear in the pre-
cracking stage. After crack occurs, the entire tensile stress is carried by the reinforcements
at cracking section. However, the concrete continues to carry tensile stresses between the
cracks due to the existing bond between the rebar and the concrete, which effectively
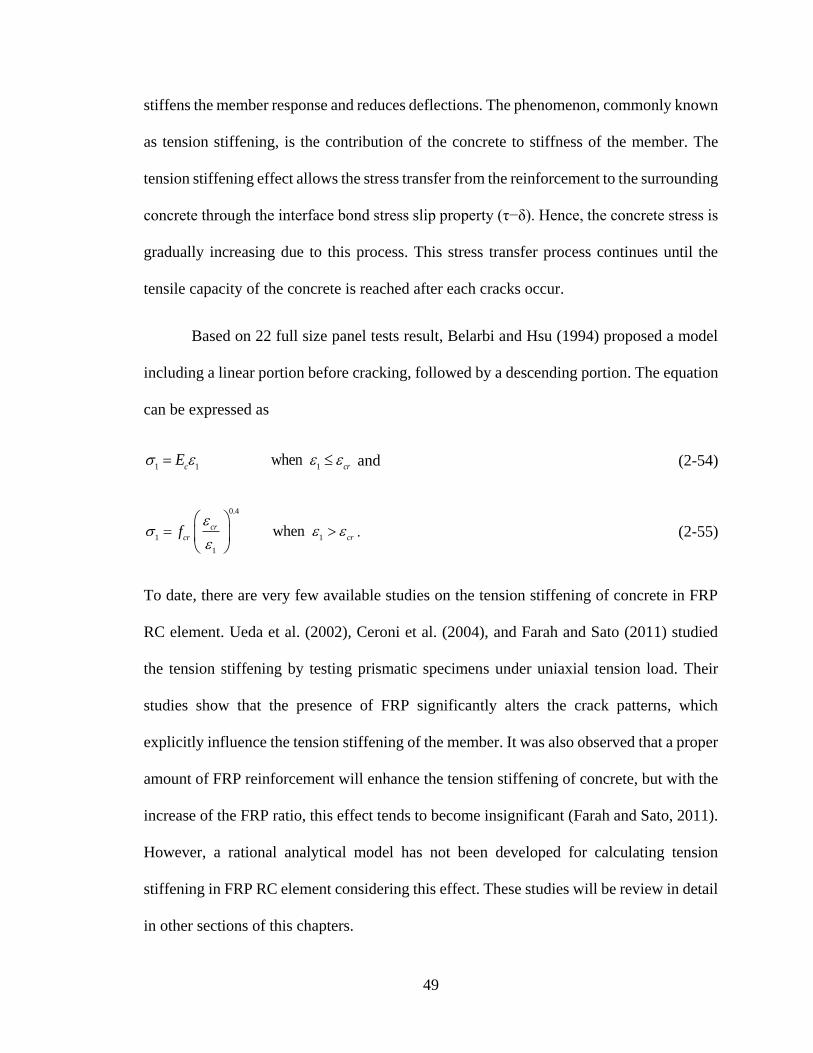
49
stiffens the member response and reduces deflections. The phenomenon, commonly known
as tension stiffening, is the contribution of the concrete to stiffness of the member. The
tension stiffening effect allows the stress transfer from the reinforcement to the surrounding
concrete through the interface bond stress slip property (τ−δ). Hence, the concrete stress is
gradually increasing due to this process. This stress transfer process continues until the
tensile capacity of the concrete is reached after each cracks occur.
Based on 22 full size panel tests result, Belarbi and Hsu (1994) proposed a model
including a linear portion before cracking, followed by a descending portion. The equation
can be expressed as
1 1 1 when
c crE and (2-54)
0.4
1 1
1
when cr
cr crf
. (2-55)
To date, there are very few available studies on the tension stiffening of concrete in FRP
RC element. Ueda et al. (2002), Ceroni et al. (2004), and Farah and Sato (2011) studied
the tension stiffening by testing prismatic specimens under uniaxial tension load. Their
studies show that the presence of FRP significantly alters the crack patterns, which
explicitly influence the tension stiffening of the member. It was also observed that a proper
amount of FRP reinforcement will enhance the tension stiffening of concrete, but with the
increase of the FRP ratio, this effect tends to become insignificant (Farah and Sato, 2011).
However, a rational analytical model has not been developed for calculating tension
stiffening in FRP RC element considering this effect. These studies will be review in detail
in other sections of this chapters.

50
2.4.3 Steel Reinforcement in Tension
The tension stiffening of a reinforced concrete member is usually obtained by
superimposing the average stiffness of the concrete and that of the steel. The tensile
behavior of the steel rebar embedded in concrete, especially in cracked concrete, tends to
be different than that of the bare rebar. For a cracked reinforced concrete specimen under
tension, at the location of the crack, the strain of the steel rebar is the maximum, this strain
will decrease along the rebar due to the bond stress between the steel and concrete. As a
result, the average strain of the steel is smaller than the strain at crack. Once the strain of
steel at the cracks reaches the yield strain, the steel rebar will perform like yielding, see
Fig. 2.9. At this point, the average strain is still smaller than the yield strain. Consequently,
a definition of “apparent yielding point” was introduced to describe the “yielding” point in
this case.
Fig. 2.9 Tensile Stress Strain Curve of Steel
Many researchers have investigated the post-yield behavior of the steel by uniaxial
tension test of RC element (Okamura et al., 1985; Shima et al., 1987; Tamai et al., 1987).
Belarbi and Hsu (1994) proposed a model based on the 22 full-scale panel tests. The
mathematical expressions were proposed based on the results. The simplified bi-linear
model proposed is

51
' s s s s yf E , (2-56)
'0.91 2 0.02 0.25
s y s ss yf B f B E , (2-57)
' '/
y y sf E , '
0.93 2 y y
f fB , (2-58)
1.5
1cr
ys
fB
f
, ' 0.31 MPa , and 0.15%
cr c sf f , (2-59)
where B is a factor for calculating apparent yielding stress considering the effect of
concrete strengthen and steel reinforcement ratio.
Same as tension stiffening of RC, there are very few available studies on the tensile
behavior of the steel reinforcement in FRP RC element. Available data show that the
apparent yielding stress become closer to that of bare rebar with the existence of FRP (Ueda
et al., 2002; Ceroni et al., 2004, Farah and Sato, 2011). However a rational analytical model
has not been developed to calculate the apparent yielding stress for FRP RC element
considering this effect.
2.4.4 Shrinkage Effect on Material Laws
Although most frequently neglected by researchers, shrinkage of concrete is
identified as another important factor that affects the tension stiffening of RC structures
(Kaklauskas, 2001; Bischoff, 2001; Kaklauskas et al., 2009; Kaklauskas and Gribniak,
2011). It was found by Kaklauskas et al. (2009) that most of the previous tension stiffening
models are derived based on the test results of specimen that already experienced
shrinkage. As a result, the calculated tension stiffening curve has an unexpected “negative”
portion when it reaches a certain strain level. As an example, an RC element with cross

52
section of 10.125 in × 7 in, As = 0.4 in2, Es = 30,000 ksi, Ec = 2,500 ksi, fy = 60 ksi, fcr =
200 psi has a shrinkage strain of 200 m/m, the comparison between the calculated tensile
behavior of tension with and without considering the shrinkage effect is presented in
Fig.2.10. It can be seen that the effect of shrinkage is significant and should be carefully
considered. A numerical approach to obtain a shrinkage-free relationship is proposed and
the negative portion of the softening curves has disappeared after shrinkage was eliminated.
In the proposed study, shrinkage has been considered in the derivation of the tension
stiffening equations.
Fig. 2.10 Comparison of a Case Considering Shrinkage and Ignoring Shrinkage
-0.05
0
0.05
0.1
0.15
0.2
0.25
0 0.005 0.01 0.015 0.02 0.025 0.03
Av
erag
e C
on
cret
e S
tres
s (k
si)
Average Concrete Strain (in/in)
Consider shrinkage
Ignore shrinkage
0
10
20
30
40
50
60
70
80
0 0.005 0.01 0.015 0.02 0.025 0.03
Aver
age
Ste
el S
tres
s (k
si)
Average Steel Strain (in/in)
Consider shrinkage
Ignore shrinkage

53
The short-term (creep effect insignificant) shrinkage effect was considered using
the approach proposed by Kaklauskas and Gribniak (2011). A fictitious axial force was
proposed to evaluate the effect of the shrinkage on the specimen. Based on this approach,
the shrinkage strains in the concrete and steel can be expressed as
,
sh s s
c sh
c c s s
E A
E A E A
and (2-60)
,
sh c c
s sh
c c s s
E A
E A E A
, (2-61)
where sh is the shrinkage strain in a plain concrete specimen. Gribniak (2009) suggested
to calculate the initial shrinkage strain sh of concrete by Eurocode 2 method. The same
approach was applied in this study to account for the effect of shrinkage for each specimen.
2.4.5 Hsu/Zhu Ratio
The Poisson ratio is known in mechanics to describe the strain change in one
direction due to the change of the strain in the perpendicular direction. The definition of
Poisson ratio is only valid for continuous isotropic materials. By utilizing smeared crack
concept, Hsu and Zhu (2002) proposed so-called Hsu/Zhu ratio to describe the similar
effect for cracked reinforced concrete, see Fig. 2.11.
Fig. 2.11 Hsu/Zhu Ratio 12 and 21 under Biaxial Loading

54
The significance of the Hsu/Zhu ratio is that the SMM can predict the descending
portion of the stress-strain behavior of the RC under shear stress. Twelve full-scale panel
tests were conducted by Zhu and Hsu to study the Hsu/Zhu ratio. They proposed the
equations from the test results as
12υ 0.2 850ε
sf ε ε
sf y , (2-62)
12υ 1.9 ε ε
sf y , and (2-63)
21
0.2 Before crackingυ
0 After cracking.
(2-64)
It should be noted that for the cracked RC element in the post-yielding stage, the
Hsu/Zhu ratio is higher than 0.5, which is the maximum value of Poisson ratio for
continuous solid materials. The reason is that the smeared tensile strain of cracked RC
element includes not only the strain of the material, but also the opening of cracks. By
considering the cracked RC element as continuous material, the Hsu/Zhu ratio could then
be significantly high (equals to 1.9). Due to the additionally bond action created by the
externally bonded FRP sheets, the Hsu/Zhu ratio is expected to be smaller than that in RC
element. No similar research has been identified in the literature to evaluate Hsu/Zhu ratio
for FRP RC element.
2.5 STUDIES ON THE MATERIAL LAWS OF FRP RC ELEMENT
Up to date, there are limited investigations regarding the constitutive laws of FRP
RC elements under uniaxial tension load. In this section, these available investigations are
briefly reviewed and the main conclusions are summarized.

55
2.5.1 Experimental Investigations
Ueda (2002) tested 14 prismatic FRP RC specimens under tension. Two types of
specimens with different width of CFRP sheets and different strain gage arrangements were
tested to study the constitutive laws of concrete, steel and FRPs as well as the bond
behavior among them. The test specimen is 50 in long with a testing zone of 47 in. The
load was applied through the reinforcing bars at the end. Additional stirrups and
confinement plates were used to strengthening the edges of the specimen. The details of
the specimen is shown in Fig. 2.12.
a) Specimen and Strain Gauge on CFS
b) Specimen and Strain Gauge on Steel Bar
Fig. 2.12 Test Specimen for Ueda et al. (2002)
Strain gages were mounted on the rebars and on the FRP sheets to capture the strain
variation along the material. Different FRP and steel reinforcement ratios were chosen. The
main findings of this study includes: a) CFRP sheets reduced the crack spacing. As a result,
the average bond stresses on the steel reinforcing bar became smaller; b) The apparent
yielding stress of the reinforcing bar increased with both the CFRP ratios and the steel
reinforcing bar ratio; c) The average concrete stress without CFRP sheets was smaller than

56
that in the specimen with CFRP sheets but became smaller as the CFRP reinforcement ratio
increased.
Ceroni et al. tested three series of four tie specimens by applying a tensile force
using the test setup shown in Fig. 2.13. The test specimen was a 47 in long prism with a
square cross section of 3.9 in×3.9 in. Each series includes one reference specimen and three
specimens externally strengthened with FRP sheets. The FRP sheets contains GFRP and
CFRP. The internal steel reinforcement includes one reinforcing bar with a diameter of
0.39 or 0.55 in.
Fig. 2.13 Test Setup for Ceroni et al. Tests (2004) (25.4 mm=1 in)
The test parameters include FRP type (CFRP, GFRP), FRP reinforcement ratio
(layers of sheets), steel reinforcement ratio (bar size), as well as the concrete strength. The
main findings of this study are: a) The effect of FRP on the tension stiffening is relevant
when comparing the experimental results at the same load level, but negligible when
considering the same steel stresses, which means FRP may not affect the tension stiffening

57
behavior of the steel bar; b) The FRP has an effect on the variation of crack spacing and
crack widths.
2.5.2 Analytical Investigations
Based on the test data of Ceroni et al. (2002), Pecce and Ceroni (2004) proposed a
model to analyze the tensile behavior of the RC ties strengthened with FRP laminates. The
approach is one dimensional but allows introducing any nonlinear constitutive relationship
for materials and bond laws. The constitutive law of steel is considered before and after
steel yields; The FRP constitutive law is linear; for the bond behavior at the steel and
concrete interface, the well-known model developed by Eligehausen et al. (1983) is
introduced, considering the bond degradation near cracks; and for the bond behavior
between FRP and concrete, nonlinear behavior is considered without degradation near
cracks. The model showed a good prediction of load-strain curve when compared with the
experimental results.
Based on the test results of Ueda et al. (2002), Farah and Sato (2011) proposed a 2-
D nonlinear numerical model by using the rigid body spring method (RBSM). In the code,
different constitutive laws were used for different material components and the interface
between FRP/steel and concrete was defined by different bond-slip relationships. Since the
constitutive laws are the main research domain in this study, the constitutive modeling of
the proposed method is reviewed.
As previously presented in the review of the experimental tests, the tension
stiffening has been found to be greater in FRP RC element than that in RC element. The
following expression was proposed as

58
3
1 2 3
1 exp
.
cc cr
ct ct
ccr
ct ct cr cr
ctcr
c
Ef f
c c cf
f
E
(2-65)
The parameters c1, c2 and c3 are defined as a function of the internal reinforcement
ratio s, external reinforcement ratio f, the steel-to-concrete modular ratio and the CFS-
to-concrete modular ratio. These parameters are calibrated using the test data of Ueda et al.
(2002). The calibrated model shows an acceptable agreement with the test results, see Fig.
2.14.
a) Specimen (S-1-1) (s=0.5%) (f=0.07%) b) Specimen (S-1-2) (s=0.5%) (f=0.13%)
Fig. 2.14 Comparison of Stress-strain Curve of Concrete between the Proposed Model
(Farah and Sato., 2011) and Experimental Results (Ueda et al., 2002)
The stress-strain relationship of a deformed steel bar is usually assumed to be elastic
and then perfectly plastic. It was observed that the apparent yielding stress is greater in the
strengthened members than in the un-strengthened member. To account for this, the
following expressions were proposed as

59
* * *
* * *
4 5
*
4 5
for for
(1 )
s s s s n s o p s s n
s p
n y p s o n
s
o y
f E f f f f E f f
E Ef c f E c E f f
E
f c c f
and (2-66)
4
4 5 5 4
for
(1 ) for .
s s s s y
s y s s s y
f E f c f
f c c f c E f c f
(2-67)
The values of the parameters were also calibrated by regression of the test results.
The model had a good prediction of the stress-strain curve of the rebar, see Fig. 2.15.
a) Specimen (S-3-0) (s=1.27%) (f=0%) b) Specimen (S-3-1) (s=1.27%) (f=0.12%)
Fig. 2.15 Comparison of the Stress-strain Curve for steel in tension between the Proposed
Model (Farah and Sato, 2011) and Experimental Results (Ueda et al., 2002)
2.6 LITERATURE GAPS AND SUMMARY
In this chapter, a comprehensive literature review is conducted on the shear
strengthening of RC structures with externally bonded FRP sheets. The state-of-art
analytical and experimental investigations have been briefly reviewed and the development
truss model theory was introduced. Previous research studies have shown that to rationally
predict the shear behavior of FRP RC element using truss model approach, the constitutive
laws of each components and the interaction between them have to be carefully

60
investigated (Farah and Sato, 2011). Up to date, only few studies have been conducted on
constitutive modeling of the components in FRP RC elements. The results of these studies
show that with the existence of externally bonded FRP sheets, the constitutive laws of
concrete and steel will be altered when compared with the un-strengthened RC members.
To validate this phenomenon and evaluate these changes of constitutive laws, more tests
need to be conducted. In this study, both uniaxial and biaxial constitutive laws of different
components in FRP RC elements are investigated, and the results is expected to fill the gap.
Moreover, several other gaps related to the shear strengthening using FRP are also
addressed here in this section. In general, most of the current conducted test are rectangular
and small scale as shown in Table 2.1 in the former section. Also, several parameters that
have been found to have an effect on the shear behavior was not fully understood and there
is no sufficient data to carefully investigate these factors:
a) Scale Factor: For RC beam without shear reinforcement, the shear resistance
decreases as the beam size increases. The phenomenon was found also in FRP RC beams
that shear strengthening showed a tendency for a decrease in the shear gain due to FRP as
the height of the specimen increased (Bousselham and Chaallal, 2004; Leung et al., 2007).
Fig. 2.16 showed that this phenomenon is more evident in the specimen that failed in
debonding. However, the predictive models are largely based on test results which are
mostly obtained from small-scale testing.
b) Pre-Loading/Cracking: Externally strengthening with FRP is most suitable for
existing in-service structures that often are pre-cracked. The very few investigations carried
out on RC beams that were pre-cracked prior to their strengthening indicate that pre-
loading does not affect the shear performance of retrofitted beams (Czaderski, 2002;

61
Carolin and Taljsten, 2005a, Hassan Dirar et al., 2006; Belarbi et al., 2012; Murphy et al.,
2012; and Dong et al., 2013). However, this finding may need to be confirmed by further
tests.
c) Shear Fatigue Load: As shear fatigue behavior of RC beams has been studied
since 50s, but it has not been well studied for FRP RC element. Only limited test has been
done, and among these tests, most of them are flexural fatigue. The shear fatigue tests that
have been done show a very limited degradation of shear behavior of FRP RC beams under
fatigue load compared to static load.
d) Prestressing: The only available study on PC beams strengthened in shear with
FRP was conducted by Hutchinson and Rizkalla (1999). The study reported that the
prediction by the shear equations proposed by the authors based on ACI 318 was in good
agreement with the test results of seven prestressed concrete beams strengthened with
CFRP strips. Because most bridge girders are made of prestressed concrete, further studies
dealing with prestressed concrete are needed. Recently in 2012, four tests were conducted
on 54 in.-deep pre-stressed I girders in UT Austin, but prestressing is not investigated as a
parameter in this study.
In this chapter, a comprehensive review has been presented on the knowledge
related to the shear strengthening of RC using FRP sheets. The development of truss model
approach and the constitutive modeling are emphasized. The literature review indicates
that a huge gap exists in experimental and analytical investigations in constitutive modeling
of FRP RC element under various stress fields. To fill this gap, the experimental and
analytical investigations on the constitutive modeling in this study will be presented in
detail in the following chapters.

62
CHAPTER 3 UNIVERSAL PANEL TESTER
3.1 INTRODUCTION
The experimental tests in this research were carried out with the Universal Panel
Tester (UPT) at the University of Houston (Hsu, Belarbi, and Pang, 1995). The UPT was
built in 1980s and has been used by the UH research group to develop several analytical
models related to shear and torsion. The UPT is capable of applying various combination of
in-plane and out-of-plane stresses to the test specimen. It is a powerful tool to study the in-
plane and out-of-plane behavior of RC elements. To control all the 40 in-plane jacks and 10
out-of-plane jacks, the UPT is equipped with a sophisticated servo control hydraulic system.
To better understand the loading procedure, test setup and the load/strain control methods
in the experimental program, this chapter presents the information of the UPT in terms of
the machine setup and the principles of the servo controller and hydraulic systems. Finally,
the servo controller arrangement in the test program is also presented.
3.2 GENERAL DESCRIPTION
The test specimens for test panel tester are 55 in. × 55 in. and the thickness can be
up to 16 in. Reinforced concrete panels with full-size steel reinforcement can be tested. Fig.
3.1 shows the north and south view of the UPT.
The UPT is capable of applying varies combination of in-plane and out-of-plane
loads to the specimen through 37 in-plane jacks (with a capacity of 200 Kips/jack in tension
and 250 Kips/jack in compression) and 3 in-plane rigid links, as well as 7 out-of-plane jacks
(with a capacity of 120 Kips/jack in tension and 150 Kips/jack in compression) and 3 out-
of-plane rigid links. Fig. 3.2 shows the illustration of the load application for in-plane and
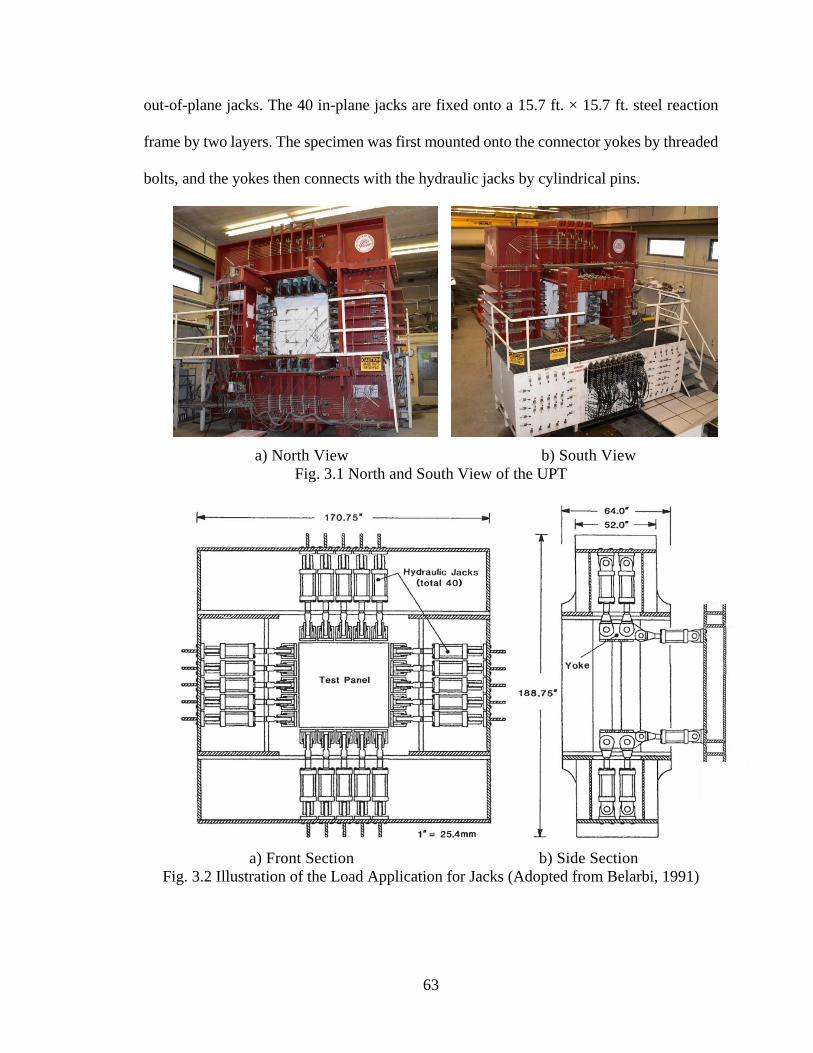
63
out-of-plane jacks. The 40 in-plane jacks are fixed onto a 15.7 ft. × 15.7 ft. steel reaction
frame by two layers. The specimen was first mounted onto the connector yokes by threaded
bolts, and the yokes then connects with the hydraulic jacks by cylindrical pins.
a) North View b) South View
Fig. 3.1 North and South View of the UPT
a) Front Section b) Side Section
Fig. 3.2 Illustration of the Load Application for Jacks (Adopted from Belarbi, 1991)

64
The UPT was originally designed to test specimen using only load control mode.
Later in 1993, a closed-loop servo-control system was designed specifically for the UPT
to conduct test using strain control mode (Hsu, Zhang and Gomez, 1995). By using the
strain control mode, the post-yielding behavior can be captured more accurately. Up to
date, the UPT is unique in the world that can be used to test the full-size RC panel using
both load control and strain control modes.
3.3 SERVO-CONTROLLED HYDRAULIC SYSTEM
In order to better understand the control method used in this research, the principle
of the closed-loop servo control for hydraulic system is presented in this section. This
system was originally designed and installed in 1993, and the schematic diagram is shown
in Fig. 3.3 (Hsu, Zhang, and Gomez, 1995). The hydraulic system can be controlled by two
controllers, namely the manual controller and the servo-controller. The manual control
mode is designed for specimen installation. Using the manual control mode, each jack can
be controlled individually by strain control mode. When the specimen is in position, each
of the hydraulic jack can be extended or contracted to fit position of the pin connections
between the yokes and the jacks. The valves of the manual switch can control the jack to
be in tension, in compression, or in holding status. The suggested oil pressure under the
manual control mode is 500 psi. For the servo-controller mode, the forces/load are
controlled by the servo system. The servo-control system contains ten channels, each
including a servo controller and a servo-valve package. Each servo-valve package includes
a servo-valve, a manifold with 10 pairs of outlets, and a pair of Delta P pressure transducers.
For each channel, different oil pressure can be applied for different test purposes. These
different oil pressure can be applied to any jack by connecting the jack with the manifold

65
using the specially designed Quick-Disconnected connections. A pair of flexible hoses is
connected to the pair of jack terminals which is connected to the jack. By using this setup,
various combination of loading along the side of the specimen can be applied as designated.
These ten manifolds are controlled by ten servo boxes. The servo boxes receive command
from the programmer computer and the feedback from either Delta P transducers (load
control) or LVDTs (strain control), compare them and send a signal to the servo valve on
the manifold to adjust the oil pressure accordingly. The detail of the close-loop system is
discussed in the following section.
Fig. 3.3 Schematic Diagram of Control System
The basic principle of the closed-loop servo-control system is shown in Fig. 3.4
(Hsu, Zhang, and Gomez, 1995). It can be seen that two feedback selections are available
in the system. The first selection (signal condition #1) is for load control mode. In this
condition, the feedback is the loading read from the Delta P transducers attached on the ten

66
manifolds. The second selection (signal condition #2) is for displacement/strain control. In
this case the feedback signals come from the average values of the horizontal/vertical
LVDTs on each side of the specimen. All the experimental feedbacks are in voltage. The
feedback values will be compared with the pre-assigned program signal in a voltage
comparator unit. If there exists a difference in voltage, an error signal will activate the
servo-valve to adjust the oil pressure in the manifold so that the desired condition for
load/strain is achieved. This procedure will continue throughout the whole tests.
Prior to 1995, the servo control system can only conduct the test use either load
control or strain control, there could be no switch between these two modes during the
tests. In 1995, a new software was installed so that the mode can be switched during the
test as needed.
Fig. 3.4 Details of the Closed-loop Servo-control System

67
3.4 STRAIN MEASUREMENT
From the 30 years of panel test experiences at the University of Houston, a total of
20 LVDTs were proposed to measure the average strain on each side of the specimen.
Twelve female 3/8 in. (9.5 mm) in diameter threaded LVDT anchors with couple nuts were
pre-cast in the panel. Later on these anchors were used to securely fasten the LVDTs to the
panel. Before a test, these 20 LVDTs were arranged symmetrically on both sides of the
panel as shown in Fig. 3.5. They were arranged to measure the strains in four directions:
horizontal, vertical, and two diagonals. Eight LVDTs with 1/2 in. range were used to
measure the compressive strains in the vertical direction, and eight LVDTs with 2 in. range
were used to measure the tensile strains in the horizontal direction. Four LVDTs with 1 in.
range were used for the measurement in the diagonal directions. These 20 LVDTs were
held by 4 pairs of corner brackets and 8 pairs of L-shape brackets. The brackets were
fastened securely to prevent any movement of the measuring point.
The gage length is 31.5 in. for the horizontal/vertical LVDTs and 44.5 in. for the
diagonal LVDTs. The initial values of the LVDTs were zeroed mechanically by adjusting
the position of the rods (sensor attached), then electronically zeroed by the servo-boxes
before the test started.

68
a) North Side
b) South Side
Fig. 3.5 LVDT Arrangement for the Panel Test
3.5 CONTROL ARRANGEMENT
In this research project, two different control arrangements were designed for
different test purposes. The following section shows the details of the control arrangements
used in this research.

69
3.5.1 Uniaxial Tension Test
Since there are only four jacks that were used to apply the tension load to the
specimen in the uniaxial tension test, two manifolds and two servo control boxes were
designed to conduct the test. No. 10 and No. 16 jacks on the north and south sides were
chosen as the loading jacks. In order to maintain the same applied load on the left and right
sides of the panel, the two jacks on one side (North/South) of the panel were controlled by
the same manifold, i.e., the oil pressure in these two jacks were kept the same at all time.
The jacks on north side were connected to manifold 10 and controlled by Box 10 while the
ones on the south side were connected to manifold 4 and controlled by Box 4, as shown in
Fig. 3.6. The aforementioned control method was achieved by the cable arrangements
shown in Fig. 3.7.
The test was designated to start with load control mode till cracking, then switched
to strain control mode till failure of the specimen. In the load control mode, the feedback
from the pressure transducers attached on the manifold. In the strain control mode, the
LVDT readings were used as feedback. On each side of the test specimen, there is one
LVDT attached on the surface of the specimen, details of the instrumentation of uniaxial
test are presented in the experiment section. The reading of strain values goes into control
Box 10 and Box 4 as input to compare with the given command strain, then a proper
command signal will be sent to the servo valve to control the load to achieve the target
strain.

70
Fig. 3.6 Control Arrangement for the Uniaxial Tension Test
3.5.2 Biaxial Tension-Compression Test
For the biaxial tension-compression test in this project, eight oil pressures in the 8
servo valve manifolds were each controlled by a servo valve which, in turn, was monitored
by a controller. On each manifold, up to 10 jacks could be connected by flexible hoses and
fixed steel tubing. Of the 8 controllers, four are called programming controllers, No. 3, 4,
8, and 10. These can be directly controlled by the programming computer to achieve the
expected load levels. The other four controllers can be controlled by the signals from these
four programming controllers or by the signals from the in-plane rigid links. Three in-plane
rigid links were installed to supply reactions from the jacks and to fix the test panel in space.

71
Fig. 3.7 Cable Arrangement for the Uniaxial Tension Test
AVG
SH LVDT
RL 8
AVG
NH LVDT
AVG
Input
AVG
Output
Programmer 2
XD
1
XD
2
XD
3
Programmer
Input
Channel Input
Channel Output
Box 2
Box 4
Box 8
Box 10 Box 9
Box 7
Box 3
Box 1
Programmer 1

72
Fig. 3.8 and 3.9 shows the servo control system and the cable arrangement of the
biaxial tension-compression tests. In the north side, jacks N11 and N15 are actually the
rigid links to fix the test panel in the vertical direction. Jack N8 is the rigid link to fix the
test panel in the horizontal direction. During a test, all the unbalanced forces would be
taken by the rigid links. The load cells readings in the rigid links were sent as input signals
to the controllers. For the panel tests in this research the 20 jacks in the south side and the
17 jacks in the north side were controlled individually to make the strains on both faces of
a panel more uniform. Controllers 3, 4, 8, and 10 were controlled directly by the
programming computer. Controllers 1 and 2 were controlled by controllers 4 and 3,
respectively. Controller 7 was controlled by the signal from the rigid link N8; and controller
9 was controlled by the average signal from rigid link N11 and N15.
On the south face, the jacks at the bottom, to the west, at the top, and to the east
were supplied by manifolds 3, 4, 2, and 1, respectively. On the north face, the five jacks at
the bottom and to the west were supplied by manifolds 8 and 10, respectively. The four
jacks N6, N7, N9, and N10 were controlled by manifold 7; and the three jacks N12, N13
and N14 by manifold 9. After yielding, the strain-control mode was used. The average
value of four vertical LVDT signals on both south and north faces of the panels were sent
to controllers 3 and 8, respectively, as vertical strain feedbacks. In a similar way, the
average values of four horizontal LVDT signals on both south and north faces were sent as
horizontal strain feedbacks to controller 4 and 10, respectively.

73
a) North Side
b) South Side
Fig. 3.8 Control Arrangement for the Biaxial Tension-compression Test

74
Fig. 3.9 Cable Arrangement for the Biaxial Tension-compression Test
Programmer 1
AVG
SV LVDT
Programmer 2
RL 11
AVG
SH LVDT
Programmer 3
Programmer 4
RL 8
RL 15
AVG
RL 11&15
AVG
NH LVDT
AVG
NV LVDT
AVG
Input
XD
1
XD
2
XD
3
Programmer
Input
Channel Input
Channel Output
Box 2
Box 4
Box 8
Box 10 Box 9
Box 7
Box 3
Box 1
AVG
Output

75
The aforementioned control method was achieved by arranging the electric cables
at the back of the servo-boxes (Fig. 3.9). In the softening test, both load control and strain
control were used, but in the Hsu/Zhu ratio test, only load control was used. Thus, the
control arrangement for softening test can be applied to the Hsu/Zhu ratio test.
3.6 SUMMARY
To better understand the loading procedure, test setup and the load/strain control
methods in the experimental program, this chapter presents the information of the Universal
Panel Tester with details, including the setup, the principles of the servo-control and
hydraulic systems. In next chapter, the details of the experimental program will be
presented.

76
CHAPTER 4 EXPERIMENTAL PROGRAM
4.1 GENERAL DESCRIPTION
To fulfill the research objectives and investigate parameters that affect the various
material laws of FRP RC elements, large-scale tests were conducted. The experimental
program was designed to study the following material laws: (1) concrete in tension; (2)
steel in tension; (3) softening coefficient; (4) modified Hsu/Zhu ratios. The main variables
investigated are steel reinforcement ratio, FRP reinforcement ratio and wrapping schemes
of FRP sheets.
Fig. 4.1 shows the outline of the experimental program. It includes uniaxial tension
tests of prismatic members and biaxial tension-compression tests of square panels. The
results of uniaxial tension tests were used to develop the constitutive laws of concrete and
steel in tension; the results of biaxial tension-compression tests were used to develop
softening coefficient and modified Hsu/Zhu ratios. For the uniaxial tension test, thirteen
prismatic specimens with a cross section of 7 in. × 101/8 in. and a length of 55 in. were
tested; for the biaxial tension-compression tests, six full-scale square panels (55 in. × 55
in.) with a thickness of 7 in. were tested. In the following section, the details of the test
program are given, which includes objective of the experimental program, material and
fabrication of specimen, experimental setup, instrumentation method and loading
procedures of each test.

77
Fig. 4.1 Outline of the Experimental Program
4.2 MATERIAL
The same type of concrete, steel rebars and FRP sheets were used for uniaxial
tension tests and biaxial tension-compression tests. The concrete strength was designed to
be close to 6000 psi; Grade 60 deformed rebars with different sizes (No. 3, 4 and 5) were
chosen as the internal steel reinforcements; two thicknesses (0.025 in and 0.04 in) of CFRP
sheets were used as the externally bonded FRP reinforcements. In the following section,
details of these materials are presented.
4.2.1 Concrete
A cylinder compressive strength of 6000 psi (41.4MPa) was chosen to be the target
strength of the concrete in the test program. The mix ratio (based on weight) for cement,
aggregate, sand was 1:2.02:1.19. The water-cement ratio was chosen to be approximately
0.48. The workability was controlled by the slump test with a desired value of 8 in. Type
III high-early-strength Portland cement was used. The sand satisfies the requirements per
ASTM C33. The graded limestone aggregate had a maximum size of ¾ in.

78
For the uniaxial tension test, five specimens were cast at one time and each cast
contains two batches of mixing. For the panel test, each panel requires two batches of
mixing. For each batch of mixing in this program, three 6 in×12 in cylinders and one 6
in×20 in beam were cast. The cylinders and beams were cured in the same environmental
conditions as the specimens and were removed from the formwork at same time as the
specimen. The specimens as well as the cylinders and beams were cured with saturated
burlap covering on top beneath a plastic sheet in the air-conditioned lab temperature. The
cylinders were tested on a Tinius Olsen Universal testing machine. The cylinder test
satisfies the ASTM C39. The compressive stress and strain were recorded up to the peak
point. Fig. 4.2 shows the typical compressive stress-strain curve and the parabolic
simulation. It can be seen that the parabolic curve can well simulated the compressive
stress-strain curve of concrete. The Young’s Modulus Ec for the concrete can be decided
using ACI method, which was developed by Pauw (1960). In this method, Ec was defined
as the slope of the line drawn from zero to the point when stress is equal to 0.45 f’c. All the
cylinders were tested at the same day as the specimen. The beam was cast to test the pull-
off strength of the FRP-concrete interface. The details of the pull-off test are shown in the
section 4.2.3.
Fig. 4.2 Typical Stress-strain Curve from Concrete Cylinder Compression Test

79
4.2.2 Steel Reinforcements
Grade 60 deformed reinforcing bars of different sizes were used as the steel
reinforcements. The stress strain characteristics of the rebars were determined by coupon
tests. The manufacturer provided the steel rebar in several batches, for each batch and each
size of the rebar, three 16 in coupons were cut as samples. The coupons were tested with
the Tinius Olsen Universal testing machine. The tensile strain of the coupon test was
measured by an extensometer with a gage length of 2 in. The load was captured by a
calibrated load cell on the hydraulic cylinder.
The test setup of the specimen requires welding at the end of the rebar. And the
excessive heat generated in the steel from the welding could cause early failure at the edge
of the specimen (Belarbi, 1991). Therefore, weldable high ductility rebars were used in the
test. The rebars used in this particular test program were ASTM A706 low-alloy steel
deformed bars. This type of rebar is specially made for structure steel that requires welding.
The ultimate strains from the conducted coupon tests were all greater than 20%. Typical
stress strain curves for all rebars are shown in Fig. 4.3. It can be seen that only No. 3 rebar
has the yielding plateau, the No.4 and 5 have no clear yielding plateau. This behavior
affects the constitutive laws of the materials developed in this research, the details will be
addressed in the analytical investigations. The material properties of the rebar are shown
in Table 4.1, the modulus of elasticity is between 27359 ksi and 28326 ksi. The yield
strength is between 66.5 ksi and 68 ksi. The yield strength for #4 and #5 is obtained using
0.2% strain offset method, the elasticity modulus are determined by the slope of the linear
portion of the stress-strain curve, as shown in Fig. 4.4.

80
Fig. 4.3 Typical Stress-strain Curves of the Rebars
Fig. 4.4 Method of Calculating Es and fy for No. 4 and No. 5 Rebar
Table 4.1 Mechanical Properties of the Rebars
Rebar Size fy (ksi) fu (ksi) Es (ksi) u
No.3 66.5 87.4 27,359 0.245
No.4 67.0 106.2 27,565 0.212
No.5 68.0 107.1 28,326 0.240

81
4.2.3 FRP Sheets
In the experimental program, two types of FRP sheets were used, namely Tyfo®
SCH-11UP and Tyfo® SCH-41S. The manufacturer Fyfe Co. suggests to use the Tyfo® S
Epoxy as the adhesive for the application of these two FRP sheets. The Epoxy has two
components A and B, which are mixed by a ratio (by volume) of 100:42 for 5 minutes at a
mixer speed of 400-600 RPM until uniformly blended. And the curing time of the epoxy
was suggested to be at least 72 hours. To have a quality control of the bond strength of the
FRP-concrete interface, the standard pull-off tests were carried out by using the Dyna Z16
pull-off tester. The test follows the requirements of ASTM D7522. Before the pull-off test,
several 2 in diameter cores were cut by a core drill, then the 2 in diameter aluminum disks
were attached onto the FRP sheets by Devcon high strength epoxy, with manufacture tested
strength of 1500 psi, see Fig. 4.5a). The strength of the epoxy has to be greater than the
epoxy used for the FRP sheets to guarantee the failure happened inside the concrete. When
testing, the disk was attached to the pull-off tester and the pull-off load was applied by the
manual crank, see Fig. 4.5b). The ultimate load was captured by the load indicator and used
to calculate the pull-off strength. Fig. 4.5c) shows a typical failure mode. As per ACI
440.2R-08, the minimum bond stress fpull-off required for the FRP-concrete interface is 200
psi. The details of the pull-off test results are presented in the Table 4.2 of the following
section. The test results showed that the bond strength satisfies the ACI requirements.
Coupon tests for the FRP composites were conducted by Moslehy (2010) and the results
gathered from coupon tests showed a close correlation (within 5% difference for both
Young’s Modulus Ef and ultimate stress ffu) with those shown as test results by the

82
manufacturer. The material properties of the FRP sheets were presented in Table 4.2 in the
following sections.
a) Disk Attached to Core
b) Setup of Pull-off Test c) Typical Failure Mode
Fig. 4.5 Pull-off Tests for the FRP-concrete Interface
4.3 UNIAXIAL TENSION TEST
4.3.1 General Introduction
The tensile constitutive laws of steel and concrete are required in the modified
softened truss model theory. Uniaxial tension tests were designed to study these
constitutive laws. As mentioned in the literature review, there exists a high interaction
between the components that constituting the composites when subjected to tension. Thus,
different combinations of FRP/steel reinforcement ratios were designed in the research.
Also, as a key issue affecting the behavior of FRP strengthened RC members, the effect of
different wrapping scheme was also studied. Three most commonly used wrapping
methods were chosen, namely fully wrap, side bonding, and U-wrap with anchors. The
details of the three wrapping schemes are shown in the following sections.

83
The test specimens were prisms with a cross section of 101/8 in. × 7 in., and 55 in.
in length. The FRP sheets were applied on two opposite sides of the specimen. The FRP
sheets are 8 in. wide and applied using the wet layup method. To prevent the local failure
in the loading zone at the specimen end, additional confinement plates were installed
through threaded rods. The reinforcing bars were welded onto a pre-embedded connector
inserts that were connected to the loading actuators. Fig. 4.6 shows the details of the
specimen. The test matrix of the uniaxial tension test is shown in Table 4.2. The specimens
are identified by steel rebar sizes (#3, #4 and #5), FRP thicknesses (0.025 in and 0.040 in),
and wrapping schemes (Fully Wrap, Side Bond, U-wrap with FRP Anchor). As an example:
S4-025-SB stands for the specimen with #4 rebar, 0.025 in thick FRP sheet and Side Bond
(SB) wrapping scheme method. REF-R3, REF-R4, and REF-R5 stand for RC reference
specimens with #3, #4 and #5 rebars, repectively.
Fig. 4.6 Specimen of the Uniaxial Tension Test

84
Table 4.2 Material Properties of the Uniaxial Tension Test
Specimen
Name f'c (psi) s (%) fy (ksi) Es (ksi) f (%) fu,FRP (ksi) Ef (ksi) fpull-off (psi)
REF-R3 6,119 0.31 66.5 27,359 0 NA NA NA
REF-R4 6,119 0.55 67.0 27,565 0 NA NA NA
REF-R5 6,119 0.87 68.0 28,326 0 NA NA NA
S3-025-FA 6,699 0.31 66.5 27,359 0.56 120 12,000 610
S3-040-FA 6,699 0.31 66.5 27,359 0.90 127 10,500 610
S4-025-FA 6,971 0.55 67.0 27,565 0.56 120 12,000 680
S4-040-FA 6,699 0.55 67.0 27,565 0.90 127 10,500 610
S5-025-FA 6,699 0.87 68.0 28,326 0.56 120 12,000 610
S5-040-FA 6,971 0.87 68.0 28,326 0.90 127 10,500 680
S4-025-SB 6,119 0.55 67.0 27,565 0.56 120 12,000 550
S4-040-SB 6,971 0.55 67.0 27,565 0.90 127 10,500 680
S4-025-FW 6,119 0.55 67.0 27,565 0.56 120 12,000 550
S4-040-FW 6,971 0.55 67.0 27,565 0.90 127 10,500 680
For the test matrix, it can been see that the main parameters studied are steel
reinforcement ratio, FRP reinforcement ratio and wrapping schemes. Several other
parameters were kept constant, as shown Table 4.3.
Table 4.3 Constants and Studied Variables in Uniaxial Tension Test
Constants Variables
Concrete strength
Concrete thickness
Cover length
Spacing of rebar
FRP Configuration
Steel reinforcement
FRP reinforcement
Wrapping Schemes
4.3.2 Fabrication of the Specimen
4.3.2.1 Casting
The formwork used to cast the prismatic specimen was developed using the
formwork for panels, see Fig. 4.7. Six 3/8 in thick high strength steel plates were welded
onto the formwork to create the required sizes of the prism specimen. As shown in Fig. 4.8,
five specimens were cast at one time. Extra bars (12 in long) were welded at the end zone
to prevent the local damage of the specimen. Ten PVC tubes were pre-embedded inside the

85
formwork for the bolts of the confinement plates. The U-shape hooks were pre-embedded
for the handling during the removal of the panel after cured.
Fig. 4.7 Layout of the Formwork for Uniaxial Tension Test
Fig. 4.8 Formwork for the Prismatic Specimen

86
4.3.2.2 Application of the FRP Sheets
The wet lay-up system was used for installation of FRP sheets. The specimen was
first grinded, sandblasted and power washed to provide proper concrete surface conditions
that would develop the necessary bond strength between the concrete and FRP sheets. The
grinding was to smoothen the concrete surface to ensure a full contact with FRP sheets.
The sandblasting and power washing was to remove all the loose parts on the surface. As
suggested by the manufacturer, putty was applied to fill the small holes on the surface.
During application, primer (a thin layer of the same epoxy used as adhesive) was applied
first on the surface and waited for 30 minutes, then the FRP sheets were then impregnated
by epoxy resin and applied in-situ. Rollers were used to ensure a good contact between
FRP sheets and concrete surface, extra epoxy was also removed. Specimens were then
cured in the air-conditioned lab temperature at least 72 hours before testing.
Three different wrapping schemes were used, including Fully Wrap (FW), Side
Bond (SB) and U-wrap with FRP Anchors (FA), as shown in Fig. 4.9a)-c), respectively.
For simplicity, U-wrap with FRP anchor was referred to as FRP Anchor (FA) in this
document.
The FRP anchor provides a new way of anchoring the composite to the RC structure.
After it was invented in Japan (Jinno and Tsukagishi, 1998), there have been several
investigations regarding the design recommendation (Eshwar et al, 2003 and 2008; Orton,
2007; Niemtz, 2008). The considered parameters when designing the FRP anchor include
anchor diameter, anchor amount and anchor length. The FRP anchor used in this research
was Tyfo® SCH Composite Anchor manufactured by Fyfe. Co. As shown in Fig. 4.9c),
the anchor has a diameter of 0.5 in and length of 24 in. The contact length of 8.5 in was
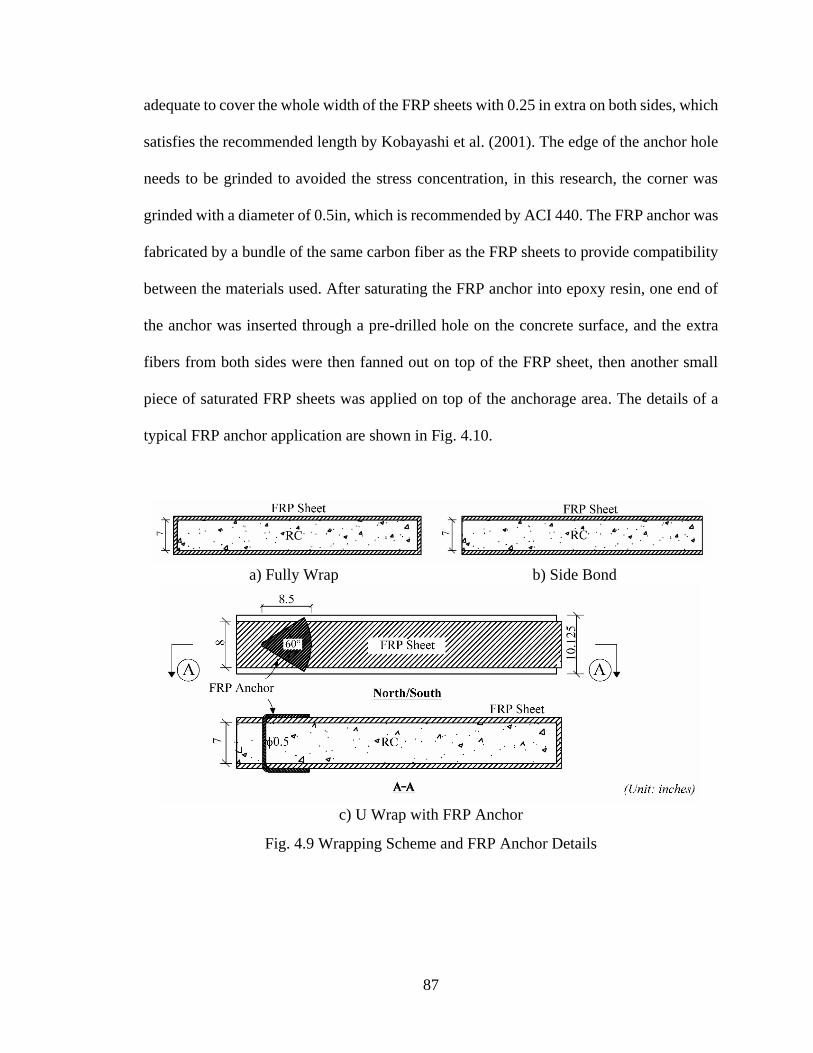
87
adequate to cover the whole width of the FRP sheets with 0.25 in extra on both sides, which
satisfies the recommended length by Kobayashi et al. (2001). The edge of the anchor hole
needs to be grinded to avoided the stress concentration, in this research, the corner was
grinded with a diameter of 0.5in, which is recommended by ACI 440. The FRP anchor was
fabricated by a bundle of the same carbon fiber as the FRP sheets to provide compatibility
between the materials used. After saturating the FRP anchor into epoxy resin, one end of
the anchor was inserted through a pre-drilled hole on the concrete surface, and the extra
fibers from both sides were then fanned out on top of the FRP sheet, then another small
piece of saturated FRP sheets was applied on top of the anchorage area. The details of a
typical FRP anchor application are shown in Fig. 4.10.
a) Fully Wrap b) Side Bond
c) U Wrap with FRP Anchor
Fig. 4.9 Wrapping Scheme and FRP Anchor Details
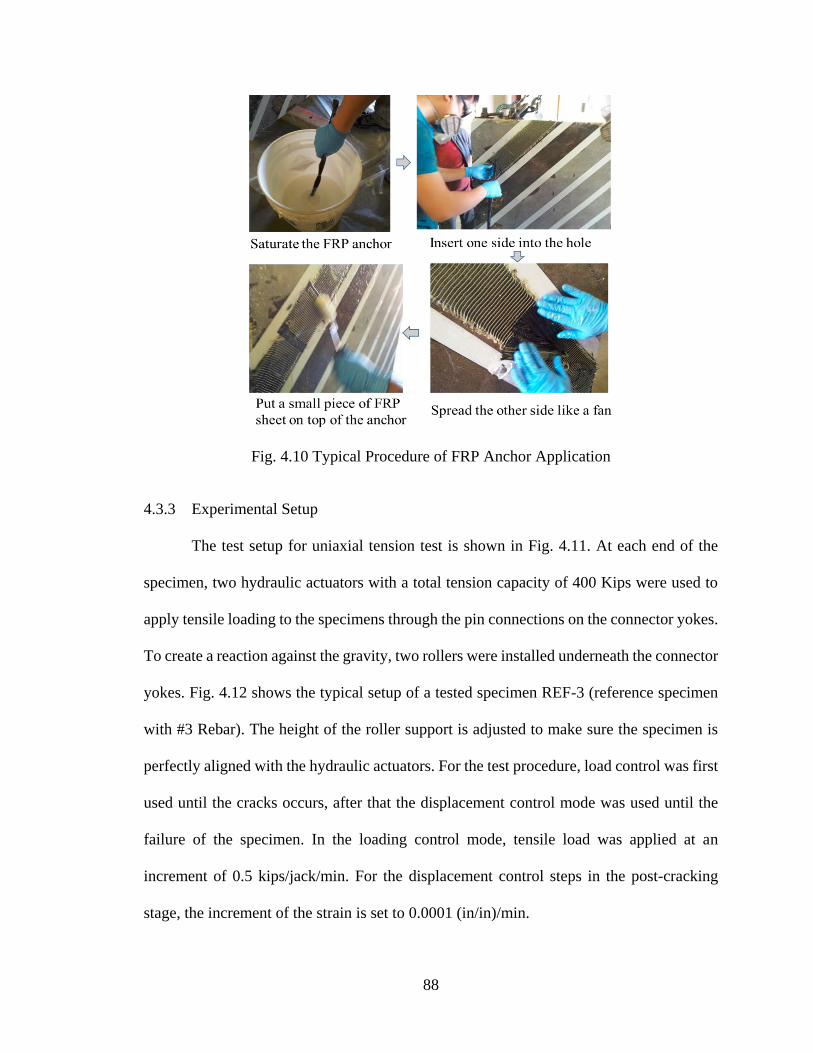
88
Fig. 4.10 Typical Procedure of FRP Anchor Application
4.3.3 Experimental Setup
The test setup for uniaxial tension test is shown in Fig. 4.11. At each end of the
specimen, two hydraulic actuators with a total tension capacity of 400 Kips were used to
apply tensile loading to the specimens through the pin connections on the connector yokes.
To create a reaction against the gravity, two rollers were installed underneath the connector
yokes. Fig. 4.12 shows the typical setup of a tested specimen REF-3 (reference specimen
with #3 Rebar). The height of the roller support is adjusted to make sure the specimen is
perfectly aligned with the hydraulic actuators. For the test procedure, load control was first
used until the cracks occurs, after that the displacement control mode was used until the
failure of the specimen. In the loading control mode, tensile load was applied at an
increment of 0.5 kips/jack/min. For the displacement control steps in the post-cracking
stage, the increment of the strain is set to 0.0001 (in/in)/min.

89
Fig. 4.11 Test Setup of the Uniaxial Tension Test
Fig. 4.12 Typical Setup for Uniaxial Tension Test
4.3.4 Instrumentation
For the uniaxial tension test, several instruments were used: the load was measured
by the load cells installed on each actuator; the average strain was measured by the two
LVDTs attached to the specimen; the local strains on the rebar and FRP were measured by
the strain gauges; A digital image correlation (DIC) system, ARAMIS (GOM MbH.,
Germany) was used to capture the strain field on one side of the specimen.

90
4.3.4.1 Measurement Instrumentation
Each of the actuators has a calibrated load cell installed, the total tension load on
each side of the specimen was taken as the summation of the two actuators on this side,
and the tension load used in the derivation of the material laws is taken as the average of
the total tension loads on each side.
As previous shown in Fig. 4.11, two LVDTs with a range of 2 in were installed on
North and South side to measure the average deformations of the specimen. The measured
length is 31.5 inches, which provides a sufficient distance of 11.75 inches away from the
edge to avoid the stress non-uniformity at the end zone. Since the specimens were hold
horizontally during the test, before the test started, the specimen was carefully adjusted to
make sure the applied tension loads were perfectly aligned with the specimen. In order to
monitor the effect of bending during the test, two additional LVDTs were installed on the
top and bottom surface of the specimen. Strain Gauges (SG) were applied on the rebar and
FRP sheets to monitor the local strains along these materials.
4.3.4.2 DIC system
A digital image correlation (DIC) system, ARAMIS (GOM MbH., Germany, 2011)
was used in the test to obtain the displacement and deformation field on the South side of
the specimen. DIC systems are well known techniques of non-contact optical measurement
of deformations and strains. A suitable pattern with equal area of black-white spots should
be achieved to ensure the accuracy of the measurements, see Fig. 4.13. The camera has a
built-in coordinate system so that the position of the black-white dots can be recorded as
(x,y,z) for different loading stages. Full field strain of a specimen were captured by
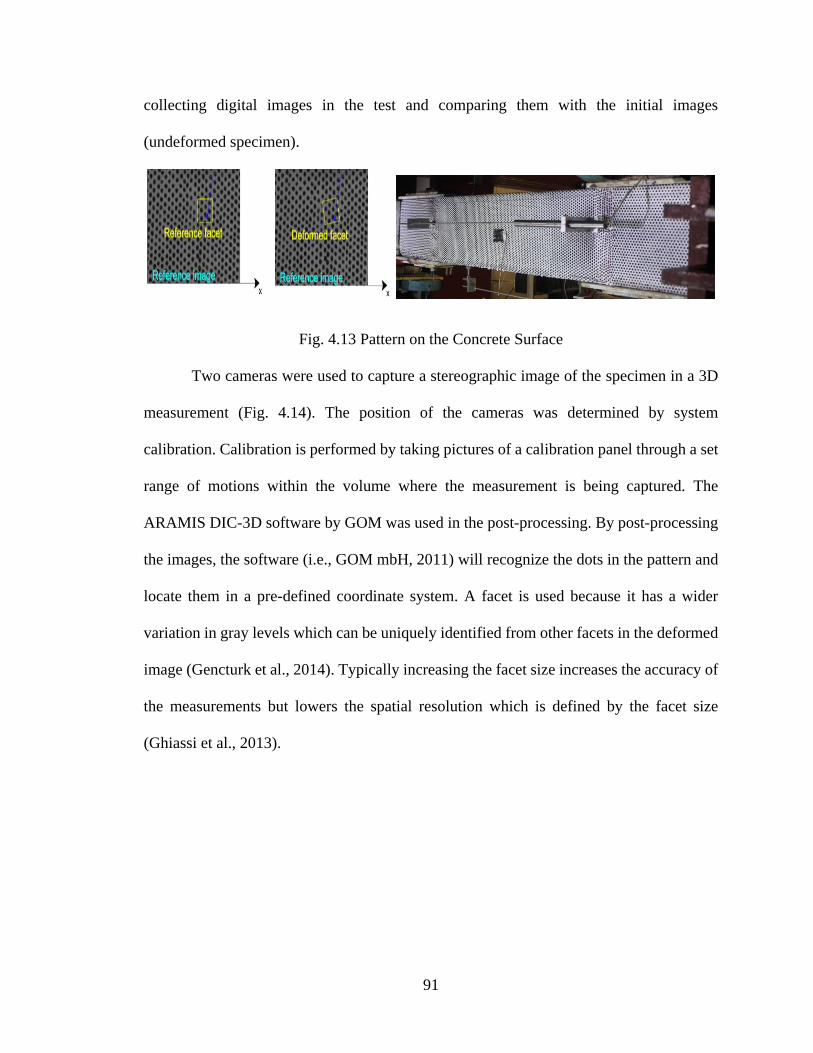
91
collecting digital images in the test and comparing them with the initial images
(undeformed specimen).
Fig. 4.13 Pattern on the Concrete Surface
Two cameras were used to capture a stereographic image of the specimen in a 3D
measurement (Fig. 4.14). The position of the cameras was determined by system
calibration. Calibration is performed by taking pictures of a calibration panel through a set
range of motions within the volume where the measurement is being captured. The
ARAMIS DIC-3D software by GOM was used in the post-processing. By post-processing
the images, the software (i.e., GOM mbH, 2011) will recognize the dots in the pattern and
locate them in a pre-defined coordinate system. A facet is used because it has a wider
variation in gray levels which can be uniquely identified from other facets in the deformed
image (Gencturk et al., 2014). Typically increasing the facet size increases the accuracy of
the measurements but lowers the spatial resolution which is defined by the facet size
(Ghiassi et al., 2013).

92
Fig. 4.14 ARAMIS 3D Sensor Setup
The specimens in the research program were prepared by applying a speckle pattern
as shown in Fig. 4.13. A thin layer of white flat paint was first applied on the surface,
covered by black dots using spray paint. In the test set-up, the DIC system was positioned
facing the South surface of the specimen. A laser pointer in front of the camera was used
to guarantee the correct alignment of the camera to the specimen. The measurement
distance for the tests was set to be approximately 80 in. The aperture of the lens was f/11
and the shutter time was set to 55 msec. Several light sources was adjusted to maintain a
bright and uniform light condition. In order to avoid statistically correlated measurements,
the facet step was set to be 15×15 pixels and the facet size was 19×19 pixels according to
the User Manual.

93
4.4 BIAXIAL TENSION-COMPRESSION TEST
4.4.1 Introduction
The biaxial tension-compression tests were conducted to study two topics: the
softening coefficient of the concrete and the Hsu/Zhu ratio in FRP RC element. The
specimens for these two tests were similar. But the loading procedures were quite different.
In the following section, the details of the tests are presented.
The specimens of these two tests were square panels with the 90o steel
reinforcement layout, as shown in Fig. 4.15. The specimen was 55 inches × 55 inches and
had a thickness of 7 inches. The spacing of the reinforcement was 10.5 inches. The FRP
sheets used in this test was 8 inches wide which were applied the same direction as the
horizontal reinforcements.
Fig. 4.15 Layout of the Panels
The test matrix of the biaxial tension-compression test is shown in Table 4.4. For
softening test, F2 stands for Fiber type 2, which is Tyfo® SCH-41S; and P stands for Panel,
the specimen number at the end of the name is numbered continuously after test conducted

94
by Moslehy (2010). For the Hsu/Zhu ratio test, PR stands for Poisson Ratio, and followed
by the thickness of the FRP used for this specimen. As an example, PR-025 stands for the
specimen with 0.025 in. thick FRP sheets. For the softening test, the main test parameters,
average tensile strain 1, is also listed.
Table 4.4 Material Properties of the Biaxial Tension-Compression Test
Test Specimen
Name
f'c
(psi) s
(%)fy
(ksi)
Es
(ksi) f
(%)fu,FRP
(ksi)
fpull-off
(psi)
Ef
(ksi) 1
Softening
Test
F2P-5 5,471 0.51 67 27,565 0.83 127 530 10,500 0.0025
F2P-6 6,237 0.51 67 27,565 0.83 127 640 10,500 0.0055
F2P-7 5,742 0.51 67 27,565 0.83 127 640 10,500 0.0075
Hsu/Zhu
Ratio Test
PR-025 5,934 0.51 67 27,565 0.52 120 760 12,000 NA
PR-040 5,334 0.51 67 27,565 0.83 127 680 10,500 NA
PR-080 6,023 0.51 67 27,565 1.66 127 790 10,500 NA
4.4.2 Fabrication of Test Specimens
The formwork of the biaxial testing panels is shown in Fig. 4.16. Two layers of
steel rebars were welded on to the connector inserts which were fastened onto the
formwork by threaded bolts. Some threaded bolts with coupling nuts on both sides were
fastened onto the base of the formwork for the LVDT installation later on. Premature edge
failures of the panel in tension have been reported by Molslehy (2010) and confinement
plates were suggested to be installed to prevent the local failure. Several PVC tubes were
pre-embedded along the tension side in the formwork, later on steel plates were fastened
by threaded bolts through these pre-embedded holes.

95
Fig. 4.16 Formwork of the Panels
4.4.3 Experimental Setup
The biaxial tension-compression tests were conducted by the UPT. As shown in
Fig. 4.17, in total of 37 in-plane jacks and 3 rigid links were used to apply the biaxial
loading. The specimen was first lifted using the 10-ton crane to a proper height, then fasten
onto the two trolleys by threaded bolts. The trolley itself was attached onto two out-of-
plane beams on the test frame. The crane was then removed and the specimen was pulled
inside the machine. Each jack was then adjusted by using the manual control mode. Forty
4 in. diameter pins were installed to connect the yokes and the heads of the jacks. To ensure
the stability of the specimen and the uniformity of the applied forces, two rigid links on the
top and one rigid link on the East side were used. Three out-of-plane rigid links were also
used to avoid the out-of-plane movement.

96
Fig. 4.17 Test Frame for the Biaxial Tension-compression Test
4.4.4 Instrumentation Methods
The strains of the specimen in the horizontal, vertical and diagonal direction were
measured by a total of 20 LVDTs attached on both side of the specimen. The LVDT
measurements were also used as feedback when using strain control. In this test, strain
gauges were also used to measure the localized strain of the specimen, as shown in Fig.
4.18.
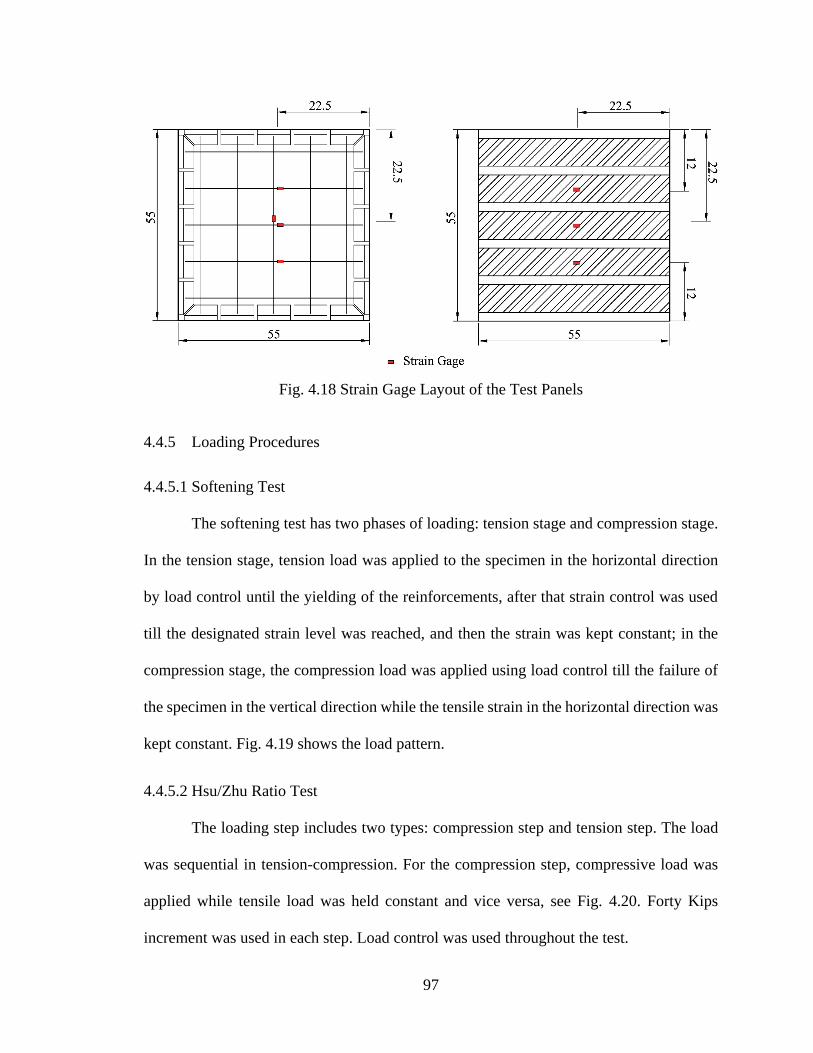
97
Fig. 4.18 Strain Gage Layout of the Test Panels
4.4.5 Loading Procedures
4.4.5.1 Softening Test
The softening test has two phases of loading: tension stage and compression stage.
In the tension stage, tension load was applied to the specimen in the horizontal direction
by load control until the yielding of the reinforcements, after that strain control was used
till the designated strain level was reached, and then the strain was kept constant; in the
compression stage, the compression load was applied using load control till the failure of
the specimen in the vertical direction while the tensile strain in the horizontal direction was
kept constant. Fig. 4.19 shows the load pattern.
4.4.5.2 Hsu/Zhu Ratio Test
The loading step includes two types: compression step and tension step. The load
was sequential in tension-compression. For the compression step, compressive load was
applied while tensile load was held constant and vice versa, see Fig. 4.20. Forty Kips
increment was used in each step. Load control was used throughout the test.

98
Fig. 4.19 Load Pattern for the Softening Test
Fig. 4.20 Load Pattern for the Hsu/Zhu Ratio Test
4.5 SUMMARY
This chapter presents the detail of the experimental tests conducted in the research.
The details of the test specimen, test setup, instrumentation method and the loading
procedure are introduced. In the following chapter, the experimental and analytical results
will be presented in detail.

99
CHAPTER 5 ANALYSIS OF THE TEST RESULTS
5.1 GENERAL
Softened truss model theory have been developed and widely used to predict the
behavior of RC element under in-plane shear stress field. In the past three decades, the UH
research group has proposed a series of softened truss models to predict the shear behavior
of RC members (Pang and Hsu, 1996; Zhang and Hsu, 1998; Hsu and Zhu, 2002), of which
the most recent one is the Softening Membrane Model (SMM). The SMM has been proven
to be able to predict the whole stress-strain curve of the RC member under in-plane pure
shear stress field (Hsu and Mo, 2010). The SMM requires three equilibrium equations,
three compatibility equations, and a set of constitutive laws that links stress and strain. The
SMM model was developed for RC element, but the concept can be applied onto FRP RC
element. Fig. 5.1 shows the stress diagram for an FRP RC element under in-plane stresses.
The FRP RC element (Fig 5.1a) was subjected to in-plane stresses. This element contains
several material components, namely concrete element (Fig. 5.1b), steel grid element (Fig.
5.1c) and FRP strip element (Fig. 5.1d). In SMM, the cracks were assumed to occur along
the principal direction 2. After cracking, the concrete became several struts that carries
compression stress 2 in 2 direction, also the tension 1 in 1 direction (due to tension
stiffening effect), see Fig. 5.1e)-f). The equilibrium equations can be developed along the
l and t directions by the stress transformation equations:
2 2
1 1 2 1 12 1 1
2 2
1 1 2 1 12 1 1
2 2
1 2 1 1 12 1 1
cos sin 2sin cos + +
sin cos 2sin cos + +
( )sin cos (cos sin ).
c c c
l l l fl fl
c c c
t t t ft ft
c c c
lt
f f
f f
(5-1)

100
It should be noted that besides the contributions of concrete and steel, two additional terms
fl flf and ft ftf were added into the equation to include the tensile contribution of FRP
in the l and t directions.
Same as RC element, the strain variables in FRP RC element must satisfy the strain
compatibility equations in the l and t directions:
2 2 121 1 2 1 1 1
2 2 121 1 2 1 1 1
2 2121 2 1 1 1 1
cos sin 2sin cos2
sin cos 2sin cos2
( )sin cos (cos sin ).2 2
l
t
lt
(5-2)
Fig. 5.1 Stress Diagram for FRP RC Element Subjected to In-plane Stresses
Besides the equilibrium and compatibility equations, a set of stress-strain
relationships have to be provided to link the stress and strain variables. For concrete
element in Fig. 5.1f), the stress-strain relationships are needed in the principal tensile

101
direction 1 and the principal compressive direction 2. Therefore the constitutive laws of
concrete in tension (in principal direction 1) and concrete in compression (in principal
direction 2) are required. For the steel element, since no dowel action is considered, only
constitutive law of steel in tension (in l and t direction) is required. Similar to the steel
reinforcement, the constitutive laws of FRP in tension (in l and t direction) is needed. As
shown in Fig. 5.1, once the biaxial principal strains 1 and 2 along the crack direction are
evaluated, the Poisson Ratios of cracked concrete are required to derive the equivalent
uniaxial strains. In order to use the SMM to predict the behavior of the FRP RC element
under in-plane shear stress field, new constitutive laws for each material component in FRP
RC element have to be established. The material laws of SMM for FRP RC elements
includes: concrete in tension, steel in tension, FRP in tension, concrete in compression and
Hsu/Zhu ratios. These materials laws were modified based on the tests results in this
research. By updating these constitutive laws, the new model SMM-FRP can be developed
to predict the FRP RC element under in-plane shear stress field. The modified constitutive
laws of concrete in tension, steel in tension, were determined from uniaxial tension tests
for 13 FRP RC prims specimen; the modified softening coefficient and Hsu/Zhu ratios
were investigated by biaxial tension-compression tests of six full-size FRP RC panels. The
studied variables in uniaxial tension tests are steel reinforcement ratio, FRP reinforcement
ratio and wrapping schemes; the studied variable in biaxial tension-compression tests is
FRP reinforcement ratios.
In the following sections, the modifications of these constitutive laws are presented
based on the test results. The derivations and validation of the proposed equations are also
given.
102
5.2 CONCRETE IN TENSION
For un-strengthened RC members under uniaxial tension load, both concrete and
steel exhibit an elastic behavior in the pre-cracking stage. After crack occurs, the entire
tensile force is carried by the reinforcements at cracking section. However, the concrete
continues to carry tensile stresses between the cracks through the bond actions between
concrete and steel reinforcements, which effectively increases the stiffness of the member
and reduces deflections. The phenomenon, also known as tension stiffening, is the
contribution of the concrete to stiffness of the member. The concept of tension stiffening
has been widely used in predicting the behavior of reinforced concrete members under
service load. It is not only important in controlling the deflection of beams but also used
for predicting multiple crack spacing and crack widths (Bischoff et al., 2003; Kong et al.,
2007; Wu et al., 2009). The tension stiffening effect allows the stress transferring from the
reinforcement to the surrounding concrete through the interface bond stress. For the tension
stiffening in FRP RC element, the bond characteristics are different. The bonds that transfer
the stress includes not only the bond between steel and concrete, but also the bond between
FRP and concrete. Consequently, the tension stiffening behavior in FRP RC element was
found to be altered. In the following sections, the behavior of concrete in tension is
discussed in two stages: the behavior prior to cracking and the behavior after cracking. The
analytical expressions were proposed for both stages.
5.2.1 Prior to Cracking
The test specimen is subjected to a tensile force P , oriented in the longitudinal
direction of the specimen. The applied force is resisted by concrete, longitudinal internal

103
steel reinforcement and external bonded FRP sheets. Before cracking, steel, FRP sheets,
and concrete are in the elastic range and the equilibrium equation can written as
s s f f c cP A A A , (5-3)
where s , f , and c are the average stresses in steel, FRP, and concrete, respectively;
sA , fA , and cA are the areas of steel, FRP, and concrete, respectively.
The cracking stress is then determined by
ε εcrcr s s cr f f cr
c
Pf E E
A , (5-4)
where s and f are the reinforcement ratios of steel and FRP, respectively; sE and fE
are the modulus of elasticity of steel and FRP, respectively; cr is the strain at cracking
and crP is the force at cracking. The cracking strength and cracking strain were measured
in the test and modulus of elasticity of concrete was then calculated. Table 5.1 lists the
computed cracking strength crf , the observed cracking strains cr and the corresponding
modulus of elasticity of concrete cE for each specimen. The specimens are identified by
steel rebar sizes (#3, #4 and #5), FRP thicknesses (0.025 in and 0.040 in), and wrapping
schemes (Fully Wrap, Side Bond, U-wrap with FRP Anchor). REF-R3/R4/R5 stands for
RC reference specimens with #3/#4/#5 rebars. It was found that the expressions proposed
by Belarbi and Hsu (1994) for RC fit very well with the test results. It was found that the
extra bond stress from FRP did not help postpone the cracking, the cracking strength and
modulus of elasticity were found to be similar to that of RC. The result seems rational
because in the pre-cracking stage, the load is mainly taken by concrete due to its much

104
greater area compared to FRP and steel, so FRP and steel did not contributed too much in
tension before cracking. The test data fits the expression
'3.7 (psi)5 ccr ff and (5-5)
'47,000 ( )psic cE f . (5-6)
The comparisons between 13 experimental results and predictions of Eqns. (5-5) and (5-6)
are plotted in Fig. 5.2. The ratio of experimental to predicted crf has a mean value of 1.015
and a coefficient of correlation of 40.2 %, and the ratio of experimental to predicted cE
has a mean value of 0.967 and a coefficient of correlation of 38.8%. The expression has a
good agreement with test results. It should be noted that ACI 318-14 (2014) used the square
root expression with a coefficient of 3.5 for shear cracking in beams, which is very close
to the 3.75 proposed in this study.
Table 5.1. Test Results for Specimens at Cracking Stage
Specimen f'c
(psi)
fcr
(psi)
cr
(×10-6)
c
(ksi)
REF-R3 6,118 326 80 4,078
REF-R4 6,118 291 83 3,511
REF-R5 6,118 278 81 3,437
S3-025-FA 6,697 265 85 3,122
S3-040-FA 6,697 293 83 3,529
S4-025-FA 6,969 357 98 3,640
S4-040-FA 6,697 307 83 3,704
S5-025-FA 6,697 313 83 3,773
S5-025-FA 6,969 309 78 3,960
S4-025-SB 6,118 267 89 2,998
S4-040-SB 6,969 274 76 3,606
S4-025-FW 6,118 264 81 3,258
S4-040-FW 6,969 312 80 3,897

105
Fig. 5.2 Comparison of the Test Results and Eqn. (5-5) & (5-6)
5.2.2 Post-cracking Behavior
After cracking occurs, the stress distribution along the length of the member
becomes non-uniform. At the crack location, the tensile stress is carried by steel rebar and
FRP sheets. Between the cracks, the tensile stress will be transferred to concrete gradually
through the bond actions. The bond actions in FRP RC element contain two components:
bond action on the interface between concrete and internal steel rebar and bond action
between interface between concrete and externally bonded FRP sheets. Fig. 5.3 shows the
schematic distribution of stresses, strains, and forces between two cracks along the length
of the tested FRP RC member. The maximum strains for FRP and steel are assumed to be
the same at the crack location, and gradually reduce due to the bond action on the interface.
For simplicity, the strain distributions for FRP and steel are assumed to be the same along
the length of the member. The concrete stress is zero at the crack location but increases by
the bond stress and reaches maximum at the center between two cracks, the strains for
concrete, steel and FRP at the center between two cracks were assumed to be the same.

106
Fig. 5.3 Schematic Distribution of Force, Stress and Strain for Cracked FRP RC under
Unaxial Tension Stress Field (adopted from Belarbi and Hsu, 1994)
The average stress of the steel and FRP can be obtained by
0
1L
s s x dxL
and (5-7)
0
1L
f f x dxL
, (5-8)
where s and f are the average stresses in steel and FRP; ( )s x and ( )f x are the
stresses in steel and FRP at a distance x along the length measured from a crack and L is
the distance between two adjacent cracks.
Since the concrete cracked at a lower level of strain, the steel and FRP are still in
the elastic range and therefore the calculations of average stresses are given as

107
0
1
1==
L
s s s sE x dx EL
and (5-9)
0
1
1=
L
f f f fE x dx E
L , (5-10)
where s
and f
are the average stresses of steel and FRP, respectively; sx and f
x
are the local strains for steel and FRP at a distance x from a crack, respectively. The
average strain 1 is given as
0 0
1= =
L L
s fx dx x dx . (5-11)
Hence Eqn. (5-1) becomes
1 1s s f f c cP A E A E A . (5-12)
Stress in concrete can be calculated from Eqn. (5-12) as
1 1
Pc s s f f
c
E EA
. (5-13)
Although Eqn. (5-13) and Eqn. (5-4) have the same form for calculating average stress of
concrete before and after cracking, the right hand side represents two different concepts:
Before crack occurs, the strain distributions of concrete, steel and FRP are uniform, thus
the “average” strain 1 also equals to the “local” strain at any location along the length of
the specimen. However, in the post-crack stage, the average strain 1 , also known as
smeared strain, includes not only the deformation of the material but also the crack widths.
The concept of smeared stress/strain is applied herein so that the cracked FRP RC element
can be considered as a homogeneous material. Using Eqn. (5-13), the average stress-strain
curve of concrete in tension can be obtained.

108
Before presenting the tensile stress strain curves of concrete in tension, it should be
noted that most of the study related to tension stiffening failed to consider the effect of
shrinkage (Sato and Vecchio, 2003). It was found by Kaklauskas et al. (2009) that most of
the tension stiffening models were derived based on the test results of specimens that
already experienced shrinkage. This shrinkage contains short-term shrinkage and long-
term shrinkage (related to creep). Viktor et al. (2014) conducted a statistical analysis of all
the available tests related to tension stiffening in literature and concluded that if the
shrinkage is not considered, the tension stiffening curve will have an unexpected “negative”
portion and thus be underestimated. To eliminate the effect of shrinkage on the behavior
of the concrete in tension, the shrinkage strains were calculated for all the tested specimens.
In the following section, the method of calculating the shrinkage is presented.
5.2.3 Shrinkage
In the study, since all the tests were conducted within 40 days, only the short-term
(creep insignificant) shrinkage effect was considered using the approach proposed by
Kaklauskas et al. (2008). When the concrete starts shrinking, compression is developed in
the rebar while tension is developed in the concrete. In this approach, a fictitious axial force
was proposed to evaluate the effect of the shrinkage on the specimen. The strains in the
concrete and steel due to shrinkage were proposed as
,- sh s s
c sh
c c s s
E A
E A E A
and (5-14)
,
sh c c
s sh
c c s s
E A
E A E A
, (5-15)

109
where sh is the shrinkage strain of a plain concrete specimen with same material, size and
curing conditions as the test specimen. Viktor et al. (2014) calculated the shrinkage strain
sh of concrete using an approach based on Eurocode 2 (2004). In this study, same
approaches were applied to account for the effect of shrinkage for each specimen. The total
shrinkage strain εsh is composed of two components, namely the drying shrinkage strain
εcd and the autogenously shrinkage strain εca :
ε ε εsh cd ca . (5-16)
The details of the equations for calculating the drying shrinkage strain and
autogenously shrinkage strain are available in Annex B of Eurocode 2 EN 1992-1-1 (2004).
The calculation for the shrinkage strains in this study is presented in Appendix II. The
relative humidity (RH), specimen sizes, material properties, and curing time required in the
calculation were measured and presented in detail in Appendix II. Table 5.2 lists all the
results for the shrinkage strain in each specimen.
Table 5.2 Shrinkage Stress and Strain for the Test Specimen
Specimen sh Ec Es c,sh s,sh c,sh s,sh
in/in ksi in/in ksi
REF-R3 -157.80 4,070 27,352 3.22 -154.58 0.0131 -4.23
REF-R4 -152.97 3,931 27,558 5.68 -147.29 0.0223 -4.06
REF-R5 -142.81 3,670 28,319 8.98 -133.83 0.0330 -3.79
S3-025-FA -144.35 3,429 27,352 3.48 -140.86 0.0119 -3.85
S3-040-FA -159.00 4,280 27,352 3.09 -155.91 0.0132 -4.26
S4-025-FA -150.25 4,350 27,558 5.06 -145.19 0.0220 -4.00
S4-040-FA -188.10 4,298 27,558 6.41 -181.70 0.0275 -5.01
S5-025-FA -163.62 4,225 28,319 9.02 -154.61 0.0381 -4.38
S5-040-FA -223.19 4,350 28,319 11.96 -211.23 0.0520 -5.98
S4-025-SB -162.47 3,666 27,558 6.45 -156.02 0.0236 -4.30
S4-040-SB -180.87 4,445 27,558 5.96 -174.91 0.0265 -4.82
S4-025-FW -166.99 4,350 27,558 5.62 -161.37 0.0245 -4.45
S4-040-FW -199.00 4,350 27,558 6.70 -192.30 0.0291 -5.30

110
5.2.4 Effect of Different Parameters on Concrete in Tension
In the following section, the effects of different parameters on the stress strain curve
of concrete in tension were investigated. The studied parameters includes: a) steel
reinforcement ratio; b) FRP reinforcement ratio; c) wrapping schemes. For ease of
comparison, the average stress of concrete in tension was normalized by the tensile strength
of the specimen. Table 5.3 lists all the variables and the test specimens that were tested to
study them. The test specimens were divided by three groups to study three variables.
Table 5.3 Test Specimens and the Variables Studied for Concrete in Tension
Group Test Specimen Constants Variables
I S3-025-FA, S4-025-FA, S5-025-FA FRP Reinforcement
Wrapping Schemes Steel reinforcement
S3-040-FA, S4-040-FA, S5-040-FA
II
REF-R3, S3-025-FA, S3-040-FA
Steel reinforcement
Wrapping Schemes FRP Reinforcement
REF-R4, S4-025-FA, S4-040-FA
REF-R5, S5-025-FA, S5-040-FA
REF-R4, S4-025-SB, S4-040-SB
REF-R4, S4-025-FW, S4-040-FW
III S4-025-SB, S4-025-FA, S4-025-FW Steel reinforcement
FRP Reinforcement Wrapping Schemes
S4-040-SB, S4-040-FA, S4-040-FW
5.2.4.1 Effect of Steel Reinforcement Ratio
Fig. 5.4 shows the stress strain curves of concrete in tension for specimens with same FRP
reinforcement ratio and wrapping scheme but various steel reinforcement ratios. This
figure shows that the tension stiffening effect tends to be greater in the specimen with
higher steel reinforcement ratio.
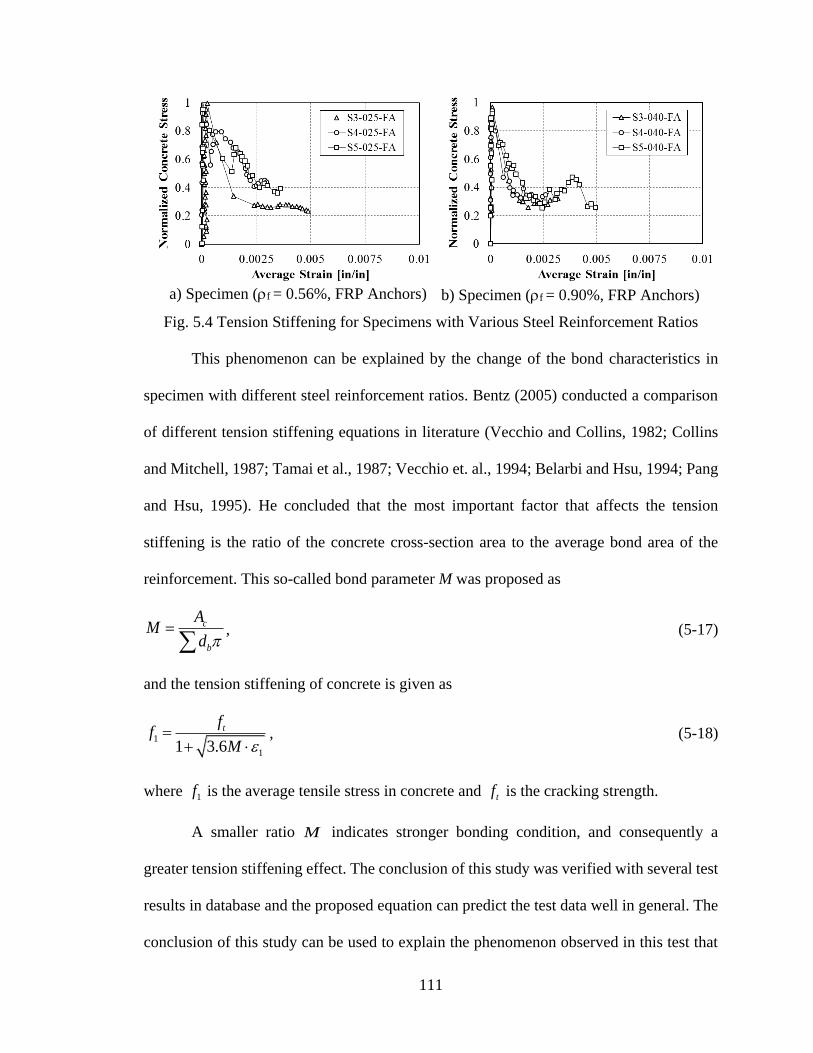
111
a) Specimen (f = 0.56%, FRP Anchors) b) Specimen (f = 0.90%, FRP Anchors)
Fig. 5.4 Tension Stiffening for Specimens with Various Steel Reinforcement Ratios
This phenomenon can be explained by the change of the bond characteristics in
specimen with different steel reinforcement ratios. Bentz (2005) conducted a comparison
of different tension stiffening equations in literature (Vecchio and Collins, 1982; Collins
and Mitchell, 1987; Tamai et al., 1987; Vecchio et. al., 1994; Belarbi and Hsu, 1994; Pang
and Hsu, 1995). He concluded that the most important factor that affects the tension
stiffening is the ratio of the concrete cross-section area to the average bond area of the
reinforcement. This so-called bond parameter M was proposed as
c
b
AM
d
, (5-17)
and the tension stiffening of concrete is given as
1
11 3.6
tffM
, (5-18)
where 1f is the average tensile stress in concrete and tf is the cracking strength.
A smaller ratio M indicates stronger bonding condition, and consequently a
greater tension stiffening effect. The conclusion of this study was verified with several test
results in database and the proposed equation can predict the test data well in general. The
conclusion of this study can be used to explain the phenomenon observed in this test that

112
with the increase in rebar size, the bonding area increases and consequently the tension
stiffening effect becomes more significant.
5.2.4.2 Effect of FRP Reinforcement Ratio
Fig. 5.5 shows results for specimens with same steel reinforcement ratio and
wrapping scheme but various FRP reinforcement ratios. It can be observed that compared
with un-strengthened reference specimen (REF-R4), the specimen with FRP exhibited a
greater tension stiffening effect. Also, when compared the specimen wrapping with
different thickness of FRP sheets, it was found that the specimens strengthened with thinner
FRP sheets (smaller FRP reinforcement ratio), trend to have a greater tension stiffening
effect.
a) Specimen (s = 0.55%, FRP Anchors) b) Specimen (s = 0.55%, Fully Wrap)
Fig. 5.5 Tension Stiffening for Specimens with Various FRP Reinforcement Ratios
Same conclusions were also put forward by other researchers (Ueda et al., 2002;
Farah and Sato, 2011). In the tests conducted by Ueda et al. (2002), strain gauges were
applied on the steel rebar at a 1.6 in spacing and on the FRP sheets at a 0.8 in spacing. The
whole strain distribution along the rebar and FRP sheets was captured for different loading
steps, and the bond stresses between concrete and FRP/steel along the specimen were
calculated based on the strain distribution profile. Explanation for this phenomenon was

113
given as follows. The average concrete stress is developed by two bond actions, namely
the bond between concrete and steel rebar, and the bond between concrete and FRP sheets.
As an example, Fig. 5.6 shows the tensile stress strain curve for S-3 series (Farah and Sato,
2011), in which, the same RC specimens were strengthened with different layers of FRP
sheets, and Fig 5.7 shows the average bond stress with respect to average tensile strain. It
can be observed that, with the increase of FRP stiffness, the bond between steel and
concrete decreases dramatically while the bond between FRP and concrete increases
slightly. Consequently, the decrease of the bond stress between steel and concrete is
dominant, and the combination of these two bond actions decreases, which leads to a
decrease of the tension stiffening effect.
Fig. 5.6 Tension Stiffening for S-3 Series (Farah and Sato, 2011)

114
Fig. 5.7 Average Bond Stress for S-3 Series (Farah and Sato, 2011)
5.2.4.3 Effect of Wrapping Scheme
Fig. 5.8 shows the results for the average stress strain curve of concrete in tension
for specimen with same FRP and steel reinforcement ratio but using different wrapping
schemes. It can be observed that the tension stiffening is more evident in specimens
strengthened using the fully wrap and FRP anchor method than those using side bonding
methods. A great number of test results have indicated a better bond performance on the
concrete-FRP interface using fully wrap or U-wrap with a proper anchorage system rather
than side bonding (Uji, 1992; Sato et al., 1996; Khalifa and Nanni, 2002; Beber, 2003;
Monti and Liotta, 2005; Sim et al., 2005; Bukhari et al., 2010; Panigrahi et al., 2014). The
greater tension stiffening effect for the fully wrap and FRP anchor can also be attributed to
the greater performance of the bond action due to these wrapping methods.

115
a) Specimen (s = 0.55%, s = 0.56%) b) Specimen (s = 0.55%, s = 0.90%)
Fig. 5.8 Tension Stiffening for Specimen with Different Wrapping Schemes
Numerical study was conducted by Dai et al. (2006) to analyze the full-range strain
distribution on FRP-concrete interface. Bond-slip model was proposed in this study. The
interfacial facture energy Gf and interfacial ductility index B in the bond-slip model were
calibrated and upper and lower bounds of Gf and B were proposed for different bond
conditions (fully wrapping, proper mechanical anchors, and side bonding). These models
were used to investigate the tension stiffening effect for different bonding conditions (Dai
et al., 2012). The results showed similar conclusion that the tension stiffening effect of
concrete tends to become weaker for a weaker bonding method, such as side bonding
method.
5.2.5 Proposed Equations
The chosen format of the tension stiffening model is
1 1 when c c crE and (5-19)
1
1
when
c
crc cr crf
. (5-20)

116
The chosen form of the tension stiffening model was first proposed by Okamura et al. (1985)
and later on modified by Tamai et al. (1987). Belarbi and Hsu (1994) proposed c equals
to 0.4 based on test results of 17 large scale RC panels. The coefficient c was originally
proposed as a constant depending on the bond characteristics in RC element. In the
proposed equation, this concept can be applied to describe the bond characteristics in FRP
RC elements. To account for the effects of FRP reinforcement, steel reinforcement, and the
wrapping schemes, the coefficient c is proposed as
/w f sK Kc , (5-21)
where wK and /f sK are two factors considering the effects of wrapping scheme and the
ratio of FRP and steel stiffness, respectively.
By the mathematical regression of the test results using the given format in Eqn.
(5-20), the experimental values expc were obtained. The relationships between expc and the
wrapping scheme as well as the ratio of FRP and steel stiffness are shown in the Fig. 5.9
and Fig 5.10, respectively. Fig. 5.9 indicates that the fully wrap and U-wrap with FRP
anchors have very close values of p
exc . For simplicity, factor wK for fully wrap and FRP
anchors were assumed equal to 1, thus the factor wK for side bonding wrapping scheme
was normalized to be 1.6 by regression of the test data as below.
For full anchorage (rupture failure expected): fully wrap or U-wrap with anchors,
1wK , (5-22a)
and for other anchorage (non-rupture failure more likely): side bond or U-wrap,
1.6wK . (5-22b)

117
It should be noted that the expression for wK is based on different anchorage conditions.
For fully anchorages, it means the FRP sheets are fully wrapped or U-wrapped with proper
anchorage system so that the rupture failure are more likely to occur rather than other
failure modes. The proposed value of 1 is based on test results of specimen with the fully
wrap and U-wrap with the particular FRP anchor used in this research, the details of FRP
anchors was presented in Chapter 4. For the other anchorages like U-wrap without anchors
or side bonding, non-rupture failure, such as debonding of FRP sheets, is more likely to
occur. This factor was proposed to be 1.6 based on the test result for specimen with side
bonding.
For /f sK , a linear relationship between the coefficient p
exc and /f f s sE E was
observed with coefficient of determination of 0.82. The equation for /f sK is shown as
/ 0.25 0.15f f
f s
s s
EK
E
. (5-23)
The comparison between the expc and the proposed expression is shown in Fig. 5.11. The
prediction and the test results show an acceptable agreement with coefficient of
determination of 0.70.
The proposed equation was based on the regression of test data with /f f s sE E
between 0.25 and 1.11. However, the verification of the lower and upper bound values for
the proposed equation requires more test results. Fig 5.12 shows the comparison of average
stress strain curve of concrete in tension between the test results and the proposed models.
An acceptable level of agreement was observed.

118
Fig. 5.9 Relationships between expc and the Wrapping Scheme
Fig. 5.10 Relationships between expc and the Ratio of FRP and Steel Stiffness
Fig. 5.11 Comparison between the Proposed Equation for expc and Experimental Results

119
Average Tensile Strain (in/in)
Fig. 5.12 Comprasion of Stress-strain Curve for Concrete in Tension between the
Experimental Results and Eqns. (5-19)-(5-23)
5.2.6 Verification of Proposed Equations
The proposed equations were used to predict the tension stiffening curves of Farah
and Sato (2011) to verify the accuracy. It should be noted that in their test, two confinement
plates were fastened onto the FRP sheets to avoid the debonding failure at the end zone of
the specimen, thus the wrapping scheme is assumed to be fully wrap, i.e., wK is assumed
to be 1. Also, Farah and Sato (2010) have considered the shrinkage effect in the analysis.
Norm
aliz
ed C
oncr
ete
Str
ess

120
The comparison was conducted for the six specimens with the ratio of /f f s sE E
between 0.18-1.68. Fig 5.12 shows the comparison between the proposed model and the
results from Farah and Sato’s tests. A well agreement can be observed between them.
Fig. 5.13 Comprasion of Proposed Model and Test Results by Farah and Sato (2011)

121
5.3 STEEL IN TENSION
5.3.1 Apparent Yielding Point
Before crack occurs, the strain distributions for concrete, steel, and FRP are uniform
along the specimen, therefore the stress strain relationship of steel is elastic. After crack
occurs, the strain distribution becomes nonlinear as previously shown in Fig. 5.3. At a high
strain level, the stress strain curve of the steel embedded in concrete is quite different than
that of a bare rebar, a reduction of yielding stress was observed by several researchers
(Okamura, 1985; Shima, 1987; Tamai, 1987; Belarbi and Hsu, 1994). This new yielding
point in the average stress strain curve is called apparent yielding point. The phenomenon
of apparent yielding was also observed for steel in FRP RC element.
The comparison between the stress strain relationships of steel in FRP RC element
and those of bare rebars is shown in Fig. 5.14 a)-c). The results showed that the apparent
yielding stress was altered due to the existence of the externally bonded FRP sheets. It can
be observed that the apparent yield stress increases with the increase of FRP stiffness,
especially for S3 series. This phenomenon can be explained by the crack characteristics of
the specimen. Fig. 5.15 shows the crack patterns for different specimens in S3 series at the
same strain level of 0.002. It can be observed that in the specimen strengthened with
externally bonded FRP sheets, crack spacing is smaller compare to un-strengthened RC
members. At the same strain level, smaller crack spacing indicates that the average crack
width is smaller. This is attributed to the additional bond action on the FRP-concrete
interface. This bond action reduces the crack width compared to un-strengthened RC. As a
result, the local yielding of the rebar at the crack location was postponed, which leads to
an increase of the apparent yield stress. Fig. 5.15 also shows that as the increase of the FRP

122
thicknesses, the crack width becomes smaller. This explains the phenomenon that with the
increase of FRP thickness, the apparent yielding stress increases.
a) S3 Series (s = 0.31%, FRP Anchors) b) S4 Series (s = 0.55%, Fully Wrap)
c) S5 Series (s = 0.87%, FRP Anchor)
Fig. 5.14 Average Stress Strain Curve of Steel in Tension

123
Fig. 5.15 Crack Patterns for S3 Series at Average Tensile Strain of 0.002
5.3.2 Proposed Equations
A bilinear expression was proposed by Belarbi and Hsu (1994) to predict the tensile
behavior of steel in RC element. The apparent yielding stress ' y
f was proposed to describe
the reduction of yielding stress. The equations are
' s s s s yf E , (5-24)
'0.91 2 0.02 0.25
s y s ss yf B f B E , (5-25)
' '/
y y sf E , '
0.93 2 y y
f fB , (5-26)
1.5
1cr
ys
fB
f
, (5-27)
'3.75 and 0.15% ,
cr c spf sif . (5-28)
For the given equations, the apparent yielding stress will increase as the increase of the
steel reinforcement ratio. This is due to fact that more reinforcement at the crack location
tends to prevent the cracking from opening, which reduces the local stress concentration

124
on the rebar, and consequently increases the apparent yielding stress. The same idea can
be applied onto the externally bonded FRP sheets. The externally bonded FRP sheets also
helps preventing the cracks from opening and reduce the stress concentration. In this study,
it is assumed that the strain distribution of FRP and steel are the same along the specimen.
Based on this assumption, the FRP reinforcement can be transferred to the “equivalent”
steel reinforcement. Based on the test result, the effect of FRP reinforcement on the
behavior of the steel in tension is described by introducing a new parameter called
Equivalent Reinforcement Ratio e . The following equations were proposed for e :
/e s f s fn and (5-29)
/
f
f s
s
En
E . (5-30)
Fig. 5.16 shows the comparison between the proposed equations and the test results.
Since #4 and #5 rebar have no clear yielding plateau, the stiffness of the post-yielding
portion for the specimen with #4 and #5 rebar was set to be equal to the post-yielding
stiffness of the respective bare rebar. Fig. 5.16 shows an acceptable level of agreement
between the proposed model and the test results.

125
Fig. 5.16 Comparison of Proposed Equations and Test Results for the Stress-strain
Relationships in Steel

126
5.3.3 Verification of Proposed Equations
The prediction from the proposed equations were compared with the test results of
Farah and Sato (2011). Fig. 5.17 shows the steel stress strain curve for S-1 Series. The
specimen name S-1-1/2/3 stands for the S1 series of specimen with 0.5%s and 1/2/3
layers of FRP, i.e., 0.07%,0.13%, and 0.20%f respectively. Similar phenomenon
was observed that with the increase of the FRP reinforcement ratio, the apparent yielding
stress increases. Fig. 5.18 shows the comparison between the proposed equation and the
experimental results. It can be observed that the prediction has a very good agreement with
the experimental test results.
Fig. 5.17 Stress-strain Relationships for Steel in Tension (Farah and Sato, 2011)

127
Fig. 5.18 Comparison of the Stress-strain Relationships in Steel between Proposed
Equations and Test Results by Farah and Sato (2011)
5.4 RESULTS FROM DIC SYSTEM
As introduced in Chapter 4, DIC system was used to capture the strain variation on
one side of the specimen. Fig. 5.19 shows a typical strain variation of the tested specimen
S5-025-FA. The red area on the strain fields indicates the location of the cracks. The white
area at the center of the specimen are the areas blocked by the LVDTs and cables so that
no results can be obtained for them. The debonding of the FRP at the ultimate stage was
also captured by the DIC system, as shown in Fig. 5.20.

128
Load: 0 Kips Avg. Strain: 0 in./in.
Load: 32 Kips Avg. Strain: 0.0003 in./in.
Load: 55 Kips Avg. Strain: 0.0018 in./in.
Load: 73 Kips Avg. Strain: 0.0038 in./in.
Fig. 5.19 Tensile Strain Field from DIC for Specimen S5-025-FA
Before loading started
First two cracks occurred
More cracks occurred, high strain developed in FRP sheets
At ultimate stage, the anchor failed and FRP sheets debonded from the concrete

129
Fig. 5.20 Debonding of FRP Sheets at Ultimate Stage
5.5 CONCRETE IN COMPRESSION
5.5.1 General
As shown in Fig. 5.21, the softening coefficient was defined as
'
p
f
cf
, (5-31)
where p is the compressive strength of concrete in biaxial tension-compression.
Fig. 5.21 Example of a Proposed Model for Softening Coefficient (Adopted from Hsu
and Mo, 2010)
Several researchers have investigated the softening coefficient by various
experimental tests (Vecchio and Collins, 1981; Miyahara et al., 1987; Izumo et al., 1991).
In University of Houston, Belarbi and Hsu (1995) studied the effect of five variables on

130
the softening coefficient by testing 22 full scale RC panels. The variables include: 1) the
principal tensile strain, 2) the presence of tensile stress at failure, 3) the loading path
(sequential and proportional), 4) spacing of reinforcing, 5) the amount of main longitudinal
reinforcement. They confirmed that the principal tensile strain is the dominant variable.
The presence of tensile stress at failure has no effect on the softening coefficient. The load
path, the spacing of reinforcing bars and the amount of longitudinal reinforcement have a
small effect, but can be neglected for simplicity. Pang and Hsu (1996) studied the behavior
of 2-D elements subjected to pure shear. The test specimens were reinforced with various
amounts of steel bars. The test results of 13 panel specimens confirmed the following
equation for the softening coefficient:
1
0.9ζ
1 400
for proportional Loading and (5-32)
1
0.9ζ
1 250
for sequential Loading. (5-33)
Later on, many panel tests and analytical studies have been conducted by other
researchers (Zhang and Hsu, 1998; Chintrakarn, 2001; Wang, 2006), different parameters
were then included in the equation for softening coefficient. The parameters that proved to
be effective are namely: concrete strength f’c, and the deviation angle. So the equation of
calculating is expressed as
'
1
5.8 1ζ 0.9 1
241 250c
f
. (5-34)
In the following section, the modification of Eqn. (5-36) is presented based on the results
of the softening tests. The studied parameter is FRP reinforcement ratios.

131
5.5.2 Test Results
For the test in this study, the loading procedure is sequential. Tension was applied
onto the panel in the horizontal direction up to a tensile strain level, then the tensile strain
in horizontal direction was kept constant using the strain control mode and the compression
load was applied in the vertical direction until the failure of the specimen. The failure
strength p was obtained and plugged in Eqn. (5-33) to obtain the softening coefficient
for each test specimen.
Fig. 5.22 shows the comparison between the test data for FRP RC and the test data
for RC (Belarbi and Hsu, 1995). Fig. 5.22 indicates that the test data for RC is more
scattered compared to the test data for FRP RC. It can be seen that the softening coefficient
is greater for FRP RC than in RC. The prediction for RC element underestimated the
softening coefficient in FRP RC element. Fig. 5.23 shows the result for FRP RC when
compared to ±15% of the model for RC. The softening coefficient of FRP RC shows 10%
increase for specimen with f = 0.56% and 18 % increase for specimen with
f = 0.90%
when compared to the prediction for RC. This increase of softening coefficient is attributed
to the confinement provided by the FRP sheets. Also, by comparing the result for specimen
with different FRP reinforcement ratios, it can be concluded that as the increase of the FRP
reinforcement ratio, the confinement effect is more significant, and consequently the
softening coefficient is greater.

132
Fig. 5.22 Comparison between the Softening Coefficients for RC (Belarbi and Hsu, 1995)
and FRP RC
Fig. 5.23 Comparison between the Softening Coefficients for RC (Belarbi and Hsu, 1995)
with Envelop of Test Data and FRP RC

133
5.5.3 Proposed Equations
Moslehy (2010) investigated the softening coefficient by investigating the effect of
FRP reinforcement. By regression of the test data, equations for the softening coefficient
were proposed as
4'
1
5.8 1ζ 0.9 1
241 250f
c
ff
FRP
and (5-35)
2
3
1
1
4
1 1.12 16 with FRP50,000
1 without FRP.
f fE t
f FRP
(5-36)
The first three terms on the right hand side of Eqn. (5-37) are the same as the
softening coefficient for RC by other researchers at University of Houston (Belarbi and
Hsu, 1994; Pang and Hsu, 1996; Zhang and Hsu, 1998; Wang, 2006). Fig. 5.24 shows the
prediction of these equations and the test results. However, this proposed model contains a
shortcoming that the concrete area Ac was not considered, i.e., large or small concrete
structures strengthened with same amount of FRP will end up with same softening
coefficient, which seems against the expectation.

134
Fig. 5.24 Comparison of the Softening Coefficient between Model Proposed by Moslehy
(2010) and Test Data
To account for the aforementioned shortcoming of model of Moslehy (2010). In
this study, fEf, instead of Eftf was used in the expression of 4f FRP so the effect of
concrete area is taken into account. The derivation of the equation still follows the method
of regression of test data. Fig 5.25 shows the comparison between all the test data for and
the FRP stiffness fEf . The test data fits well to the expression
41 0.02 f ff FRP E . (5-37)
In the proposed equation, fEf instead of Eftf were adopted to account for the area of the
concrete. It should be noticed that the proposed equation converges to the result of RC
when fEf equals to zero, in which case f4(FRP) equals to 1 and the expression will be the
same as model for RC. Fig 5.26 shows the comparison between the proposed equation and
the test data and a good agreement can be observed.

135
Fig. 5.25 Regression of Test Data for f4(FRP)
Fig. 5.26 Comparison of the Softening Coefficient between the Proposed Eqn. (5-37) and
Test Data

136
5.6 MODIFIED HSU/ZHU RATIO
5.6.1 General
The Poisson ratio is known in mechanics to describe the strain change in one
direction due to the change of the strain in the perpendicular direction. The definition of
Poisson ratio is only valid for continuous isotropic materials. By utilizing smeared crack
concept, Hsu and Zhu (2002) proposed so-called Hsu/Zhu ratio to describe the similar
effect for cracked reinforced concrete. The Hsu/Zhu ratio 12 and 21 is defined as shown
in Fig. 5.27.
Fig. 5.27 Illustrative Plot for Hsu/Zhu Ratio 12 and 21
The Poisson effect have to be considered in the softened truss model theory since
all the material laws were developed based on uniaxial test (Hsu and Zhu, 2002), but the
stress condition in the shear element is biaxial, therefore in order to be used these material
laws in the SMM model, the biaxial strain have to be transferred into uniaxial strain by
involving the Poisson ratio, see Eqn. (5-38)-(5-39).
121 1 2
12 21 12 21
υ1ε ε ε
1 υ υ 1 υ υ
and (5-38)

137
212 1 2
12 21 12 21
υ 1ε ε ε
1 υ υ 1 υ υ
. (5-39)
Moreover, in Finite Element Analysis, the Hsu/Zhu ratio 12υ and
21υ are applied to
consider the Poisson effect. The constitutive laws of concrete can be expressed as
2 2 21 2 2
1 12 2 1 1
21 21 21
0
0 .
0 0
c c c
c c c
c c
E E
E E
G
(5-40)
Hsu/Zhu ratio was input in the material stiffness matrix to considering the Poisson Effect.
By introducing the Hsu/Zhu ratio, the biaxial strains in the equations can be transferred
into uniaxial strains. The Hsu/Zhu ratio is applicable to RC element in pre- and post-
cracking stages based on the smear stress/strain approaches. The evaluation of Hsu/Zhu
ratio was conducted based on 12 panel tests (Zhu and Hsu, 2002). They proposed the
equations from the test results as
12υ 0.2 850ε
sf ε ε
sf y
, (5-41)
12υ 1.9 ε ε
sf y and (5-42)
21
0.2 Before crackingυ
0 After cracking , (5-43)
where εsf
is the strain in the reinforcement. The results for the Hsu/Zhu ratio 12υ and
21υ
and comparison with the proposed model are shown in Fig. 5.28a)-b), respectively.

138
a) Test Data and Proposed Model for 12
b) Test Data and Proposed Model for 21
Fig. 5.28 Hsu/Zhu Ratios for RC (Adopted from Zhu and Hsu, 2002)
It can be observed from 5.28a) that the model for 12υ is bilinear curve: before
yielding of the reinforcement, the ratio was found to increase from 0.2 linearly to 1.9 and
then kept constant. It should be noted that for the cracked RC element in the post-yielding
stage, the Hsu/Zhu ratio is higher than 0.5, which is the maximum value of Poisson ratio
for continuous solid materials. The reason is that the smeared tensile strain of cracked RC

139
element includes not only the strain of the material, but also the opening of cracks. By
considering the cracked RC element as continuous material, the Hsu/Zhu ratio could then
be significantly high (equals to 1.9). It can be observed from 5.28b) that 21
υ is around 0.2
before cracking of concrete, and suddenly dropped to zero once the crack occurs. Due to
the additionally bond action created by the externally bonded FRP sheets, the Hsu/Zhu
ratio is expected to be altered in RC element.
5.6.2 Data Analysis Method
As discussed in the chapter 4, small step-wise increments loading procedure was
applied so that the Hsu/Zhu ratio can be determined at each loading step. As an example,
the loading procedure for specimen PR-025 is shown in Fig. 5.29.
Fig. 5.29 Loading Procedure for PR-025
The tensile strains is obtained by averaging the 8 horizontal LVDTs attached
on the specimen, and the compression is obtained by averaging the 8 vertical LVDTs

140
attached on the specimen. According to Zhu (2000), the load in actuators would fluctuate
slightly due to frictions and electrical noise, the minimum step increment was set to be 4
kips/jack. To increase the accuracy and stability of the test data, for each step was
calculated using the average strains of five points for the initial and final strain, as shown
in Fig. 5.30. This method guarantees the stability of the data and reduces the error due to
the fluctuation of the data, especially for the compression step in which the strain increment
is fairly small (in the scale of 0.00005).
Steps
Fig. 5.30 Method of Data Collection in Hsu/Zhu Ratio Test
5.6.3 Effect of FRP Reinforcement Ratio on 21
The Hsu/Zhu ratio 21 obtained from the tests is shown in Fig. 5.31. It can be
observed that the Hsu/Zhu ratio 21 is around 0.25 before crack occurs. After crack occurs,
it decreased rapidly to zero. This trend is the same for the RC specimen tested by Zhu and
Hsu (2002), as previously shown in Fig. 5.28b).

141
Fig. 5.31 Hsu/Zhu Ratio 21 in This Study
This phenomenon can be explained as follows. In the post-cracking stage, the
increase of the tensile strain is mainly attributed to the opening of the cracks the decrease
of strain in the compression direction is almost negligible.
5.6.4 Effect of FRP Reinforcement Ratio on 12
The test data for the 12 and the comparison with RC test data (with envelop) are shown
in Fig. 5.32. It can be observed that the Hsu/Zhu ratio 12 for un-strengthened RC
members is much larger than that for the cases with FRP sheets, which means the for the
same compressive strain increment, the increase of tensile strain is much smaller for
specimen with FRP than the un-strengthened RC members. This can be attributed to the
confinement the FRP provides, which stiffens the specimen in the tensile direction.
Another fact that can be observed from the figure is that as the increase of the FRP stiffness,
the Hsu/Zhu ratio 12 decreases. This can be explained that as the FRP stiffness increases,
a better confinement is provided and the specimen becomes stiffer in the tensile direction.

142
Fig. 5.32 Comparison of Hsu/Zhu Ratio 12 between FRP RC and RC
The reason 12 is significantly larger than 21 is that when the specimen is under
compression stress field, the cracked concrete struts between cracks are not regularly
shaped, as shown in Fig. 5.33. The compression applied with eccentricity could cause
bending and makes the struts push each other in the tensile direction. Also, when the steel
yielded, the resistance to the expansion in the tensile direction becomes much smaller.
These two effects combines and leads to a great value of 12 .
Fig. 5.33 Bending Effect on the Cracked Specimen in the Hsu/Zhu Ratio Test

143
5.6.5 Proposed Equations
As explained in the previous section, the Hsu/Zhu ratio is affected mainly by the
post-yielding stiffness in the tensile direction. In this research, f fE was chosen as the
parameter to describe the FRP contribution to the post-yielding stiffness. For the FRP RC
element, the average value of after the yielding strain ( 0.0024y ) is listed in Table
5.4. Fig. 5.34 shows the relationship between 12 and FRP stiffness . A good linear
relationship was observed.
Table 5.4 Test Results for 12 at Post-yielding Stage
Specimen fEf (ksi) Post-yielding 12 (AVG)
RC 0 1.9
PR-025 62.4 1.7
PR-040 87.15 1.56
PR-080 174.3 1.18
Fig. 5.34 Relationship between and FRP Stiffness
The proposed equations for calculating the Hsu/Zhu ratio and 21 are
120.2 sfk ε ε
sf y , (5-44)
12
f fE
12
12

144
where 1.7 0.004 f f
y
Ek
. (5-45)
12 1.9 0.004 f fE ε ε sf y , (5-46)
21
0.2 Before cracking,
0 After cracking
(5-47)
where sf is average strain along the FRP and steel reinforcement.
The comparison between the prediction of the proposed equation and the
experimental results for 21 is shown in Fig. 5.35. A good agreement is observed between
the proposed models and the test data.
Fig. 5.35 Comparison of 21 between Experimental Data and Prediction of Eqn. (5-47)
For , the proposed equation converges to RC when f fE equals to zero. And
as the increase of the FRP reinforcement ratio, the ratio decreases. Fig. 5.36 shows the
comparison between the prediction and experimental results for . It can be observed
12
12
12

145
that the tendency of with respect to FRP stiffness is reasonably captured. The
prediction shows a good agreement with the experimental results.
Fig. 5.36 Comparison of 12 between Experimental Data and Prediction of Eqns. (5-44)-
(5-46)
12f fE

146
5.7 CASE STUDY OF SMM WITH MODIFIED CONSITUTIVE LAWS
In the previous sections, all the analysis of the test data and proposed modified
constitutive laws of concrete and steel in tension, concrete in compression as well as
Poisson ratios (Hsu/Zhu ratios) are presented. It can be observed that the proposed
expressions have a good agreement with the test result in this study and results from other
researchers (Ueda et al., 2002; Farah and Sato, 2011). To further verify the proposed
equations, the constitutive laws developed in this research were incorporated with the
SMM model to predict the behavior of FRP RC elements under pure shear load. The results
of the prediction are compared with two pure shear test results conducted by Zomorodian
in the second phase of the researcher project.
The panel tests were conducted by the state-of-art Universal Panel Tester (Hsu et
al. 1995). As shown in Fig. 5.37, the panel 55 in× 55 in with a thickness of 7 in. FRP sheets
with a width of 5.7 in was applied using full wrap method. No. 4 rebar was used as steel
reinforcement along the longitudinal ( l ) direction and transverse ( t ) direction and the
reinforcement ratios l = t = 0.77%; two different thicknesses (0.025 in and 0.040 in) of
the FRP sheets were used along transverse direction with reinforcement ratio f =0.54%
and 0.87%, respectively. The concrete strength is approximately 40 MPa. Both FRP sheets
and steel rebar are the same type as used in the uniaxial tensile tests in this paper. The
proportional tension-compression load was applied at the principal directions 1 and 2 to
simulate the pure shear stress condition. The details of the pure shear test setup, specimen
and the test results will be presented elsewhere by Zomorodian.

147
Fig. 5.37 Pure Shear Test Specimen Layout
SMM model provides a rational theory of reinforced concrete membrane elements.
The theory satisfies Navier’s three principles of mechanics of materials, known as: stress
equilibrium, strain compatibility, and the constitutive laws of materials. Fig. 5.38 shows
the FRP RC element subjected to in-plane stress. For the conducted pure shear test, FRP
sheets were applied the same direction as the transverse steel reinforcement. And the stress
in the FRP strip (Figure 5.38d) was considered similar to the steel reinforcement (Figure
5.38c). The crack was assumed to occur along the principal direction 2 for applied stresses.

148
a) FRP RC element b) Concrete c) Steel grid d) FRP sheets
e) Principal Coordinate 1-2 f) Assumed Crack Direction
Fig. 5.38 FRP RC Element under In-plane Stress
It can be observed that the new equilibrium for FRP RC elements requires a new term
f fE as
2 2
1 1 2 1 12 1 1
2 2
1 1 2 1 12 1 1
2 2
1 2 1 1 12 1 1
cos sin 2sin cos +
sin cos 2sin cos + +
( )sin cos (cos sin ).
c c c
l l l
c c c
t t t ft ft
c c c
lt
f
f f
(5-48)
The FRP RC element still satisfies the strain compatibility equation as
2 2 121 1 2 1 1 1
2 2 121 1 2 1 1 1
2 2121 2 1 1 1 1
cos sin 2sin cos2
sin cos 2sin cos2
( )sin cos (cos sin ).2 2
l
t
lt
(5-49)

149
The modified constitutive laws were incorporated into the SMM model. The stress strain
relationship for concrete in tension is calculated as
1 1 when c c crE , and (5-50)
1
1
when
c
crc cr crf
, (5-51)
where
/w f sK Kc . (5-52)
The factor wK is to describe the effect of wrapping schemes to the tensile behavior of
concrete. In the case study, fully wrap method was used, therefore
1wK , (5-53)
The factor fK is to describe the effect of FRP/steel stiffness ratio to the tensile behavior of
concrete. It was calculated as
0.25 0.15f f
f
s s
EK
E
, (5-54)
where 1 is the average tensile strain of concrete, c are the average compressive stress in
concrete, s and f are the reinforcement ratios of steel and FRP, respectively, sE and
fE are the modulus of elasticity of steel and FRP, respectively; cr and crf are the strain
and stress at cracking, wK and /f sK are two factors considering the effect of wrapping
schemes and FRP/steel stiffness ratio.
The stress strain relationship for steel in tension is calculated as
' s s s s yf E , (5-55)
'0.91 2 0.02 0.25
s y s ss yf B f B E , (5-56)

150
' '/
y y sf E , '
0.93 2 y y
f fB , (5-57)
1.5
1cr
ye
fB
f
, (5-58)
'3.75 psi
cr cf f , (5-59)
/e s f s fn and /
f
f s
s
En
E , (5-60)
where sf is the average tensile stress of steel, yf and '
yf are the yielding stress and the
apparent yielding stress, respectively, '
y is the average tensile strain at apparent yielding
point, ande
is the proposed equivalent reinforcement ratio.
For the softening coefficient, ζf, the proposed expression in this study is for the
sequential loading condition, however, in the pure shear test, the biaxial loading applied on
the concrete strut is actually proportional. The detail study on the softening coefficient ζf
for the proportional loading will be conducted in the second phase of the project. For this
case study, it is decided to used the original equation in SMM for the constitutive laws of
concrete in compression.
The equations for calculating the modified Hsu/Zhu ratios 12 and 21 in FRP RC
element are
12υ 0.2 sfk ε ε
sf y , (5-61)
where 1.7 0.004 f f
y
Ek
(5-62)
12 1.9 0.004 f fE ε ε sf y , and (5-63)

151
21
0.2 Before crackingυ
0 After cracking,
(5-64)
where y is the yielding strain for steel, 1 direction is the principal tensile direction, and 2
direction is the principal compressive direction, the crack occurs along 1 direction.
To solve all the stress equilibrium, strain compatibility, and stress-strain
relationships, iteration method is applied. Details of the solution algorism is presented in
another publication of the author (Yang et al., 2013). Fig. 5-39a)-b) show the comparison
of the shear stress and shear strain curve between the experimental tests and two
different SMM. One is the SMM with the original constitutive laws of concrete and steel
in tension for un-strengthened RC members; the other one is the SMM with the proposed
modified constitutive laws. P4-025-FW and P4-040-FW stand for the specimen with f =
0.54% and 0.87%, respectively. It can be seen that the original model underestimated the
tension stiffening effect of concrete, while the SMM with modified constitutive laws shows
a much better prediction, especially for the pre-yielding portion of the behavior, this can
be attributed to the more accurate constitutive models proposed in this study.
a) P4-025-FW

152
b) P4-040-FW
Fig. 5.39 Comparison between Test Results and SMM with Original and Modified
Constitutive Laws
5.8 SUMMARY
The experimental and the analytical results are reported in detail in this chapter.
The constitutive laws of concrete in tension, steel in tension were carefully investigated by
analyzing the test data of uniaxial tension test. The softening coefficient and Hsu/Zhu ratio
were investigated by analyzing the data of biaxial tension-compression test. Effect of
different parameters such as steel reinforcement ratio, FRP reinforcement ratio and
wrapping schemes were carefully investigated. The main findings includes:
1) It was found that the wrapping scheme, steel reinforcement ratio and FRP
reinforcement ratio have an effect on the behavior of concrete in tension: first, compared
to the un-strengthened RC element, the specimens strengthened with FRP exhibit a greater
tension stiffening effect. Also, the tension stiffening effect tends to be more significant for
the specimen with greater steel reinforcement ratio and lower FRP reinforcement ratios.
Last but not the least, specimen strengthened by fully wrap and U-warp with FRP anchors
tends to have a more significant tension stiffening effect than the specimen with side bond.

153
2) FRP reinforcement ratio was found to have an effect on the apparent yielding
stress of the steel. As the increase of the FRP reinforcement ratio, the apparent yielding
stress increases. This could be due to the effect of FRP on controlling the crack width. It
was observed that with the increase of the FRP reinforcement ratio, the average crack width
decreases, and consequently the local stress concentration for the rebar is reduced, which
postponed the yielding of the steel.
3) The softening coefficient for FRP RC element was found to be greater than un-
strengthened RC element. And the softening coefficient became greater with the increase
of FRP reinforcement ratio. The additional compressive strength of concrete can be
attributed to the confinement provided by the externally bonded FRP sheets. As the
increase of the FRP reinforcement ratio, the confinement effect becomes stronger and
consequently the softening coefficient is greater.
4) The existence of FRP was also found to alter the Hsu/Zhu ratios. While the
Hsu/Zhu ratio 21 for FRP RC element was the same as un-strengthened RC element, the
Hsu/Zhu ratio was found to be much smaller in FRP RC element than for RC element,
which means the for the same compressive strain increment, the increase of tensile strain
is much smaller for specimen with FRP than the un-strengthened RC members. This can
be attributed to the confinement the FRP provides, which stiffens the specimen in the
tensile direction. Another fact that can be observed from the test results is that as the
increase of the FRP stiffness, the Hsu/Zhu ratio decreases. This can be explained that as
the FRP reinforcement ratio increases, a better confinement is provided and the specimen
becomes stiffer in the tensile direction.
12
154
5) As case study, the modified constitutive laws was incorporated in SMM and used
to predict the behavior of two FRP strengthened RC panels subjected to pure shear load.
The prediction of SMM with modified constitutive laws shows a better agreement with
experimental test compared to SMM with original constitutive laws, which indicates the
accuracy of the modified constitutive laws proposed in this paper.
In next chapter, conclusion of this research will be given. Application and limitation
for this study is also addressed. Future work is also given at the end.
155
CHAPTER 6 CONCLUSIONS AND RECOMMENDATIONS
6.1 GENERAL
Softened truss model theories have been developed and widely used to predict the
behavior of RC element under in-plane shear stress fields. The softened truss model theory
requires equilibrium equations, compatibility equations, and a set of constitutive laws that
links stress and strain. In order to use the softened truss model theory to predict the behavior
of the FRP RC element under in-plane shear stress fields, new constitutive laws for each
material component in FRP RC element have to be re-established. The object of this
research was to investigate the constitutive laws related to concrete in tension, steel in
tension, the softening coefficient and the modified Hsu/Zhu ratios.
The modified constitutive laws of concrete in tension, steel in tension, were
determined from uniaxial tension tests of 13 FRP RC prim specimens; the softened
coefficient and Hsu/Zhu ratio were modified by biaxial tension-compression tests of six
full-size FRP RC panels. The studied variables in uniaxial tension tests are steel
reinforcement ratio, FRP reinforcement ratio and wrapping schemes; the studied variable
in biaxial tension-compression tests is FRP reinforcement ratios. These newly developed
material laws will be used to further develop models to predict the behavior of FRP
strengthened RC elements subjected to shear and torsion. The results from both
experimental and analytical studies in this research project will provide a promising
contribution to the prediction of the behavior of FRP RC members under shear, which is
expected to ultimately improve the accuracy of the available design guidelines.

156
As a summary, all these derived constitutive laws are presented in this chapter. The
main findings and conclusions are addressed, and also, recommendations for future
research are presented.
6.2 SUMMARY OF MODIFIED CONSTITUTIVE LAWS
6.2.1 Concrete in Tension
The stress strain relationship for concrete in tension was proposed as:
1 1 when c c crE , and (6-1)
1
1
when
c
crc cr crf
, (6-2)
where
/w f sK Kc . (6-3)
The factor wK is to describe the effect of wrapping schemes to the tensile behavior of
concrete. For full anchorage (rupture failure expected): fully wrap or U-wrap with anchors,
1wK , (6-4a)
and for other anchorage (non-rupture failure more likely): side bond or U-wrap
1.6wK . (6-4b)
The factor fK is to describe the effect of FRP/steel stiffness ratio to the tensile behavior of
concrete. It is proposed as
0.25 0.15f f
f
s s
EK
E
, (6-5)
where 1 is the average tensile strain of concrete, c are the average compressive stress in
concrete, s and f are the reinforcement ratios of steel and FRP, respectively, sE and

157
fE are the modulus of elasticity of steel and FRP, respectively; cr and crf are the strain
and stress at cracking, wK and /f sK are two factors considering the effect of wrapping
schemes and FRP/steel stiffness ratio.
6.2.2 Steel in Tension
The stress strain relationship for steel in tension was proposed as:
' s s s s yf E , (6-6)
'0.91 2 0.02 0.25
s y s ss yf B f B E , (6-7)
' '/
y y sf E , '
0.93 2 y y
f fB , (6-8)
1.5
1cr
ye
fB
f
, (6-9)
'3.75 psi
cr cf f , (6-10)
/e s f s fn and /
f
f s
s
En
E , (6-11)
where sf is the average tensile stress of steel, yf and '
yf are the yielding stress and the
apparent yielding stress, respectively, '
y is the average tensile strain at apparent yielding
point, ande
is the proposed equivalent reinforcement ratio.
6.2.3 Softening Coefficient ζf
The softening coefficient, ζf, for concrete considering the effect of FRP sheets was
proposed as

158
4'
1
5.8 1ζ 0.9 1
241 250f
c
ff
FRP
and (6-12)
41 0.02 f ff FRP E , (6-13)
where is the deviation angle, '
cf is the compressive strength of concrete from cylinder
tests.
6.2.4 Modified Hsu/Zhu Ratios
The equations for calculating the modified Hsu/Zhu ratios 12 and 21 in FRP RC
element were proposed as
12υ 0.2 sfk ε ε
sf y , (6-14)
where 1.7 0.004 f f
y
Ek
(6-15)
12 1.9 0.004 f fE ε ε sf y , and (6-16)
21
0.2 Before crackingυ
0 After cracking,
(6-17)
where y is the yielding strain for steel, 1 direction is the principal tensile direction, and 2
direction is the principal compressive direction, the crack occurs along 1 direction.
6.3 CONCLUSIONS
The constitutive laws for concrete in tension and steel in tension were determined
from 13 uniaxial tension tests of FRP RC prisms; the softening coefficient was determined
from eight biaxial tension-compression panel tests conducted by Moslehy (2010) and three
additional tests by the author; the modified Hsu/Zhu ratios were determined by three biaxial

159
tension-compression panel tests. The Effect of different parameters such as steel
reinforcement ratio, FRP reinforcement ratio, and wrapping schemes were carefully
investigated. The main findings in this research are discussed as follows:
a) It was found that the wrapping scheme, steel reinforcement ratio and FRP
reinforcement ratio have an effect on the behavior of concrete in tension. First, compared
to the un-strengthened RC element, the specimens strengthened with FRP exhibit a greater
tension stiffening effect. Second, the tension stiffening effect tends to be more significant
for the specimens with greater steel reinforcement ratio and lower FRP reinforcement ratios.
Last but not the least, specimens strengthened by fully wrap and U-warp with FRP anchors
tend to have a more significant tension stiffening effect than the specimens with side bond
wrapping scheme.
b) The FRP reinforcement ratio was found to have an effect on the apparent yielding
stress of the steel. With the increase of the FRP reinforcement ratio, the apparent yielding
stress increases. This could be due to the effect of FRP on controlling the crack widths. It
was observed that with the increase of the FRP reinforcement ratio, the average crack width
decreases, and consequently the local stress concentration of the rebars at cracks decrease,
which ultimately postponed the yielding of the steel.
c) The softening coefficient for FRP RC element was found to be greater than un-
strengthened RC element. And also, the softening coefficient became greater with the
increase of FRP reinforcement ratio. The additional compressive strength of concrete can
be attributed to the confinement provided by the externally bonded FRP sheets. As the
increase of the FRP reinforcement ratio, the confinement effect becomes stronger and
consequently the softening coefficient will be greater.

160
d) The existence of FRP was also found to alter the Hsu/Zhu ratios. While the
Hsu/Zhu ratio 21 for FRP RC element was the same as un-strengthened RC element, the
Hsu/Zhu ratio was found to be much smaller in FRP RC element than for RC element;
which means for the same compressive strain increment in direction 2, the increase of
tensile strain in direction 1 is much smaller for the specimen with FRP than the un-
strengthened RC members. This can be attributed to the additional confinement the FRP
provides, which stiffens the specimen in the tensile direction. Another fact that can be
observed from the test results is that with the increase of the FRP stiffness, the Hsu/Zhu
ratio decreases. This can be explained in a sense that as the FRP reinforcement ratio
increases, a better confinement is provided and the specimen becomes stiffer in the tensile
direction.
6.4 UPCOMING WORK ON DEVELOPMENT OF SHEAR MODEL
The research work conducted by the author is part of an on-going NSF project with
the aim of developing the analytical models for FRP strengthened RC elements under shear
stress field including membrane stresses. Fig. 6.1 shows the work plan of the project and
the contribution of the author. As the first step of developing a shear model of FRP RC
elements, constitutive laws of each material component were studied through experimental
and analytical investigations. The second phase of the research, which will be presented by
another PhD candidate, will focus on using the newly developed material laws of the FRP
RC members to predict the behavior of FRP RC member subjected to pure shear. The main
objective of the second phase of the research will be developing an analytical model based
on the softened membrane model to predict the behavior of FRP strengthened RC elements
subjected to pure shear. In order to evaluate such behavior, a series of large scale FRP
12

161
strengthened RC panels were tested under pure shear by the Universal Panel Tester. The
softening coefficients proposed here for FRP RC members will be modified based on pure
shear tests. Specifically, the effect of deviation angle will be investigated, which was not
considered as an effecting parameter in the research done in this dissertation.
Furthermore, several design guidelines for FRP shear-strengthened reinforced
concrete sections are currently being used around the world. Lack of basic understanding
of the shear behavior in FRP strengthened members and also, inaccurate evaluation of the
contribution of concrete (Vc) and transverse reinforcement (Vs) has led to the inaccuracy
of the proposed models and guidelines. Unlike the models proposed by researchers, the
selected relationships for Vf in design codes are expected to have considered a broader
range of application and have been calibrated by a larger pool of test results. Previous
studies revealed that, similar to the analytical models a large scatter was observed between
the experimentally and code-derived shear strength values. This research work will lead to
the basic understanding of the shear behavior. The existing shear design models for FRP
strengthened members will be reviewed and assessed with the experimental tests proposed
herein and possible refinements will be discussed.

162
Fig. 6.1 Outline of the Whole Project

163
6.5 LIMITATIONS AND FUTURE WORK
6.5.1 Future Work on Shear Modeling of Beams
Due to the complexity of the shear behavior of FRP RC element, continuous
research activity is still needed to fulfill the gaps in the literature. The following topics can
be further studied in terms of the behavior of FRP RC element under shear stress fields:
a) Scale Factor: For RC beam without shear reinforcement, the shear resistance
decreases as the beam size increases. Few test results indicate that this phenomenon was
also observed in FRP RC beams; as the height of the specimen increased the shear gain
due to FRP decreased. (Bousselham and Chaallal, 2004; Leung et al., 2007). More
experiments can be conducted to investigate the effect of scale on the shear behavior of the
FRP RC members.
b) Pre-Loading/Cracking: Externally strengthening with FRP is more suitable for
existing in-service structures that often are pre-cracked. The very few investigations carried
out on RC beams that were pre-cracked prior to their strengthening indicate that pre-
loading does not affect the shear performance of retrofitted beams (Czaderski, 2002;
Carolin and Taljsten, 2005a, and Hassan Dirar et al., 2006). However, this finding may
need to be confirmed by further tests.
c) Shear Fatigue Load: As shear fatigue behavior of RC beams has been studied
since 1950s, but it has not been well studied for FRP RC element. Only limited test has
been done, and among these tests, most of them are flexural fatigue. The shear fatigue tests
that have been done show a very limited degradation of shear behavior of FRP RC beams
under fatigue load compared to static load. More tests are needed to further study the effect

164
of fatigue load since this loading condition exists widely in the bridge girders strengthened
by externally bonded FRP sheets.
6.5.2 Limitations and Future Work on Constitutive Modeling
As for the constitutive modeling of the FRP RC element, different material laws
were investigated in this study by full-scale tests of FRP RC specimens. The studied
parameters in this study include the steel reinforcement ratio, FRP reinforcement ratio, and
wrapping schemes. The effect of each parameters on various constitutive laws were
carefully investigated. However, several other factors that might affect the constitutive
laws are still in need of being investigated:
a) Effect of concrete strength and deviation angle on the softening coefficient.
The softening coefficient has been proven to be a function of concrete strength and
deviation angle for un-strengthened RC members. The derivation angle was defined as
the difference between the principal directions of the un-cracked and cracked element. For
FRP RC element, the effect of concrete strength and deviation angle might be altered. In
the proposed equation, this effect was not considered as a parameter.
b) Effect of loading pattern on the softening coefficient. In the proposed study,
sequential loading was used. However, in the real shear loading stress condition, the stress
is proportionally applied to the structure member. For un-strengthened RC members,
loading patterns have been proven to be a factor that affects the behavior of concrete under
compression, but similar research was not available for FRP RC elements. Therefore,
research needs to be conducted to study the effect of the loading patterns on the softening
coefficient for the FRP RC element.
165
c) Effect of wrapping scheme or anchorage system on the behavior of concrete in
tension. In the proposed study, three different wrapping schemes were used, and their
effects on the tension stiffening were investigated. However, there are various types of
anchorage systems in the application of FRP. The proposed equation was derived based on
one type of anchor only, more tests are needed to check the tension stiffening effect of
specimen with other types of anchors. Also, the mechanism of different wrapping schemes,
the bond behavior and crack characteristics for each wrapping schemes and anchorage
systems need to be further studied to give a physical explanation for the change of the
behavior due to different wrapping methods.
d) Boundary values for the effect of FRP/steel reinforcement ratios to the tension
stiffening. The proposed equation was based on the regression of test data with
/f f s sE E between 0.25 and 1.11. However, the verification of the lower and upper
boundary value for the proposed equation requires more test results.
e) Effect of specimen thickness to the constitutive laws. It has been observed from
the beam tests (Murphy et al., 2012) that the thickness of the web will reduce after FRP
debonding. The reduction of web thickness results in decrease of the shear strength. This
phenomenon could also affect the material laws. In the softening test, decrease in concrete
thickness could potentially cause sooner compression failure of concrete which will reduce
the softening coefficient. This effect should be investigated by further tests.

166
REFERENCES
AASHTO (2012). AASHTO LRFD Bridge design specifications. Washington, DC:
American Association of State Highway and Transportation Officials.
Al-Sulaimani, G. J., Shariff, A., Basanbul, I. A., Baluch, M. H, and Ghaleb, B. N. (1994).
Shear repair of reinforced concrete by fiber glass plate bonding. ACI Structural
Journal, 91(4). 458–464.
ACI (2008). Guide for the design and construction of externally bonded FRP systems for
strengthening concrete structures. Farmington Hills, MI: American Concrete
Institute.
ACI (2008). Building code requirements for structural concrete. Farmington Hills, MI:
American Concrete Institute.
ACI (2014). Building code requirements for structural concrete. Farmington Hills, MI:
American Concrete Institute.
Antonopoulos, C. P. (1996). Shear strengthening of reinforced concrete structures using
composite materials (Doctoral dissertation). Department of Civil Engineering,
University of Patras, Patras, Greece.
Araki, N., Matsuzaki, Y., Nakano, K., Kataoka, T., and Fukuyama, H. (1997). Shear
capacity of retrofitted RC members with continuous fiber sheets. Proceedings of the
3rd International RILEM Symposium on Non-Metallic (FRP) Reinforcement for
Concrete Structures (FRPRCS-3). Sapporo, Japan.
ASTM INTERNATIONAL C39/C39M-14a (2014). Standard test method for compressive
strength of cylindrical concrete specimens. West Conshohocken: American Society
for Testing and Materials.

167
ASTM INTERNATIONAL D30.04 (2014). Standard test method for tensile properties of
polymer matrix composite materials. West Conshohocken, PA: American Society for
Testing and Materials.
ASTM INTERNATIONAL D30.10 (2014). Standard test method for pull-off strength for
FRP bonded to concrete substrate. West Conshohocken, PA: American Society for
Testing and Materials.
Bakis, C. E., Bank, L. C., Brown, V. L., Cosenza, E., Davalos, J. F., Lesko, J. J., Machida,
A., Rizkalla, S. H., and Triantafillou, T. C. (2002). Fiber-reinforced polymer
composites for construction: State-of-the-art review. Journal of Composites for
Construction, 6(2), 73–87.
Balakrishnan, S. and Murray, D.W. (1988). Prediction of R/C panels and deep beam
behavior by NLFEA. Journal of Structural Engineering, 114(10), 2323–2342.
Belarbi, A., and Hsu, T. T. C. (1994). Constitutive laws of concrete in tension and
reinforcing bars stiffened by concrete. ACI Structural Journal, 91(4), 465–474.
Belarbi, A., and Hsu, T. T. C. (1995). Constitutive laws of softened concrete in biaxial
tension compression. ACI Structural Journal, 92(5), 562–573.
Belarbi, A., Bae, S., and Brancaccio, A. (2010). Behavior of full-scale RC T-beams
strengthened in shear with externally bonded FRP sheets. Construction Building
Material, 32, 27–40.
Belarbi, A., Bae, S. W., Ayoub, A., Kuchma, D., Mirmiran, A., and Okeil, A. (2011).
NCHRP Report 678: Design of FRP systems for strengthening concrete girders in
shear. Washinton, DC: National Cooperative Highway Research Program.

168
Belarbi, A., Bae, S. W., Brancaccio, A. (2012). Behavior of full-scale RC T-beams
strengthened in shear with externally bonded FRP sheets. Construction and Building
Materials, 32, 27-40.
Belarbi, A., Acun, B. (2013). FRP systems in shear strengthening of reinforced concrete
structures. Modern Building Materials, Structures and Techniques, 57, 2–8.
Belletti, B., Cerioni, R. and Iori, I. (2001). Physical Approach for Reinforced-Concrete
(PARC) membrane elements. Journal of Structural Engineering, 127(12) 1412–1426.
Berset, J. D. (1992). Strengthening of reinforced concrete beams for shear using FRP
composites (Master’s thesis). Retrieved from DSpace@MIT.
Bischoff, P. H. (2001). Effects of shrinkage on tension stiffening and cracking in reinforced
concrete. Canadian Journal of Civil Engineering, 28(3), 363–374.
Bischoff, P. H. (2003). Tension stiffening and cracking of steel fiber-reinforced concrete.
Journal of Materials in Civil Engineering, 15(2), 174–182.
Bischoff, P. H. (2005). Reevaluation of deflection prediction for concrete beams reinforced
with steel and Fiber Reinforced Polymer bars. Journal of Structural Engineering,
131(5), 752–767.
Bousselham, A., and Chaallal, O. (2004). Shear strengthening reinforced concrete beams
with fiber-reinforced polymer: assessment of influencing parameters and required
research. ACI Structural Journal, 101(2), 219–227.
Bousselham, A., and Chaallal, O. (2006). Effect of transverse steel and shear span on the
performance of RC beams strengthened in shear with CFRP. Composites Part B:
Engineering, 37(1). 37–46.

169
Bousselham A., and Chaallal O. (2008). Mechanisms of shear resistance of concrete beams
strengthened in shear with externally bonded FRP. Journal of Composite for
Constructions, 12(5), 499–512.
CAN/CSA S806-12 (2012). Design and construction of building structures components
with Fiber-Reinforced Polymers. Rexdale, Ontario, Canada: Canadian Standard
Association.
Cao, S. Y., Chen, J. F., Teng, J. G., Hao, Z., and Chen, J. (2005). Debonding in RC beams
strengthened with complete FRP wraps. Journal of Composites for Construction,
9(5), 417–428.
Carolin, A., and Taljsten, B. (2005). Theoretical study of strengthening for increased shear
bearing capacity. Journal of Composites for Construction, 9(6), 497–506.
Ceroni, F., Pecce M., and Matthys, S. (2004). Tension stiffening of RC ties strengthened
with externally bonded FRP sheets. Journal of Composites for Construction, 8(1),
510–518.
Chaallal, O., Nollet, M. J., and Perraton, D. (1998). Strengthening of RC beams with
externally bonded fiber-reinforced-plastic plates: design guidelines for shear and
flexure. Canadian Journal of Civil Engineers, 25(4), 692–704.
Chaallal, O., Shahawy, M., and Hassan, M. (2002). Performance of reinforced concrete T-
girders strengthened in shear with carbon fiber reinforced polymer fabrics. ACI
Structural Journal, 99(3), 335–343.
Chajes, M. J., Jansuska, T. F., Mertz, D. R., Thomson, T. A., and Finch, W. W. (1995).
Shear strength of RC beams using externally applied composite fabrics. ACI
Structural Journal, 92(3), 295–303.

170
Chen G.M., Teng J.G., Chen J.F. (2010). Interaction between steel stirrups and shear-
strengthening FRP strips in RC Beams. Journal of Composite for Constructions,
14(5), 498–509.
Chen, G., Teng, J., and Chen, J. (2013). Shear strength model for FRP-strengthened RC
beams with adverse FRP-steel interaction. Journal of Composites for Construction,
17(1), 50–66.
Chen, J. F., and Teng, J. G. (2003a). Shear capacity of FRP strengthened RC beams: FRP
debonding. Construction Building Materials, 17(1), 27–41.
Chen, J. F., and Teng, J. G. (2003b). Shear capacity of Fiber-Reinforced Polymer-
strengthened reinforced concrete beams: Fiber Reinforced Polymer rupture. Journal
of Structural Engineering, 129(5), 615–625.
Chintrakarn, R. (2001). Minimum shear steel and failure modes diagram of reinforced
concrete membrane elements (Master’s thesis). Department of Civil and
Environmental Engineering, University of Houston, Houston, Texas, USA.
Colalillo, M. A., and Sheikh, S. (2014). Behavior of shear-critical reinforced concrete
beams strengthened with Fiber-Reinforced Polymer—Analytical method. ACI
Structural Journal, 111(6), 1385–1396.
Colotti, V., and Swamy, R. N. (2011). Unified analytical approach for determining shear
capacity of RC beams strengthened with FRP. Engineering Structures, 33, 827–842.
Concrete Society (2004). Design guidance on strengthening concrete structures using fibre
composite materials: Technical report 55. London, UK: Concrete Society.
Crisfield, M.A. andWills, J. (1989). Analysis of R/C panels using different concrete models.
Journal of Engineering Mechanics. 115(3) 578–597.

171
Dai, J. G., Saito, Y., Ueda, T., and Sato, Y. (2005). Static and fatigue bond characteristics
of interfaces between CFRP sheets and frost damage experienced concrete.
Proceedings of the 7th International RILEM Symposium on Non-Metallic (FRP)
Reinforcement for Concrete Structures (FRPRCS-7). Kansas City, Missouri.
Deniaud, C., and Cheng, J. J. R. (2001). Shear behavior of reinforced concrete t-beams
with externally bonded fiber-reinforced polymer sheets. ACI Structural Journal,
98(3). 386–394..
Deniaud, C., and Cheng, J. J. R. (2004). Simplified shear design method for concrete beams
strengthened with fiber reinforced polymer sheets. Journal of Composites for
Construction, 8(5), 425–433.
Denton, S. R., Shave, J. D., and Porter, A. D. (2004). Shear strengthening of reinforced
concrete structures using FRP composites. Proceedings of the International
Conference on Advanced Polymer composites for Structural applications in
Constructions. Cambridge, UK.
Dolan, C. W., Rider, W., Chajes, M. J., and DeAscanis, M. (1992). Prestressed concrete
beams using non-metallic tendons and external shear reinforcement. ACI SP 138-29.
475–495.
Eshwar, N., Nanni, A., and Ibell, T. (2003). CFRP strengthening of concrete bridges with
curved soffits. Proceedings of the International Conference on Structural Faults and
Repairs, Montreal, Quebec.
Eshwar, N., Nanni, A., and Ibell, T.J. (2008). Performance of two anchor systems of
externally bonded Fiber-Reinforced Polymer laminates. ACI Materials Journal,
105(1), 72–80.

172
Eurocode-2 (2004). Eurocode 2: Design of Concrete Structures-Part 1: General Rules and
Rules for Buildings. Brussels, Belgium: European Committee for Standardization.
Evans, R. H., and Marathe, M. S. (1968). Microcracking and stress-strain curves for
concrete in tension. Materials and Structures, 1(1), 61–64.
Farah, Y., and Sato, Y. (2011). Uniaxial tension behavior of reinforced concrete members
strengthened with carbon fiber sheets. Journal of Composites for Construction, 15(2),
215–228.
Fialkow, M. N. (1985). Design and capacity evaluation of reinforced concrete shell
membranes. ACI Structural Journal, 82(6), 844–852.
fib-TG9.3 (2001). Design and Use of Externally Bonded Fiber Polymer Reinforcement
(FRP EBR) for Reinforced Concrete Structures. Lausanne, Switzerland: International
Federation for Structural Concrete.
Funakawa, I., Shimono, K., Watanabe, T., Asada, S., and Ushijima, S. (1997).
Experimental study on shear strengthening with continuous fiber reinforcement sheet
and methyl methacrylate resin. Proceedings of the 3rd International RILEM
Symposium on Non-Metallic (FRP) Reinforcement for Concrete Structures
(FRPRCS-3). Sapporo, Japan.
Ghiassi, B., Xavier, Oliveira, D., Lourenço, P. (2013). Application of digital image
correlation in investigating the bond between FRP and masonry. Composite
Structures, 106, 340–349.
Gopalaratnam, V. S., and Shah, S. P. (1985). Softening response of plain concrete in direct
tension. ACI structural Journal, 83(3), 310-323.

173
Hsu T. T. C., Belarbi A., and Pang X. (1995). A universal panel tester. Journal of Testing
and Evaluation, 23(1), 41–49.
Hsu, C. T. T., Punurai, W., and Zhang, Z. (2003). Flexural and shear strengthening of RC
beams using Carbon Fiber Reinforced Polymer laminate, ACI SP 211-5, 89–113.
Hsu, T. T. C. (1993). Unified theory of reinforced concrete. Boca Raton, FL: CRC Press
Inc.
Hsu, T.T.C. and Zhang, L.X. (1996). Tension stiffening in reinforced concrete membrane
elements. Structural Journal of the American Concrete Institute, 93(1), 108–115.
Hsu, T. T. C., and Zhang, L. X. (1997). Nonlinear analysis of membrane elements by Fixed-
Angle Softened-Truss Model. Structural Journal of the American Concrete Institute,
94(5), 483–492.
Hsu, T.T.C., and Zhu, R. R. H. (2002). Softened Membrane Model for reinforced concrete
elements in shear. Structural Journal of the American Concrete Institute, 99(4), 460–
469.
Hsu, C. T. T., Punurai, W., and Zhang, Z. (2003). Flexural and shear strengthening of RC
beams using Carbon Fiber Reinforced Polymer Laminate. ACI SP-211-5, 89–113.
Hughes, B. P., and Chapman, G. P. (1966). The deformation of concrete and microconcrete
in compression and tension with particular reference to aggregate size. Magazine of
Concrete Research, 8(54), 19–24.
Hutchinson, R. L., and Rizkalla, S. H. (1999). Shear strengthening of AASHTO bridge
girders using carbon fiber reinforced polymer sheets. ACI SP188, 945–958.

174
ISIS Design Manual 4. (2001). Strengthening reinforced concrete structures with
externally-bonded fiber reinforced polymers. Winnipeg, Canada: Intelligent Sensing
for Innovative Structures.
Izumo, J., Shin H., Maekawa, K., and Okamura, H. (1991). An analytical model for RC
panels subjected to in-plane stresses. Proceedings of the International Workshop on
Concrete Shear in Earthquake. London, UK: Elsevier Science Publishers, Inc.
Jiang, D. H., Shah, S. P., and Andonian, A. T. (1984). Study of the transfer of tensile forces
by bond, ACI Journal Proceedings, 81(3), 251–259.
Jinno, Y., and Tsukagishi, H. (1998). Structural properties of RC walls strengthened by
Carbon Fiber Sheets, Proceedings of Architectural Institute of Japan Annual
Conference, Fukuoka, Japan.
JSCE (2001). Recommendations for upgrading of concrete structures with use of
continuous fiber sheets. Tokyo, Japan: Japan Society of Civil Engineers
Kachlakev, D. I, and Barnes, W. A. (1999). Flexural and shear performance of concrete
beams strengthened with fiber reinforced polymer laminates. Proceedings of the 4th
International RILEM Symposium on Non-Metallic (FRP) Reinforcement for
Concrete Structures (FRPRCS-4). Baltimore, Maryland.
Kage, T., Abe, M., Lee, H. S., Tomosawa F. (1997). Effect of CFRP sheets on shear
strengthening of rc beams damaged by corrosion of stirrup. Proceedings of the 3rd
International RILEM Symposium on Non-Metallic (FRP) Reinforcement for
Concrete Structures (FRPRCS-3). Sapporo, Japan.

175
Kaklauskas, G., and Gribniak, V. (2011). Eliminating shrinkage effect from moment-
curvature and tension-stiffening relationships of reinforced concrete members,
Journal of Structural Engineering. 137(12), 1460–1469.
Kaklauskas, G., Gribniak, V., Bacinskas, D. and Vainiunas, P. (2009). Shrinkage influence
on tension stiffening in concrete members, Engineering Structures, 31(6), 1305–12.
Kamiharako, A., Maruyama, K., Takada, K., and Shimomura, T. (1997). Evaluation of
shear contribution of FRP sheets attached to concrete beams. Non-Metallic (FRP)
Reinforcement for Concrete Structures, 1, 467–474.
Kaufmann, W. and Marti, P. (1998). Structural concrete: cracked membrane model.
Journal of Structural Engineering. 124(12) 1467–1475.
Khalifa, A., and Nanni, A. (2002). Rehabilitation of rectangular simply supported RC
beams with shear deficiencies using CFRP composite. Construction and Building
Materials, 16(1), 135–146.
Khalifa, A., Gold, W., Nanni, A., and Abdel Aziz, M. I. (1998). Contribution of externally
bonded FRP to shear capacity of RC flexural members,” Journal of Composites for
Construction, 2(4), 195–202.
Khalifa, A., Tumialan, G., Nanni, A., and Belarbi, A. (1999). Shear strengthening of
continuous reinforced concrete beams using externally bonded Carbon Fiber
Reinforced Polymer sheets. Proceedings of 4th International RILEM Symposium on
Non-Metallic (FRP) Reinforcement for Concrete Structures (FRPRCS-4), Baltimore,
Maryland.

176
Kong, K. L., Beeby, A. W., Forth, J. P. and Scott, R. H. (2007). Cracking and tension zone
behavior in reinforced concrete flexural members. Proceedings of ICE: Structure and
Buildings, 160(3), 165–172.
Lee, G. Y., and Kim, W. (2008). Cracking and tension stiffening behavior of high strength
concrete tension members subjected to axial load. Advances in Structural
Engineering, 11(5), 127–137.
Maeda, T., Asano, Y., and Sato, Y. (1997). A study on bond mechanism of carbon fiber
sheet. Proceedings of the 3rd International RILEM Symposium on Non-Metallic
(FRP) Reinforcement for Concrete Structures (FRPRCS-3). Sapporo, Japan.
Malek, A. M., and Saadatmanesh, H. (1998). Analytical study of reinforced concrete beams
strengthened with web-bonded fiber reinforced plastics or fabrics. ACI Structural
Journal, 95(3), 343–351.
Malvar, L. J. (1995). Tensile and bond properties of GFRP reinforcing bars. ACI Materials
Journal, 92(3). 276–285.
Miller, B. (1999). Bond between carbon fiber reinforced polymer sheets and concrete
(Master’s thesis), Department of Civil, Architectural, and Environmental
Engineering, University of Missouri-Rolla, Rolla, MO.
Mitsui, Y., Murakami, K., Takeda, K., and Sakai, H. (1998). A study on shear
reinforcement of reinforced concrete beams externally bonded with carbon fiber
sheets. Composites Interfaces, 5(4), 285–295.
Miyahara, T., Kawakami, T., and Maekawa, K. (1987). Nonlinear behavior of cracked
reinforced concrete plate element under uniaxial compression. Concrete Library of
JSCE, 131–144. (Translation from Proceedings of JSCE, No. 378N-6, Feb. 1987).

177
Mofidi, A. and Chaallal, O. (2014). Effect of steel stirrups on shear resistance gain due to
externally bonded fiber-reinforced polymer strips and sheets. ACI Structural Journal,
111(2), 353–361.
Monti, G., and Liotta, M. A. (2005). FRP-strengthening in shear: tests and design
equations. Proceedings of 7th International RILEM Symposium on Non-Metallic
(FRP) Reinforcement for Concrete Structures (FRPRCS-7). Kansas City, Missouri.
Monti, G., and Liotta, M. A. (2005). FRP-strengthening in shear: tests and design equations.
Proceedings of the 7th International RILEM Symposium on Non-Metallic (FRP)
Reinforcement for Concrete Structures (FRPRCS-7). Kansas City, Missouri.
Moslehy, Y. (2010). Constitutive relationships and smart aggregates-based damage
evaluation of FRP retrofitted concrete membrane elements (Doctoral dissertation).
Department of Civil and Environmental Engineering, University of Houston,
Houston, Texas.
Murphy, M., Belarbi, A., and Bae, S. W. (2012). Behavior of prestressed concrete I-girders
strengthened in shear with externally bonded fiber-reinforced-polymer sheets. PCI
Journal, 63-82.
Mutsuyoshi, H., Ishibashi, T., Okano, M., and Katsuki, F. (1999). New design method for
seismic retrofit of bridge columns with continuous fiber sheet–Performance-based
design. Proceedings of the 4th International RILEM Symposium on Non-Metallic
(FRP) Reinforcement for Concrete Structures (FRPRCS-4). Baltimore, Maryland.
Nehdi, M., and Nikopour, H. (2010). Genetic algorithm model for shear capacity of RC
beams reinforced with externally bonded FRP. Materials and Structures, 33, 1249-
1258.

178
Niemitz, C.W. (2008). Anchorage of Carbon Fiber Reinforced Polymers to reinforced
concrete in shear applications (Master’s thesis). Department of Civil and
Environmental Engineering, University of Massachusetts-Amherst, Amherst, MA.
Oehlers, D. J., Liu. I. S. T., and Seracino, R. (2005). Shear deformation debonding of
adhesively bonded plates. Proceedings of the ICE - Structures and Buildings, 158(1),
77-84.
Ohuchi, H., Ohno, S., Katsumata, H., Kobatake, Y., Meta, T., Yamagata, K., Inokuma, Y.,
and Ogata, N. (1994). Seismic strengthening design technique for existing bridge
columns with CFRP, Proceedings of the 2nd International Workshop on Seismic
Design and Retrofitting of Reinforced Concrete Bridges. Queenstown, New Zealand.
Okamura, H., Maekawa, K., and Sivasubramaniyam, S. (1985). Verification of modeling
for reinforced concrete finite element. Proceedings of Japan-US Seminar on Finite
Element Analysis of Reinforced Concrete Structures, Tokyo, Japan.
Ono, K., Matsumura, M., Sakanishi, S., and Miyata, K. (1997). Strength improvement of
rc bridge piers with carbon fiber sheet. Proceedings of the 3rd International RILEM
Symposium on Non-Metallic (FRP) Reinforcement for Concrete Structures
(FRPRCS-3). Sapporo, Japan.
Orton, S.L. (2007). Development of a CFRP system to provide continuity in existing
reinforced concrete buildings vulnerable to progressive collapse (Doctoral
dissertation). Department of Civil, Architectural, and Environmental Engineering,
University of Austin-Texas, Austin, Texas.
Pang, X. B., and Hsu, T. T. C. (1995). Behavior of reinforced concrete membrane elements
in shear. ACI Structural Journal, 92(6), 665–679.

179
Pang, X. B., and Hsu, T. T. C. (1996). Fixed-Angle Softened-Truss Model for reinforced
concrete. ACI Structural Journal, 93(2), 197–207.
Park, S. Y., Naaman, A. E., Lopez, M. M., and Till, R. D. (2001).Shear strengthening effect
of R/C beams using glued CFRP sheets. Proceedings of the International Conference
on FRP Composites in Civil Engineering. Hong Kong, China.
Pellegrino, C., and Modena, C. (2002). Fiber Reinforced Polymer shear strengthening of
reinforced concrete beams with transverse steel reinforcement, Journal of
Composites for Construction, 6(2), 104–111.
Ritter, W. (1899). Die bauweise hennebique. Schweizerische Bauzeitung, 33(7) 59–61.
Robinson, J. R. and Demorieux, J. M. (1968). Essai de Traction-Compression sur Modeles
d'Ames de Poutre en Beton Arme. Compte Rendu Partiel I, U.T.I., Institut de
Recherches Appliquees du Beton Arme, Paris, France.
Sato, Y., Ueda, T., Kakuta, Y., and Tanaka, T. (1996). Shear reinforcing effect of carbon
fiber sheet attached to the side of reinforced concrete beams. Proceedings of the 3rd
International Conference on Advanced Composite Materials in Bridges and
Structures. Montreal, Canada.
Shima, H., Chou, L., and Okamura, H. (1987). Micro and macro models for bond in
reinforced concrete. Journal of Facture Engineering. 39(2), 133–194.
Sim, J., Kim, G., Park, C., and Ju, M. (2005). Shear strengthening effects with varying
types of FRP materials and strengthening methods. Proceedings of the 7th
International RILEM Symposium on Non-Metallic (FRP) Reinforcement for
Concrete Structures (FRPRCS-7). Kansas City, Missouri.
180
Somayaji, S., and Shah, S.P. (1981). Bond stress versus slip relationship and cracking
response of tension members. ACI Journal Proceedings, 78(3), 217–225.
Taerwe, L., Khalil, H., and Matthys, S. (1997). Behavior of rc beams strengthened in shear
by external cfrp sheets. Proceedings of the 3rd International RILEM Symposium on
Non-Metallic (FRP) Reinforcement for Concrete Structures (FRPRCS-3). Sapporo,
Japan.
Taljsten, B. (1997). Strengthening of concrete structures for shear with bonded CFRP
fabrics. Proceedings of the US-Canada-Europe Workshop on Bridge Engineering.
Zurich, Switzerland.
Tamai, S., Shima, H., Izumo, J. and Okamura, H. (1987). Average stress-strain relationship
in post yield range of steel bar in concrete. Concrete Library of JSCE, 11, 117-129.
Tastani, S. P., and Pantazopoulou, S. J. (2010). Direct tension pullout bond test:
experimental test. Journal of Structural Engineering, 136(6), 731–743.
Teng, J. G., Lam, L., and Chen J. F., (2004). Shear strengthening of RC beams with FRP
composites. Progress in Structural Engineering and Materials, 6(1), 173–184.
Triantafillou, T. C. (1997). Shear strengthening of concrete members using composites.
Proceedings of the 3rd International RILEM Symposium on Non-Metallic (FRP)
Reinforcement for Concrete Structures (FRPRCS-3). Sapporo, Japan.
Triantafillou, T. C. (1998), Shear strengthening of reinforced concrete beams using epoxy-
bonded FRP composites. ACI Structural Journal, 95(2), 107–115.
Triantafillou, T. C., and Antonopoulos, C. P. (2000). Design of concrete flexural members
strengthened in shear with FRP, Journal of Composites for Construction, 4(4), 198–
205.

181
Ueda, T., Yamaguchi, R., Shoji, K., and Sato, Y. (2002). Study on behavior in tension of
reinforced concrete members strengthened by carbon fiber sheet. Journal of
Composite for Construction, 6(3), 168–174.
Uji, K. (1992). Improving the shear capacity of existing reinforced concrete members by
applying carbon sheets. Transactions of the Japan Concrete Institute, 14(1). 253–266.
Umezu, K., Fujita, M., Nakai, H., and Tamaki, K. (1997). Shear behavior of RC beams
with aramid fiber sheet. Proceedings of the 3rd International RILEM Symposium on
Non-Metallic (FRP) Reinforcement for Concrete Structures (FRPRCS-3). Sapporo,
Japan.
Vecchio, F. J., and Collins, M. P. (1981). Stress-strain characteristic of reinforced concrete
in pure shear. Advanced Mechanics of Reinforced Concrete, Final Report,
International Association of Bridge and Structural Engineering, Zurich, Switzerland,
221–225.
Vecchio, F. J., and Collins, M. P. (1986). The Modified Compression-Field Theory for
reinforced concrete elements subjected to shear. ACI Structural Journal, 83(2), 219–
231.
Vecchio, F. J. (2000). Disturbed stress field model for reinforced concrete: formulation.
Journal of Structural Engineering. 126(9) 1070–1077.
Vecchio, F. J. (2001). Disturbed stress field model for reinforced concrete: Implementation.
Journal of Structural Engineering, 127(1) 12–20.
Wang, J., (2006). Constitutive relationships of prestressed concrete membrane elements
(Doctoral Thesis). Department of Civil and Environmental Engineering, University
of Houston, Houston, Texas.

182
Wu, H. Q., and Gilbert, R. I. (2008). An experimental study of tension stiffening in
reinforced concrete members under short term and long term loads, Report No. R-
449, University of New South Wales, Sydney, Australia.
Wu, H. Q., and Gilbert, R. I. (2009). Modelling short-term tension stiffening in reinforced
concrete prisms using a continuum-based finite element model. Engineering
Structures, 31(10), 2380–2391.
Zararis, P. D. (2003). Shear strength and minimum shear reinforcement of reinforced
concrete slender beams. ACI Structural Journal, 100(2), 203–214.
Zhang, L. X., and Hsu, T. T. C. (1998). Behavior and analysis of 100-MPa concrete
membrane elements. Journal of Structural Engineering, 124(1), 24–34.
Zhang, Z., and Hsu, C. T. (2005). Shear strengthening of reinforced concrete beams using
Carbon-Fiber-Reinforced Polymer laminates, Journal of Composites for
Construction, 9(2), 158–169.
Zhu, R. R. H., and Hsu, T. T. C. (2002). Poisson effect in reinforced concrete membrane
elements. ACI Structural Journal, 99(5), 631–640.

183
APPENDIX I ANALYZED DATA OF TEST SPECIMENS

184
List of Notations
NH = average tensile load on the north side (kips/jack)
SH = average tensile load on the south side (kips/jack)
NV = average compressive load on the north side (kips/jack)
SV = average compressive load on the south side (kips/jack)
NH 1~2 = No. 1~2 horizontal LVDT readings on the north side
SH 1~2 = No. 1~2 horizontal LVDT readings on the south side
NH lvdt = Average of 4 horizontal LVDT readings on the north side
SH lvdt = Average of 4 horizontal LVDT readings on the south side
NV lvdt = Average of 4 vertical LVDT readings on the north side
SV lvdt = Average of 4 vertical LVDT readings on the south side
ND lvdt = Average of 2 diagonal LVDT readings on the north side
SD lvdt = Average of 2 diagonal LVDT readings on the south side

185
Group I
Uniaxial Tensile Test

186
Prism REF-R3
Casting Date: Dec. 01, 2013
Testing Date: Dec. 10, 2013
Materials:
Concrete
f’c=6,119 psi (1st batch: 6449psi; 2nd batch: 5,789 psi)
Steel Reinforcements
2 #3 rebar, s = 0.31%, fy = 66.5 ksi
FRP Reinforcements
No FRP

187
NH SH NH1 SH1
1 0.00 0.05 0.000000 0.000000
2 0.06 0.15 0.000083 0.000017
3 0.10 0.20 0.000017 0.000067
4 0.15 0.50 0.000035 0.000031
5 0.20 0.75 0.000017 0.000020
6 4.50 1.60 0.000013 0.000010
7 4.05 2.80 0.000013 0.000019
8 4.20 4.75 0.000010 0.000002
9 4.15 6.65 0.000050 0.000067
10 6.60 8.05 0.000033 0.000033
11 8.55 10.25 0.000052 0.000083
12 10.65 11.15 0.000079 0.000077
13 8.40 6.85 0.004850 0.003228
14 7.65 6.50 0.012434 0.009124
15 2.50 2.05 0.008465 0.008856
16 0.80 -1.25 0.005984 0.008106
17 1.65 0.50 0.006598 0.008290
18 3.75 2.75 0.007432 0.008606
19 6.35 4.85 0.008582 0.009058
20 8.10 5.50 0.009701 0.009455
21 9.15 6.70 0.010165 0.009855
22 9.05 7.25 0.011051 0.010654
23 10.35 6.75 0.012184 0.011753
24 10.25 6.90 0.013399 0.012835
25 11.85 6.90 0.014516 0.013953
26 11.20 6.25 0.015218 0.014650
27 6.70 4.85 0.016332 0.015684
28 10.10 5.90 0.017101 0.016498
29 12.35 11.15 0.017884 0.017397
30 11.90 11.15 0.018749 0.018331
31 12.05 10.60 0.019501 0.019112
32 11.70 11.55 0.020416 0.020030
33 12.15 12.30 0.021001 0.020677
34 8.00 10.05 0.017399 0.021445
35 5.45 6.35 0.015368 0.019497
Test Data_REF-R3

188
Prism REF-R4
Casting Date: Dec. 01, 2013
Testing Date: Dec. 09, 2013
Materials:
Concrete
f’c=6,119 psi (1st batch: 6449psi; 2nd batch: 5,789 psi)
Steel Reinforcements
2 #4 rebar, s = 0.55%, fy = 67.0 ksi
FRP Reinforcements
No FRP

189
NH SH NH1 SH1
1 0.00 0.00 0.000000 0.000000
2 0.40 0.30 0.000008 0.000035
3 3.15 4.90 0.000083 0.000033
4 7.45 8.60 0.000035 0.000031
5 9.20 9.40 0.000052 0.000031
6 10.90 11.00 0.000048 0.000033
7 11.15 12.80 0.000067 0.000085
8 13.10 9.40 0.001681 0.001265
9 11.15 9.60 0.001965 0.001848
10 3.00 2.50 0.000533 0.001332
11 6.20 4.20 0.000981 0.001201
12 5.20 4.40 0.000833 0.001165
13 7.55 6.30 0.001031 0.001415
14 9.65 8.30 0.001315 0.001715
15 11.25 10.20 0.001631 0.001850
16 13.35 11.50 0.001931 0.002164
17 14.85 10.80 0.002167 0.002416
18 15.15 13.20 0.002531 0.002797
19 16.65 14.90 0.003248 0.003363
20 16.60 15.20 0.003834 0.003929
21 16.65 15.40 0.004300 0.004412
22 17.05 16.40 0.005134 0.005128
23 17.20 16.80 0.005848 0.005944
24 18.05 16.20 0.006367 0.006460
25 18.35 17.10 0.007250 0.007193
26 18.45 16.40 0.008267 0.008108
27 18.75 17.70 0.009551 0.009341
28 20.30 17.50 0.011415 0.011039
29 19.40 16.50 0.013099 0.012639
30 19.35 17.90 0.014632 0.014055
31 18.90 18.30 0.016568 0.016000
32 19.60 19.00 0.018516 0.017751
33 19.65 17.60 0.020201 0.019547
34 19.85 18.70 0.021551 0.020912
35 13.80 14.30 0.020268 0.021331
Test Data_REF-R4

190
Prism REF-R5
Casting Date: Dec. 01, 2013
Testing Date: Jan. 07, 2013
Materials:
Concrete
f’c=6,119 psi (1st batch: 6449psi; 2nd batch: 5,789 psi)
Steel Reinforcements
2 #5 rebar, s = 0.87%, fy = 68.0 ksi
FRP Reinforcements
No FRP

191
NH SH NH1 SH1
1 0.00 0.00 0.000000 0.000001
2 0.55 0.15 0.000065 0.000035
3 6.20 8.30 0.000055 0.000065
4 8.50 13.60 0.000790 0.000086
5 8.80 7.25 0.001133 0.000098
6 1.35 1.55 0.000433 0.000266
7 1.65 1.35 0.000367 0.000298
8 3.85 3.90 0.000533 0.000381
9 3.25 1.55 0.000331 0.000081
10 0.52 0.13 0.000365 0.000081
11 0.85 0.60 0.000315 0.000114
12 12.30 13.70 0.000567 0.000583
13 13.20 14.00 0.000783 0.000785
14 15.65 17.90 0.001302 0.001101
15 18.45 20.45 0.001783 0.001548
16 21.45 19.30 0.002169 0.002233
17 19.10 22.15 0.002583 0.002550
18 20.55 22.50 0.003100 0.002916
19 21.20 22.95 0.003767 0.003863
20 21.45 22.45 0.004469 0.004364
21 22.70 23.80 0.005000 0.004964
22 23.10 24.15 0.005669 0.005644
23 23.45 23.75 0.006502 0.006427
24 23.40 22.65 0.007267 0.007143
25 24.00 23.25 0.008036 0.007961
26 24.10 23.70 0.008553 0.008527
27 22.80 23.75 0.010067 0.009923
28 23.55 24.30 0.011717 0.011522
29 24.10 25.40 0.013451 0.012904
30 25.05 24.65 0.015270 0.014454
31 25.55 24.80 0.017701 0.017052
32 26.50 25.00 0.021603 0.020848
33 26.20 26.95 0.025285 0.024827
34 30.55 24.85 0.029102 0.028690
35 2.95 4.15 0.027468 0.026525
Test Data_REF-R5
192
Prism S3-025-FA
Casting Date: Dec. 29, 2013
Testing Date: Jan. 04, 2014
Materials:
Concrete
f’c=6,699 psi (1st batch: 6,826 psi; 2nd batch: 6,572 psi)
Steel Reinforcements
2 #3 rebar, s = 0.31%, fy = 66.5 ksi
FRP Reinforcements
One layer with FRP anchor, f = 0.56%, fu = 120 ksi

193
NH SH NH1 SH1
1 0.00 0.00 0.000017 0.000004
2 0.05 1.65 0.000008 0.000014
3 4.25 6.00 0.000021 0.000013
4 6.45 9.85 0.000035 0.000021
5 9.20 10.85 0.000068 0.000031
6 10.90 12.60 0.000048 0.000043
7 11.15 13.30 0.000065 0.000091
8 13.10 10.55 0.001681 0.001265
9 11.15 17.40 0.001965 0.001848
10 3.00 9.45 0.000533 0.001332
11 6.20 10.90 0.000981 0.001201
12 5.20 12.15 0.000833 0.001165
13 7.55 11.55 0.001031 0.001415
14 9.65 14.95 0.001315 0.001715
15 11.25 17.30 0.001631 0.001850
16 13.35 18.45 0.001931 0.002164
17 14.85 16.80 0.002167 0.002416
18 15.15 21.40 0.002531 0.002797
19 16.65 22.75 0.003248 0.003363
20 16.60 23.40 0.003834 0.003929
21 16.65 23.10 0.004300 0.004412
22 17.05 24.25 0.005134 0.005128
23 17.20 25.00 0.005848 0.005944
24 18.05 22.80 0.006367 0.006460
25 18.35 24.20 0.007250 0.007193
26 18.45 23.10 0.008267 0.008108
27 18.75 25.30 0.009551 0.009341
28 20.30 24.70 0.011415 0.011039
29 19.40 19.90 0.013099 0.012639
30 19.35 24.80 0.014632 0.014055
31 18.90 24.40 0.016568 0.016000
32 19.60 24.70 0.018516 0.017751
33 19.65 25.90 0.020201 0.019547
34 19.85 24.55 0.021551 0.020912
35 13.80 21.40 0.020268 0.021331
Test Data_S3-025-FA

194
Prism S3-040-FA
Casting Date: Dec. 29, 2013
Testing Date: Jan. 07, 2014
Materials:
Concrete
f’c=6,699 psi (1st batch: 6,826 psi; 2nd batch: 6,572 psi)
Steel Reinforcements
2 #3 rebar, s = 0.31%, fy = 66.5 ksi
FRP Reinforcements
One layer with FRP anchor, f = 0.90%, fu = 105 ksi

195
NH SH NH1 SH1
1 0.00 0.00 0.000000 0.000000
2 0.38 0.25 0.000017 0.000015
3 1.25 0.85 0.000019 0.000015
4 2.36 1.52 0.000021 0.000017
5 4.30 3.25 0.000015 0.000033
6 7.10 8.25 0.000065 0.000069
7 10.60 7.90 0.000065 0.000067
8 14.10 12.45 0.000075 0.000073
9 17.75 15.00 0.000082 0.000067
10 14.70 13.25 0.001615 0.001996
11 6.50 5.35 0.000548 0.001498
12 6.00 3.55 0.000431 0.001032
13 5.15 3.65 0.000383 0.001199
14 7.65 5.35 0.000515 0.001249
15 8.60 6.00 0.000715 0.001297
16 11.30 6.60 0.000848 0.001265
17 12.70 7.70 0.001100 0.001299
18 13.60 9.50 0.001165 0.001397
19 14.40 10.10 0.001250 0.001397
20 16.45 11.25 0.001233 0.001665
21 15.35 11.50 0.001381 0.001715
22 17.65 12.70 0.001500 0.001946
23 19.00 14.00 0.001431 0.002115
24 14.95 14.15 0.001631 0.002314
25 20.35 15.75 0.001815 0.002595
26 20.60 17.80 0.002067 0.002728
27 21.80 18.70 0.002333 0.002962
28 25.50 19.40 0.002665 0.003213
29 25.90 19.45 0.002800 0.003397
30 26.15 21.90 0.003081 0.003711
31 28.55 22.80 0.003234 0.003844
32 0.85 -0.40 0.003000 0.004229
33 8.40 2.00 0.002931 0.004179
34 6.35 2.30 0.002965 0.004227
35 2.70 1.35 0.002998 0.004194
Test Data_S3-040-FA

196
Prism S4-025-FA
Casting Date: Apr. 15, 2014
Testing Date: Apr. 23, 2014
Materials:
Concrete
f’c=6,971 psi (1st batch: 6,810 psi; 2nd batch: 7,132 psi)
Steel Reinforcements
2 #4 rebar, s = 0.55%, fy = 67.0 ksi
FRP Reinforcements
One layer with FRP anchor, f = 0.56%, fu = 120 ksi

197
NH SH NH1 SH1
1 0.00 0.00 0.000000 0.000000
2 0.00 0.25 0.000003 0.000004
3 0.35 1.20 0.000012 0.000002
4 1.02 1.45 0.000019 0.000032
5 2.75 2.82 0.000029 0.000039
6 5.75 3.40 0.000041 0.000051
7 8.75 8.20 0.000066 0.000017
8 10.05 12.30 0.000056 0.000054
9 13.75 11.10 0.000081 0.000073
10 12.80 14.10 0.000153 0.000330
11 7.75 9.95 0.000068 0.000379
12 4.25 4.60 0.000082 0.000172
13 2.90 0.00 0.000100 -0.000017
14 12.15 13.50 0.000578 0.000519
15 8.95 10.95 0.000374 0.000588
16 7.00 9.25 0.000238 0.000500
17 9.75 11.70 0.000136 0.000709
18 12.30 14.15 0.000170 0.000828
19 13.25 15.75 0.000323 0.000897
20 15.65 17.00 0.000372 0.001086
21 16.85 17.85 0.000510 0.001069
22 16.65 16.45 0.000882 0.001138
23 18.95 18.45 0.001020 0.001241
24 19.45 18.25 0.001222 0.001345
25 19.25 19.20 0.001394 0.001535
26 20.05 20.95 0.001477 0.001744
27 20.90 21.35 0.001513 0.001862
28 21.30 21.55 0.001664 0.002054
29 21.95 21.85 0.001868 0.002106
30 22.90 23.90 0.002329 0.002330
31 23.70 24.15 0.002564 0.002431
32 23.25 24.20 0.002581 0.002623
33 24.70 24.90 0.002751 0.002690
34 24.50 26.40 0.002974 0.002897
35 23.95 17.75 0.003312 0.003362
Test Data_S4-025-FA

198
Prism S4-040-FA
Casting Date: Dec. 29, 2013
Testing Date: Jan. 14, 2014
Materials:
Concrete
f’c=6,699 psi (1st batch: 6,826 psi; 2nd batch: 6,572 psi)
Steel Reinforcements
2 #4 rebar, s = 0.55%, fy = 67.0 ksi
FRP Reinforcements
One layer with FRP anchor, f = 0.90%, fu = 105 ksi

199
NH SH NH1 SH1
1 0.00 0.00 0.000000 0.000004
2 0.20 0.21 0.000002 0.000001
3 0.15 0.31 0.000010 0.000016
4 0.63 0.89 0.000012 0.000018
5 2.10 3.40 0.000026 0.000039
6 2.25 2.55 0.000031 0.000041
7 5.25 9.70 0.000050 0.000048
8 7.55 11.75 0.000055 0.000048
9 10.05 11.80 0.000052 0.000047
10 10.85 14.20 0.000068 0.000047
11 12.95 16.75 0.000076 0.000057
12 14.90 16.75 0.000083 0.000069
13 17.15 18.35 0.000467 0.000050
14 4.60 12.35 0.000283 0.000050
15 0.40 6.95 0.000152 0.000133
16 3.30 9.65 0.000533 0.000183
17 1.55 7.10 0.000450 0.000266
18 1.60 6.10 0.000435 0.000183
19 2.55 7.60 0.000433 0.000248
20 4.00 10.45 0.000417 0.000266
21 9.50 12.45 0.000500 0.000350
22 10.20 12.85 0.000533 0.000431
23 11.00 15.65 0.000619 0.000581
24 15.00 17.00 0.000733 0.000714
25 13.00 14.45 0.000850 0.000882
26 11.35 13.45 0.000985 0.000997
27 14.30 16.35 0.001100 0.001130
28 15.15 8.85 0.001302 0.001513
29 20.10 18.60 0.001652 0.001632
30 20.15 18.65 0.001900 0.001896
31 22.45 19.65 0.002100 0.002062
32 23.40 21.45 0.002300 0.002262
33 26.20 24.70 0.002536 0.002514
34 22.20 24.95 0.002700 0.002745
35 17.50 18.25 0.002817 0.002947
Test Data_S4-040-FA

200
Prism S4-025-FW
Casting Date: Dec. 1, 2013
Testing Date: Dec 12, 2013
Materials:
Concrete
f’c=6,119 psi (1st batch: 6449psi; 2nd batch: 5,789 psi)
Steel Reinforcements
2 #4 rebar, s = 0.55%, fy = 67.0 ksi
FRP Reinforcements
One layer with Fully Wrap method, f = 0.56%, fu = 120 ksi

201
NH SH NH1 SH1
1 0.00 0.13 0.000000 0.000003
2 0.53 0.35 0.000019 0.000000
3 1.10 0.69 0.000005 0.000053
4 2.60 1.15 0.000100 0.000015
5 5.30 3.10 0.000017 0.000098
6 9.35 6.60 0.000041 0.000065
7 13.20 6.30 0.000052 0.000091
8 13.35 9.60 0.000085 0.000100
9 8.50 5.20 0.000202 0.000233
10 3.60 3.10 0.000150 0.000098
11 7.25 5.10 0.000433 0.000233
12 8.40 9.30 0.000435 0.000283
13 8.75 8.30 0.000350 0.000481
14 8.70 9.55 0.000285 0.000549
15 12.40 12.20 0.000383 0.000664
16 12.50 12.50 0.000602 0.000714
17 14.10 14.00 0.000850 0.000749
18 18.55 17.45 0.001133 0.001163
19 17.50 18.45 0.001483 0.001432
20 19.75 21.90 0.001819 0.001732
21 21.85 25.10 0.001983 0.002046
22 24.10 26.25 0.002252 0.002364
23 23.35 28.25 0.002619 0.002762
24 18.55 20.85 0.003167 0.003328
25 19.60 22.00 0.003667 0.003744
26 24.90 31.10 0.004067 0.003994
27 23.85 31.95 0.004502 0.004427
28 25.10 32.10 0.004884 0.004729
29 21.60 17.50 0.005517 0.005459
30 25.15 21.15 0.006017 0.006009
31 26.65 23.00 0.006484 0.006394
32 22.15 16.20 0.006686 0.006793
33 3.75 -0.05 0.006000 0.005859
34 -6.20 -10.50 0.005384 0.004543
35 -2.45 -6.45 0.005417 0.004495
Test Data_S4-025-FW

202
Prism S4-040-FW
Casting Date: Apr. 15, 2014
Testing Date: May. 05, 2014
Materials:
Concrete
f’c=6,971 psi (1st batch: 6,810 psi; 2nd batch: 7,132 psi)
Steel Reinforcements
2 #4 rebar, s = 0.55%, fy = 67.0 ksi
FRP Reinforcements
One layer with Fully Wrap method, f = 0.90%, fu = 105 ksi

203
NH SH NH1 SH1
1 0.00 0.00 0.000000 0.000010
2 0.75 0.36 0.000013 0.000019
3 1.00 3.12 0.000026 0.000037
4 3.55 5.70 0.000032 0.000050
5 5.35 10.25 0.000070 0.000123
6 6.15 9.60 0.000061 0.000066
7 1.60 1.30 0.000014 0.000035
8 10.80 9.15 0.000304 0.000466
9 6.80 7.60 0.000083 0.000399
10 6.35 7.10 0.000083 0.000466
11 10.20 9.60 0.000100 0.000074
12 12.30 12.50 0.000100 0.000535
13 10.60 10.60 0.000202 0.000623
14 13.30 12.95 0.000423 0.000675
15 15.75 15.15 0.000712 0.000916
16 17.30 17.45 0.001137 0.001485
17 18.65 18.00 0.001545 0.001793
18 22.75 21.35 0.001986 0.002259
19 22.35 22.20 0.002343 0.002606
20 21.35 23.45 0.002734 0.003106
21 22.95 23.50 0.003229 0.003690
22 26.80 26.85 0.003669 0.004104
23 22.45 25.15 0.004162 0.004759
24 29.10 28.85 0.004621 0.005175
25 31.55 31.30 0.005286 0.005776
26 27.05 29.60 0.005811 0.006380
27 -2.85 2.90 0.006289 0.006983
28 27.90 31.40 0.006729 0.007434
29 28.55 33.45 0.007323 0.008052
30 25.85 29.15 0.008258 0.008742
31 31.45 36.30 0.008870 0.009604
32 30.60 34.55 0.009890 0.010692
33 27.30 23.90 0.010878 0.011846
34 33.85 29.15 0.012473 0.013434
35 16.45 19.75 0.013699 0.014158
Test Data_S4-040-FW

204
Prism S4-025-SB
Casting Date: Dec. 01, 2013
Testing Date: Dec. 11, 2013
Materials:
Concrete
f’c=6,119 psi (1st batch: 6449psi; 2nd batch: 5,789 psi)
Steel Reinforcements
2 #4 rebar, s = 0.55%, fy = 67.0 ksi
FRP Reinforcements
One layer with Side Bond method, f = 0.56%, fu = 120 ksi

205
NH SH NH1 SH1
1 0.00 0.00 0.000003 0.000005
2 0.58 0.17 0.000010 0.000010
3 0.82 1.10 0.000031 0.000017
4 1.90 2.50 0.000038 0.000017
5 3.30 5.80 0.000031 0.000048
6 5.10 7.20 0.000051 0.000051
7 9.00 12.00 0.000065 0.000081
8 5.20 6.40 0.000200 0.000350
9 0.10 2.50 0.000031 0.000248
10 8.00 6.30 0.000548 0.000181
11 0.10 0.90 0.000165 0.000133
12 0.40 1.40 0.000081 0.000150
13 1.40 1.80 0.000033 0.000117
14 2.10 2.90 0.000035 0.000348
15 1.90 3.50 0.000002 0.000283
16 2.10 6.10 0.000065 0.000400
17 3.80 7.30 0.000133 0.000283
18 5.60 7.30 0.000300 0.000248
19 3.70 6.90 0.000367 0.000431
20 6.60 10.60 0.000350 0.000647
21 8.10 9.90 0.000481 0.000714
22 7.70 10.20 0.000665 0.000882
23 8.20 13.20 0.000898 0.000997
24 10.20 10.50 0.001081 0.001182
25 10.00 11.60 0.001267 0.001330
26 12.50 12.40 0.001517 0.001563
27 13.20 13.60 0.001715 0.001696
28 14.80 15.50 0.002031 0.001981
29 15.40 16.90 0.002315 0.002331
30 16.90 17.20 0.002717 0.002564
31 18.10 18.00 0.002867 0.002814
32 18.90 18.50 0.003248 0.003130
33 20.20 19.10 0.003565 0.003478
34 14.30 17.80 0.003884 0.003827
35 -0.50 -6.80 0.004248 0.003644
Test Data_S4-025-SB

206
Prism S4-040-SB
Casting Date: Apr. 15, 2014
Testing Date: Apr. 30, 2014
Materials:
Concrete
f’c=6,971 psi (1st batch: 6,810 psi; 2nd batch: 7,132 psi)
Steel Reinforcements
2 #4 rebar, s = 0.55%, fy = 67.0 ksi
FRP Reinforcements
One layer with Side Bond method, f = 0.90%, fu = 105 ksi

207
NH SH NH1 SH1
1 0.10 0.20 0.000000 0.000002
2 0.22 0.35 0.000015 0.000002
3 1.25 1.40 0.000053 0.000017
4 3.30 1.80 0.000034 0.000067
5 3.75 2.25 0.000034 0.000053
6 7.10 5.05 0.000042 0.000063
7 8.25 6.80 0.000057 0.000052
8 9.45 7.90 0.000062 0.000069
9 11.05 10.60 0.000063 0.000069
10 13.75 12.35 0.000074 0.000081
11 11.20 10.00 0.000374 0.000241
12 9.20 4.45 0.000355 0.000071
13 2.20 1.35 0.000236 0.000103
14 7.25 7.90 0.000204 0.000276
15 3.75 6.10 0.000219 0.000226
16 5.10 5.50 0.000202 0.000172
17 5.60 5.80 0.000151 0.000175
18 7.40 5.85 0.000204 0.000209
19 9.55 10.55 0.000236 0.000278
20 11.50 12.30 0.000253 0.000313
21 13.45 13.40 0.000372 0.000364
22 13.00 14.40 0.000389 0.000433
23 16.90 14.65 0.000406 0.000450
24 8.65 11.40 0.000440 0.000552
25 13.15 13.55 0.000510 0.000554
26 13.75 13.55 0.000593 0.000672
27 15.90 15.35 0.000729 0.000690
28 16.40 15.50 0.000763 0.000830
29 18.00 17.80 0.000865 0.000914
30 17.90 17.75 0.000899 0.000966
31 18.85 18.40 0.001054 0.001052
32 18.95 19.40 0.001154 0.001140
33 20.20 19.10 0.001156 0.001259
34 15.80 17.40 0.001428 0.001724
35 -3.00 -4.55 0.001103 0.001172
Test Data_S4-040-SB

208
Prism S5-025-FA
Casting Date: Dec. 29, 2013
Testing Date: Jan. 08, 2014
Materials:
Concrete
f’c=6,699 psi (1st batch: 6,826 psi; 2nd batch: 6,572 psi)
Steel Reinforcements
2 #5 rebar, s = 0.87%, fy = 68.0 ksi
FRP Reinforcements
One layer with FRP anchor, f = 0.56%, fu = 120 ksi

209
NH SH NH1 SH1
1 0.08 0.00 0.000000 0.000003
2 1.52 0.85 0.000023 0.000006
3 1.89 1.53 0.000019 0.000010
4 2.85 1.96 0.000029 0.000050
5 3.65 4.75 0.000063 0.000062
6 4.50 9.40 0.000079 0.000063
7 5.95 11.55 0.000064 0.000083
8 10.05 14.40 0.000069 0.000091
9 14.05 15.85 0.000083 0.000089
10 16.35 15.80 0.000515 0.000314
11 4.90 7.40 0.000200 0.000283
12 13.40 13.90 0.000483 0.000566
13 8.05 10.15 0.000283 0.000499
14 9.40 13.20 0.000183 0.000547
15 9.30 12.85 0.000215 0.000549
16 11.90 14.95 0.000181 0.000566
17 12.40 16.70 0.000283 0.000633
18 14.60 17.30 0.000367 0.000699
19 10.10 11.70 0.000481 0.000683
20 13.75 14.55 0.000633 0.000783
21 17.05 17.65 0.000731 0.000799
22 18.25 18.60 0.001081 0.001014
23 18.85 19.55 0.001150 0.001197
24 21.15 22.55 0.001298 0.001415
25 26.40 26.85 0.001531 0.001563
26 27.65 29.65 0.001648 0.001848
27 28.60 31.25 0.001915 0.002048
28 29.65 32.00 0.002165 0.002212
29 31.00 33.00 0.002365 0.002495
30 32.05 33.65 0.002667 0.002695
31 33.85 35.75 0.002934 0.002978
32 31.45 33.85 0.003184 0.003280
33 33.75 37.05 0.003434 0.003528
34 24.25 27.65 0.003665 0.003777
35 18.05 18.55 0.003217 0.002962
Test Data_S5-025-FA

210
Prism S5-040-FA
Casting Date: Apr. 15, 2014
Testing Date: May. 13, 2014
Materials:
Concrete
f’c=6,971 psi (1st batch: 6,810 psi; 2nd batch: 7,132 psi)
Steel Reinforcements
2 #5 rebar, s = 0.87%, fy = 68.0 ksi
FRP Reinforcements
One layer with FRP anchor, f = 0.90%, fu = 105 ksi

211
NH SH NH1 SH1
1 0.07 0.00 0.000003 0.000002
2 1.18 1.07 0.000029 0.000020
3 2.25 2.53 0.000026 0.000029
4 3.08 3.62 0.000031 0.000033
5 3.58 4.32 0.000033 0.000039
6 8.14 8.80 0.000053 0.000069
7 14.30 10.56 0.000088 0.000077
8 8.86 8.47 0.000272 0.000261
9 3.69 3.74 0.000000 0.000244
10 15.40 9.35 0.000442 0.000244
11 8.53 4.73 0.000289 0.000328
12 11.61 10.01 0.000240 0.000330
13 10.34 10.23 0.000306 0.000362
14 12.76 13.48 0.000323 0.000414
15 14.25 13.42 0.000323 0.000468
16 6.93 17.00 0.000493 0.000588
17 12.27 10.12 0.000682 0.000810
18 14.41 11.00 0.000631 0.000847
19 17.55 15.62 0.000699 0.000916
20 19.80 18.15 0.000969 0.001175
21 21.40 19.53 0.001107 0.001364
22 20.08 19.31 0.001411 0.001657
23 23.60 21.01 0.001736 0.001916
24 24.53 22.99 0.001974 0.002155
25 25.08 26.40 0.002195 0.002483
26 29.43 29.54 0.002448 0.002709
27 31.68 32.40 0.002773 0.002983
28 40.10 33.00 0.003008 0.003207
29 41.20 34.32 0.003246 0.003655
30 43.56 37.24 0.003586 0.004054
31 46.42 37.24 0.003843 0.004207
32 42.68 34.43 0.004115 0.004569
33 44.83 35.97 0.004455 0.004845
34 46.64 36.30 0.004759 0.005140
35 28.82 17.88 0.004997 0.005089
Test Data_S5-040-FA

212
Group II
Softening Test

213
Panel F2P-5
Casting Date: Oct. 04, 2012
Testing Date: Apr. 25, 2012
Materials:
Concrete
f’c=5,471 psi (1st batch: 5,587 psi; 2nd batch: 5,355psi)
Steel Reinforcements
Horizontal direction : #4 rebar, s = 0.51%, fy = 67.0ksi
Vertical direction : #4 rebar, s = 0.51%, fy = 67.0 ksi
FRP Reinforcements
One layer with Fully Wrap method, f = 0.83%, fu = 105 ksi
Target Tensile Strain:
1 = 0.0025

214
NV SV NH SH NV lvdt SV lvdt NH lvdt SH lvdt
1 -0.11 -0.08 -0.67 -0.17 0.000021 0.000002 -0.000021 -0.000065
2 -2.41 -3.10 -0.75 4.08 0.000310 -0.000079 -0.000251 0.000236
3 -2.83 -3.32 4.19 9.50 0.000403 -0.000086 -0.000300 0.000679
4 -2.54 -3.07 4.11 9.54 0.000439 -0.000089 -0.000235 0.000619
5 -2.54 -3.11 10.06 11.04 0.000436 -0.000092 0.000002 0.000743
6 -2.70 -3.32 12.58 15.17 0.000464 -0.000097 0.000116 0.000872
7 -2.51 -3.03 15.69 16.00 0.000504 -0.000099 0.000152 0.001077
8 -2.58 -3.05 18.00 18.63 0.000515 -0.000101 0.000307 0.001130
9 -2.53 -2.97 20.03 20.58 0.000550 -0.000107 0.000422 0.001436
10 -2.45 -2.93 22.81 23.04 0.000593 -0.000094 0.000737 0.001512
11 -2.60 -3.04 24.92 25.46 0.000668 -0.000097 0.000892 0.001617
12 -2.64 -3.08 27.47 26.71 0.000746 -0.000089 0.001063 0.001937
13 -2.66 -3.25 29.78 29.63 0.000820 -0.000084 0.001295 0.001960
14 -2.62 -3.14 31.39 31.13 0.000834 -0.000070 0.001408 0.002130
15 -2.66 -3.20 31.42 29.54 0.000876 -0.000069 0.001442 0.002169
16 -2.70 -3.25 30.58 30.63 0.000920 -0.000066 0.001494 0.002118
17 -2.92 -3.59 31.31 30.13 0.000924 -0.000068 0.001606 0.002183
18 -2.83 -3.35 31.61 30.71 0.000973 -0.000069 0.001534 0.002143
19 -4.84 -5.74 31.64 30.79 0.000939 -0.000113 0.001555 0.002158
20 -19.81 -22.14 31.17 30.04 0.000831 -0.000373 0.001542 0.002195
21 -36.47 -38.19 35.17 30.54 0.000501 -0.000533 0.001697 0.002141
22 -52.30 -53.73 33.61 30.71 0.000154 -0.000643 0.001821 0.002194
23 -64.74 -65.82 32.14 29.75 -0.000050 -0.000734 0.001813 0.002283
24 -73.31 -74.52 35.06 31.83 -0.000239 -0.000807 0.002024 0.002285
25 -85.38 -86.65 32.25 28.54 -0.000321 -0.000881 0.002011 0.002399
26 -97.60 -98.55 31.53 26.00 -0.000473 -0.000966 0.002110 0.002235
27 -109.55 -110.38 28.28 22.33 -0.000683 -0.001040 0.002048 0.002284
28 -122.10 -122.18 24.25 18.50 -0.000779 -0.001129 0.002011 0.002352
29 -131.61 -131.49 22.64 19.42 -0.000880 -0.001186 0.002152 0.002338
30 -139.04 -138.34 14.42 14.17 -0.000930 -0.001243 0.001889 0.002430
31 -146.64 -146.35 17.64 16.54 -0.000989 -0.001312 0.002008 0.002430
32 -154.75 -153.86 17.39 15.17 -0.001055 -0.001375 0.002072 0.002313
33 -163.21 -162.06 13.17 12.88 -0.001163 -0.001439 0.002153 0.002304
34 -171.22 -169.51 10.72 12.33 -0.001320 -0.001502 0.002112 0.002430
35 -180.05 -177.44 1.31 6.38 -0.001416 -0.001561 0.002201 0.002481

215
Panel F2P-6
Casting Date: May. 23, 2012
Testing Date: Jun. 18, 2012
Materials:
Concrete
f’c=6,237 psi (1st batch: 6,888 psi; 2nd batch: 5,586 psi)
Steel Reinforcements
Horizontal direction : #4 rebar, s = 0.51%, fy = 67.0ksi
Vertical direction : #4 rebar, s = 0.51%, fy = 67.0 ksi
FRP Reinforcements
One layer with Fully Wrap method, f = 0.83%, fu = 105 ksi
Target Tensile Strain:
1 = 0.0055

216
NV SV NH SH NV lvdt SV lvdt NH lvdt SH lvdt
1 3.55 -0.28 0.43 0.00 -0.000025 0.000010 0.000000 0.000052
2 0.57 -3.17 -1.25 0.00 0.000133 -0.000038 0.000000 0.000114
3 0.77 -3.03 -0.70 0.00 0.000148 -0.000048 0.000000 0.000059
4 1.21 -2.49 5.98 3.16 0.000165 -0.000052 0.000368 0.000358
5 0.31 -2.75 10.43 6.76 0.000184 -0.000043 0.000846 0.000877
6 0.46 -2.73 12.53 8.30 0.000201 -0.000042 0.001276 0.001270
7 -0.18 -2.46 16.67 12.74 0.000238 -0.000041 0.001660 0.001710
8 -0.17 -3.14 17.08 13.50 0.000280 -0.000037 0.002105 0.002107
9 -0.66 -3.54 21.35 18.42 0.000337 -0.000048 0.002520 0.002684
10 -1.14 -3.83 25.28 20.68 0.000395 -0.000049 0.002954 0.003160
11 -0.97 -3.61 27.63 22.96 0.000423 -0.000046 0.003383 0.003539
12 -0.99 -3.74 29.45 24.78 0.000454 -0.000035 0.003695 0.003791
13 -0.97 -2.82 31.78 26.32 0.000504 -0.000039 0.003984 0.004117
14 -1.96 -3.04 32.58 27.94 0.000522 -0.000031 0.004335 0.004484
15 -1.63 -3.17 32.87 27.04 0.000550 -0.000023 0.004694 0.004757
16 -9.24 -13.86 32.55 27.50 0.000564 -0.000139 0.004685 0.004871
17 -14.94 -21.91 31.72 27.46 0.000679 -0.000244 0.004706 0.004872
18 -25.92 -32.80 32.08 27.02 0.000619 -0.000351 0.004693 0.004828
19 -36.96 -43.34 32.28 26.82 0.000439 -0.000440 0.004654 0.004845
20 -47.63 -53.92 32.55 26.06 0.000352 -0.000519 0.004647 0.004829
21 -58.37 -64.68 31.37 24.38 0.000232 -0.000610 0.004653 0.004899
22 -65.58 -72.69 31.43 25.98 0.000116 -0.000661 0.004738 0.004933
23 -75.06 -82.04 31.07 22.52 -0.000009 -0.000741 0.004997 0.005041
24 -82.21 -91.48 31.30 20.26 -0.000015 -0.000812 0.005258 0.005025
25 -93.65 -102.15 30.37 20.32 -0.000076 -0.000902 0.005244 0.005041
26 -103.91 -112.33 30.82 18.92 -0.000111 -0.000995 0.005308 0.005023
27 -114.46 -122.16 28.95 21.46 -0.000202 -0.001082 0.005316 0.005077
28 -120.85 -127.99 28.13 20.86 -0.000287 -0.001122 0.005368 0.005014
29 -127.60 -132.72 27.55 15.62 -0.000452 -0.001148 0.005320 0.005034
30 -135.17 -137.61 27.33 15.96 -0.000648 -0.001175 0.005385 0.005050
31 -141.64 -142.32 27.02 15.52 -0.000814 -0.001197 0.005421 0.005085
32 -148.50 -147.07 27.25 15.76 -0.000985 -0.001200 0.005410 0.005068
33 -155.80 -152.46 27.08 18.10 -0.001151 -0.001224 0.005527 0.005164
34 -162.07 -156.70 25.67 16.24 -0.001245 -0.001228 0.005637 0.005171
35 -165.70 -156.15 18.75 10.44 -0.001407 -0.001691 0.005820 0.005230

217
Panel F2P-7
Casting Date: Jun. 10, 2012
Testing Date: Aug. 21, 2012
Materials:
Concrete
f’c=5,742 psi (1st batch: 5549 psi; 2nd batch: 5,935 psi)
Steel Reinforcements
Horizontal direction : #4 rebar, s = 0.51%, fy = 67.0ksi
Vertical direction : #4 rebar, s = 0.51%, fy = 67.0 ksi
FRP Reinforcements
One layer with Fully Wrap method, f = 0.83%, fu = 105 ksi
Target Tensile Strain:
1 = 0.0075

218
NV SV NH SH NV lvdt SV lvdt NH lvdt SH lvdt
1 -0.96 -0.01 0.44 0.35 0.000019 0.000002 0.000015 0.000025
2 -2.54 -2.34 1.03 0.36 0.000276 -0.000071 0.000013 0.000044
3 -3.01 -2.59 2.02 2.35 0.000359 -0.000078 0.000236 0.000073
4 -2.83 -2.47 6.12 3.74 0.000391 -0.000080 0.000497 0.000520
5 -2.61 -2.45 10.68 8.00 0.000389 -0.000082 0.001119 0.001249
6 -2.81 -2.66 12.83 9.82 0.000414 -0.000087 0.001678 0.001802
7 -2.47 -2.44 17.06 15.08 0.000449 -0.000089 0.002176 0.002419
8 -2.54 -2.30 17.48 15.98 0.000459 -0.000091 0.002755 0.002977
9 -2.37 -2.12 21.85 21.80 0.000490 -0.000096 0.003295 0.003788
10 -2.18 -2.01 25.87 24.47 0.000528 -0.000085 0.003859 0.004456
11 -2.37 -2.17 28.28 27.17 0.000595 -0.000088 0.004416 0.004989
12 -2.41 -2.18 30.14 29.32 0.000665 -0.000080 0.004822 0.005343
13 -2.42 -2.57 32.53 31.15 0.000731 -0.000076 0.005198 0.005800
14 -2.15 -2.41 33.34 33.06 0.000743 -0.000063 0.005654 0.006317
15 -2.27 -2.44 33.63 32.00 0.000781 -0.000062 0.006121 0.006700
16 -0.48 0.08 33.31 32.54 0.000820 -0.000060 0.006109 0.006861
17 0.67 1.67 32.46 32.49 0.000824 -0.000061 0.006136 0.006861
18 3.40 4.52 32.83 31.97 0.000867 -0.000062 0.006119 0.006799
19 4.03 4.66 33.04 31.74 0.000837 -0.000102 0.006069 0.006824
20 -8.38 -9.20 33.31 30.84 0.000741 -0.000335 0.006060 0.006801
21 -22.46 -22.67 32.10 28.85 0.000447 -0.000479 0.006067 0.006900
22 -36.56 -36.28 32.17 30.74 0.000137 -0.000578 0.006178 0.006948
23 -46.72 -46.13 31.79 26.65 -0.000045 -0.000660 0.006515 0.007099
24 -53.58 -52.56 32.03 23.97 -0.000213 -0.000727 0.006853 0.007076
25 -62.90 -62.13 31.08 24.05 -0.000286 -0.000793 0.006835 0.007098
26 -72.66 -71.59 31.54 22.39 -0.000421 -0.000870 0.006919 0.007073
27 -82.08 -81.06 29.63 25.39 -0.000609 -0.000936 0.006929 0.007149
28 -93.10 -91.46 28.79 24.68 -0.000694 -0.001016 0.006996 0.007061
29 -100.98 -99.64 28.19 18.48 -0.000785 -0.001067 0.006935 0.007088
30 -106.60 -105.31 27.97 18.89 -0.000829 -0.001118 0.007019 0.007111
31 -112.65 -112.19 27.65 18.37 -0.000882 -0.001180 0.007065 0.007161
32 -119.11 -118.56 27.89 18.65 -0.000941 -0.001237 0.007051 0.007136
33 -125.82 -125.47 27.72 21.42 -0.001037 -0.001295 0.007204 0.007272
34 -132.32 -131.90 26.27 19.22 -0.001177 -0.001352 0.007347 0.007282
35 -140.28 -139.97 19.19 12.35 -0.001263 -0.001405 0.007585 0.007364

219
Group III
Modified Hsu/Zhu Ratio Test

220
Panel PR-025
Casting Date: Jul. 24, 2014
Testing Date: Aug. 05, 2014
Materials:
Concrete
f’c=5,934 psi (1st batch: 5,677 psi; 2nd batch: 6,191 psi)
Steel Reinforcements
Horizontal direction : #4 rebar, s = 0.51%, fy = 67.0ksi
Vertical direction : #4 rebar, s = 0.51%, fy = 67.0 ksi
FRP Reinforcements
One layer with Fully Wrap method, f = 0.52%, fu = 120 ksi
221
V H V lvdt H lvdt
1 -0.54 -0.02 0.000009 -0.000037
2 -2.76 -3.50 -0.000004 -0.000136
3 -2.29 -3.13 0.000004 -0.000113
4 -1.81 -2.96 -0.000003 -0.000096
5 -1.88 -2.66 0.000003 -0.000078
6 -2.06 -1.96 0.000005 -0.000119
7 -1.99 -1.26 0.000002 -0.000087
8 -1.86 -1.06 -0.000009 -0.000104
9 -1.75 -0.81 -0.000010 -0.000092
10 -1.47 0.22 -0.000001 -0.000042
11 -1.35 0.62 -0.000004 -0.000086
12 -1.86 2.10 -0.000016 -0.000013
13 -1.37 3.07 -0.000012 0.000028
14 -1.58 3.23 -0.000017 -0.000012
15 -1.79 3.57 -0.000018 -0.000016
16 -2.50 3.33 -0.000020 -0.000008
17 -2.99 3.19 -0.000021 -0.000012
18 -2.83 3.58 -0.000024 -0.000034
19 -3.75 3.21 -0.000037 -0.000012
20 -6.17 2.51 -0.000054 -0.000012
21 -7.16 2.57 -0.000068 -0.000038
22 -8.18 2.43 -0.000086 -0.000011
23 -8.08 2.72 -0.000088 -0.000002
24 -8.48 2.85 -0.000081 0.000001
25 -9.39 2.61 -0.000081 0.000022
26 -9.07 2.68 -0.000085 0.000008
V H V lvdt H lvdt
27 -9.25 2.79 -0.000090 -0.000003
28 -9.60 2.50 -0.000086 -0.000026
29 -9.84 2.71 -0.000084 0.000011
30 -10.05 2.97 -0.000089 0.000012
31 -9.67 3.50 -0.000096 -0.000003
32 -9.95 3.59 -0.000087 0.000034
33 -9.37 4.77 -0.000093 0.000010
34 -9.51 5.19 -0.000092 0.000013
35 -10.04 5.22 -0.000101 0.000039
36 -9.68 5.76 -0.000108 0.000299
37 -10.15 6.45 -0.000095 0.000613
38 -10.08 6.94 -0.000102 0.000698
39 -10.35 8.00 -0.000095 0.000722
40 -10.13 8.46 -0.000097 0.000718
41 -9.94 8.79 -0.000093 0.000698
42 -10.08 8.93 -0.000111 0.000762
43 -10.18 8.89 -0.000106 0.000750
44 -10.23 8.23 -0.000087 0.000791
45 -10.16 9.23 -0.000100 0.000735
46 -10.37 9.03 -0.000101 0.000743
47 -10.25 9.13 -0.000105 0.000748
48 -11.07 8.84 -0.000104 0.000789
49 -11.45 8.90 -0.000113 0.000786
50 -12.31 8.54 -0.000121 0.000765
51 -12.79 8.95 -0.000122 0.000716

222
Panel PR-040
Casting Date: Jul. 13, 2014
Testing Date: Jul. 22, 2014
Materials:
Concrete
f’c=5,334 psi (1st batch: 5,000 psi; 2nd batch: 5,668 psi)
Steel Reinforcements
Horizontal direction : #4 rebar, s = 0.51%, fy = 67.0ksi
Vertical direction : #4 rebar, s = 0.51%, fy = 67.0 ksi
FRP Reinforcements
One layer with Fully Wrap method, f = 0.83%, fu = 105 ksi

223
V H V lvdt H lvdt
1 -0.54 -0.02 0.000009 -0.000037
2 -3.38 -3.53 0.000014 -0.000094
3 -3.20 -1.73 -0.000001 -0.000058
4 -3.47 0.89 -0.000012 -0.000018
5 -3.87 3.64 -0.000005 0.000045
6 -3.86 4.19 -0.000021 0.000039
7 -5.45 3.84 -0.000043 0.000039
8 -7.01 3.90 -0.000065 0.000029
9 -7.36 4.01 -0.000062 -0.000007
10 -7.36 7.08 -0.000057 0.000061
11 -7.11 8.28 -0.000073 0.000037
12 -8.87 8.59 -0.000091 0.000071
13 -11.31 9.50 -0.000109 0.000129
14 -11.26 12.65 -0.000124 0.001277
15 -11.09 14.31 -0.000140 0.002715
16 -14.30 14.05 -0.000163 0.002772
17 -16.19 13.71 -0.000173 0.002789
18 -16.53 16.45 -0.000180 0.003822
19 -16.80 16.76 -0.000193 0.004048
20 -16.86 17.18 -0.000197 0.004046
21 -17.64 17.06 -0.000209 0.004223
22 -19.02 16.92 -0.000222 0.004278
23 -19.90 17.42 -0.000227 0.004382
24 -19.96 18.28 -0.000226 0.004792
25 -20.84 19.32 -0.000244 0.004998
26 -21.47 19.09 -0.000256 0.005102
V H V lvdt H lvdt
27 -21.83 20.41 -0.000277 0.005339
28 -22.13 21.35 -0.000281 0.006073
29 -23.63 21.56 -0.000296 0.006351
30 -23.73 21.74 -0.000305 0.006456
31 -23.70 23.15 -0.000304 0.007338
32 -25.09 23.29 -0.000320 0.007573
33 -25.63 23.96 -0.000332 0.007961
34 -25.95 25.45 -0.000350 0.008959
35 -27.39 25.91 -0.000360 0.009373
36 -27.82 26.26 -0.000366 0.009773
37 -27.78 27.73 -0.000364 0.010807
38 -28.98 27.85 -0.000384 0.011211
39 -29.14 28.00 -0.000394 0.011391
40 -29.26 29.73 -0.000405 0.012558
41 -30.59 30.47 -0.000422 0.013141
42 -31.47 30.60 -0.000425 0.013448
43 -31.48 31.73 -0.000427 0.014215
44 -32.70 32.31 -0.000440 0.014811
45 -33.43 32.58 -0.000446 0.015021
46 -33.07 33.61 -0.000453 0.015963
47 -34.29 34.23 -0.000449 0.016628
48 -35.32 34.50 -0.000461 0.017020
49 -35.21 35.92 -0.000459 0.018255
50 -37.21 36.70 -0.000476 0.018868
51 -37.41 36.84 -0.000484 0.019124

224
Panel PR-080
Casting Date: Sep. 20, 2014
Testing Date: Oct. 06, 2014
Materials:
Concrete
f’c=6,023 psi (1st batch: 6,010 psi; 2nd batch: 6,036 psi)
Steel Reinforcements
Horizontal direction : #4 rebar, s = 0.51%, fy = 67.0ksi
Vertical direction : #4 rebar, s = 0.51%, fy = 67.0 ksi
FRP Reinforcements
Two layer with Fully Wrap method, f = 1.66 %, fu = 105 ksi

225
V H V lvdt H lvdt
1 -0.54 -0.02 0.000009 -0.000037
2 -2.56 -4.18 -0.000004 -0.000064
3 -2.35 -0.12 0.000005 -0.000038
4 -2.45 0.46 -0.000006 -0.000060
5 -2.49 2.03 -0.000009 -0.000049
6 -2.73 2.40 -0.000006 0.000010
7 -4.96 2.43 -0.000029 0.000000
8 -7.99 2.23 -0.000046 0.000005
9 -9.00 4.11 -0.000066 0.000057
10 -9.48 7.11 -0.000075 0.000083
11 -9.73 7.13 -0.000078 0.000084
12 -13.06 6.78 -0.000092 0.000113
13 -15.31 7.00 -0.000108 0.000132
14 -15.15 10.52 -0.000133 0.000109
15 -15.37 12.50 -0.000122 0.000185
16 -20.27 12.36 -0.000174 0.000213
17 -21.61 15.12 -0.000171 0.001033
18 -21.38 19.73 -0.000162 0.003014
19 -23.20 19.91 -0.000176 0.003111
20 -26.46 19.71 -0.000203 0.003287
21 -26.20 22.46 -0.000212 0.003950
22 -29.69 23.00 -0.000240 0.004102
23 -31.26 25.37 -0.000241 0.004681
24 -31.27 28.54 -0.000251 0.005582
25 -36.70 28.52 -0.000290 0.005659
26 -37.38 28.58 -0.000297 0.005678
V H V lvdt H lvdt
27 -37.92 32.83 -0.000321 0.006962
28 -38.34 33.45 -0.000321 0.007324
29 -42.72 33.51 -0.000376 0.007432
30 -43.18 35.81 -0.000392 0.008168
31 -43.87 38.75 -0.000401 0.009375
32 -48.02 38.66 -0.000442 0.009608
33 -48.57 42.61 -0.000454 0.011113
34 -49.35 44.17 -0.000462 0.011932
35 -52.13 44.01 -0.000501 0.012118
36 -52.39 45.25 -0.000503 0.012478
37 -52.40 46.16 -0.000490 0.012885
38 -53.96 49.13 -0.000503 0.014547
39 -57.64 49.20 -0.000551 0.014833
40 -58.32 50.54 -0.000560 0.015187
41 -58.72 53.52 -0.000574 0.016918
42 -62.88 53.22 -0.000615 0.017400
43 -62.83 53.47 -0.000623 0.017614
44 -63.92 54.41 -0.000640 0.018017
45 -63.72 56.53 -0.000651 0.019162
46 -64.09 59.25 -0.000684 0.022403
47 -68.44 59.45 -0.000731 0.023080
48 -69.01 61.63 -0.000766 0.024362
49 -70.13 63.97 -0.000799 0.026503
50 -9.78 6.95 -0.000228 0.013321
51 -1.79 -0.85 0.000021 0.011097

226
APPENDIX II SHRINKAGE CALCULATION USING EUROCODE 2

227
The sh is the shrinkage strain in a plain concrete specimen. Viktor et al. (2014)
calculated the initial shrinkage strain sh of concrete using the approach in Eurocode 2.
Same approaches were applied in the proposed study to account for the effect of shrinkage
for each specimen. In the following section, the details of the calculation are presented:
The total shrinkage strain is composed of two components, namely, the drying
shrinkage εcd and the autogenously shrinkage strain εca , the expressions are
ε ε εsh cd ca ,
,0ε β ,cd ds s h cdt t t k ,
3
0
β ,0.04
s
ds s
s
t tt t
t t h
,
where t is the age of the concrete at the moment considered (in days); ts is the age of the
concrete (days) at the beginning of drying shrinkage (or swelling). Normally this is at the
end of curing; h0 is the notional size (mm) of the cross-section. The factor kh is a coefficient
depending on the notional size according to the following table:
h0 (mm) kh
100 1.0
200 0.85
300 0.75
≥500 0.50
The basic drying shrinkage strain is calculated from
6
,0 ds1 ds20.85 220 110 10cmcd RH
cmo
fexp
f
,
3
0
1.55 1RH
RH
RH
,
where ds1 and ds2 are coefficients that depends on the type of cement and equal to

228
ds1
3 for the cement Class S
4 for the cement Class N
5 for the cement Class R,
ds2
0.13 for the cement Class S
0.12 for the cement Class N
0.11 for the cement Class R.
RH is the ambient relative humidity (%) and 0 100%RH ; fcm is the mean compressive
strength (MPa), fcmo=10MPa. The autogenous shrinkage strain follows
ε βca as cat t ,
where 62.5 10 10ca ckf , and
0.5β 1 exp 0.2as t t ,
where t is given in days.
The details of the calculation using this method is listed in the table on next page.
229
hb
h0
kh
f cm
f ck
ca,∞
RH
R
H
cd
,0t
t 0
as
ca
d
s
cd
sh
-%
1R
EF
-R3
175
253
103.4
46
142.2
134.2
1-6
.052E
-05
78
-0.8
14
-3.8
29E
-04
26
70.6
4-3
.869E
-05
0.3
1-1
.191E
-04
-1.5
78E
-04
2R
EF
-R4
175
253
103.4
46
142.2
134.2
1-6
.052E
-05
78
-0.8
14
-3.8
29E
-04
25
70.6
3-3
.825E
-05
0.3
0-1
.147E
-04
-1.5
30E
-04
3R
EF
-R5
175
253
103.4
46
142.2
134.2
1-6
.052E
-05
78
-0.8
14
-3.8
29E
-04
23
70.6
2-3
.733E
-05
0.2
8-1
.055E
-04
-1.4
28E
-04
4S3-0
25-F
A175
253
103.4
46
146.2
138.2
1-7
.053E
-05
87
-0.5
29
-2.3
82E
-04
23
70.6
2-4
.350E
-05
0.2
8-6
.560E
-05
-1.4
44E
-04
5S3-0
40-F
A175
253
103.4
46
146.2
138.2
1-7
.053E
-05
87
-0.5
29
-2.3
82E
-04
26
70.6
4-4
.509E
-05
0.3
1-7
.408E
-05
-1.5
90E
-04
6S4-0
25-F
A175
253
103.4
46
148.0
740.0
7-7
.517E
-05
90
-0.4
20
-1.8
52E
-04
24
70.6
2-4
.695E
-05
0.2
9-5
.328E
-05
-1.5
03E
-04
7S4-0
40-F
A175
253
103.4
46
146.2
138.2
1-7
.052E
-05
87
-0.5
29
-2.3
82E
-04
33
70.6
8-4
.816E
-05
0.3
8-9
.095E
-05
-1.8
81E
-04
8S5-0
25-F
A175
253
103.4
46
146.2
138.2
1-7
.052E
-05
87
-0.5
29
-2.3
82E
-04
27
70.6
5-4
.557E
-05
0.3
2-7
.672E
-05
-1.6
36E
-04
9S5-0
40-F
A175
253
103.4
46
148.0
740.0
7-7
.517E
-05
90
-0.4
20
-1.8
52E
-04
44
70.7
3-5
.522E
-05
0.4
7-8
.663E
-05
-2.2
32E
-04
10
S4-0
25-S
B175
253
103.4
46
142.2
134.2
1-6
.052E
-05
78
-0.8
14
-3.8
29E
-04
27
70.6
5-3
.911E
-05
0.3
2-1
.234E
-04
-1.6
25E
-04
11
S4-0
40-S
B175
253
103.4
46
148.0
740.0
7-7
.517E
-05
90
-0.4
20
-1.8
52E
-04
31
70.6
7-5
.049E
-05
0.3
6-6
.725E
-05
-1.8
09E
-04
12
S4-0
25-F
W175
253
103.4
46
142.2
134.2
1-6
.052E
-05
78
-0.8
14
-3.8
29E
-04
28
70.6
5-3
.952E
-05
0.3
3-1
.275E
-04
-1.6
70E
-04
13
S4-0
40-F
W175
253
103.4
46
148.0
740.0
7-7
.517E
-05
90
-0.4
20
-1.8
52E
-04
36
70.7
0-5
.253E
-05
0.4
1-7
.554E
-05
-1.9
90E
-04
days
-N
rM
em
ber
mm
Mpa
-
Det
ails
of
Cal
cula
tion o
f S
hri
nkag
e usi
ng E
uro
Code
2 M
ethod
