structural and characteristics change of water hyacinth
TRANSCRIPT
American Journal of Materials Science and Engineering, 2017, Vol. 5, No. 1, 17-27 Available online at http://pubs.sciepub.com/ajmse/5/1/3 ©Science and Education Publishing DOI:10.12691/ajmse-5-1-3
Structural and Characteristics Change of Water Hyacinth Fiber due to Combine Effect of
Plasma and Nano-technology
Hari Prakash. N, Mariammal. M, Infant Solomon, Bornali Sarma, Arun Sarma*
Division of Physics, School of Advanced Sciences (SAS), VIT University Chennai campus, Chennai 127, Tamilnadu, India *Corresponding author: [email protected]
Abstract Water hyacinth [Eichhornia crassipes] fiber has been treated using DC glow discharge plasma to make its surface more hydrophobic in nature for various applications. The plasma treated fibers have been coated with synthesized phase pure ZnO nano-particle at room temperature to enhance both hydrophobicity and Ultra Violet [UV] light protection rate. The behavioral changes of fibers and its characteristics have been studied using XRD, SEM, EDS, a ATR-FTIR and TGA. Surface chemistry of the treated fiber has been altered as depicted by ATR-FTIR studies, while the improve degree of crystallinity analysed by XRD shows the effects of molecular structure of the fibers. The hydrophobic nature of the fibers has been recognized by contact angle measurement using Goniometer and by water absorption processes. Moreover, moisture content of treated fiber has been measured quantitatively using TGA. Finally wavelet analysis has been applied to understand the surface characteristics of water hyacinth fiber and compare its surface roughness value was measured by SEM. Furthermore, entropy of the treated and untreated fibers has also been calculated.
Keywords: contact angle, hydrophobicity, moisture, plasma treatment, wavelet analysis
Cite This Article: Hari Prakash. N, Mariammal. M, Infant Solomon, Bornali Sarma, and Arun Sarma, “Structural and Characteristics Change of Water Hyacinth Fiber due to Combine Effect of Plasma and Nano-technology.” American Journal of Materials Science and Engineering, vol. 5, no. 1 (2017): 17-27. doi: 10.12691/ajmse-5-1-3.
1. Introduction
To avoid global warming on environment, natural fiber such as water hyacinth was replaced by some non-biodegradable and renewable fibers [1]. Water hyacinth, scientifically known as Eichornia Crassipes was first observed in the part of meridia [2] and is a free drifting amphibian and obtrusive wild plant [3] are now almost everywhere throughout the world. Water hyacinth becomes quick and edges of its tangle can even increments by 60 centimeter per month in favourable conditions [4]. It has an important advantage of being a sustainable resource for bio-fuel production because of lingo-cellulosic structure. However, not much work has done with such fiber for proper applications till date. There are various available technological options for renewable fuel from water hyacinth [5,6,7] such as hydrolysis [8,9] fermentation [10,11] HTL and HTG [12,13] etc. On the other hand, water hyacinth fiber can also be used for high moisture biomass feedstock to have liquid fuel [14]. More importantly, it can be use to replace the petroleum based fibers which are the cause of global warming.
The main idea of this study is to treat the water hyacinth fiber in plasma environment to enhance its water absorption capacity and hence its hydrophobicity using
both plasma and thin film nano-technology simultaneously. To highlight the environment related issues it is important to use plasma and nanotechnology together to get almost pollution free environment [15]. Natural fibers, like water hyacinth has attracted more attention in recent years for wide acceptable applications in science and engineering.
Glow discharge plasma has the efficient creator of free radicals and having enough energy to change the bonds of any fibers and more specifically on polymer based fibers. Plasma technology is being extensively used to textile and polymers [16,17]. Again, inorganic materials, for example, metal and metal oxides are being considered for many applications on fibers because of their capacity to resist actions [18]. Some materials/metal oxides like TiO2, ZnO, MgO and CaO are behaving steady under hostile process conditions and also considered as protected materials [19]. For instance, Ag nano-particles are used for stop irresistible sicknesses because of its antimicrobial properties. Many of these properties of metal nano-molecule are depending on size, crystallinity, morphology of particles, shape and creation [20].
To understasnd surface morphology more clearly, wavelet transform (WT) has been adopted through signal and image processing. Wavelet transformation can help us to meet information on surface morphology and topography [21], which is considered in localized space and frequency. Using the algorithm multi-resolution signal decomposition (MRSD), WT can extend the image

18 American Journal of Materials Science and Engineering
information directly at different resolution for enabling interpretation of the image details from a lower-to-higher resolution [22].
This work has been done to undersand the structural changes of water hyacinth fibre by introducing plasma and nano-technologies together. Various characterisation such as, XRD, SEM, EDS, FTIR-ATR and TGA have been done to undertand the phenomena. The altered surface chemistry of the treated fibers were observed that FTIR-ATR. The degree of crystallinity has also improved which was been analysed by XRD and shows the effects of super molecular structure of the fibers. In addition, the hydrophobic nature of the fibers has been recognized by contact angle measurement using Goniometer and by water absorption processes. Moreover, moisture content of treated fiber has also been deduced quantitatively measured by TGA. Wavelet analysis has been adopted to understand the surface characteristics of water hyacinth fiber and its corresponding entropy value has been calculated for both treated and untreated fibers.
2. Theory
Wavelet Analysis (WT) Surface roughness of both space and frequency areas
can be clearly understood using wavelet analysis. WT analysis can provide multi-scale morphological picture related to any frequency data [21,22,23]. It normally provides verifiable capacity of non-stationary signals [24]. Any discrete form of wavelet is expressed as
, 000
1 ( )jj k j
s x ks
ψ ψ γ−= − (1)
Where S= 0js and γ 0 a the dilation scale parameter is the
translation parameter where the localization parameters are represented by j and k respectively. Any energy limited signal f(x), the corresponding the discrete wavelet transform (DWT) is expressed in Eq. (2) and the respective signal processing is performed by using DWT as
( , ) ( ) ( ) .fc j k f x x dxψ+∞
−∞
= ∫ (2)
Multiresolution signal decomposition (MRSD) Grossman and Morlet [25] have developed WT using
different algorithms. They proposed the CWT, based on translation and dilation, where signals are decomposed due to both the space and the scale domains. Later on, Mallat [22] introduced the algorithm of multi resolution signal decomposition (MRSD), which is mostly used for all signal processing. Original signals were decomposed in MRSD by connecting orthogonal wavelets. In this process, signals are investigated at various frequency groups with various resolutions by decomposing to low and high frequency component (A1
n, D1n) and repeated until the
craved scale level of signal segment is accomplished. These low-and high-frequency segments at any position can be expressed as,
1n
k kn j j n
j n NA A h−
−= −
= ∑ (3)
1n
k kn j j n
j n ND A g−
−= −
= ∑ (4)
Where n is the sampling position, k is the scale level, k = 1, 2, 3 . . . and N is the sampling number. For this calculations, Daubechies wavelet of order 8 (MATLAB) has been used as the basic function to analyze the signal.
Information gethered from the available output decomposed signals, parameters like entropy or energy can also be calculated using formula
2
1[ ( )]
ni ik k
iE P x
== ∑ (5)
where i is the packet number and k is the level number of the decomposed wavelet packet required contain some higher energy. The decomposed wave packets surface roughness has been calculated and compared with already measured roughness value. In this study, DWT has been executed by applying a process of MRSD of the signal [22]. Surface roughness of processed fibers can be efficiently calculated using this process.
3. Experimental Setup
Synthesis of Zinc Oxide ZnO nano particle were prepared through chemical
synthesis of Zinc chloride (ZnCl) after neutralizing with sodium hydroxide (NaOH). 1.7 g of ZnCl was broken down in 25 ml ethyl alcohol with attractive mixing. In the meantime, 0.9 g of NaOH was disintegrated in 25 ml of ethyl alcohol independently. NaOH arrangement was then included drop astute into ZnCl solution for 45 minutes with constant magnetic stirring at room temperature. The reaction is allowed to proceed for 20 minutes and then the resultant mixture was sealed and kept undisturbed for 24.0 h to complete the reaction process. White precipitates were settled after reaction. The solid and solution phases were separated by filtering and washed the same with distilled water 2 times and with diluted HCL 2 times. Precipitated ZnO powder was then annealed at 80˚C for 1.0 h and then crushed for uniformities. The crystallinity behaviour of the prepared sample was investigated by XRD and shown in Figure 1. Fiber pellets
Completely dried Water hyacinth fibers used for this experiment were cut into small pieces to form circular pellets of 2.0 cm in diameter and 0.2 cm in thickness using a pelletizer. Figure 2a and Figure 2b shows the photograph of raw water hyacinth pellet and plasma treated ZnO coated pellets respectively. Plasma treatment
Initially pellets were kept in a DC glow discharge Ar plasma for different times at a particular experimental condition. Schematic of the experimental set up is shown in Figure 3. The system consisting is of cylindrical shape with 50 cm in height and 40 cm in length. Pellets were set

American Journal of Materials Science and Engineering 19
on a substrate holder inside the chamber before evacuating the system utilizing a diffusion pump backed by a rotary pump. The base pressure has been kept up at 3.0 x 10⁻⁶ mbar. Ar gas was introduced into the system at a working pressure of 1.7 x 10⁻¹ mbar and DC voltage has been applied to make discharge. The discharge current for complete experiment was maintained at 0.4 to 0.6 A by changing the discharge voltages. The fluxes of ions at low temperature Ar plasma were used to modify the surface chemistry of fiber samples of the order of atomic dimension.
The plasma density and temperature have been measured by an indigenously developed plane Langmuir probe [26] of area 0.28 cm2 and placed close to the target holder. When 350V discharge voltage was applied than the plasma electron density and temperature were found to be ne ~ 1014 m-3 and Te = 1.0 – 3.0 eV, respectively and the condition is remain almost same for complete experiment. In a room temperature Water hyacinth pellets have been treated in plasma for different time viz., 5mins., 15 mins., 30mins, 1.0h and 1.30h. respectively and compared the result in this report.
Figure 1. X-ray diffraction pattern of Zinc Oxide (ZnO) nano-particles prepared by chemical synthesis process
Figure 2. Photograph of a) raw water hyacinth and b) plasma treated ZnO coated fiber pellets

20 American Journal of Materials Science and Engineering
Figure 3. Experimental set up for plasma treatment
Figure 4. Experimental set up of Thermal Evaporation unit
Thermal evaporation Method Plasma treated water hyacinth fiber pellets were then
coated with ZnO nano particles for its surface treatment. A Thermal evaporation system has been used to coat the ZnO film in such a way that the bulk property of fibers remains almost same. Figure 4 shows the Schematic outline of the thermal evaporation system. Evaporation was carried out in round and hollow load with 40 cm in stature and 30 cm in distance across. Plasma treated Water hyacinth fibers were kept on a substrate holder inside the system before evacuating the system to 10-6 mbar. Inside the system the ZnO nano powders were positioned on a molybdenum boat. Admittance and density of the experimental conditions related to ZnO have been fixed as 15.88 (Ω) and 5.61(g/cm3) in order to achieve uniform coating throughout the surface. When the current applied to the boat was set between 5.0 A to 8.0 A, the nano powder starts to evaporate and deposited on the water hyacinth fiber. The process time has been fixed at 5.0 minutes for all plasma treated fibers.
4. Characterization
Thermo gravimetric analysis (TGA) TGA estimations have been performed utilizing a (TGA,
TG/DTA 7200 EXSTAR instrument) warm analyzer. A warming rate of 15°C/min and an specimen weight of 3–5 mg in an aluminum cauldron with a stick opening have been utilized as a part of a nitrogen air (50 ml/min). X-ray diffraction (XRD)
XRD pattern for synthesized ZnO powder, raw water hyacinth fiber and plasma treated ZnO coated fibers have been done at various experimental conditions. The dispersing d of an arrangement of planes in a crystal is identified with the Bragg edge θ, and the wavelength λ, considering the Bragg condition. Contingent upon the dispersing of the non-treated, the treated ds (strained) fiber di (unstressed) the miniaturized scale strain in the particles in the heading ordinary to the diffracting plane given by [27],
.s i
i
d ddd d
ζ −∆
= =
(6)
Here, ds < di or ds > di, then Δd/d is positive or negative that shows whether the lingering stress is malleable or constricting in the surface, respectively. The estimation of Δd/d must be understood to know its extreme ductile strain or greatest constricting strain [28]. On the other hand, the crystalline size of the examples have been ascertained by Scherrer formula [29],
coskT λ
β θ= (7)
Where, β is the line broadening at half the maximum intensity (FWHM), k is a dimensionless shape factor (= 0.94), θ the Bragg angle and λ the X-ray wavelength [30].
The dislocation density is a measure of how many number of dislocations present in a unit volume of a crystalline material and it is expressed as,
21 .
Dδ = (8)
Again, strain is defined as the relative change in the position of points within a crystal that has undergone deformation i.e., (Dislocation in crystal lattice)
cos .4
β θε = (9)
The crystallinity index (C.I) of water hyacinth fiber by height has been done [31] using a computing stratergy as follows,
. (%) 10c
t
hC I X
h= (10)
Where hc = height of primary crystalline peak ht = total height of primary crystalline peak. Contact angle (Goniometer)
Contact Angle measurement was carried out by Rams hart instrument (Co.Model-250). It is used to measure the angle between the outline tangents of a drop deposited on a fibers with the corresponding surface of the same.

American Journal of Materials Science and Engineering 21
Fourier transform infrared (ATR-FTIR) The untreated and plasma treated ZnO coated fibers
were examined by ATR- FTIR spectroscopy. Room-temperature ATR-FTIR spectra have been registered using a Nicolet ATR-FTIR Spectroscopy (IS10). The spectra have been smoothened with a consistent smooth element for correlation. Morphology studies
Scanning electron microscope (SEM) have been carried out for the Surface monograph of samples using a (HR-SEM, Hitachi S-4800 type) magnifying instrument. Energy dispersive X-ray (EDAX)
To know the elemental information’s of raw and plasma treated ZnO coated fibers EDAX analysis has been performed. The measurement has been conducted by the Hitachi (model No. S-4800 SEM) furnished with a cathode and attractive focal points to make and center a light emission for basic examination. Test for water absorption
The fibers was set up at room temperature lastly adapted for 12.0 h for assurance of final weight (W1). Then the fiber were submerged in refined water for 24.0 h, then dried to get the final saturated weight (W2) was also estimated for the sample [32]. Percentage of absorption of water was Figureured with the formula
( ) 2 1
1
( )W % 100.
w ww−
= Χ (11)
5. Results and Discussions
Thermo gravimetrical analysis of the samples The TGA/DTA analysis was done for the untreated and
plasma treated ZnO coated fiber. Figure 5 shows the TGA curve of untreated and plasma treated nano-particle coated fibers. In case of raw fiber, initial weight loss was at around 76.5° C and can be attributed to removal of entrapped water and further weight loss at 227.4°C [33]. More weight loss onberved at temperatures 354.2°C, 573.7°C and 751.8°C, respectively as shown in Figure. 5a. The degradation of cellulose stared at these temperatures leading to the development of char. Hence, it was observed that the water content of the plasma treated and ZnO coated fiber is getting reduced than the raw fibers due to surface modification of the same. In case of 1.30 h plasma treated ZnO coated fiber, the initial weight loss took place at around 87.7°C, which is more than the raw fiber and occurs further at 238.6°C, 357.7°C, 634.5°C and 754.2°C, respectively as shown in Figure 5c. Due to considerable decrease in moisture content in treated fibers, the first peak of TGA curve gets almost disappeared. This small increase in temperature in its weight loss processes reflects the loss of moisture content of the plasma treated ZnO coated fibers. Similar result was been observed in 1.0 h treated ZnO coated fibers and shown in Figure 5b. The residual char left at 800° C has increased to 79% for 1.30 h plasma treated ZnO coated fibers when compared to raw fibers 73%. This demonstrates the rate (%) increases of cellulose substance in treated fibers. Fibers are then exposed to air atmosphere for 24.0 h, which confirms the
variation of moisture content on plasma tretaed fibers due to the plasma surface modificationon fibers.
Figure 5. TGA curve of (A) untreated fiber, (B) 1.0 h plasma treated coated fiber and (C) 1.30 h plasma treated coated fiber.
X-ray diffraction Analysis The room temperature XRD pattern of untreated, 1.0 h
and 1.30 h plasma treated ZnO coated fibers are shown in Figure 6 respectively. The pattern clearly shows the increase in d-spacing due to the plasma treated ZnO coated fibers. The micro stress and % of crystallinity [34] were calculated from the diffractometer and are presented in Table 1. Obviously the line broadening at half of the maximum intensity (FWHM) decreases for plasma treated coated ZnO fibers. The level of crystallinity Index (CrI%) utilizing the Segal exact strategy has additionally increased after plasma treated coated ZnO fiber. This increase in crystallinity with plasma treated coated ZnO fibers also confirms the increase in durability of the fiber as given by TGA analysis.
Figure 6. XRD pattern of (A) Raw fiber (B) 30 minutes plasma treated coated fiber and (C) 1 h plasma treated coated fiber (D) 1.30 h plasma treated coated fiber

22 American Journal of Materials Science and Engineering
Table 1. The observed and computed parameters from the XRD Pattern
Parameters Raw fiber 30 mins plasma treated coated ZnO
1 h plasma treated coated ZnO
1.30 h plasma treated coated ZnO
Peak Position (2θ) 22.18 21.40 21.97 21.24
FWHM (2θ) 2.30 1.96 1.57 1.50
d (Å) 5.82 5.92 4.24 5.93
Crystal size (Å) 6.4 7.5 9.3 9.8
Strain (ε) 0.56 0.48 0.38 0.36
CrI (%) 46.67 48.14 52.17 55.88
Dislocation density (δ) 2.44 1.77 1.15 1.04
Wettability
Wettability of the treated and untreated fiber surface has been characterized by the goniometer static contact angle. It relies upon components like roughness, cleanliness of the surface and surface preparation processes. At the point when the fluid wets the surface and the comparing estimation of static contact edge is < 90° then the surface is referred as hydrophilic surface and when it is > 90° yet < 180°, then it is referred to as hydrophobic and water repellent surfaces.
Image of Contact angle measurement of untreated and plasma treated ZnO coated fibers with water drop using Goniometer is shown in Figure. 7. The measured data shows that raw fibers it is 52.7°C while for 5 minutes, 30 minutes and 1.0 h plasma treated ZnO coated fibers it becomes 57.4°C, 98.2°C and 99.2°C, respectively (obtuse angle), which clearly signifies the hydrophobic nature of treated sample. Hence, the surface will act as more water repellent surface [35].
Figure 7. Contact angle measurement of raw and plasma treated Zinc Oxide coated fibers with water drop have been measured using images of Goniometer of (A) untreated (B) 5 mins (C) 30 mins and (D) 1.0 h plasma treated coated fiber
Chemical composition analysis To obtain information about chemical changes that
takes place within the fiber due to plasma treatment as well as ZnO coating on it, the Fourier transform infra-red (FTIR) spectra has been done and shown in Figure. 8. Here, 3327 cm-1 band has been attributed to OH Stretching and shown almost similar absorbance intensity proportion for the raw and plasma treated coated ZnO fiber because of α-cellulose contents. The 2925 cm-1 is relegated to CH2 stretching in methyl and methylene group. The band near 1731 cm-1 is doled out to the C=O stretching of the carboxyl and acetyl amasses in hemicelluloses of the fiber. The band 1645 cm-1 is connected with ingestion of water.
Figure 8. ATR-FTIR spectra of (A) untreated fiber (B) 30 mins and (C) 1.0 h plasma treated Zinc Oxide coated fiber
This absolute intensity of this band i.e. corresponding to 1645 cm-1 is get reduced in case of 1.0 h and 1.3 h plasma treated ZnO coated fibers, respectively due to reduction moisture content from the fibers. The absorbance at 1437 cm-1 is ascribed to CH2 twisting (topsy-turvy) in lignin. This retention reduces after plasma treatment of 1.0 h and which might be because of loss of lignin. The medium band at 1249 cm-1 is attributed to C-O-C asymmetric stretching is also reduces after plasma treatment due to acetyl group removal. Then again, the band at 1028 cm-1, is normally assigned to C-O Stretching. Surface Morphology of samples
Scanning electron microscope (SEM) micrographs has been taken to understand the alteration of the surface morphology of fibers in all experimental conditions as mentioned already. Figure 9 shows the microstructures of untreated and 1.0 h, 1.30 h respectively.
Monograph clearly indicates the relatively rough surface of raw fibers without any multi-cellular nature. Thus plasma treated coated ZnO fibers results significant changes in its morphology on account of the evacuation of lignin and hemicelluloses and in addition other structural impacts with respect to treatment time. 1.30 h plasma treated fibers shows more smoothness, compared to the raw and 1.0 h plasma treated ZnO coated fiber.
To comprehend the surface properties more quantitatively, open source programming Gwyddion (adaptation 2.35) has been utilized for the picture preparing of the SEM images [36]. Figure. 9 demonstrates the 3-Dimensional perception of the fiber surface at
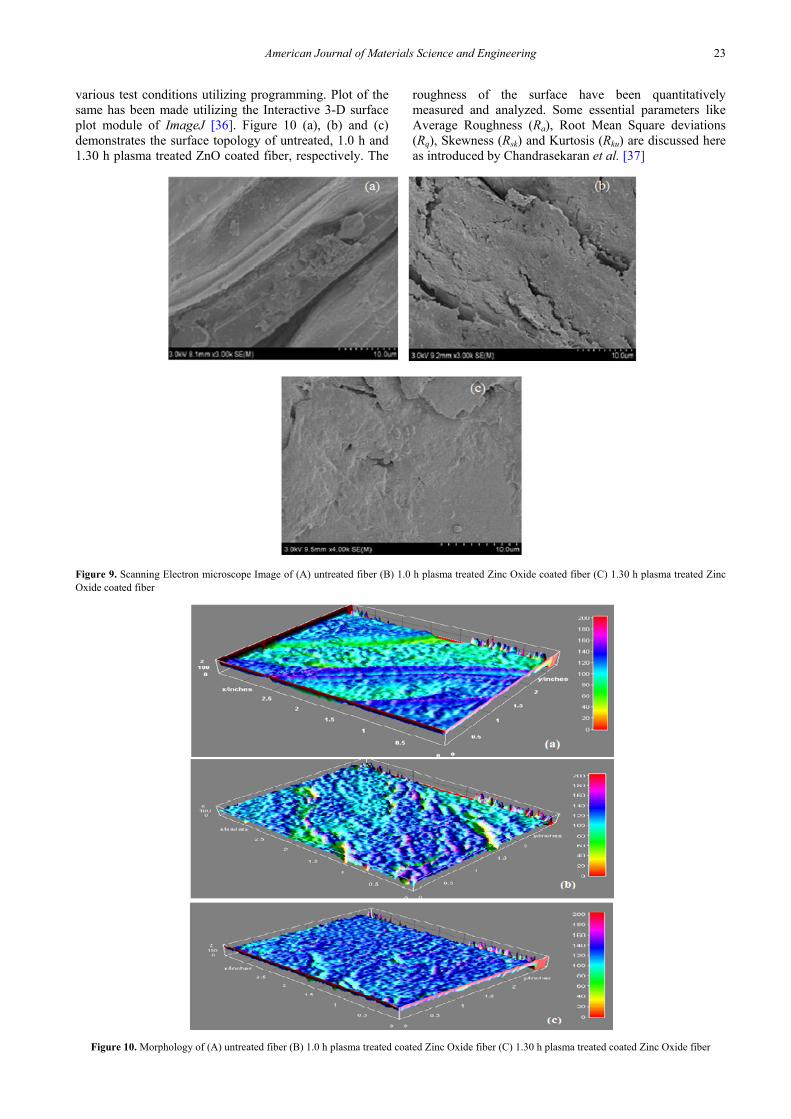
American Journal of Materials Science and Engineering 23
various test conditions utilizing programming. Plot of the same has been made utilizing the Interactive 3-D surface plot module of ImageJ [36]. Figure 10 (a), (b) and (c) demonstrates the surface topology of untreated, 1.0 h and 1.30 h plasma treated ZnO coated fiber, respectively. The
roughness of the surface have been quantitatively measured and analyzed. Some essential parameters like Average Roughness (Ra), Root Mean Square deviations (Rq), Skewness (Rsk) and Kurtosis (Rku) are discussed here as introduced by Chandrasekaran et al. [37]
Figure 9. Scanning Electron microscope Image of (A) untreated fiber (B) 1.0 h plasma treated Zinc Oxide coated fiber (C) 1.30 h plasma treated Zinc Oxide coated fiber
Figure 10. Morphology of (A) untreated fiber (B) 1.0 h plasma treated coated Zinc Oxide fiber (C) 1.30 h plasma treated coated Zinc Oxide fiber

24 American Journal of Materials Science and Engineering
Table 2. Surface roughness of untreated and plasma treated ZnO coated fibers.
Parameters Roughness (nm) Root Mean Square (nm) Skewness Kurtosis
Untreated Fiber 96.7 152.8 0.136 4.84
1.0h plasma treated and ZnO coated fiber 102.0 165.5 0.137 4.01
1.30h plasma treated and ZnO coated fiber 96.4 185.4 0.497 3.77
Average roughness and arithmetic mean with respect to
plasma treatment time has been calculated and shown in Table 2. This indicates that surfaces do not lose its individual property due to plasma treatment. These differences are not large enough to be appreciated in the SEM images of the respective surfaces, which is quite clear in the 3D image of the surface Figure. 10. The Skewness of the surface stature circulation mostly remains in the positive administration and thus keeps up the symmetry. Wavelet Transformation
Daubechies wavelet of order 8 (MATLAB) has been used as the basic function for the calculations. Figure 11 shows the distinctive frequency parts (wavelet packets)
acquired by MRSD of the surface profile of SEM images. The progressions in Ak
n and Dkn under eight distinct
resolutions are examined for both treated and untreated samples. It has been observed that the amplitudes of Ak
n and Dk
n are smaller for plasma treated ZnO coated fiber when compared with the raw fibers, thus it is revealing that the roughness is decreasing in the surface of the fibres.
The average energies (entropy) at different frequency levels for both raw and plasma treated ZnO coated fiber profiles are indicated in Figure 12. The energies are calculated by using entropy condition is shown in Eq (4) for the decomposed wavelet bundle at position "3" has been taken as a source of perspective for all image profiles.
Figure 11. MRSD of the surface profiles of SEM images for ZnO coated water hyacinth fiber before and after plasma treatment

American Journal of Materials Science and Engineering 25
Figure 12. Average energy (entropy) of different frequency components (wavelet packet) at the third (final) stage of decomposition of signal profiles of ZnO Coated swater hyacinth fiber before and after plasma treatment
Figure 13. Roughness Comparison between Software generated image and using wavelet analysis
Figure 12 is exhibiting the decreasing pattern of energy in the element bundles. For raw fibre and 1.0 h treated fibre, it is almost identical. But it is clearly visible that energy is falling and it describes the roughness is decreasing with 1.3 h treatment.
The calculated values of surface roughness (peak-to-valley height differences), averaged over 10 different profiles for each membrane sample. This gives direct roughness of the surface at respective positions directly from the decomposed wavelet packets. The variation in
the rms values of the wavelet coefficients with respect to the frequency range provides energy or entropy associated with decomposed packet whose value has also been calculated. The normal energies (entropy) at various frequency levels for both treated and untreated fiber.
There is no much difference in the entropy for raw and 1.0 h treated fiber. The differences in entropy of all samples lies within the value of 3, i.e., less than 5% of the overall values. From the decomposed signal data, the average roughness (Ra) has been calculated for all wavelet
Raw 1h plasma treated 1.30h plasma treated-20
-10
0
10
20
30
40
50
Gwyddion Software generated Using Wavelet analysis
Aver
age R
ough
ness
(a.u
.)
Duration of plasma Treatment (mins)

26 American Journal of Materials Science and Engineering
packets using Eq (1) and the values are compared with the average roughness values calculated from the Gwyddion software which is shown in Figure 13. Quantitatively the roughness values are remaining similar with particular method of calculation.
a 11R | |n
ii yn == ∑ (12)
Elemental analysis Table 3 shows EDAX analysis of the atomic weight%
of untreated, 1.0 h and 1.30 h plasma treated ZnO coated fiber, respectively. Since ZnO is coated on fibers, the 1.99% and 7.36% Zn element have been identified for 1.0 h and 1.3 h plasma treated ZnO coated fiber which was not identified in the untreated fiber. Light elements like C, O2 are identified mostly with few other elements like Mn, Cl, S, Ca and K. Water absorption test
Water absorption examination of the untreated and plasma treated ZnO coated fibers were studied using water absorption or water uptake (%) processes.
The moisture Absorption of the fibers was reaped by
hydrophobicity Measurements. The rate of water assimilation (W) was computed by asn experimental equation for untreated and plasma regarded ZnO coated fibers as takes after:
2 1
1100
w wW
w−
= × (13)
where the dry weight (w1) and submerged weight (w2) were measured to Figureure the water take-up of the untreated and plasma treated ZnO coated fibers. The dry weight, drenched weight, and water take-up rate for untreated fiber were 0.0075, 0.010, and 33.3%, separately.
Similar parameters for fibers treated for 30 mins were 0.007, 0.009, and 28.5%, proceeded by 1.0 h plasma treated ZnO coatedd fiber and 1.3 h plasma treated ZnO coated fiber is 26.3% and 12.5% repectively. The water take-up rates of untreated and treated fibers demonstrate the hydrophobicity of the plasma treated fibers. It demonstrates a decreasing in water take-up ability of plasma treated ZnO coated fibers. This might be because of the impact of hemicelluloses which are attributed to the demolition and breaking of hydrogen bonds.
Table 3. Atomic weight% of raw fiber and plasma treated ZnO coated fibers
Elements Raw Fiber(%) 1h plasma treated and ZnO coated Water hyacinth fiber(%)
1.30h plasma treated and ZnO coated Water hyacinth fiber(%)
Carbon 66.33 54.77 0
Oxygen 31.19 40.51 66.53
Magnese 0.41 0.54 0
Clorine 0.78 1.73 6.91
Potassium 1.01 0 8.36
Calcium 0.29 0.47 2.52
Sulphur 0 0 8.32
Zinc 0 1.99 7.36
Raw 30 mins 1 hour 1.30 hour10
15
20
25
30
35
Wat
er U
ptak
e (%
)
Conditions
Water Uptake (%)
Figure 14. Water absorption analysis of raw and plasma treated ZnO coated water hyacinth fiber

American Journal of Materials Science and Engineering 27
Figure 14 assures the hydrophobhic nature of plasma treated ZnO coated fibers under various experimental conditions. The contact angle goniometer analysis also verifies the hydrophobic nature and hereby we assure that the fibers become more hydrophohic after plasma treatment and coating of ZnO.
6. Conclusions
In this study both plasma and nano-technology have been used to increase the water repellent capacity of water hyacinth natural fibers. Pallets of water hyacinth fibers have been treated in plasma for different time and further coated with synthesized ZnO nano-particles to increase the hydrophobicity. TGA/DTA analysis of the plasma treated ZnO coating fibers clearly shows the improvement of thermal stability the treated fibres with respect to the untreated fibers. X-ray analysis of the treated sample also signifies the increase of crystallinity index of the fiber and which can be correlated with the water repellent. The SEM-EDAX analysis shows the abrupt change in surface morphology of the plasma treated ZnO coated fibers compared to untreated fiber and the elemental composition of both raw and plasma treated ZnO coated fiber respectively. In addition WT method with the MRSD algorithm has declared that the surface roughness of water hyacinth fiber decreses. The most significant result has been observed from the contact angle analysis and water absorption test, which is very clearly shows the increase in hydrophobicity of the plasma treated ZnO coated water hyacinth fiber.
Acknowledgments
The Author‘s profoundly thank the VIT University management, Chennai for giving the encouragement and lab support to carry out the research work.
References [1] Anwer Md Masroor, A. H. Bhuiyan, IOSR Journal of Applied
Physics (IOSRJAP) 16 (2012) 16-22. [2] C. C. Gunnarsson, C. M. Petersen, Waste Management 27 (2007)
117-129. [3] Ebhin R Masto, Sandeep Kumar, T. K. Rout, Pinaki Sarkar, Joshy
George, L. C. Ram, Catena 111 (2013) 64-71. [4] A. Malik, Environmental International 33 (2007) 122-138. [5] Ying Gao, Xianhua Wang, Jun Wang, Xiangpeng Li, Jianjun
Cheng, Haiping Yang, Hanping Chen, Energy 58 (2013) 376-383. [6] P. Biller, A. B. Ross, Biofuels 3 (2012) 603-623.
[7] Y. K. Ong, S. Bhatia, Energy 35 (2010) 111-119. [8] J. N. Nigam, J. of Biotechnology 07 (2002) 107-116. [9] A. Kuniati, H. Darmokoesoemo, N. N. T. Puspaningsih, J. of
Agriculture biotechnology and sustainable development 3 (2011) 182-188.
[10] D. Mashima, M. Kuniki, K. Sei, S. Soda, M. Ike, M. Fujita, Bioresource Technology 99 (2008) 2495-2500.
[11] Xia Ao, Jun Cheng, Richen Lin, Lingkan Ding, Junhu Zhou, Kefa Cen, Energy 55 (2013) 631-637.
[12] S. S. Toor, L. Rosendahl, A. Rudolf, Energy 36 (2011) 2328-2342. [13] A, Kruse, J. of Supercritical fluids 47 (2009) 391-399. [14] C. Douglas, John Elliott, L Sealock, R. Scott Butner, American
chemical society 17 (1988) 179-188. [15] R. Oraji, Master of Science Thesis, University of Saskatchewan,
Saskatoon, 2008. [16] Shishoo Roshan Shishoo. Plasma technologies for textiles. 1st ed.
Woodhead Publishing in Textiles. England, Cambridge, 2007. [17] Jing Zhang, Paul France, Arseni Radomyselskiy, Saswati Datta,
Jiangang Zhao, William Van Ooij, Journal of Applied. Poly. Science 88 (2003) 1473-1481.
[18] Lei Fu, Zhimin Liu, Yunqi.Liu, Buxing Han, Pingan Hu, Lingchao Cao, Daoben Zhu, Advanced Materials 17 (2005) 217-221.
[19] Robert M. Dickson, L.Andrew Lyon, Journal of Physical Chem B 104 (2000) 6095-6098.
[20] Peter K. Stoimenov, Rosalyn L. Klinger, George L. Marchin, Kenneth J. Klabunde, Langmuir 18 (2002) 6679-6686.
[21] Xue-Guang Shao, Alexander Kai-Man Leung, Foo-Tim Chau, Accounts of Chemical Research 36 (2003) 276-283.
[22] G. Stephane, A, Mallat, IEEE Transactions on Pattern analysis and Machine Intelligence 11 (1989) 674-693.
[23] Lin Yuan, Xu Rui Xiao, Li Xue Ping, Xiao Wen Zhou, Surface Science 579 (2005) 37-46.
[24] Alisher Maksumov, Ruxandra Vidu, Ahmet Palazoglu, Pieter Stroeve, Journal of colloid and interface science 272 (2004) 365-377.
[25] A. Grossman and J. Morlet, SIAM J.Math 15 (1984) 723-730. [26] N. Hari Prakash, Bornali Sarma, S. Gopi, Arun Sarma,
Instrumentation Sci.and Tech. 44 (2016) 73-84. [27] M. M. Morshed, Monjarul M. Alam, S. M. Daniels, Plasma
Chemistry and Plasma Processing 32 (2012) 249-258. [28] Gary G. Chinga, P. Johnsen, R. Dougherty, E Berli, Journal of
Microscopy 227 (2007) 254-265. [29] B. D. Cullity, Elements of X-ray diffraction. Addison-Wesley
Publishing Company Inc., Reading, Massachusetts, 1956. [30] L. Segal, J. Creely, Conrad CM, Textile Research Journal 29
(1959) 786-794. [31] Yu-Qing Zhang, Wei-De Shen, Ru-Li Xiang, Lan-Jian Zhuge,
Wei-Jian Gao, Wen-Bao Wang, Journal of Nanoparticle Research 9 (2007) 885-900.
[32] S. Mohanty, S. K. Nayak, S. K. Verma, S. S. Tripathy, Journal of Reinforced plastics and composites 23 (2004) 2047-2063.
[33] K. S. Venkatesh, S. R. Krishnamoorthi, N. S. Palani, V. Thirumal, S. P. Jose, F. M. Wang, R. Ilangovan, Indian Journal of Physics 89 (2015) 445-452.
[34] E. Sinha, S. K. Rout, Bull. Mat. Sci. 32 (2009) 65-76. [35] Wafaa M. Raslan, Usama S. Rashed, Hanan El-Sayad, Azza A. El-
Halwagy, Material Science and Applications 2 (2011) 1432-1442. [36] N. David, Petr Klapetek, Central European Journal of Phys. 10
(2012) 181-188. [37] S. Chandrasekaran, J. Check, S. Sundararajan, P. Shrotriya,
Sensors and Actuators A 121 (2005) 121-130.