strong ground motion in the kathmandu valley during the 2015
TRANSCRIPT
Takai et al. Earth, Planets and Space (2016) 68:10 DOI 10.1186/s40623-016-0383-7
LETTER Open Access
Strong ground motion in the KathmanduValley during the 2015 Gorkha, Nepal,earthquake
Nobuo Takai1*, Michiko Shigefuji2, Sudhir Rajaure3, Subeg Bijukchhen4, Masayoshi Ichiyanagi2,Megh Raj Dhital5 and Tsutomu Sasatani6Abstract
On 25 April 2015, a large earthquake of Mw 7.8 occurred along the Main Himalayan Thrust fault in central Nepal. Itwas caused by a collision of the Indian Plate beneath the Eurasian Plate. The epicenter was near the Gorkha region,80 km northwest of Kathmandu, and the rupture propagated toward east from the epicentral region passingthrough the sediment-filled Kathmandu Valley. This event resulted in over 8000 fatalities, mostly in Kathmandu andthe adjacent districts. We succeeded in observing strong ground motions at our four observation sites (one rocksite and three sedimentary sites) in the Kathmandu Valley during this devastating earthquake. While the observedpeak ground acceleration values were smaller than the predicted ones that were derived from the use of a groundmotion prediction equation, the observed peak ground velocity values were slightly larger than the predicted ones.The ground velocities observed at the rock site (KTP) showed a simple velocity pulse, resulting in monotonic-stepdisplacements associated with the permanent tectonic offset. The vertical ground velocities observed at thesedimentary sites had the same pulse motions that were observed at the rock site. In contrast, the horizontalground velocities as well as accelerations observed at three sedimentary sites showed long duration withconspicuous long-period oscillations, due to the valley response. The horizontal valley response was characterizedby large amplification (about 10) and prolonged oscillations. However, the predominant period and envelope shapeof their oscillations differed from site to site, indicating a complicated basin structure. Finally, on the basis of thevelocity response spectra, we show that the horizontal long-period oscillations on the sedimentary sites hadenough destructive power to damage high-rise buildings with natural periods of 3 to 5 s.
Keywords: 2015 Gorkha Nepal earthquake, Kathmandu Valley, Strong ground motion, Velocity pulse motion, Valleyresponse
IntroductionThe Himalayan mountain range formed by the collisionof the Indian and Eurasian plates is regarded as anearthquake prone zone. The Indian Plate underthruststhe Eurasian Plate in this region, and a number of largeearthquakes have occurred in the Himalayas. Kathmandu,the capital city of Nepal, is located in the KathmanduValley. The valley is surrounded by mountains on all sidesand is filled with soft lake sediments of Plio-Pleistoceneorigin (Dhital 2015); the thickness of the sediments is
* Correspondence: [email protected] of Engineering, Hokkaido University, Kita 13, Nishi 8, Kita-ku,Sapporo, JapanFull list of author information is available at the end of the article
© 2016 Takai et al. Open Access This article isInternational License (http://creativecommons.oreproduction in any medium, provided you givthe Creative Commons license, and indicate if
more than 650 m in the central part of the valley(Moribayashi and Maruo 1980). Large earthquakes inthe past have caused significant damage in theKathmandu Valley; for example, during the 1934Nepal-Bihar earthquake (Mw 8.2), nearly 19 % of thebuildings were destroyed inside the valley and morethan 8000 people from all over the country lost theirlives (Dixit et al. 2013). The principal factor associ-ated with the significant damage is considered to havebeen the responses of soft lake sediments duringseismic motion. Considering these tectonic and siteconditions within the Kathmandu Valley, we haveestablished four strong-motion array observationstations (one rock site and three sedimentary sites) in
distributed under the terms of the Creative Commons Attribution 4.0rg/licenses/by/4.0/), which permits unrestricted use, distribution, ande appropriate credit to the original author(s) and the source, provide a link tochanges were made.

Takai et al. Earth, Planets and Space (2016) 68:10 Page 2 of 8
the valley to understand the site effects of theKathmandu Valley to strong ground motion. Thesesites were established on 20 September 2011.On 25 April 2015, a large Mw 7.8 earthquake occurred
along the Himalayan front (USGS 2015a). This eventhad a low-angle thrust faulting mechanism and an 8.2-km hypocentral depth (USGS 2015a). The epicenter wasnear the Gorkha region, 80 km northwest of theKathmandu Valley, and the rupture propagated eastwardfrom the epicentral region passing through theKathmandu Valley (e.g., Avouac et al. 2015; Fan andShearer 2015; Galetzka et al. 2015; Grandin et al. 2015;Hayes et al. 2015; Kobayashi et al. 2015; Yagi andOkuwaki 2015). This event resulted in over 8000fatalities, which occurred mostly in Kathmandu and inadjacent districts (MoHA 2015). Although the earth-quake vulnerability of Kathmandu was considerablyserious, there were only two official seismometers re-cording earthquakes on the sedimentary sites: KATNP byUSGS (2015b) and DMG (Bhattarai et al. 2015). We suc-ceeded in observing strong ground motions at our arraysites in the Kathmandu Valley during this devastatingearthquake. In this letter, we describe the characteristicsof the ground motions observed in the Kathmandu Valleyand perform a simple examination of the long-periodvalley response in the frequency domain. Finally, wediscuss the velocity response spectra for the horizontal
Fig. 1 Location map. a Observation sites in the Kathmandu Valley with geoaccelerometer (SMA) stations are divided into HU-TU (Hokkaido Universitywere used in Galetzka et al. (2015). b The epicenter of the 2015 Gorkha earred rectangular and the focal mechanism are estimated by USGS (2015a)
ground motions. Data used in this letter include theground motions observed by the Faculty of Engineering,Hokkaido University in collaboration with the CentralDepartment of Geology, Tribhuvan University, Nepal,and also those observed by some other organizations(Galetzka et al. 2015; USGS 2015b).
Strong-motion array observations in theKathmandu ValleyAccelerometers have been installed at the following foursites along a straight (west to east) profile in theKathmandu Valley: KTP (Kirtipur Municipality Office,Kirtipur), TVU (Central Department of Geology, TribhuvanUniversity, Kirtipur), PTN (Pulchowk Campus, Instituteof Engineering, Tribhuvan University, Patan), and THM(University Grants Commission Office, Sanothimi,Bhaktapur). The site locations are shown in Fig. 1a. Wecollected data using highly damped moving coil type(dimensionless damping constant h ~ 26, natural fre-quency of 3 Hz) Mitsutoyo JEP-6A3-2 accelerometers(Kudo et al. 2002) and Hakusan DATAMARK LS-8800data loggers at a sampling rate of 100 Hz. The dataloggers can perform GPS time calibration. Due to longhours of power outage in Kathmandu, the observationsystem is powered by chargeable batteries and voltagestabilizers for smooth operation. The accelerometer hasa flat response (−3 dB) of ground acceleration from
logical formations (modified from Shrestha et al. 1998). Strong-motionand Tribhuvan University; red) and USGS sites (green). The GPS stationsthquake is shown by the red star. The fault plane shown with the

Takai et al. Earth, Planets and Space (2016) 68:10 Page 3 of 8
0.1 Hz to an aliasing frequency (Kudo et al. 2002). It isnecessary to apply a correction of the sensor-responseto the observed records in order to derive accurateground motions (Kudo et al. 2002). We installed theseinstruments on the first floor of reinforced concretebuildings that were one- to four-stories high, and theaccelerometers were fixed to the floor with bolts. Wehave recorded data continuously at the four sites forover 2 years. We had observed and analyzed the datafrom a few moderate-size earthquakes (Bijukchhenet al. 2015) during 2 years’ observations before the2015 Gorkha earthquake.The shallow subsurface S-wave velocities of the
observation sites were investigated by the surfacewave method during installation of accelerometers(Takai et al. 2015). The tested velocity of S-wave ata depth of 10 m was over 700 m/s at the KTP site,but it was less than 200 m/s at the other three sites.These velocities are consistent with the geologicalformations; KTP is located on a rock and TVU,PTN, and THM are located on lake sediments in thevalley (Fig. 1a).
Ground accelerationsThe fault size of the 2015 Gorkha earthquake estimatedby USGS (2015a) was about 200 km long and 150 kmwide (Fig. 1b), and it was associated with a large slip areanear the Kathmandu Valley. During data processing, wefirst made a baseline correction by removing the mean
Fig. 2 Observed ground accelerations at five stations. These have been cosoft sedimentary sites. The waveform records at KATNP were provided by U
determined from a segment of the pre-event part of theoriginal record from the entire original acceleration rec-ord. Next, we made the sensor-response correction byusing the FFT deconvolution filter. The accelerogramsobtained after applying the sensor-response correctionare shown in Fig. 2 along with those from the KATNP(Kanti Path, Kathmandu) station, which is managed byUnited States Geological Survey (USGS) (the records ofKATNP lack absolute timing).The largest peak ground acceleration (PGA, 241 cm/s2)
was recorded on the EW component at the rock site KTP,and the peak amplitude of the horizontal components was250 cm/s2 at this station. This large PGA was due to iso-lated short-period waves at about 30 s from the origin time.The horizontal PGA values were compared with those pre-dicted by two ground motion prediction equations(GMPEs) for ground accelerations. We found that the ob-served PGA values were smaller than those estimated bythe GMPEs (Si and Midorikawa 1999; Boore et al. 2014).Anderson et al. (1986) pointed out that the observed PGAvalues above the source area during the 1985 Michoacan,Mexico, earthquake (Mw 8.0) were considerably smaller(PGA, 100–200 cm/s2) than those during the 1985 Valpa-raiso, Chile, earthquake (Mw 8.0). This may indicate thatthe Mexico and Chile subduction zones are different fromeach other in terms of the nature of the interplate couplingas discussed by Houston and Kanamori (1986). The natureof interplate coupling at the Nepal collision zone on theother hand has to be studied in detail.
rrected for the sensor-response; KTP is a rock site and the others areSGS (2015b)
Takai et al. Earth, Planets and Space (2016) 68:10 Page 4 of 8
The horizontal accelerograms at the sedimentary siteshad long duration with conspicuous long-period oscilla-tions; however, the envelopes of oscillations in waveformsdiffered from site to site. Conversely, the vertical accel-erograms at all the sites were nearly the same and wereassociated with no long-period oscillations. These ob-servations are characterized by the site effects of theKathmandu Valley, that is, the valley response. Con-spicuous long-period accelerations were also observedwithin the lake zone in Mexico City during the 1985Michoacan earthquake (Mw 8.0) (Anderson et al.1986). The PGA values at both locations were compar-able, while the predominant periods were somewhatdifferent; specifically, the periods in the KathmanduValley were 3 to 5 s (see Figs. 3 and 4), while those inMexico City were 2 to 3 s. We should note that al-though both the conspicuous long-period accelerationsrepresent an effect of the lake sediments under the val-leys, the exciting mechanisms may have been differentbecause the fault distance of the Kathmandu Valley wasabout 10 km, whereas the relevant distance in MexicoCity was about 300 km; therefore, the incoming wavefields into the two valleys were different from eachother. It is well known that the long-period accelerationscaused the collapse of, or severe damage to, many tallbuildings in the lake zone in Mexico City (Anderson et al.1986). Fortunately, in the case of the Gorkha earthquake,there were no high-rise or base-isolated buildings with thelong natural period in and around the Kathmandu Valley.
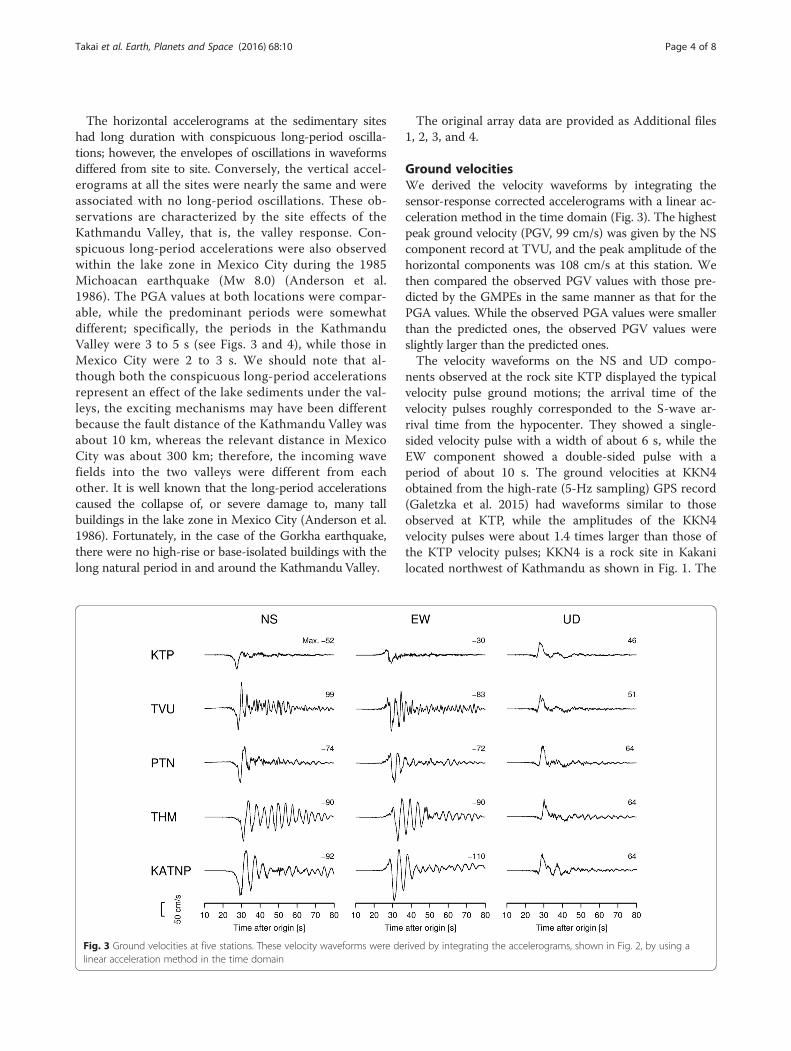
Fig. 3 Ground velocities at five stations. These velocity waveforms were delinear acceleration method in the time domain
The original array data are provided as Additional files1, 2, 3, and 4.
Ground velocitiesWe derived the velocity waveforms by integrating thesensor-response corrected accelerograms with a linear ac-celeration method in the time domain (Fig. 3). The highestpeak ground velocity (PGV, 99 cm/s) was given by the NScomponent record at TVU, and the peak amplitude of thehorizontal components was 108 cm/s at this station. Wethen compared the observed PGV values with those pre-dicted by the GMPEs in the same manner as that for thePGA values. While the observed PGA values were smallerthan the predicted ones, the observed PGV values wereslightly larger than the predicted ones.The velocity waveforms on the NS and UD compo-
nents observed at the rock site KTP displayed the typicalvelocity pulse ground motions; the arrival time of thevelocity pulses roughly corresponded to the S-wave ar-rival time from the hypocenter. They showed a single-sided velocity pulse with a width of about 6 s, while theEW component showed a double-sided pulse with aperiod of about 10 s. The ground velocities at KKN4obtained from the high-rate (5-Hz sampling) GPS record(Galetzka et al. 2015) had waveforms similar to thoseobserved at KTP, while the amplitudes of the KKN4velocity pulses were about 1.4 times larger than those ofthe KTP velocity pulses; KKN4 is a rock site in Kakanilocated northwest of Kathmandu as shown in Fig. 1. The
rived by integrating the accelerograms, shown in Fig. 2, by using a
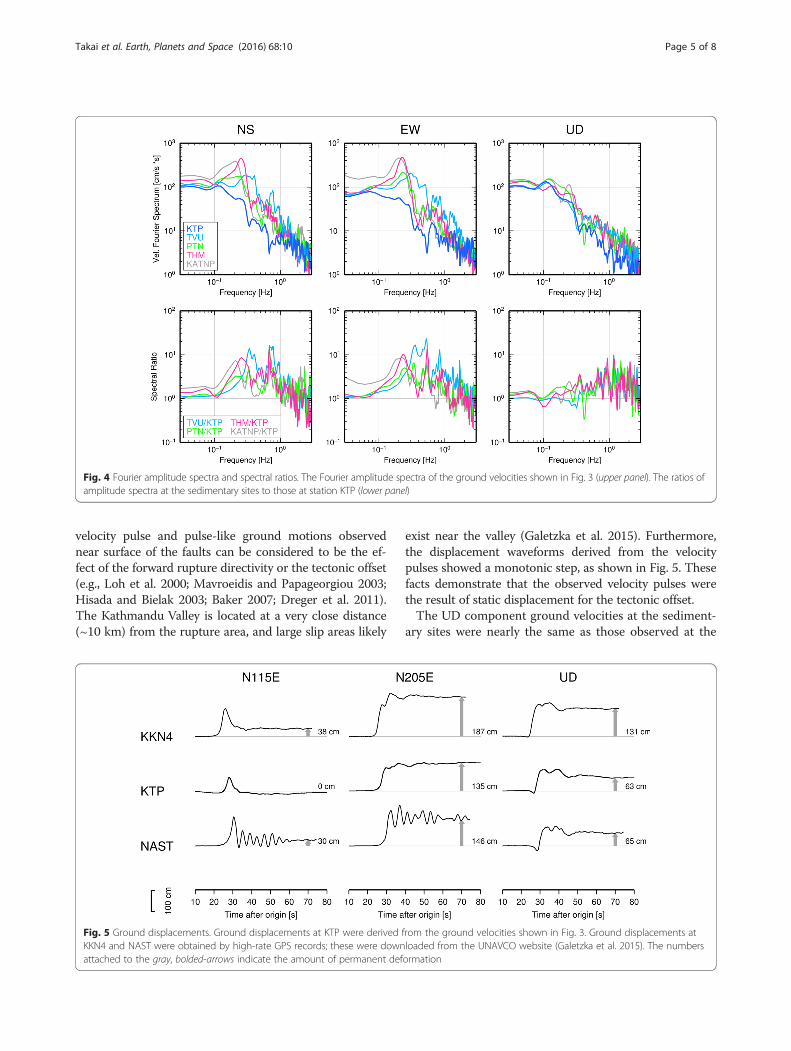
Fig. 4 Fourier amplitude spectra and spectral ratios. The Fourier amplitude spectra of the ground velocities shown in Fig. 3 (upper panel). The ratios ofamplitude spectra at the sedimentary sites to those at station KTP (lower panel)
Takai et al. Earth, Planets and Space (2016) 68:10 Page 5 of 8
velocity pulse and pulse-like ground motions observednear surface of the faults can be considered to be the ef-fect of the forward rupture directivity or the tectonic offset(e.g., Loh et al. 2000; Mavroeidis and Papageorgiou 2003;Hisada and Bielak 2003; Baker 2007; Dreger et al. 2011).The Kathmandu Valley is located at a very close distance(~10 km) from the rupture area, and large slip areas likely
Fig. 5 Ground displacements. Ground displacements at KTP were derivedKKN4 and NAST were obtained by high-rate GPS records; these were downattached to the gray, bolded-arrows indicate the amount of permanent def
exist near the valley (Galetzka et al. 2015). Furthermore,the displacement waveforms derived from the velocitypulses showed a monotonic step, as shown in Fig. 5. Thesefacts demonstrate that the observed velocity pulses werethe result of static displacement for the tectonic offset.The UD component ground velocities at the sediment-
ary sites were nearly the same as those observed at the
from the ground velocities shown in Fig. 3. Ground displacements atloaded from the UNAVCO website (Galetzka et al. 2015). The numbersormation

Takai et al. Earth, Planets and Space (2016) 68:10 Page 6 of 8
rock site KTP. In contrast, the horizontal ground veloci-ties at the sedimentary sites had long duration with con-spicuous long-period oscillations; we pointed out thesefeatures for the accelerograms discussed in the previoussection (Fig. 2). Assuming that the KTP (rock site)ground velocities represent incoming wave fields intothe Kathmandu Valley, we can consider the large groundvelocities at the sedimentary sites in Fig. 3 to be thelong-period (3–5 s) valley response. Here, we perform asimple examination of the long-period valley response inthe frequency domain. The upper panel in Fig. 4 displaysthe Fourier amplitude spectra of the ground velocitiesshown in Fig. 3; we classified the spectra into threecomponents in order to compare one another’s spectralshape for a given component. The lower panel in Fig. 4shows the Fourier amplitude spectral ratios of thesedimentary site spectra to the rock site spectrum foreach component; these figures correspond to the valleyresponse in the frequency domain for a given site. Fromexamination of Figs. 3 and 4, we found that the long-period valley response had the following features: (1) thehorizontal valley response was characterized by largeamplification (about 10) and prolonged oscillations, (2)the predominant period and envelope shape of thehorizontal oscillation differed not only from site to sitebut also between the NS and EW components at a givensite, and (3) the vertical valley response had no amplifi-cation and no prolonged oscillations. These featuresdemonstrate that the long-period valley response of theKathmandu Valley is considerably complicated, becausethey cannot be understood with one-dimensional seismicwave amplification. Previous studies indicated an unevenbasement topography of the valley with many undula-tions (Moribayashi and Maruo 1980; Paudyal et al. 2013)which may result in a complicated response. In order tounderstand the factors involved in the observed long-period valley response of the Kathmandu Valley, we willhave to clarify the three-dimensional underground struc-ture of the valley in addition to the dense strong-motionobservations in and around the valley.
Ground displacementsThe ground velocities at KTP where the simple velocitypulses were observed on the UD and NS componentswere integrated to derive the displacement waveforms.The KTP displacement waveforms are shown in Fig. 5,together with those observed by the high-rate GPSs atKKN4 and NAST (Khumaltar, Lalitpur) (Galetzka et al.2015); these locations are shown in Fig. 1. Here, thehorizontal components were rotated to the fault-normal(N205E) and fault-parallel (N115E) directions based onthe USGS fault model (USGS 2015a) in order to obtain areasonable interpretation of the Earth’s surface motion.The derived displacements at KTP were characterized by
a monotonic step (also including the contributions ofdynamic phases) on the fault-normal and UD compo-nents. They showed permanent displacements of 135 cmin the fault-normal direction and 63 cm in the upwarddirection (the vector sum was 149 cm), while there wasa negligible permanent displacement in the fault-paralleldirection. The displacement waveforms at KTP weresimilar to those at the rock site KKN4 for the threecomponents. However, their permanent deformationvalues were different; the values at KKN4 were largerthan those at KTP because the KKN4 site was closer tothe large slip area (Galetzka et al. 2015). The UD dis-placement and permanent deformation at the sediment-ary site NAST were similar to those at KTP. However,the horizontal displacement waveforms at NAST weredifferent from those at KTP; the long-period oscillationsobserved at NAST resulted from the valley response asmentioned in the previous section. In spite of thecontamination by the valley response, the horizontalpermanent deformation values at NAST did not greatlydiffer from those at KTP; the distance between NASTand KTP was only 6 km. These pieces of evidence indi-cate that the displacement waveforms at KTP derivedfrom the accelerograms produced reliable motion for theEarth’s surface.Conversely, the ground displacements derived from
the accelerograms at our sedimentary sites and KATNPshowed different waveforms than those of KTP. Al-though the UD displacements had similar waveformsand permanent deformations as those at the rock siteKTP, the horizontal displacements showed considerabledrifts. According to Boore (2001), the source of the driftswas likely the shift in the zero level due to tilting (eitherdynamic or permanent) in the instruments; however, theeffect of tilt on the vertical components was muchsmaller. These observations demonstrate that the high-rate GPS waveforms captured the ground displacementsbetter than the horizontal accelerograms at the sedi-mentary sites where the horizontal long-period groundmotions were largely amplified, as shown in Fig. 3.
Horizontal velocity response spectraFinally, to discuss the destructive power of observedstrong ground motions for buildings, we calculated hori-zontal velocity response spectra (h = 0.05); the horizontalresponse spectrum was obtained based on the maximumof the vector sum of the two horizontal-component re-sponse histories for a specific natural period. Figure 6shows the horizontal velocity response spectra for thefive sites in the Kathmandu Valley. In this figure, the twonotable response spectra TKT (Takatori, Kobe, Japan)and TCU068 (Shigang District, Taichung, Taiwan) arealso shown; these were derived from records observed atthe near-surface fault. The ground velocity at TKT

Fig. 6 Horizontal velocity response spectra. The horizontal velocityresponse spectra for five sites in the Kathmandu Valley and twonotable sites (TCU068 and TKT); these horizontal response spectrawere obtained based on the maximum of the vector sum of thetwo horizontal-component response histories for a specific naturalperiod by using the damping factor h = 0.05. The TCU068 and TKTrecords were downloaded from CESMD
Takai et al. Earth, Planets and Space (2016) 68:10 Page 7 of 8
showed pulse-like motion with a large PGV of 161 cm/sduring the 1995 Kobe earthquake in Japan; the pulse-likemotion was caused by the directivity effect (Kamae andIrikura 1998). The ground velocity at TCU068 showed avelocity pulse with a large PGV of 400 cm/s and a longpulse width of 8 s during the 1999 Chi-Chi earthquake inTaiwan; the velocity pulse was caused by fling-step motion(Bolt and Abrahamson 2003). These records are fre-quently used for building structure assessments of pulsemotion (e.g., Hall et al. 1995; Kalkan and Kunnath 2006).First, we compare the two response spectra for KTP
and TCU068, which were derived from the velocitypulses. The TCU068 spectrum had a large peak at aperiod of 10 s, which was several times larger than theKTP peak at 6 s; this was due to the difference in ampli-tude and width of the two pulses. The spectral peaks forthe sedimentary sites (TVU, PTN, THM, and KATNP)were considerably larger than that for the rock site KTPin the period range of 3 to 5 s. Furthermore, we shouldpoint out that these peaks, except for the one at PTN,were larger than the two notable response spectra in theperiod range of 3 to 5 s. These were due to the long-period valley response, as mentioned in the previoussection. In general, we may conclude that the horizontalground motions at the sedimentary sites had enoughdestructive power to damage high-rise buildings whichhave natural periods of 3 to 5 s.
Concluding remarksSince the capital city of Kathmandu in Nepal is locatedon a sediment-filled valley and was located at a veryclose distance to the fault plane of the 2015 Gorkhaearthquake, a wealth of new information on strong
ground motions was captured there. At the rock sites,simple velocity pulses were observed on the NS and UDcomponents; these were the result of the tectonic offset.At the sedimentary sites, although velocity pulses werealso observed on the vertical component, the horizontalground velocities showed largely amplified and pro-longed long-period oscillations compared with the rocksite motions; these resulted from the valley response.Finally, we found that the horizontal long-period oscilla-tions had enough destructive power to damage high-risebuildings. It will be important for us to understand the fac-tors involved in the long-period valley response observed inthe Kathmandu Valley based on the three-dimensionalvelocity structure of the valley in future studies.
Additional files
Additional file 1: KTP001504250611.dat. Strong motion accelerationdata at KTP station. (DAT 606 kb)
Additional file 2: TVU001504250611.dat. Strong motion accelerationdata at TVU station. (DAT 606 kb)
Additional file 3: PTN001504250611.dat. Strong motion accelerationdata at PTN station. (DAT 606 kb)
Additional file 4: THM001504250611.dat. Strong motion accelerationdata at THM station. (DAT 606 kb)
Competing interestsThe authors declare that they have no competing interests.
Authors’ contributionsNT, MS and TS designed this study. MS and SB analyzed the data. NT and TSdrafted the manuscript. All authors contributed equally toward managingthe observations. All authors read and approved the final manuscript.
AcknowledgementsThe KATNP record was provided by USGS (USGS 2015b). TCU068 (Lee et al. 2001)and TKT (Nakamura et al. 1996) records were downloaded from the Center forEngineering Strong Motion Data (CESMD) at http://www.strongmotioncenter.org/(accessed 20 October 2015). The KKN4 and NAST data were obtained from theUNAVCO website (Galetzka et al. 2015). This study was partly supported by theGrant-in-Aid for Scientific Research (Nos. 23404005 and 15H05793) from the JSPS(Japanese Society for the Promotion of Science) and the MEXT (Ministry ofEducation, Culture, Sports, Science, and Technology) of Japan, the Heiwa NakajimaFoundation, the Obayashi Foundation, the MEXT program entitled Japan’sEarthquake and Volcano Hazards Observation and Research Program, and theJapan Science and Technology (JST) agency’s J-RAPID Program. Our gratefulthanks to Dr. Y. Dhakal, S. Ghimire, Messrs. K. Sawada, H. Okajima, Y. Miyahara, andM. Aoki for their assistance. We used the Generic Mapping Tools (Wessel andSmith 1991) for drawing portions of the figures.
Author details1Faculty of Engineering, Hokkaido University, Kita 13, Nishi 8, Kita-ku,Sapporo, Japan. 2Institute of Seismology and Volcanology, Faculty of Science,Hokkaido University, Kita 10, Nishi 8, Kita-ku, Sapporo, Japan. 3Department ofMines and Geology, Lainchour, Kathmandu, Nepal. 4Graduate School ofEngineering, Hokkaido University, Kita 13, Nishi 8, Kita-ku, Sapporo, Japan.5Central Department of Geology, Tribhuvan University, Kirtipur, Kathmandu,Nepal. 6Ainosato 1-4-19-12 Kita-ku, Sapporo, Japan.
Received: 26 October 2015 Accepted: 6 January 2016Published: 26 January 2016

ReferencesAnderson JG, Bodin P, Brune JN, Prince J, Singh SK, Quaas R, Onate M (1986)
Strong ground motion from the Michoacan, Mexico, earthquake. Science233(4768):1043–1049
Avouac J-P, Meng L, Wei S, Wang T, Ampuero J-P (2015) Lower edge of lockedMain Himalayan Thrust unzipped by the 2015 Gorkha earthquake. Nat Geosci8(9):708–711. doi:10.1038/ngeo2518
Baker JW (2007) Quantitative classification of near-fault ground motions usingwavelet analysis. Bull Seismol Soc Am 97(5):1486–1501. doi:10.1785/0120060255
Bhattarai M, Adhikari LB, Gautam UP, Laurendeau A, Labonne C, Hoste-ColomerR, Sèbe O, Hernandez B (2015) Overview of the large 25 April 2015 Gorkha,Nepal, earthquake from accelerometric perspectives. Seismol Res Lett 86(6):1540–1548. doi:10.1785/0220150140
Bijukchhen S, Takai N, Shigefuji M, Ichiyanagi M, Sasatani T, Rajaure S, Dhital MR (2015)A comparative study of strong ground motion records from 30 August 2013south Tibet earthquake on the rock and soil sites of Kathmandu valley. Journal ofNepal Geological Society 48:48–48
Bolt B, Abrahamson N (2003) Estimation of strong seismic ground motions. In: LeeWHK, Kanamori H, Jennings P, Kisslinger C (eds) International Handbook ofEarthquake & Engineering Seismology. vol 2. Elsevier Science, New York, pp983–1001
Boore DM (2001) Effect of baseline corrections on displacements and responsespectra for several recordings of the 1999 Chi-Chi, Taiwan, earthquake.Bull Seismol Soc Am 91(5):1199–1211. doi:10.1785/0120000703
Boore DM, Stewart JP, Seyhan E, Atkinson GM (2014) NGA-West2 equations forpredicting PGA, PGV, and 5 % damped PSA for shallow crustal earthquakes.Earthq Spectra 30(3):1057–1085. doi:10.1193/070113EQS184M
Dhital MR (2015) Geology of the Nepal Himalaya, 1st edn. Springer InternationalPublishing, Switzerland. doi:10.1007/978-3-319-02496-7
Dixit AM, Yatabe R, Dahal RK, Bhandary NP (2013) Initiatives for earthquake disasterrisk management in the Kathmandu valley. Nat Hazards 69(1):631–654.doi:10.1007/s11069-013-0732-9
Dreger D, Hurtado G, Chopra A, Larsen S (2011) Near-field across-fault seismicground motions. Bull Seismol Soc Am 101(1):202–221. doi:10.1785/0120090271
Fan WY, Shearer PM (2015) Detailed rupture imaging of the 25 April 2015 Nepalearthquake using teleseismic P waves. Geophys Res Lett 42(14):5744–5752.doi:10.1002/2015gl064587
Galetzka J, Melgar D, Genrich JF, Geng J, Owen S, Lindsey EO, Xu X, Bock Y,Avouac J-P, Adhikari LB, Upreti BN, Pratt-Sitaula B, Bhattarai TN, Sitaula BP,Moore A, Hudnut KW, Szeliga W, Normandeau J, Fend M, Flouzat M,Bollinger L, Shrestha P, Koirala B, Gautam U, Bhatterai M, Gupta R, Kandel T,Timsina C, Sapkota SN, Rajaure S, Maharjan N (2015) Slip pulse andresonance of the Kathmandu basin during the 2015 Gorkha earthquake,Nepal. Science 349(6252):1091–1095. doi:10.1126/science.aac6383
Grandin R, Vallée M, Satriano C, Lacassin R, Klinger Y, Simoes M, Bollinger L (2015)Rupture process of the Mw = 7.9 2015 Gorkha earthquake (Nepal): insights intoHimalayan megathrust segmentation. Geophys Res Lett 42(20):8373–8382.doi:10.1002/2015GL066044
Hall JF, Heaton TH, Halling MW, Wald DJ (1995) Near-source ground motion and itseffects on flexible buildings. Earthq Spectra 11(4):569–605. doi:10.1193/1.1585828
Hayes GP, Briggs RW, Barnhart WD, Yeck WL, McNamara DE, Wald DJ, Nealy JL,Benz HM, Gold RD, Jaiswal KS, Marano K, Earle PS, Hearne MG, Smoczyk GM,Wald LA, Samsonov SV (2015) Rapid characterization of the 2015 Mw 7.8Gorkha, nepal, earthquake sequence and its seismotectonic context.Seismol Res Lett 86(6):1557–1567. doi:10.1785/0220150145
Hisada Y, Bielak J (2003) A theoretical method for computing near-fault groundmotions in layered half-spaces considering static offset due to surfacefaulting, with a physical interpretation of fling step and rupture directivity.Bull Seismol Soc Am 93(3):1154–1168. doi:10.1785/0120020165
Houston H, Kanamori H (1986) Source characteristics of the 1985 Michoacan,Mexico earthquake at periods of 1 to 30 seconds. Geophys Res Lett 13(6):597–600. doi:10.1029/GL013i006p00597
Kalkan E, Kunnath SK (2006) Effects of fling step and forward directivity on seismicresponse of buildings. Earthq Spectra 22(2):367–390. doi:10.1193/1.2192560
Kamae K, Irikura K (1998) Source model of the 1995 Hyogo-Ken Nanbuearthquake and simulation of near-source ground motion. Bull Seismol SocAm 88(2):400–412
Kobayashi T, Morishita Y, Yarai H (2015) Detailed crustal deformation and faultrupture of the 2015 Gorkha earthquake, Nepal, revealed from ScanSAR-basedinterferograms of ALOS-2. Earth Planets Space 67(1):201
Kudo K, Kanno T, Okada H, Özel O, Erdik M, Sasatani T, Higashi S, Takahashi M,Yoshida K (2002) Site-specific issues for strong ground motions during theKocaeli, Turkey, earthquake of 17 August 1999, as inferred from arrayobservations of microtremors and aftershocks. Bull Seismol Soc Am 92(1):448–465. doi:10.1785/0120000812
Lee WHK, Shin TC, Kuo KW, Chen KC, Wu CF (2001) CWB free-field strong-motiondata from the 9-21-1999 Chi-Chi earthquake, digital acceleration files on CD-ROM. Seismology Center, Central Weather Bureau, Taipei, Taiwan, publicationversion 9 January 2001, Vol. 1
Loh C-H, Lee Z-K, Wu T-C, Peng S-Y (2000) Ground motion characteristics of theChi-Chi earthquake of 21 September 1999. Earthq Eng Struct D 29(6):867–897.doi:10.1002/(SICI)1096-9845(200006)29:6<867::AID-EQE943>3.0.CO;2-E
Mavroeidis GP, Papageorgiou AS (2003) A mathematical representation of near-faultground motions. Bull Seismol Soc Am 93(3):1099–1131. doi:10.1785/0120020100
MoHA (2015) The Ministry of Home Affairs (MoHA) Government of Nepal: NepalEarthquake 2015: Disaster Recovery and Reconstruction Information Platform(NDRRIP). http://drrportal.gov.np/ndrrip/main.html. Accessed OCT 20 2015
Moribayashi S, Maruo Y (1980) Basement topography of the Kathmandu Valley,Nepal: an application of gravitational method to the survey of a tectonicbasin in the Himalayas. Journal of the Japan Society of Engineering Geology21(2):80–87. doi:10.5110/jjseg.21.80
Nakamura Y, Uehan F, Inoue H (1996) Waveform and its analysis of the 1995Hyogo-Ken-Nanbu Earthquake (II). JR Earthquake Information No 23d, RailwayTechnical Research Institute, Tokyo (in Japanese)
Paudyal YR, Yatabe R, Bhandary NP, Dahal RK (2013) Basement topography of theKathmandu Basin using microtremor observation. J Asian Earth Sci 62:627–637,http://dx.doi.org/10.1016/j.jseaes.2012.11.011
Shrestha O, Koirala A, Karmacharya S, Pradhananga U, Pradhan P, Karmacharya R(1998) Engineering and environmental geological map of the Kathmanduvalley. Department of Mines and Geology, Kathmandu
Si H, Midorikawa S (1999) New attenuation relationships for peak groundacceleration and velocity considering effects of fault type and site condition.Journal of structural and construction engineering 523:63–70 (in Japanesewith English abstract)
Takai N, Sawada K, Shigefuji M, Bijukchhen S, Ichiyanagi M, Sasatani T, Dhakal P,Rajaure S, Dhital MR (2015) Shallow underground structure of strong groundmotion observation sites in the Kathmandu valley. Journal of NepalGeological Society 48:50–50
USGS (2015a) M7.8 - 36 km E of Khudi, Nepal. http://earthquake.usgs.gov/earthquakes/eventpage/us20002926#scientific_finitefault:us_us20002926. Accessed SEP20 2015
USGS (2015b) NetQuakes:Station KATNP_NQ_01, 25 April 2015. http://earthquake.usgs.gov/monitoring/netquakes/station/KATNP_NQ_01/20150425061138/. AccessedSEP20 2015
Wessel P, Smith WHF (1991) Free software helps map and display data. Eos, TransAmer Geophys Union 72(41):441–441. doi:10.1029/90eo00319
Yagi Y, Okuwaki R (2015) Integrated seismic source model of the 2015 Gorkha, Nepal,earthquake. Geophys Res Lett 42(15):2015GL064995. doi:10.1002/2015GL064995
Submit your manuscript to a journal and benefi t from:
7 Convenient online submission
7 Rigorous peer review
7 Immediate publication on acceptance
7 Open access: articles freely available online
7 High visibility within the fi eld
7 Retaining the copyright to your article
Submit your next manuscript at 7 springeropen.com
Takai et al. Earth, Planets and Space (2016) 68:10 Page 8 of 8