three-dimensional characteristics of strong ground · pdf filethree-dimensional...
TRANSCRIPT

1
THREE-DIMENSIONAL CHARACTERISTICS OF STRONG GROUND
MOTION IN THE NEAR-FAULT AREA
Rajesh RUPAKHETY1 and Ragnar SIGBJÖRNSSON2
ABSTRACT
This works presents an analysis of three-dimensional characteristics of strong ground motion in the near-fault area. Eleven stations of a small-aperture strong-motion array recorded the ground-motion data used here during the 29 May 2008 Mw 6.3 Ölfus Earthquake in South Iceland. Polarizations patterns of ground acceleration and ground velocity are estimated from principal component analysis. This involves projecting three-component ground motion into a set of three orthogonal directions, called principal directions, along which the motions are uncorrelated. Polarization patterns of ground acceleration and ground velocity are found to be distinctly different. In addition, the polarization patterns are different from what is reported in the literature for far field ground motion. While ground velocity is found to be elliptically polarized in the horizontal plane, polarization of ground acceleration is found to be more ellipsoidal in three-dimensional space. This implies that ground velocity is more anisotropic than ground acceleration, at least in the in the near-fault data studied here. A new measure of anisotropy is derived from the covariance tensor of principal components of motion. It is found high-frequency motion is more isotropic than low-frequency motion. The elastic response spectra in the major and minor horizontal directions are studied. The ratio between the two spectra is found to depend on system vibration period, and significantly different from the period independent ratios specified in Eurocode 8.
BACKGROUND
Characteristics of motion in three dimensions and their directionality can be studied by analysing the correlations among three orthogonal components of motion. To quantify such correlations, we use the covariance matrix of the three components of motion. Denoting ground-motion (acceleration or velocity) time series at a station in three orthogonal directions by ( )xa t , ( )ya t , and ( )za t , the covariance matrix is defined as ijc⎡ ⎤= ⎣ ⎦c (1)
with the covariances ijc given by
( ) ( )1
01 0
1 , , ,t
ij i jt
c a t a t dt i j x y zt t
= =− ∫ , (2)
1 Associate Professor, Earthquake Engineering Research Center, University of Iceland, [email protected] 2 Professor, Earthquake Engineering Research Center, University of Iceland, [email protected]

2
where 1t and 2t represent the start and end of the time window being studied. The covariance matrix is symmetric and follows the transformation laws of a second order tensor. This matrix is related, by a constant, to the Arias Intensity tensor (Arias, 1970). Penzien and Watabe (1975) proposed the use of covariance matrix in studying three-dimensional characteristics of strong ground motion. By virtue of the positive semi-definite nature of the covariance matrix, there exists a coordinate system in which the covariance matrix is diagonal. The new coordinate system is defined by an orthogonal transformation (rotation) of motion. This operation rotates the original basis vectors (x, y, z) to a new set of orthogonal basis vectors (1, 2, 3) along which the three components of motion are uncorrelated. Mathematically, the transformation can be expressed as
1
2
3
0 00 00 0
Tp
cc
c
⎡ ⎤⎢ ⎥= = ⎢ ⎥⎢ ⎥⎣ ⎦
c T cT (3)
where T is the orthogonal transformation matrix, whose columns are the eigenvectors of the covariance matrix. The new set of basis vectors are known as the principal directions, and the projection of motion along these directions are called as principal components. The diagonal entries of the covariance matrix in the principal coordinate system are the variances of motion in the principal directions. When the variances are ordered such that 1 2 3c c c> > , the corresponding principal directions 1, 2, and 3 are called as the major, the intermediate, and the minor principal directions, respectively. Graphically, the transformation of recorded motion into principal directions can be thought of as enclosing—in a least squares sense—the recorded data in an ellipsoid in a three-dimensional space. The principal directions then represent the semi-axes of the ellipsoid with half-lengths equal to the square root of the corresponding variances. In what follows, the principal directions and their corresponding variances are presented in this geometric interpretation. Instead of the ellipsoids, ellipses formed by their intersection with the 1-2, 2-3, and 1-3 planes are used for visual clarity.
DATA
The data used in this work were recorded during the 29 May 2008 3 Ölfus Earthquake in South Iceland. According to the CMT database (CMT, 2008), the earthquake had a moment magnitude of 6.3. The earthquake is characterized by shallow crustal rupture on nearly vertical right-lateral strike-slip faults. The epicentre of the earthquake, according to the CMT database, is 63.94° N and 21.09° W. Analysis of seismic, GPS, and InSAR data show that the earthquake ruptured, almost simultaneously, two parallel faults (Sigbjörnsson et al., 2009; Decriem et al., 2010). The first rupture occurred on the Ingólfsjall Fault (see Figure 1), which after about 1s, triggered rupture on the Kross Fault. The earthquake was recorded by ICEARRAY (see, Halldórsson and Sigbjörnsson, 2009): a small-aperture strong-motion array located in the town of Hveragerði (see Figure 1). Eleven of the 14 stations of the array recorded three-component ground acceleration data, which showed large variability in amplitude across the array. A detailed description of the peak ground motion parameters recorded by the array is provided in Halldórsson and Sigbjörnsson (2009). The three-component ground acceleration data recorded at eleven stations of ICEARRAY are used in this work. Ground velocity is obtained from the recorded ground acceleration by using the baseline correction procedure described in Rupakhety et al. (2010).
R.Rupakhety and R.Sigbjörnsson 3
((
( (
((
(
(
(
(
(
(
(
(
(((
((
(
(
(
(
(
(
( ((
( (
(
(
(
(((
((
(
((
(
((
(
((((((
(
((
((
(
(
(((
(
(
(((
(
(
(
((
(
(
(
(
(
(
(
((
((
(
(
((
(
(
(
(
(
((((
(
(
(
(
(
(
(
(
(
(
(
(
(
((
(
(
(
(
(
(
(
(
(
(
(
(
(
(
(
(
(
(
(
(
(
(
((
(
(
(
(
(
(
(
(
(
(
(
(
(
(
(
(
(
(
(
(
( (
(
(
(
(
(
(
(
(
(
(
(
(
(
(
(
(
(
((
(
(
(
(
(
(
(
(
(
(
(
(
(
(
(
(
(
(
(
(
(
(
(
(
(
(
(
(
(
(
(
( (
(
(
(
(
(
(
(
(
(
(
(
(
(
(
((
(
( (
(
(
(
(
(
(
(
((
(
(
(
(
(
(
(
((
(
(
( (
(
(
(
(
(
(
(
(
(
(
(
(
(
(
(
(
(
(
(
(
(
(
(
(
(
(
(
(
(
(
(
(
(
(
(
((
(
(
(
(
(
(
(
(
(
(
(
(
(
((
(
(
(
((
(
(
(
(
(
(
((
(
(
(
(
(
(
(
( (
(
(
(
(
(
(((
(
(
(
(
(((
((
(
(
(
(
(
(
(
(
(
(
(
(
(
(
(
(
(
(
(
(
(
(
(
(
(
(
(
(
(
(
(
(
(
(
(
(
(
(
(
(
(
((
(
(
(
(
(
(
(
(
(
(
(
(
(
(
(
(
(
(
((
(
(
((
(
(
(
(
(
(
(
(
(
(
(
(
(
(
(
(
(
(
(
(
(
(
(
(
(
(
(
(
(
(
(
(
(
(
(
(
(
(
(
((
(
(
(
(
(
(
(
(
(
(
(
(
(
(
(
(
(
(
((
(
(
(
(
(
(
((
(
(
(
(
(
(
(
(
(
(
(
(
(
(
(
(
(
(
(
(
(
(
(
(
(
(
(
(
(
(
(
(
(
(
(
((
(
(
(
(
(
(
(
(
(
(
(
(
(
(
(
(
(
(
(
(
(
(
(
(
(
(
(
(
(
(
(
(
(
(
(
(
(
(
(
(
(
(
((
(
(
(
((
(
(
(
(
(
(
(
(
(
(
(
(
(
(
((
(
(
(
(
(
(
((
(
((
(
(
(
(
(
(
(
(
(( (
(
(
((
(
(
(
(
(
((
(
(
(
(
(
(
(
(
(
(
(
(
(
(
((
(
(
(
(
(
(
(
((
(
(
(
(
(
(
(
(
(
(
(
(
(
(
(
(
(
(
(
(
((
(
(
(
(
(
(
(
(
(
(
(
(
(
(
(
(
(
(
(
(
(
(
(
(
(
(
(
(
(
(
(
(
(
(
(
(
(
((
(
(
(
(
(
(
(
(
(
(
(
(((
(
(
(
(
(
(
(
(
(
(
((
(
(
(
(
(
(
(
((
(
(
(
(
((
(
(
(
(
(
(
((
(
(
( (
(
(
(
(
(
((
(
(
(
( (
(
(
(
(
(
(
(
(
(
((
(
(
(
(
(
(
(
(
(
(
(
(
(
(
(
(
(
(
(
(
(
(
(
(
(
(
(
(
(
(
(
(
(
(
(
(
(
((
(
(
(
(
(
(
(
(
(
(
(
(
((
(
(
(
((
(
(
(
(
(
(
(
(
(
(
(
(
(
(
(
(
(
(
(
( (
(
(
(
(
(
(
(
(
(
(
(
(
(
(
(
(
(
(
(
(
(
(
((
(
(
(
(
(
((
(
(
((
(
(
(
(
(
(
(
(
(
((
(
(
(
(
(
(
(
(
(
(
(
(
(
(
(
(
(
(
(
(
(
(
(
(
(
(
(
(
(
(
(
(
(
(
(
(
(
(
(
(
(
(
(
(
(
(
(
(
(
(
(
(
(
(
(
((
(
(
(
(
((
(
(
(
(
(
(
(
(
((
(
(
(
(
(
(
(
(
(
(
(
(
(
(
(
(
(
(
(
(
(
(
(((
(
(
(
((
(
(
(
(
(
((
((
(
(
(
(
(
(
(
(
(
(
(
((
( (
(
(
(
(
(
(
(
(
(
(
(
(
(
(
(
(
(
(
(
((
(
(
(
(
(
(
(
(
(
(
(
(
(
(
(
(
(
(
(
(
(
(
(
(
(
(
(
(
(
(
(
(
(
(
(
(
(
(
(
(
(
(
(
(
(
(
(
(
(
(
(
(
(
(
(
(
(
(
(
(
(
(
(
(
(
(
(
(
(
(
(
((
(
(
(
(
(
(
(
((
((
(
(
(
(
(
(
(
(
(
(
(
(
(
(
(
(
(
(
(
((
(
(
(
(
(
(
(
(
(
(
((
(
(
(
(
(
(
(
(
(
(
(
( (
(
(
(
(
(
(
(
(
(
(
(
(
((
((
(
(
(
(
(
(
(
(
(
(
(
(
(
(
(
(
(
(
(
(
(
(
(
(
(
(
(
(
(
(
(
(
(
(
(
(
(
(
(
(
(
(
((
(
(
(
(
(
(
(
(
(
(
(
(
(
(
(
((
((
(
(
(
(
(
(
(
(
(
(
(
(
(
(
(
(
(
(
(
(
( (
(
(
(
(
(
(
(
(
(
(
((
(
(
(
(
(
(((
(
(
(
(
(
(
(
(
(
(
(
((
(
(
(
((
(
(
(
(
(
(
(
(
(
(
(
(
(
(
(
((
(
(
(
(
(
(
(
(
(
(
(
(
(
(
(
((
(
(
(
(
(
(
(
(
(
(
(
(
(
(
( (
(
(
(
(
(
((
(
(
(
(
(
(
(
(
(
(
(
(
(
(
(
(
(
(
(
(
(
(
(
(
(
(
(
(
(
(
(
(
(
(
(
(
(
(
(
(
(
(
(
(
(
(
(
(
(
(
(
(
(
(
(
(
(
(
(
(
(
(
(
(
(
(
(
(
(
(
((
((
(
(
(
(
(
(
( (
(
(
(
(
(
(
(
(
(
(
(
(
(
(
(
(
(
(
(
(
(
(
(
(
(
(
(
(
((
(
(
(
(
(
(
(
(
(
(
(
(
(
(
((
(
(
(
(
(
(
(
(
(
(
(
(
(
(
(
(
(
((
(
(
(
(
(
(
(
(
(
(
(
(
(
(
(
(
(
(
(
(
(
(
(
(
(
(((
(
(
(
(
(
(
(
(
(
(
(
(
(
(
(
(
(
(
(
(
(
(
(
(
(
(
(
(
(
(
(
(
(
(
(
(
(
(
(
(
(
(
(
(
(
(
(
(
(
(
(
(
(
(
(
(
(
(
(
(
(
(
(
(
(
(
(
(
(
((
(
(
(
((
(
((
(
(
(
(
(
(
(
(
(
(
(
(
(
(
(
(
(
(
(
(
(
(
(
(
(
(
(
(
(
(
(
(
(
(
(
(
((
(
(
(
(
(
(
(
(
(
(
(
( (
(
!(
!(
_̂
_̂
"
"
"
" "
!(
!(
!(!(!(
!(
!(!(
!(!(
!(
Selfoss
Hveragerði
Kross
Hvammur
LambhagiKotstrond
Reykjavík
3Km
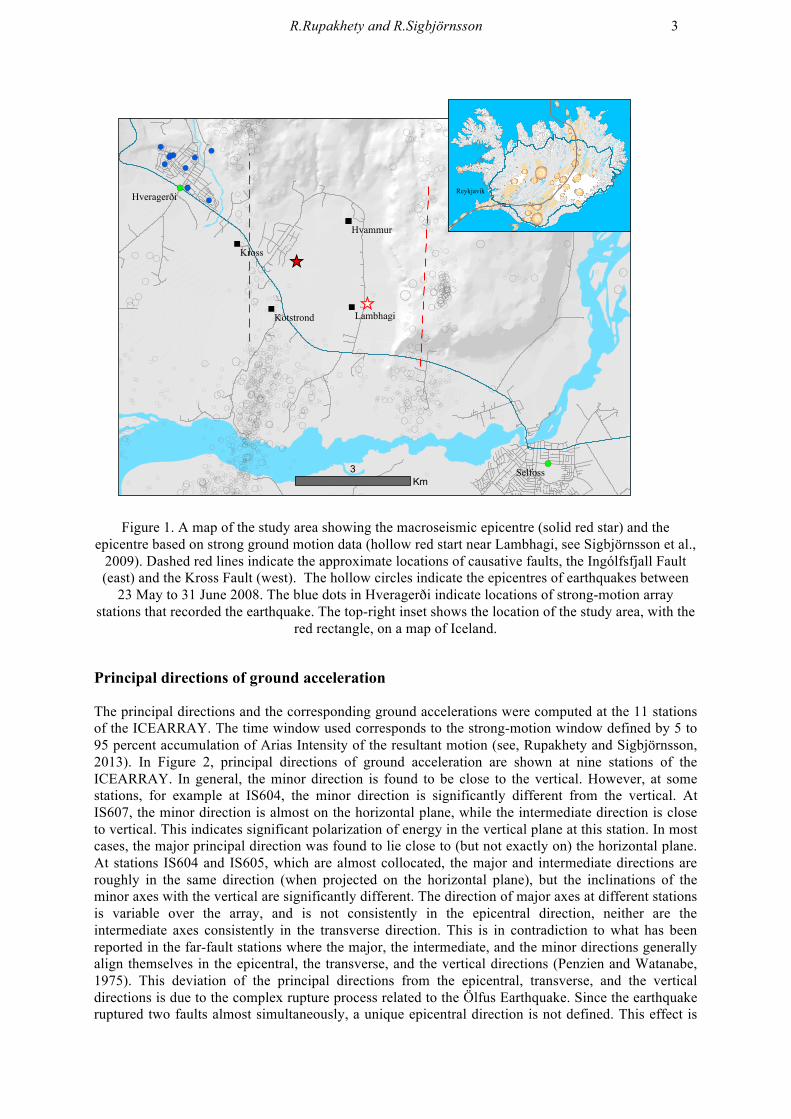
Figure 1. A map of the study area showing the macroseismic epicentre (solid red star) and the
epicentre based on strong ground motion data (hollow red start near Lambhagi, see Sigbjörnsson et al., 2009). Dashed red lines indicate the approximate locations of causative faults, the Ingólfsfjall Fault (east) and the Kross Fault (west). The hollow circles indicate the epicentres of earthquakes between
23 May to 31 June 2008. The blue dots in Hveragerði indicate locations of strong-motion array stations that recorded the earthquake. The top-right inset shows the location of the study area, with the
red rectangle, on a map of Iceland.
Principal directions of ground acceleration
The principal directions and the corresponding ground accelerations were computed at the 11 stations of the ICEARRAY. The time window used corresponds to the strong-motion window defined by 5 to 95 percent accumulation of Arias Intensity of the resultant motion (see, Rupakhety and Sigbjörnsson, 2013). In Figure 2, principal directions of ground acceleration are shown at nine stations of the ICEARRAY. In general, the minor direction is found to be close to the vertical. However, at some stations, for example at IS604, the minor direction is significantly different from the vertical. At IS607, the minor direction is almost on the horizontal plane, while the intermediate direction is close to vertical. This indicates significant polarization of energy in the vertical plane at this station. In most cases, the major principal direction was found to lie close to (but not exactly on) the horizontal plane. At stations IS604 and IS605, which are almost collocated, the major and intermediate directions are roughly in the same direction (when projected on the horizontal plane), but the inclinations of the minor axes with the vertical are significantly different. The direction of major axes at different stations is variable over the array, and is not consistently in the epicentral direction, neither are the intermediate axes consistently in the transverse direction. This is in contradiction to what has been reported in the far-fault stations where the major, the intermediate, and the minor directions generally align themselves in the epicentral, the transverse, and the vertical directions (Penzien and Watanabe, 1975). This deviation of the principal directions from the epicentral, transverse, and the vertical directions is due to the complex rupture process related to the Ölfus Earthquake. Since the earthquake ruptured two faults almost simultaneously, a unique epicentral direction is not defined. This effect is

4
further aggravated by the proximity of the stations to the source. In the far-field, the source can be approximated by a point and an ‘average’ epicentral direction can be considered. In the near-field, this approximation is not valid, and the complex interference of seismic waves radiated from different sections of an extended source results in polarization of seismic energy that is much more complex than that in the far-field stations. The non-vertical nature of minor axes at the near-filed stations indicates that the commonly used assumption of vertically propagating shear waves is not valid in the near-fault region. At stations close to the fault, like the ones being studied, the seismic waves arrive at an angle to the vertical and polarization of SV (shear waves with particle motion in the vertical plane) waves result in more seismic energy in the vertical direction, than is commonly observed in the far-field region.
Figure 2. Principal directions and principal planes of ground acceleration at 9 stations of ICEARRAY during the Ölfus Earthquake. The solid red, green, and blue lines represent the major, intermediate, and minor axes, respectively. The dashed red, green, and blue lines represent the north, west, and vertical (up) directions, respectively. The stations are IS601, IS602, IS603, IS604, IS605, IS607,
IS608, IS688 and IS609, starting from the top left (see Halldórsson and Sigbjörnsson, 2009 for station codes).

R.Rupakhety and R.Sigbjörnsson 5
Principal directions of ground velocity Investigation of the principal directions of ground velocity, on the other hand, resulted in different results as those discussed above. In this case, the minor axes at all stations are either vertical or very close to it (see Figure 3). The directions of the principal axes over the array were found to be fairly uniform. In addition, major principle axes were predominantly in the fault-normal direction, and the intermediate principle axes on the fault-parallel direction. This is consistent with higher concentration of seismic energy in the fault-normal direction due to rupture directivity effects (see, for example, Rupakhety et al., 2011). It was also noticed that the vertical ground velocity is much weaker compared to the horizontal ones (which was not consistently observed for ground acceleration) resulting in highly planar motion polarized on the horizontal plane. This indicates that in the near-fault area, relatively low frequency motion is polarized more in the horizontal plane. At the dominant frequencies of ground velocity, the motion seems to be contributed mostly by the SH waves impinging vertically. It was also found that the initial part of the motion, which is mainly contributed by the P waves, is strongly polarized in the vertical plane.
Figure 3. Same as Figure 2, but for ground velocity.

6
Figure 4 shows the orientation of major and intermediate principal directions of ground velocity at the eleven stations of ICEARRY. The dashed black line indicates the direction of the approximate centre of the array to the macroseismic epicentre. The major principal direction is approximately in the macroseismic epicentral direction—the deviations are due to the complex rupture process of the earthquake, and the close proximity of the array from the source.
Figure 4. A map of the study area showing the principal directions of ground velocity during the Ölfus Earthquake. The recording stations of ICEARRAY are indicated by black dots. The red and the blue
arrows show the projection of major and intermediate principal axes on the horizontal plane. The dashed black line shows the epicentral (macroseismic) direction from the station IS611.
ANISOTROPY
Our analyses of strong-motion in the near-fault area indicate considerable anisotropy of ground motion. This anisotropic distribution of energy is evident from the elongated shapes of the ellipses shown in Figure 3. The relative distribution of energy in mutually orthogonal directions is an important consideration in assigning strong-motion parameters, such as response spectra, in two orthogonal directions. To quantify the anisotropy of motion at a site, we develop a measure of anisotropy in analogy of isotropic and deviatoric strain tensors in solid mechanics. The formulation is based on a decomposition of the covariance tensor, defined in Equation 2, into isotropic and deviatoric tensors. The isotropic variance is defined as
1 2 3
3mc c cc + +
= , (4)

R.Rupakhety and R.Sigbjörnsson 7
The isotropic tensor is defined as
0 0
0 00 0
m
I m
m
cc
c
⎡ ⎤⎢ ⎥= ⎢ ⎥⎢ ⎥⎣ ⎦
c , (5)
and the deviatoric tensor is defined as
1
2
3
0 00 00 0
m
D m
m
c cc c
c c
−⎡ ⎤⎢ ⎥= −⎢ ⎥⎢ ⎥−⎣ ⎦
c (6)
If [ ]1 2 3Tc c c and [ ]Tm m mc c c are considered as vectors in a three dimensional space, the
distance between the two vectors is
( ) ( ) ( )2 2 21 2 3m m mR c c c c c c= − + − + −
r (7)
which is related to the second invariant of the deviatoric covariance tensor ( )2J by the equation
22R J=r
(8)
Normalizing this distance by the length of [ ]1 2 3Tc c c gives a measure of the anisotropy of motion:
( ) ( ) ( )2 2 21 1 1
2 2 21 2 3
m m mc c c c c cc c c
δ− + − + −
=+ +
(9)
For the extremely anisotropic case approaching rectilinear motion, the measure of anisotropy given by Equation 9 is 6 / 3: When the motion is perfectly isotropic, the ellipsoid of principal basis vectors reduces to a sphere, and the measure of anisotropy from Equation 9 is 0. For convenience, the measure is normalized, and defined as anisotropy factor so that its value ranges from 0 to 1:
36
λ δ= . (10)
If only motion in the horizontal plane is considered, the isotropic variance is defined as
1 2
2mc cc +
= (11)
and the anisotropy factor is defined as
( ) ( )2 21 2
2 21 2
2 m mc c c cc c
λ− + −
=+
(12)
The anisotropy factor defined in this way is proportional to the local directivity factor defined
by Arias (1996). Three-dimensional anisotropy (Equation 10) of ground velocity in Hveragerði is shown in Figure 5, and anisotropy of horizontal ground velocity (Equation 12) is shown in Figure 6. The colours in these figures represent the anisotropy factors interpolated from the ICEARRAY stations using an inverse distance weighted interpolation. The results indicate highly anisotropic motion. The anisotropy factors are slightly larger in three dimensional motion (Figure 5) than in the two dimensional case (Figure 6). This is due to small energy of ground velocity in the vertical direction (see also Figure 3). Considering only the horizontal components of motion, anisotropy is somewhat reduced (Figure 6), but the motion is far from being isotropic like is generally assumed in the far-field. In general, the motion seems to be more anisotropic at stations that are closer to the fault. In Figure 6, anisotropy at the two almost collocated stations IS608 and IS688 are larger than that at other stations that are closer to the fault. These two stations are located on the two sides of a geological fault. Fracture zones associated with the fault is likely to have peculiar orientations, and this might have contributed to larger anisotropy at these stations. The average anisotropy over the array is 0.73 for horizontal ground velocity. For three-dimensional ground velocity, the average

8
anisotropy is 0.82. Considering only the horizontal components of ground velocity, the variance of major component is 4.4 times the minor component, on average.
Figure 5. Anisotropy of three-dimensional ground velocity in Hveragerði.
Figure 6. Anisotropy of horizontal ground velocity in Hveragerði.

R.Rupakhety and R.Sigbjörnsson 9
Elastic response spectra of ground motion recorded at the ICEARRAY stations during the Ölfus Earthquake are shown in Figure 7. Pseudo-spectral accelerations (PSA) for 5% damped single degree of freedom (SDOF) systems are shown in units of g (acceleration due to gravity). The PSA of ground motion in the major horizontal direction, the minor horizontal direction, and the vertical direction, are denoted as 1PSA , 2PSV , and vPSV , respectively. The principal directions in this context are correspond to ground acceleration in the horizontal plane. The spectral ordinates show considerable variation within such a small area covered by the array—approximately 1.5 km by 1.5 km. Higher variations are observed for the major direction, and for stiffer SDOF systems. The average spectral ordinates in the major principal direction are consistently larger—for all natural periods considered here—than those in the minor principal direction (see the blue trace in bottom left plot of Figure 7). However, it is interesting to note that, at some stations, the response spectra in the major direction are lower than that in the minor direction. This implies that a ground motion component with larger variance does not necessarily produce larger spectral accelerations. It seems that at certain stations and for relatively flexible systems, the peak factors (see, for example, Vanmarcke, 1975) in the minor direction might be larger than the peak factors in the major direction. This results in higher spectral accelerations for the minor component despite its variance being lower than that in the major direction.
Figure 7. Elastic response spectra of ground motion recorded by the eleven stations of ICEARRAY
during the Ölfus Earthquake. Pseudo-spectral acceleration for a damping ratio equal to 5% of critical damping is shown. Two top three plots are for, from left to right, the major horizontal direction, the minor horizontal direction, and the vertical direction, respectively. The bottom three plots show the ratio between the response spectra in the different directions, as indicated in the labels of the plots.
The grey traces correspond to individual stations, and the dark blue traces represent the mean values.
At natural periods below 1s, the average spectral ordinates in the two principal horizontal directions are almost equal. At longer periods, however, average spectral acceleration in the major direction is about twice the spectral acceleration in the minor direction. For very stiff systems (natural

10
periods below ~ 0.15 s), average spectral acceleration in the vertical direction is found to be slightly larger than in the two horizontal directions. Between ~0.15s and ~0.8s, the average ratio between PSA in the major direction and PSA in the vertical direction increases from 1 to ~4, and remains fairly stable at longer periods. The average ratio between PSA in the minor direction and the vertical direction increases between ~0.15s to ~0.8s from 1 to ~3, and remains fairly stable at longer periods. Design codes, such as Eurocode 8, recommend a constant ratio between the response spectra in two orthogonal horizontal directions. Our results indicate that these ratios are period-dependent and a constant ratio of, for example 0.3 recommended in Eurocode 8, is not applicable in the near-fault area. Our results imply, on the average, a ratio (between the smaller and the larger horizontal spectra) of almost 1 at periods below ~1s and a ratio of 0.5 at longer periods.
CONCLUSIONS
Strong ground motions recorded by an small-aperture strong-motion array during the 29 May 2008 Mw 6.3 Ölfus Earthquake in south Iceland are analysed to characterize their three-dimensional nature. The characterization is based on three aspects: (i) principal directions of motion (ii) anisotropy of ground-motion variance, and (iii) anisotropy of response spectra. Principal directions of motion are established from the eigenvectors of covariance matrix of motion recorded at a station. At each station, a set of three mutually perpendicular directions is defined along which ground motion is uncorrelated. These directions when ordered in decreasing variance define the major, the intermediate, and the minor principal directions. The relative values of ground-motion variances in these directions indicate the polarization pattern. It is found that the ground acceleration lacks a distinct planar polarization that is commonly reported (see, for example, Penzien and Watabe, 1975) in the literature. In the far field, the minor component of ground acceleration is generally close to the vertical direction, and most of the energy is polarized in the horizontal plane. The near-fault ground acceleration data used in this study, however, have their minor principal direction significantly different from the vertical direction. At some stations, the minor direction was found to be closer to the horizontal plane than the vertical plane. The vertical component of ground acceleration is found to be, at many stations, comparable to the smaller of its two horizontal components. The major direction of ground acceleration across a small area (~ 1.5km by 1.5 km) is found to vary significantly at the different stations of the array. The major direction of ground motion in the near-fault area is found to be, unlike in the far field, different from the epicentral direction. Ground velocities, on the other hand, are found to be more clearly polarized. The plane of polarization is almost horizontal. The minor component of ground velocity is found to be very close to the vertical direction. The polarization directions of ground velocity at different stations of the array are, unlike those of ground acceleration, fairly uniform. The major directions of ground velocity are found to point approximately to the macroseismic epicentre. It is interesting to note that the major direction of ground velocity is not in the fault-normal direction, as would be expected from the polarization of directivity pulse (Rupakhety et al. 2011). This indicates that despite relatively strong velocity pulse in the fault-normal direction in the near-fault area, the total power of ground-velocity signal is not necessarily the largest in the fault-normal direction. Although it is common to project ground-motion in the near-fault area in the fault-normal and the fault-parallel direction, our results indicate that such a projection might not necessarily correspond to uncorrelated components. A new definition of anisotropy of ground motion is proposed. Anisotropy, in this context, is related to the relative values of ground-motion variances in the principal directions. In analogy to the isotropic stress tensor, an isotropic covariance tensor is defined. This tensor corresponds to a hypothetical situation in which the variances of motion in the principal direction are identically equal to the average of the principal variances of recorded motion. The deviation of the principal variances from the isotropic case defines the deviatoric variance tensor. The second invariant of the deviatoric covariance tensor, when suitably normalized, is shown to represent a measure of ground-motion anisotropy. This measure of anisotropy varies from 0 to 1 for purely isotropic (analogous to hydrostatic strain in mechanics) to purely rectilinear motion. Measures of anisotropy are defined considering (i) principal variances of all three components of motion, and (ii) principal variances of only the horizontal components of motion. Ground velocity across the array was found to be highly

R.Rupakhety and R.Sigbjörnsson 11
anisotropic. For horizontal ground velocity, anisotropy values in the range of ~0.6 to ~0.8 were found across the array, with an average value of 0.73. This corresponds to, on the average, the variance of major horizontal component being ~4.4 times that of the minor horizontal component. Anisotropy in ground acceleration was found to be much smaller. On the average, the anisotropy value of ground acceleration in the horizontal plane was found to be 0.27, which corresponds to the major variance being ~1.5 times the minor variance. This indicates that the relatively low-frequency components of motion (that contribute to ground velocity) are more polarized than the relatively high-frequency components of motion (that contribute to ground acceleration). It follows then that how large the major variance is compared to the minor variance is frequency dependent. This frequency dependence is translated, at least partially, to elastic response spectra. It was found that for SDOF systems with relatively large natural vibration frequencies (above ~1 Hz), the 5% damped elastic pseudo-spectral acceleration of the major horizontal component is, on the average, 1.25 times larger than that of the minor horizontal component. At smaller frequencies, however, the ratio between the two is around 2. This is significantly different from the 30% rule for independent orthogonal horizontal spectra specified for structural design in Eurocode 8. For the near-fault ground motion studied here, the average ratio between the major and minor spectral acceleration is around 0.8 at frequencies above 1 Hz, and around 2 at frequencies below 1 Hz. This frequency of 1 Hz corresponds, approximately, to the predominant period of directivity pulses (see, Rupakhety et al., 2011) observed in the ground velocity studied here.
ACKNOWLEDGEMENTS
We acknowledge the support from University of Iceland research fund.
REFERENCES
Arias A (1996) Local directivity of strong ground motion. Paper no 1240, proceedings of the Eleventh
World Conference on Earthquake Engineering, Mexico. Arias A (1970) A measure of earthquake intensity. In: Hansen RJ (ed) Seismic design for nuclear
power plants. MIT Press, Cambridge MA, pp: 438–483 Decriem J, Árnadóttir T, Hooper A, Geirsson H, Sigmundsson F, Keidling M, Ófeigsson G,
Hreinsdóttir S, Einarsson P, LaFemina P, Bennett RA (2010) The 2008 May 29 earthquake doublet in SW Iceland. Geophysics Journal International, 181:1128—1146
Halldorsson B, Sigbjörnsson R (2009) The Mw 6.3 Ölfus earthquake at 15:45 UTC on 29 May 2008 in South Iceland: ICEARRAY strong-motion recordings. Soil Dynamics and Earthquake Engineering, 29(6):1073—1083
Penzien J, Watabe M (1975) Characteristics of 3-dimensional earthquake ground motion. Earthquake Engineering and Structural Dynamics, 3:365—373
Penzien J, Watabe M (1975) Characteristics of 3-dimensional earthquake motions. Earthquake Engineering and Structural Dynamics 3(4):365—374
Rupakhety R, Sigurdsson SU, Papageorgiou AS, Sigbjörnsson R (2011) Quantification of ground-motion parameters and response spectra in the near-fault region. Bulletin of Earthquake Engineering, 9(4):893—930
Rupakhety R, Halldórsson B, Sigbjörnsson R (2010) Estimating coseismic deformations from near source strong motion records: methods and case studies. Bulletin of Earthquake Engineering 8(4):787–811
Rupakhety R, Sigbjörnsson R (2013b) Rotation-invariant mean duration of strong ground motion. Bulletin of Earthquake Engineering, 12:573—584
Sigbjörnsson R, Snæbjörnsson JTh, Higgins SM, Haldorsson, B, Olafsson S (2009) A note on the Mw 6.3 earthquake in Iceland on 29 May 2008 at 15:45 UTC. Bulletin of Earthquake Engineering, 7:113—126

12
Vanmarcke EH (1975) On the distribution of the first-passage time for normal stationary random processes. Journal of Applied Mechanics 432:215—2250