strength and ductility testing of experimental structural ... · pdf filea project report...
TRANSCRIPT

Strength and Ductility Testing of
Experimental Structural Fuses
Rudy Che Lin Wright
A project report submitted to the faculty of
Brigham Young University
in partial fulfillment of the requirements for the degree of
Master of Science
Paul W. Richards
Richard J. Balling
Fernando S. Fonseca
Department of Civil and Environmental Engineering
Brigham Young University
April 2016
Copyright © 2016 Rudy Che Lin Wright
All Rights Reserved


ABSTRACT
Strength and Ductility Testing of
Experimental Structural Fuses
Rudy Wright
Department of Civil and Environmental Engineering, BYU
Master of Science
Small steel specimens were tested for their shear properties to establish a basis for the
development of a structural fuse intended for use in steel moment frames. The purpose of the
experiment was to find optimum geometries that would produce high strength and ductility in the
structural fuse. Varying geometries of rectangular specimens were tested specifically for their
strength, ductility, and energy dissipation characteristics. The specimens with a small width /
height aspect ratio when loaded in the direction of the height exhibited higher strength and
energy dissipation. The geometry of the specimens showed a slight correlation to the ductility of
the fuse. Recommendations have been made for future testing of fuses to improve the fuse
geometries and testing procedures.

ACKNOWLEDGEMENTS
This research was made possible through Brigham Young University and the support
from Dr. Paul Richards. His vision and oversight were an enormous help by providing direction
and encouragement for the study.
I would also like to thank Jacob Linford for the initial research he performed. The testing
and analysis he performed was instrumental and paved the way to further this study.
Special thanks go to all others who helped me in performing this research including my
dear wife, Katie, and my supportive family.

iv
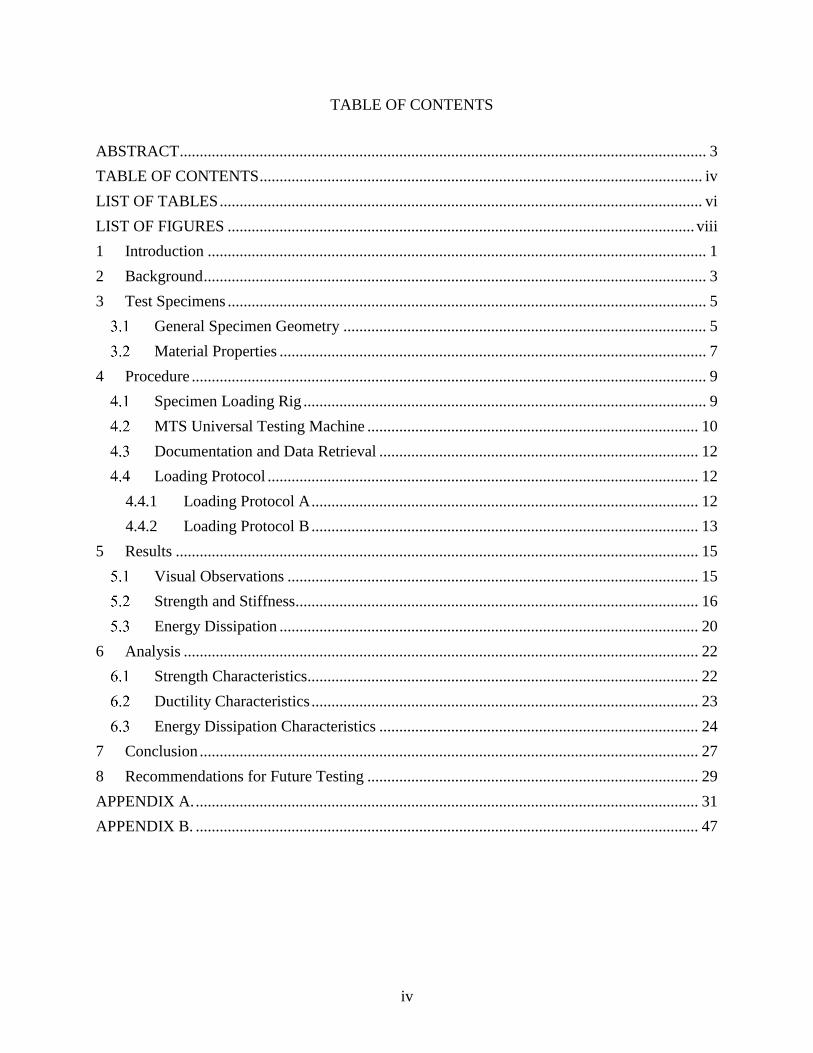
TABLE OF CONTENTS
ABSTRACT .................................................................................................................................... 3
TABLE OF CONTENTS ............................................................................................................... iv
LIST OF TABLES ......................................................................................................................... vi
LIST OF FIGURES ..................................................................................................................... viii
1 Introduction ............................................................................................................................. 1
2 Background .............................................................................................................................. 3
3 Test Specimens ........................................................................................................................ 5
General Specimen Geometry ........................................................................................... 5
Material Properties ........................................................................................................... 7
4 Procedure ................................................................................................................................. 9
Specimen Loading Rig ..................................................................................................... 9
MTS Universal Testing Machine ................................................................................... 10
Documentation and Data Retrieval ................................................................................ 12
Loading Protocol ............................................................................................................ 12
4.4.1 Loading Protocol A ................................................................................................. 12
4.4.2 Loading Protocol B ................................................................................................. 13
5 Results ................................................................................................................................... 15
Visual Observations ....................................................................................................... 15
Strength and Stiffness..................................................................................................... 16
Energy Dissipation ......................................................................................................... 20
6 Analysis ................................................................................................................................. 22
Strength Characteristics.................................................................................................. 22
Ductility Characteristics ................................................................................................. 23
Energy Dissipation Characteristics ................................................................................ 24
7 Conclusion ............................................................................................................................. 27
8 Recommendations for Future Testing ................................................................................... 29
APPENDIX A. .............................................................................................................................. 31
APPENDIX B. .............................................................................................................................. 47

vi
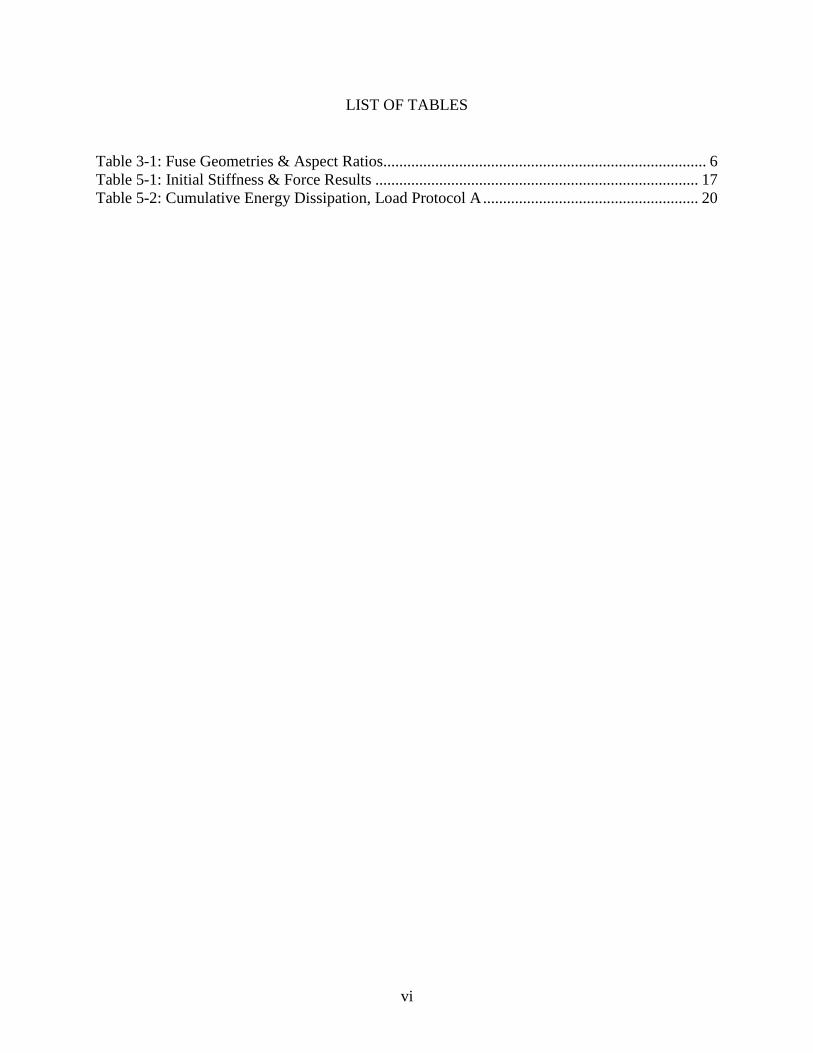
LIST OF TABLES
Table 3-1: Fuse Geometries & Aspect Ratios................................................................................. 6
Table 5-1: Initial Stiffness & Force Results ................................................................................. 17
Table 5-2: Cumulative Energy Dissipation, Load Protocol A ...................................................... 20


viii
LIST OF FIGURES
Figure 3-1: Test Specimen .............................................................................................................. 5
Figure 3-2: General Specimen Geometry ...................................................................................... 6
Figure 3-3: Tension Yield Strength ................................................................................................ 7
Figure 4-1: Assembled Specimen Loading Rig Diagram ............................................................... 9
Figure 4-2: Exploded Loading Rig Diagram ................................................................................ 10
Figure 4-3: Loading Rig in UTS Testing Machine ....................................................................... 11
Figure 4-4: Loading Protocol A .................................................................................................... 13
Figure 4-5: Loading Protocol B .................................................................................................... 14
Figure 5-1: Displaced Fuse Stages ................................................................................................ 16
Figure 5-2: Plastic Displacement Angle vs. Load (Test 3: Specimens 11-17 & 14B) ................. 18
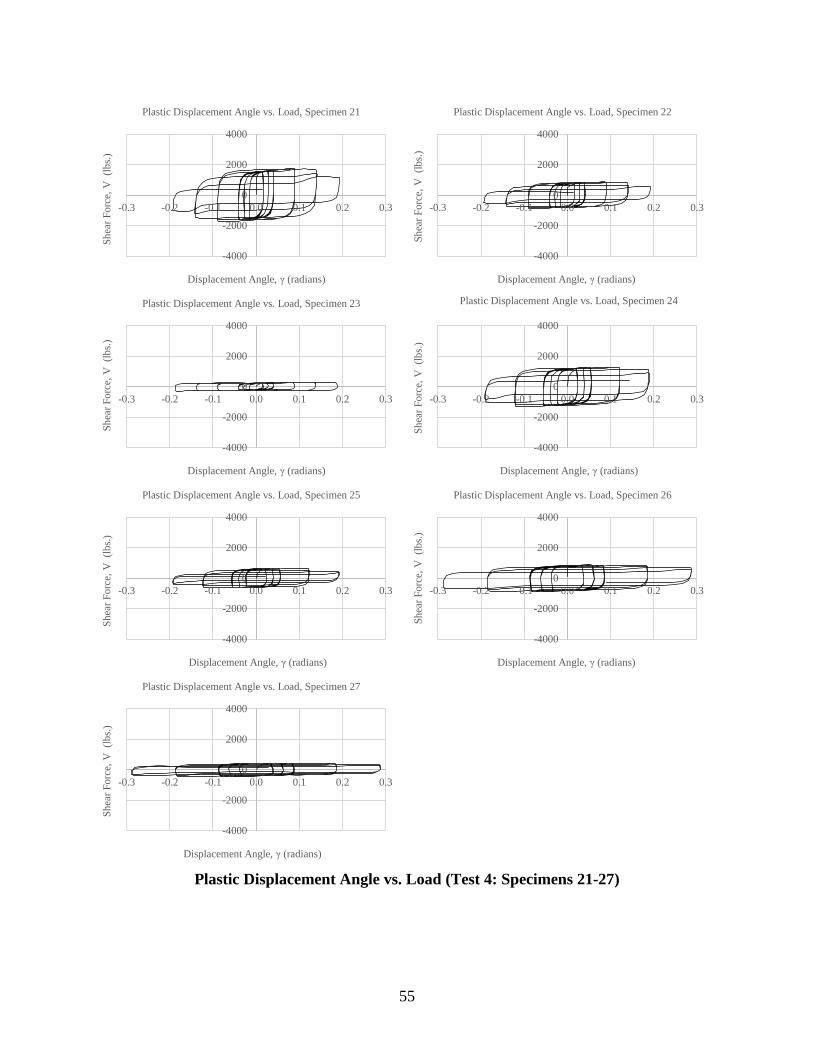
Figure 5-3: Plastic Displacement Angle vs. Load (Test 4: Specimens 21-27) ............................. 19
Figure 5-4: Cumulative Energy Dissipation, Load Protocol A..................................................... 21
Figure 6-1: Aspect Ratio (W / H) vs. Maximum Shear Force ..................................................... 22
Figure 6-2: Aspect Ratio (W / H) vs. Maximum Shear Stress...................................................... 23
Figure 6-3: Aspect Ratio (W / H) vs. Displacement Angle at Max Force .................................... 24
Figure 6-4: Aspect Ratio (W / H) vs. Cumulative Energy Dissipated .......................................... 24
Figure 6-5: Aspect Ratio (W / H) vs. Cumulative Energy Dissipated / Shear Area ..................... 25
Figure 6-6: Aspect Ratio (W / H) vs. Cumulative Energy Dissipated / Shear Volume ................ 26


1
1 INTRODUCTION
The following report will show test procedures and results for small-scale structural fuses tested
for strength and ductility. The intent of the structural fuse is for use with steel moment frames
designed to resist ground-motions due to earthquakes. It is anticipated that the strength and
ductility of a fuse can be predicted based upon the fuse geometry. The results of the tests will be
presented and analyzed to determine optimum fuse configurations and geometries that will result
in both high strength and ductility. These results will provide a basis for a new design of
specialized steel moment frame connections.

2

3
2 BACKGROUND
The design of steel moment frames has evolved in recent history due to increased research and
development of the effectiveness of various connections during earthquakes
The main method for energy dissipation and ductility in steel moment frames is currently
achieved through inelastic rotations and bending in the beams near the connections. These
connections are effective at achieving high levels of ductility and strength, however they require
an extensive amount of preparation and field welding, which in turn increases the construction
time and cost of steel moment frame structures. These systems are effective at maintaining life-
safety, but repairing the moment frame after a significant ground-motion can also be costly.
Other energy dissipation mechanisms include shear deformations (rather than axial or bending
deformations) which are implemented in a select number of lateral force resisting systems. These
shear deformations are of interest because the structural fuse presented in this report relies
mainly on shear deformation. The application presented is a unique application of the energy
dissipation mechanism.
The aim of this research is to develop a structural fuse that has predictable strength and ductility
and can be used in steel moment frame connections. It is anticipated that the implementation of
the structural fuse will improve the constructability and performance of steel moment frames as
well as reduce the costs associated with repairing frames after a major earthquake.

4

5
3 TEST SPECIMENS
Fifteen different specimens were manufactured and tested in two separate runs: Test 3 and
Test 4. An example test specimen is shown in Figure 3-1. Test 3 includes specimens 11-17 and
14B and Test 4 includes specimens 21-27. Specimen 14B was loaded according to a different
loading protocol as noted in section 4.4.2. Test 1 and Test 2 were performed previously,
however, the results are not presented here.
Figure 3-1: Test Specimen
General Specimen Geometry
Figure 3-2 shows the general geometry for all specimens tested. Each specimen consists of two
identical fuses with a specific height and width. See Table 3-1 for a detailed list of all specimens.
The results and analysis in this report have been reduced to consider each fuse, not the dual fuse
specimens.

6
Figure 3-2: General Specimen Geometry
Table 3-1: Fuse Geometries & Aspect Ratios
Specimen Thickness Height Width Shear Area Volume
# (in.) (in.) (in.) (in.2) (in.
3) H / T W / T W / H
11 0.125 1.00 1.00 0.1250 0.1250 8 8 1
12 0.125 1.00 0.75 0.1250 0.0938 8 6 0.75
13 0.125 1.00 0.50 0.1250 0.0625 8 4 0.5
14 0.125 0.75 0.75 0.0938 0.0703 6 6 1
15 0.125 0.75 0.50 0.0938 0.0469 6 4 0.667
16 0.125 0.50 0.50 0.0625 0.0313 4 4 1
17 0.125 0.50 0.25 0.0625 0.0156 4 2 0.5
14B 0.125 0.75 0.75 0.0938 0.0703 6 6 1
21 0.125 0.75 1.00 0.0938 0.0938 6 8 1.333
22 0.125 0.50 1.00 0.0625 0.0625 4 8 2
23 0.125 0.25 1.00 0.0313 0.0313 2 8 4
24 0.125 0.56 0.75 0.0704 0.0528 4.504 6 1.332
25 0.125 0.38 0.75 0.0475 0.0356 3.04 6 1.974
26 0.125 0.38 0.50 0.0475 0.0238 3.04 4 1.316
27 0.125 0.25 0.50 0.0313 0.0156 2 4 2
Aspect Ratio

7
Material Properties
Two tension tests were performed on tension coupons provided by the manufacturer to verify the
material strength of the fuses. The material was found to have an average axial yield strength fy =
52.6 ksi. The yield strength of the material was used to calculate the theoretical yielding force for
each fuse.
Figure 3-3: Tension Yield Strength
fy = 51.8 ksi
0
10
20
30
40
50
60
70
0.0 0.5 1.0 1.5 2.0 2.5
Axia
l S
tres
s (k
si)
Displacement (in.)
Tension Specimen 3A
fy = 53.5 ksi
0
10
20
30
40
50
60
70
0.0 0.5 1.0 1.5 2.0 2.5
Axia
l S
tres
s (k
si)
Displacement (in.)
Tension Specimen 3B

8
9
4 PROCEDURE
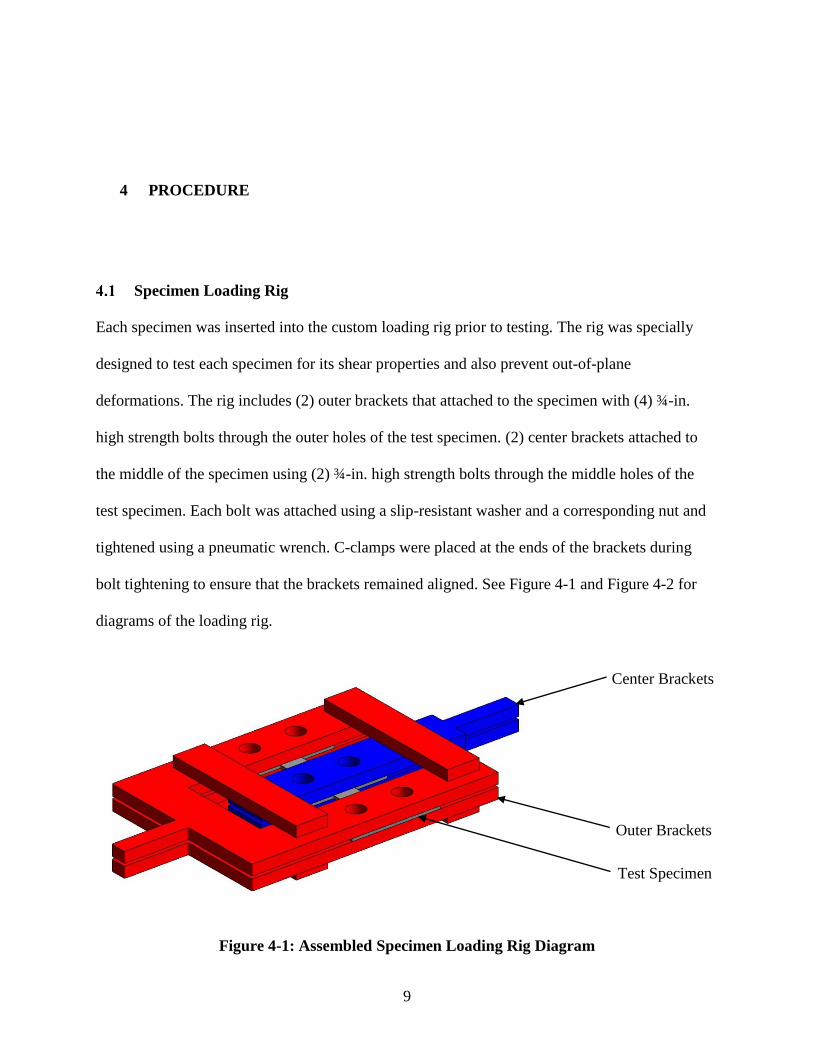
Specimen Loading Rig
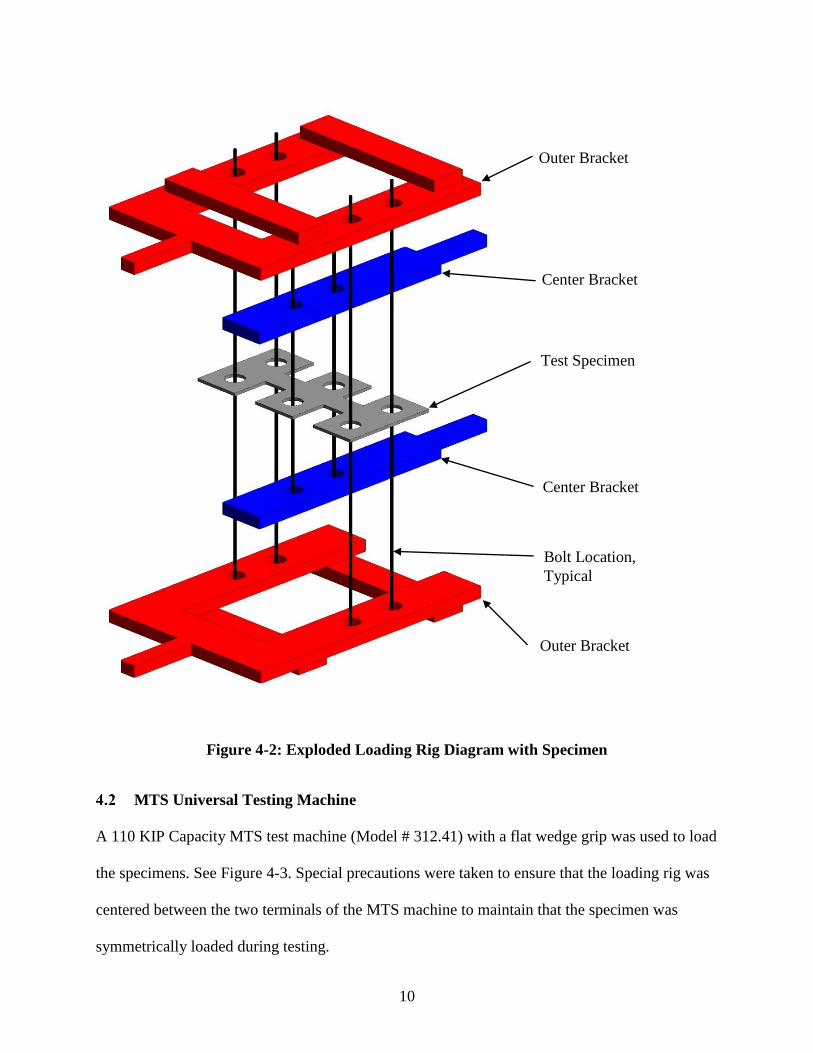
Each specimen was inserted into the custom loading rig prior to testing. The rig was specially
designed to test each specimen for its shear properties and also prevent out-of-plane
deformations. The rig includes (2) outer brackets that attached to the specimen with (4) ¾-in.
high strength bolts through the outer holes of the test specimen. (2) center brackets attached to
the middle of the specimen using (2) ¾-in. high strength bolts through the middle holes of the
test specimen. Each bolt was attached using a slip-resistant washer and a corresponding nut and
tightened using a pneumatic wrench. C-clamps were placed at the ends of the brackets during
bolt tightening to ensure that the brackets remained aligned. See Figure 4-1 and Figure 4-2 for
diagrams of the loading rig.
Figure 4-1: Assembled Specimen Loading Rig Diagram
Outer Brackets
Center Brackets
Test Specimen
10
Figure 4-2: Exploded Loading Rig Diagram with Specimen
MTS Universal Testing Machine
A 110 KIP Capacity MTS test machine (Model # 312.41) with a flat wedge grip was used to load
the specimens. See Figure 4-3. Special precautions were taken to ensure that the loading rig was
centered between the two terminals of the MTS machine to maintain that the specimen was
symmetrically loaded during testing.
Test Specimen
Bolt Location,
Typical
Center Bracket
Center Bracket
Outer Bracket
Outer Bracket

11
Figure 4-3: Loading Rig in UTS machine

12
Documentation and Data Retrieval
Data was recorded by the MTS testing machine and by video. The MTS machine recorded both
loads and displacements every 0.5 seconds. Video documentation was performed for every
specimen.
Loading Protocol
The specimens were loaded cyclically in shear at increasing displacement levels according to the
two loading protocols described in this section. All specimens except specimen 11-17 and 21-27
were tested using Loading Protocol A. Specimen 14B was tested using Loading Protocol B.
4.4.1 Loading Protocol A
The initial set of loads includes six cyclical displacements of ± 0.025 in. at a rate of 0.1 cycles /
second. The second set of loads includes six cyclical displacements of ± 0.0375 in. at a rate of
0.1 cycles / second. The third set of loads includes four cyclical displacements of ± 0.05 in. at a
rate of 0.07 cycles / second. The fourth set of loads includes two cyclical displacements of ± 0.1
in. at a rate of 0.04 cycles per second. The fifth through thirteenth load sets have incrementally
increasing displacements of ± 0.05 in. each with a displacement rate of 0.04 cycles per second.
See Figure 4-4. Numbered labels have been provided in Figure 4-4 at each half-cycle for use in
the analysis of the specimens.

13
Figure 4-4: Loading Protocol A
4.4.2 Loading Protocol B
Loading Protocol B was identical to Loading Protocol A except that the initial load cycles
(cycles 1-32) were omitted. The initial set of loads includes two cyclical displacements of ± 0.1
in. at a rate of 0.04 cycles / second. The second through tenth load sets have incrementally
increasing displacements of ± 0.05 in. each with a displacement rate of 0.04 cycles per second.
See Figure 4-5. Numbered labels have been provided in Figure 4-5 at each half-cycle for use in
the analysis of the specimens.
1
2
3
4
5
6
7
8
9
10
11
12
13
14
15
16
17
18
19
20
21
22
23
24
25
26
27
28
29
30
31
32
33
34
35
36
37
38
39
40
41
42
43
44
45
-0.25
-0.2
-0.15
-0.1
-0.05
0
0.05
0.1
0.15
0.2
0.25
0.3
0 50 100 150 200 250 300 350
Dis
pla
cem
ent
(in
.)
Time (s)

14
Figure 4-5: Loading Protocol B
33
34
35
36
37
38
39
40
41
42
43
44
45
-0.3
-0.2
-0.1
0
0.1
0.2
0.3
0 50 100 150
Dis
pla
cem
ent
(in
.)
Time (s)

15
5 RESULTS
The visual observations of the specimens during testing as well as the strength, stiffness and
energy dissipation characteristics of the specimens have been summarized here. Detailed
summaries of all tested specimens have been included in Appendix A.
Visual Observations
During the initial cycles of loading the fuses deformed plastically without visible signs of failure.
As the displacements of the fuses increased, the fuses showed discoloration of the steel at the
corners of the fuse and some fuses showed discoloration in the center of the shear area. At larger
displacements small cracks appeared at the corners of the fuses and the fuses achieved their
ultimate loads. The small cracks propagated vertically into large tears. The stages of the loading
are shown for specimen 16 in Figure 5-1.

16
Figure 5-1: Initial Fuse (Top-Left) Discolored Fuse (Top-Right)
Cracked Fuse (Bottom-Left) & Torn Fuse (Bottom-Right)
Strength and Stiffness
The stiffness and force results of the test have been summarized in Error! Reference source not
found.. The hysteresis plots for each specimen have been compiled in Appendix B.

17
Table 5-1: Initial Stiffness & Force Results
Due to a low resolution of data recording, especially during the initial loading phase of each
loading protocol, some estimation was used to determine the initial stiffness of each specimen.
Due to the response of some specimens, there may not have been a distinct yield point. For
analysis purposes, the force found at t = 0.5 seconds was applied as the yield force for each
specimen.
The plastic displacement of each specimen at each load step was found by subtracting the elastic
displacement at that load step. The plastic displacement was then converted into a plastic
displacement angle by dividing the displacement by the shear fuse width. See Figure 5-2 and
Figure 5-3 for the compiled plastic displacement angle plots for all specimens.
Initial Yield Maximum Cycle at Displacement Disp. Angle
Specimen Stiffness Force Force Max Force at Max Force at Max Force
# (lb / in.) (lb) (lb) (in.) (rad)
11 228,330 1,592 3,123 35 0.0974 0.097
12 269,135 2,097 3,507 35 0.0940 0.125
13 306,909 2,470 4,000 35 0.0977 0.195
14 200,421 1,399 2,419 34 0.0939 0.125
15 244,891 1,845 2,834 34 0.0889 0.178
16 175,676 1,125 1,589 34 0.0746 0.149
17 230,641 1,069 2,055 34 0.0888 0.355
14B 179,454 1,748 2,653 36* 0.1427 0.190
21 152,316 1,147 1,740 35 0.0975 0.097
22 78,244 493 878 34 0.0889 0.089
23 19,399 108 301 41 0.1949 0.195
24 128,058 644 1,323 34 0.0940 0.125
25 67,869 337 643 26 0.0476 0.063
26 96,246 706 870 26 0.0476 0.095
27 47,672 230 443 16 0.0357 0.071
* Specimen 14B was loaded according to Loading Protocol B.

18
Figure 5-2: Plastic Displacement Angle vs. Load (Test 3: Specimens 11-17 & 14B)
-4000
-2000
0
2000
4000
-0.3 -0.2 -0.1 0.0 0.1 0.2 0.3
Sh
ear
Forc
e, V
(l
bs.
)
Displacement Angle, γ (radians)
Plastic Displacement Angle vs. Load, Specimen 11
-4000
-2000
0
2000
4000
-0.3 -0.2 -0.1 0.0 0.1 0.2 0.3
Sh
ear
Forc
e, V
(l
bs.
)
Displacement Angle, γ (radians)
Plastic Displacement Angle vs. Load, Specimen 12
-4000
-2000
0
2000
4000
-0.3 -0.2 -0.1 0.0 0.1 0.2 0.3
Sh
ear
Forc
e, V
(l
bs.
)
Displacement Angle, γ (radians)
Plastic Displacement Angle vs. Load, Specimen 13
-4000
-2000
0
2000
4000
-0.3 -0.2 -0.1 0.0 0.1 0.2 0.3
Sh
ear
Forc
e, V
(l
bs.
)
Displacement Angle, γ (radians)
Plastic Displacement Angle vs. Load, Specimen 14
-4000
-2000
0
2000
4000
-0.3 -0.2 -0.1 0.0 0.1 0.2 0.3
Sh
ear
Forc
e, V
(l
bs.
)
Displacement Angle, γ (radians)
Plastic Displacement Angle vs. Load, Specimen 15
-4000
-2000
0
2000
4000
-0.3 -0.2 -0.1 0.0 0.1 0.2 0.3
Sh
ear
Forc
e, V
(l
bs.
)
Displacement Angle, γ (radians)
Plastic Displacement Angle vs. Load, Specimen 16
-4000
-2000
0
2000
4000
-0.3 -0.2 -0.1 0.0 0.1 0.2 0.3
Sh
ear
Forc
e, V
(l
bs.
)
Displacement Angle, γ (radians)
Plastic Displacement Angle vs. Load, Specimen 17
-4000
-2000
0
2000
4000
-0.3 -0.2 -0.1 0.0 0.1 0.2 0.3
Sh
ear
Forc
e, V
(l
bs.
)
Displacement Angle, γ (radians)
Plastic Displacement Angle vs. Load, Specimen 14B

19
Figure 5-3: Plastic Displacement Angle vs. Load (Test 4: Specimens 21-27)
-4000
-2000
0
2000
4000
-0.3 -0.2 -0.1 0.0 0.1 0.2 0.3
Sh
ear
Forc
e, V
(l
bs.
)
Displacement Angle, γ (radians)
Plastic Displacement Angle vs. Load, Specimen 21
-4000
-2000
0
2000
4000
-0.3 -0.2 -0.1 0.0 0.1 0.2 0.3
Sh
ear
Forc
e, V
(l
bs.
)
Displacement Angle, γ (radians)
Plastic Displacement Angle vs. Load, Specimen 22
-4000
-2000
0
2000
4000
-0.3 -0.2 -0.1 0.0 0.1 0.2 0.3
Sh
ear
Forc
e, V
(l
bs.
)
Displacement Angle, γ (radians)
Plastic Displacement Angle vs. Load, Specimen 23
-4000
-2000
0
2000
4000
-0.3 -0.2 -0.1 0.0 0.1 0.2 0.3
Sh
ear
Forc
e, V
(l
bs.
)
Displacement Angle, γ (radians)
Plastic Displacement Angle vs. Load, Specimen 24
-4000
-2000
0
2000
4000
-0.3 -0.2 -0.1 0.0 0.1 0.2 0.3
Sh
ear
Forc
e, V
(l
bs.
)
Displacement Angle, γ (radians)
Plastic Displacement Angle vs. Load, Specimen 25
-4000
-2000
0
2000
4000
-0.3 -0.2 -0.1 0.0 0.1 0.2 0.3
Sh
ear
Forc
e, V
(l
bs.
)
Displacement Angle, γ (radians)
Plastic Displacement Angle vs. Load, Specimen 26
-4000
-2000
0
2000
4000
-0.3 -0.2 -0.1 0.0 0.1 0.2 0.3
Sh
ear
Forc
e, V
(l
bs.
)
Displacement Angle, γ (radians)
Plastic Displacement Angle vs. Load, Specimen 27

20
Energy Dissipation
The cumulative energy dissipated by the shear fuses was calculated by summing over time the
product of the force and displacement at each time step. Cycle 32 was used as an arbitrary
measuring point for the cumulative energy dissipated.
The energy dissipation results have been summarized for Loading Protocol A in Error!
Reference source not found. and are shown graphically in Figure 5-4.
Table 5-2: Cumulative Energy Dissipation, Load Protocol A
Energy Energy Diss. / Energy Diss. / Energy Diss. / Energy Diss. /
Specimen Dissipated Height Width Shear Area Volume
# (kip-in.) (kip-in. / in.) (kip-in. / in.) (kip-in. / in.2) (kip-in. / in.
3)
11 3,685 3,685 3,685 29,479 29,479
12 4,286 4,286 5,715 34,289 45,719
13 4,988 4,988 9,975 39,900 79,801
14 3,117 4,155 4,155 33,244 44,325
15 3,818 5,091 7,636 40,724 81,449
16 2,370 4,739 4,739 37,914 75,828
17 3,170 6,341 12,681 50,724 202,898
21 2,281 3,041 3,041 24,330 24,330
22 1,179 1,571 1,179 18,858 18,858
23 296 592 296 9,477 9,477
24 1,866 7,465 1,866 26,520 35,360
25 980 1,740 1,306 20,626 27,501
26 1,381 3,634 1,841 29,076 58,152
27 705 1,855 1,410 22,553 45,106
*Energy dissipated is the cumulative energy lost to plastic deformation at load cycle 32

21
Figure 5-4: Cumulative Energy Dissipation, Load Protocol A
11
12
13
14
15
16
17
21
22
23
24
25
26
27
0
1000
2000
3000
4000
5000
6000
0 50 100 150 200 250 300 350 400
Cu
mu
lati
ve
En
ergy D
issi
pat
ed (
kip
-in
.)
Time (s)

22
6 ANALYSIS
The (W / H) aspect ratios of the specimens were used as a comparison tool between test
specimens in all categories. This parameter was correlative in the analysis of the testing of the
shear fuses and is useful in making conclusive statements about the fuse geometries.
Strength Characteristics
The fuses in general exhibited strength proportional to the shear area of the fuse. The specimens
with smaller (W / H) aspect ratios generally achieved higher maximum force values than those
specimens with (W / H) aspect ratios ≥ 1. See Figure 6-1. Specimens with (W / H) aspect ratios
≤ 1 also achieved higher maximum shear stresses, see Figure 6-2.
Figure 6-1: Aspect Ratio (W / H) vs. Maximum Shear Force
11
12
13
14
15
16
17
14B
21
22
23
24
2526
27
-
500
1,000
1,500
2,000
2,500
3,000
3,500
4,000
4,500
0 0.5 1 1.5 2 2.5 3 3.5 4 4.5
Max
Sh
ear
Forc
e, V
(lb
)
Aspect Ratio (W / H)

23
Figure 6-2: Aspect Ratio (W / H) vs. Maximum Shear Stress
Ductility Characteristics
Each of the fuses generally achieved the same range of load cycles and displacements before
weakening occurred, with the exception of the fuses with very high (W / H) aspect ratios. The
displacement angles at the maximum load however was different for each specimen. A majority
of the fuses achieved a displacement angle between 0.06 and 0.2 radians. Specimen 17 had an
outlier displacement angle of 0.355 radians. See Figure 6-3. The relatively large size of the fillets
at the corners of specimen 17 may have decreased the stress concentrations at the corners of the
fuse, allowing the fuse to achieve a much higher displacement angle before cracking.
11
12
13
14
15
16
17
14B
21
22
23
24
25
26
27
0
5
10
15
20
25
30
35
0 0.5 1 1.5 2 2.5 3 3.5 4 4.5
Max
Sh
ear
Str
ess,
τ(k
si)
Aspect Ratio (W / H)

24
Figure 6-3: Aspect Ratio (W / H) vs. Displacement Angle at Max Force
Energy Dissipation Characteristics
The fuses with smaller (W / H) aspect ratios generally dissipated more energy than those with
high (W / H) aspect ratios, see Figure 6-4.
Figure 6-4: Aspect Ratio (W / H) vs. Cumulative Energy Dissipated
11
12
13
14
15
16
17
14B
21 22
23
24
25
26 27
0.00
0.05
0.10
0.15
0.20
0.25
0.30
0.35
0.40
0 0.5 1 1.5 2 2.5 3 3.5 4 4.5
Dis
pla
cem
ent
An
gle
, γ
(rad
)
Aspect Ratio (W / H)
11
12
13
14
15
16
17
21
22
23
24
25
26
27
-
1,000
2,000
3,000
4,000
5,000
6,000
0 0.5 1 1.5 2 2.5 3 3.5 4 4.5
En
ergy D
issi
pat
ed (
kip
-in
.)
Aspect Ratio (W / H)
25
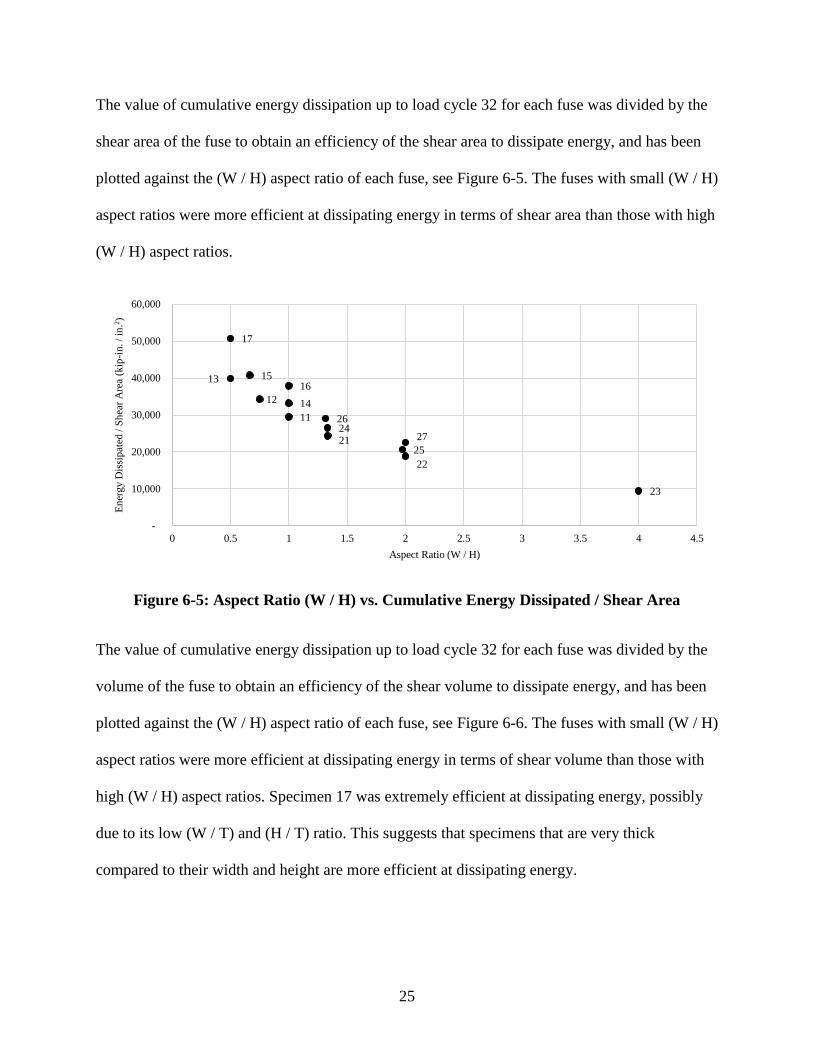
The value of cumulative energy dissipation up to load cycle 32 for each fuse was divided by the
shear area of the fuse to obtain an efficiency of the shear area to dissipate energy, and has been
plotted against the (W / H) aspect ratio of each fuse, see Figure 6-5. The fuses with small (W / H)
aspect ratios were more efficient at dissipating energy in terms of shear area than those with high
(W / H) aspect ratios.
Figure 6-5: Aspect Ratio (W / H) vs. Cumulative Energy Dissipated / Shear Area
The value of cumulative energy dissipation up to load cycle 32 for each fuse was divided by the
volume of the fuse to obtain an efficiency of the shear volume to dissipate energy, and has been
plotted against the (W / H) aspect ratio of each fuse, see Figure 6-6. The fuses with small (W / H)
aspect ratios were more efficient at dissipating energy in terms of shear volume than those with
high (W / H) aspect ratios. Specimen 17 was extremely efficient at dissipating energy, possibly
due to its low (W / T) and (H / T) ratio. This suggests that specimens that are very thick
compared to their width and height are more efficient at dissipating energy.
11
12
13
14
1516
17
21
22
23
24
25
26
27
-
10,000
20,000
30,000
40,000
50,000
60,000
0 0.5 1 1.5 2 2.5 3 3.5 4 4.5
En
ergy D
issi
pat
ed / S
hea
r A
rea
(kip
-in
. /
in.2
)
Aspect Ratio (W / H)

26
Figure 6-6: Aspect Ratio (W / H) vs. Cumulative Energy Dissipated / Shear Volume
1112
13
14
1516
17
21 22 23
2425
2627
-
50,000
100,000
150,000
200,000
250,000
0 0.5 1 1.5 2 2.5 3 3.5 4 4.5
En
ergy D
issi
pat
ed / S
hea
r V
olu
me
(kip
-in
. /
in.3
)
Aspect Ratio (W / H)

27
7 CONCLUSION
The results and analysis of the testing show that the specimens with a small (W / H) aspect ratio
performed much better in terms of strength and energy dissipation. Those specimens in Test 3
(11-17 & 14B) all had (W / H) aspect ratios ≤ 1 and outperformed the specimens tested in Test 4.
It is also noted that specimens with low (W / T) ratios and low (H / T) ratios may be more
efficient at dissipating energy. There was not a strong correlation between the fuse geometry and
the ductility of the specimen, however Section 8 contains recommendations on improvements
that can be made to the fuse geometries that could potentially improve ductility.

28

29
8 RECOMMENDATIONS FOR FUTURE TESTING
The following are recommendations for future testing to improve upon the geometries of the
fuses and to improve the testing procedure.
1) Most specimens achieved approximately the same levels of displacements regardless of
geometry. This may be due to the stress concentrations and cracking at the corners of the
fuses that developed because of the small fillets at the corners. Modifying the geometry
of the fuses by increasing the size of the fillets or by using a non-rectangular geometry
may improve the strength and ductility of the fuse.
2) The relative thickness of the fuses may significantly affect the strength and ductility of
the fuse. Further testing should be performed on specimens with small (W / H) aspect
ratios with varying relative thicknesses.
3) Due to a low resolution of data recording by the MTS machine (data was recorded every
0.5 seconds) some estimation was made to find the initial stiffness and the yield force of
each specimen. It is recommended that, if possible, a higher resolution be used so that a
distinct yield force and stiffness can be found from the recorded data.

30

31
APPENDIX A.

32
Height H = 1 in.
Width W = 1 in.
Thickness t = 0.125 in.
Height : Width H : W = 1
Height : Thickness H : t = 8
Width : Thickness W : t = 8
Shear Area A = 0.1250 in.2
Initial Stiffness k = 228,330 kip / in.
Maximum Force F = 3,123 lbs.
Max. Shear Stress τmax = 24,985 lbs. / in.2
Disp. at Max Force Δmax force = 0.0974 in.
Angle at Max Force γmax force = 0.0974 rad.
Cycle at Max Force Cycle = 35 Specimen 11 Dimensions
Energy Dissipated34 E34 = 5,003 kip-in.
Energy Dissipated32 E32 = 3,685 kip-in.
Specimen 11 at time 3:36 (Cycle 35, Load Protocol A) of cyclic shear testing
Specimen 11
Aspect Ratios
Max Force, C35 3,123 lbs
-4000
-3000
-2000
-1000
0
1000
2000
3000
4000
-0.4 -0.2 0.0 0.2 0.4
Sh
ear
Fo
rce,
V (
lbs.
)
Plastic Displacement Angle, γ (radians)
Shear Force, V vs. Plastic Displacement Angle, γ
33
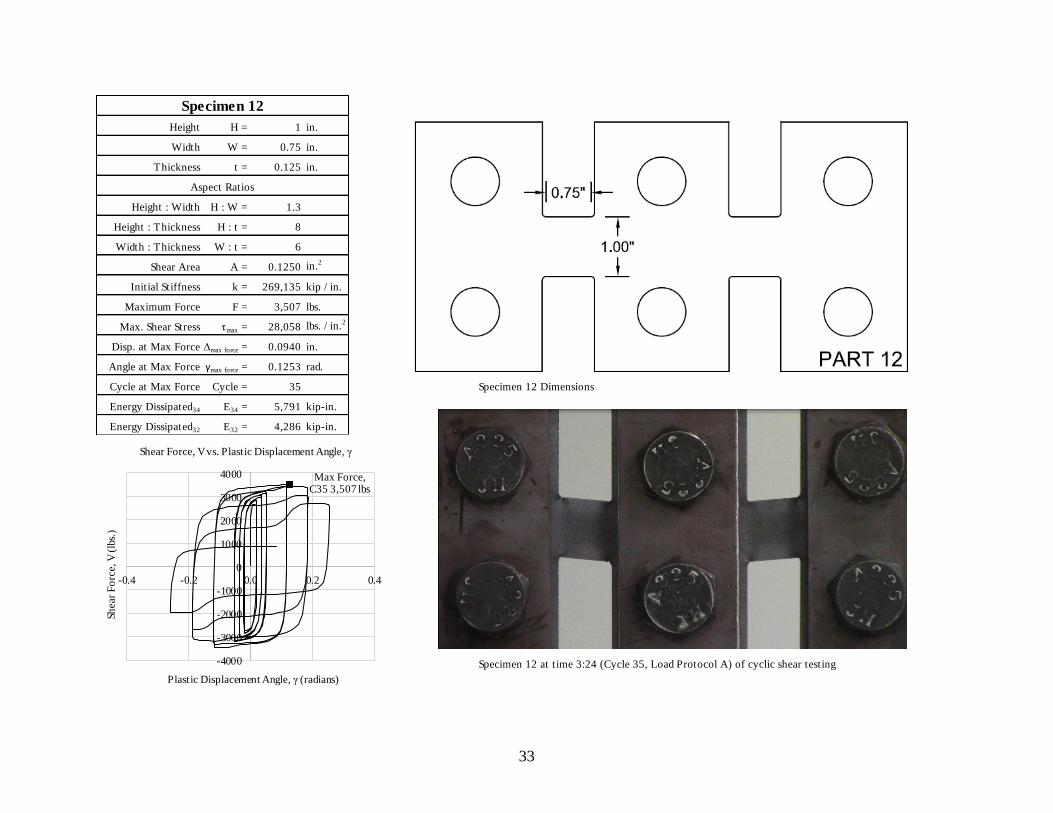
Height H = 1 in.
Width W = 0.75 in.
Thickness t = 0.125 in.
Height : Width H : W = 1.3
Height : Thickness H : t = 8
Width : Thickness W : t = 6
Shear Area A = 0.1250 in.2
Initial Stiffness k = 269,135 kip / in.
Maximum Force F = 3,507 lbs.
Max. Shear Stress τmax = 28,058 lbs. / in.2
Disp. at Max Force Δmax force = 0.0940 in.
Angle at Max Force γmax force = 0.1253 rad.
Cycle at Max Force Cycle = 35 Specimen 12 Dimensions
Energy Dissipated34 E34 = 5,791 kip-in.
Energy Dissipated32 E32 = 4,286 kip-in.
Specimen 12 at time 3:24 (Cycle 35, Load Protocol A) of cyclic shear testing
Specimen 12
Aspect Ratios
Max Force, C35 3,507 lbs
-4000
-3000
-2000
-1000
0
1000
2000
3000
4000
-0.4 -0.2 0.0 0.2 0.4
Sh
ear
Fo
rce,
V (
lbs.
)
Plastic Displacement Angle, γ (radians)
Shear Force, V vs. Plastic Displacement Angle, γ

34
Height H = 1 in.
Width W = 0.5 in.
Thickness t = 0.125 in.
Height : Width H : W = 2
Height : Thickness H : t = 8
Width : Thickness W : t = 4
Shear Area A = 0.1250 in.2
Initial Stiffness k = 306,909 kip / in.
Maximum Force F = 4,000 lbs.
Max. Shear Stress τmax = 32,002 lbs. / in.2
Disp. at Max Force Δmax force = 0.0977 in.
Angle at Max Force γmax force = 0.1953 rad.
Cycle at Max Force Cycle = 35 Specimen 13 Dimensions
Energy Dissipated34 E34 = 6,729 kip-in.
Energy Dissipated32 E32 = 4,988 kip-in.
Specimen 13 at time 3:21 (Cycle 35, Load Protocol A) of cyclic shear testing
Specimen 13
Aspect Ratios
Max Force, C35 4,000 lbs
-5000
-4000
-3000
-2000
-1000
0
1000
2000
3000
4000
5000
-0.4 -0.2 0.0 0.2 0.4
Sh
ear
Fo
rce,
V (
lbs.
)
Plastic Displacement Angle, γ (radians)
Shear Force, V vs. Plastic Displacement Angle, γ
35
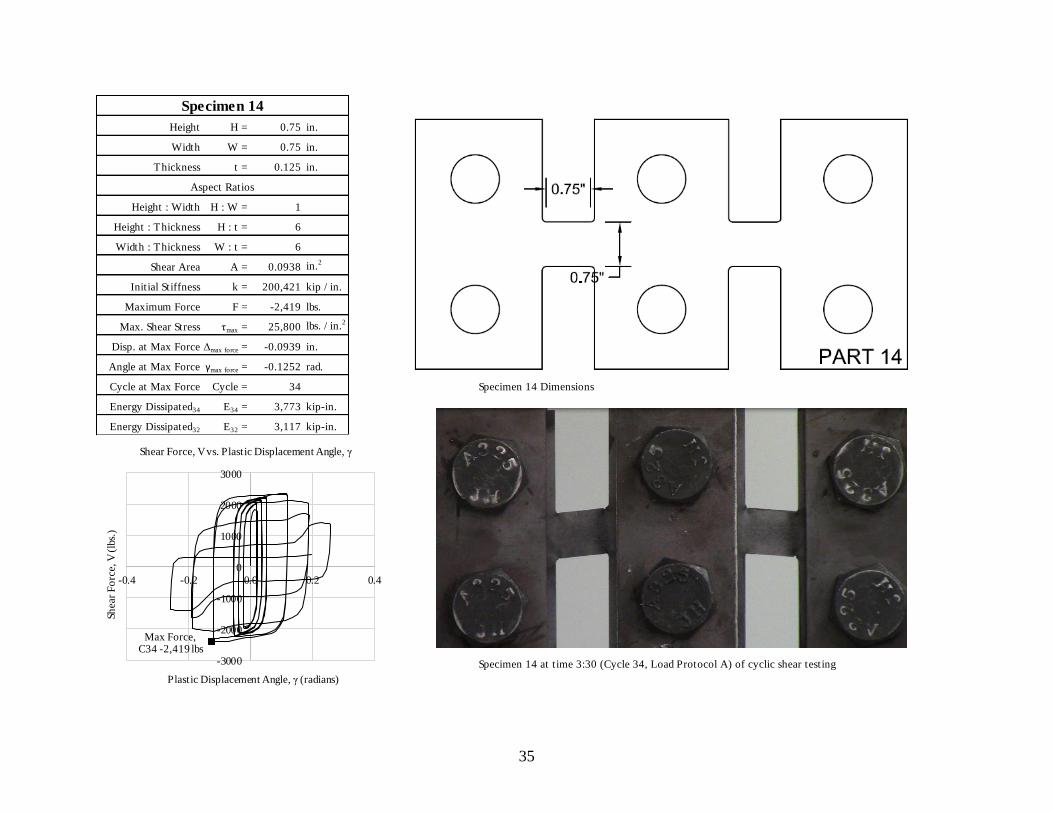
Height H = 0.75 in.
Width W = 0.75 in.
Thickness t = 0.125 in.
Height : Width H : W = 1
Height : Thickness H : t = 6
Width : Thickness W : t = 6
Shear Area A = 0.0938 in.2
Initial Stiffness k = 200,421 kip / in.
Maximum Force F = -2,419 lbs.
Max. Shear Stress τmax = 25,800 lbs. / in.2
Disp. at Max Force Δmax force = -0.0939 in.
Angle at Max Force γmax force = -0.1252 rad.
Cycle at Max Force Cycle = 34 Specimen 14 Dimensions
Energy Dissipated34 E34 = 3,773 kip-in.
Energy Dissipated32 E32 = 3,117 kip-in.
Specimen 14 at time 3:30 (Cycle 34, Load Protocol A) of cyclic shear testing
Specimen 14
Aspect Ratios
Max Force, C34 -2,419 lbs
-3000
-2000
-1000
0
1000
2000
3000
-0.4 -0.2 0.0 0.2 0.4
Sh
ear
Fo
rce,
V (
lbs.
)
Plastic Displacement Angle, γ (radians)
Shear Force, V vs. Plastic Displacement Angle, γ
36
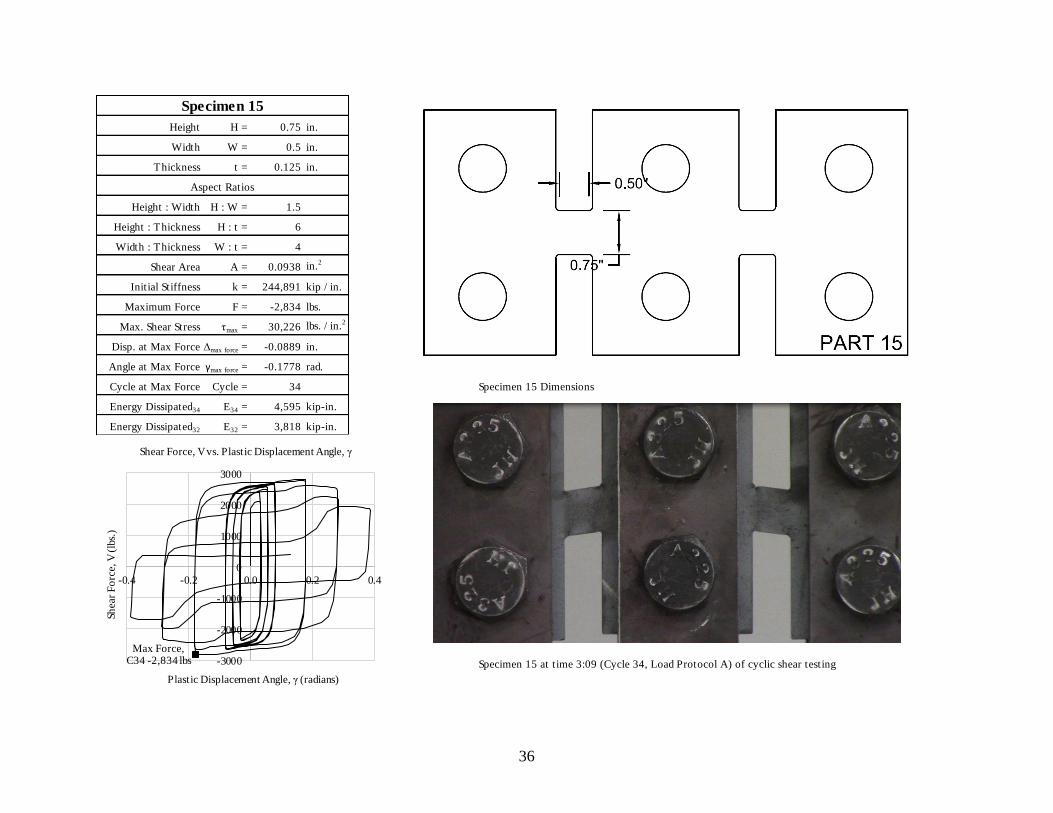
Height H = 0.75 in.
Width W = 0.5 in.
Thickness t = 0.125 in.
Height : Width H : W = 1.5
Height : Thickness H : t = 6
Width : Thickness W : t = 4
Shear Area A = 0.0938 in.2
Initial Stiffness k = 244,891 kip / in.
Maximum Force F = -2,834 lbs.
Max. Shear Stress τmax = 30,226 lbs. / in.2
Disp. at Max Force Δmax force = -0.0889 in.
Angle at Max Force γmax force = -0.1778 rad.
Cycle at Max Force Cycle = 34 Specimen 15 Dimensions
Energy Dissipated34 E34 = 4,595 kip-in.
Energy Dissipated32 E32 = 3,818 kip-in.
Specimen 15 at time 3:09 (Cycle 34, Load Protocol A) of cyclic shear testing
Specimen 15
Aspect Ratios
Max Force, C34 -2,834 lbs -3000
-2000
-1000
0
1000
2000
3000
-0.4 -0.2 0.0 0.2 0.4
Sh
ear
Fo
rce,
V (
lbs.
)
Plastic Displacement Angle, γ (radians)
Shear Force, V vs. Plastic Displacement Angle, γ

37
Height H = 0.5 in.
Width W = 0.5 in.
Thickness t = 0.125 in.
Height : Width H : W = 1
Height : Thickness H : t = 4
Width : Thickness W : t = 4
Shear Area A = 0.0625 in.2
Initial Stiffness k = 175,676 kip / in.
Maximum Force F = -1,589 lbs.
Max. Shear Stress τmax = 25,424 lbs. / in.2
Disp. at Max Force Δmax force = -0.0746 in.
Angle at Max Force γmax force = -0.1493 rad.
Cycle at Max Force Cycle = 34 Specimen 16 Dimensions
Energy Dissipated34 E34 = 2,792 kip-in.
Energy Dissipated32 E32 = 2,370 kip-in.
Specimen 16 at time 3:16 (Cycle 34, Load Protocol A) of cyclic shear testing
Specimen 16
Aspect Ratios
Max Force, C34 -1,589 lbs
-2000
-1500
-1000
-500
0
500
1000
1500
2000
-0.4 -0.2 0.0 0.2 0.4
Sh
ear
Fo
rce,
V (
lbs.
)
Plastic Displacement Angle, γ (radians)
Shear Force, V vs. Plastic Displacement Angle, γ
38
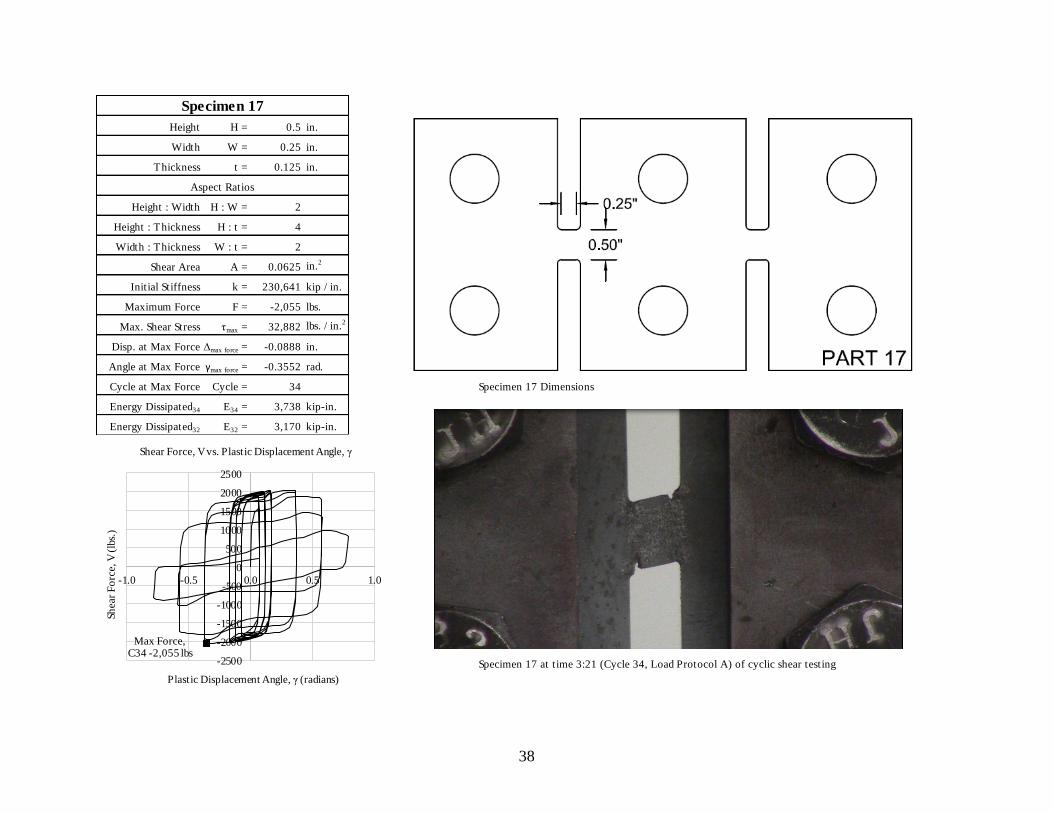
Height H = 0.5 in.
Width W = 0.25 in.
Thickness t = 0.125 in.
Height : Width H : W = 2
Height : Thickness H : t = 4
Width : Thickness W : t = 2
Shear Area A = 0.0625 in.2
Initial Stiffness k = 230,641 kip / in.
Maximum Force F = -2,055 lbs.
Max. Shear Stress τmax = 32,882 lbs. / in.2
Disp. at Max Force Δmax force = -0.0888 in.
Angle at Max Force γmax force = -0.3552 rad.
Cycle at Max Force Cycle = 34 Specimen 17 Dimensions
Energy Dissipated34 E34 = 3,738 kip-in.
Energy Dissipated32 E32 = 3,170 kip-in.
Specimen 17 at time 3:21 (Cycle 34, Load Protocol A) of cyclic shear testing
Specimen 17
Aspect Ratios
Max Force, C34 -2,055 lbs
-2500
-2000
-1500
-1000
-500
0
500
1000
1500
2000
2500
-1.0 -0.5 0.0 0.5 1.0
Sh
ear
Fo
rce,
V (
lbs.
)
Plastic Displacement Angle, γ (radians)
Shear Force, V vs. Plastic Displacement Angle, γ
39
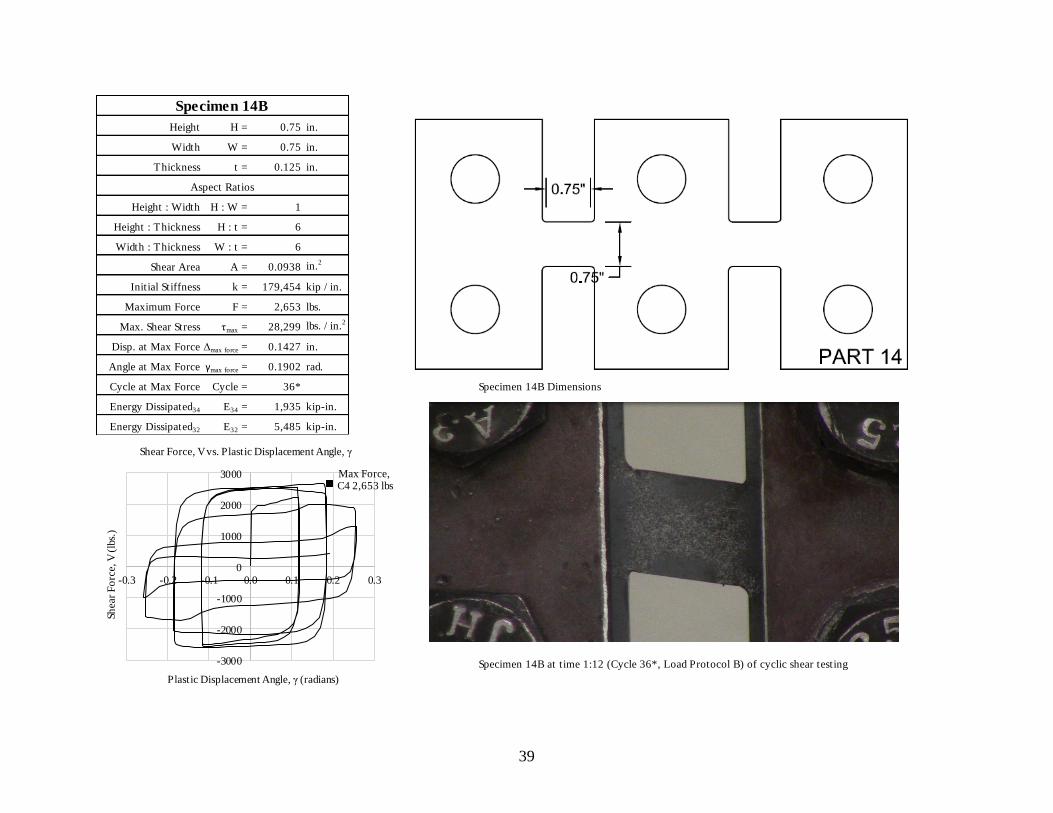
Height H = 0.75 in.
Width W = 0.75 in.
Thickness t = 0.125 in.
Height : Width H : W = 1
Height : Thickness H : t = 6
Width : Thickness W : t = 6
Shear Area A = 0.0938 in.2
Initial Stiffness k = 179,454 kip / in.
Maximum Force F = 2,653 lbs.
Max. Shear Stress τmax = 28,299 lbs. / in.2
Disp. at Max Force Δmax force = 0.1427 in.
Angle at Max Force γmax force = 0.1902 rad.
Cycle at Max Force Cycle = 36* Specimen 14B Dimensions
Energy Dissipated34 E34 = 1,935 kip-in.
Energy Dissipated32 E32 = 5,485 kip-in.
Specimen 14B at time 1:12 (Cycle 36*, Load Protocol B) of cyclic shear testing
Specimen 14B
Aspect Ratios
Max Force, C4 2,653 lbs
-3000
-2000
-1000
0
1000
2000
3000
-0.3 -0.2 -0.1 0.0 0.1 0.2 0.3
Sh
ear
Fo
rce,
V (
lbs.
)
Plastic Displacement Angle, γ (radians)
Shear Force, V vs. Plastic Displacement Angle, γ

40
Height H = 0.75 in.
Width W = 1 in.
Thickness t = 0.125 in.
Height : Width H : W = 0.8
Height : Thickness H : t = 6
Width : Thickness W : t = 8
Shear Area A = 0.0938 in.2
Initial Stiffness k = 152,316 kip / in.
Maximum Force F = 1,740 lbs.
Max. Shear Stress τmax = 18,561 lbs. / in.2
Disp. at Max Force Δmax force = 0.0975 in.
Angle at Max Force γmax force = 0.0975 rad.
Cycle at Max Force Cycle = 35 Specimen 21 Dimensions
Energy Dissipated34 E34 = 3,039 kip-in.
Energy Dissipated32 E32 = 2,281 kip-in.
Specimen 21 at time 3:28 (Cycle 35, Load Protocol A) of cyclic shear testing
Specimen 21
Aspect Ratios
Max Force, C35 1,740 lbs
-2000
-1500
-1000
-500
0
500
1000
1500
2000
-0.3 -0.2 -0.1 0.0 0.1 0.2 0.3
Sh
ear
Fo
rce,
V (
lbs.
)
Plastic Displacement Angle, γ (radians)
Shear Force, V vs. Plastic Displacement Angle, γ

41
Height H = 0.5 in.
Width W = 1 in.
Thickness t = 0.125 in.
Height : Width H : W = 0.5
Height : Thickness H : t = 4
Width : Thickness W : t = 8
Shear Area A = 0.0625 in.2
Initial Stiffness k = 78,244 kip / in.
Maximum Force F = -878 lbs.
Max. Shear Stress τmax = 14,053 lbs. / in.2
Disp. at Max Force Δmax force = -0.0889 in.
Angle at Max Force γmax force = -0.0889 rad.
Cycle at Max Force Cycle = 34 Specimen 22 Dimensions
Energy Dissipated34 E34 = 1,415 kip-in.
Energy Dissipated32 E32 = 1,179 kip-in.
Specimen 22 at time 3:20 (Cycle 34, Load Protocol A) of cyclic shear testing
Specimen 22
Aspect Ratios
Max Force, C34 -878 lbs
-1000
-800
-600
-400
-200
0
200
400
600
800
1000
-0.3 -0.2 -0.1 0.0 0.1 0.2 0.3
Sh
ear
Fo
rce,
V (
lbs.
)
Plastic Displacement Angle, γ (radians)
Shear Force, V vs. Plastic Displacement Angle, γ

42
Height H = 0.25 in.
Width W = 1 in.
Thickness t = 0.125 in.
Height : Width H : W = 0.3
Height : Thickness H : t = 2
Width : Thickness W : t = 8
Shear Area A = 0.0313 in.2
Initial Stiffness k = 19,399 kip / in.
Maximum Force F = 301 lbs.
Max. Shear Stress τmax = 9,646 lbs. / in.2
Disp. at Max Force Δmax force = 0.1949 in.
Angle at Max Force γmax force = 0.1949 rad.
Cycle at Max Force Cycle = 41 Specimen 23 Dimensions
Energy Dissipated34 E34 = 765 kip-in.
Energy Dissipated32 E32 = 296 kip-in.
Specimen 23 at time 4:43 (Cycle 41, Load Protocol A) of cyclic shear testing
Specimen 23
Aspect Ratios
Max Force, C41 301 lbs
-400
-300
-200
-100
0
100
200
300
400
-0.3 -0.2 -0.1 0.0 0.1 0.2 0.3
Sh
ear
Fo
rce,
V (
lbs.
)
Plastic Displacement Angle, γ (radians)
Shear Force, V vs. Plastic Displacement Angle, γ
43
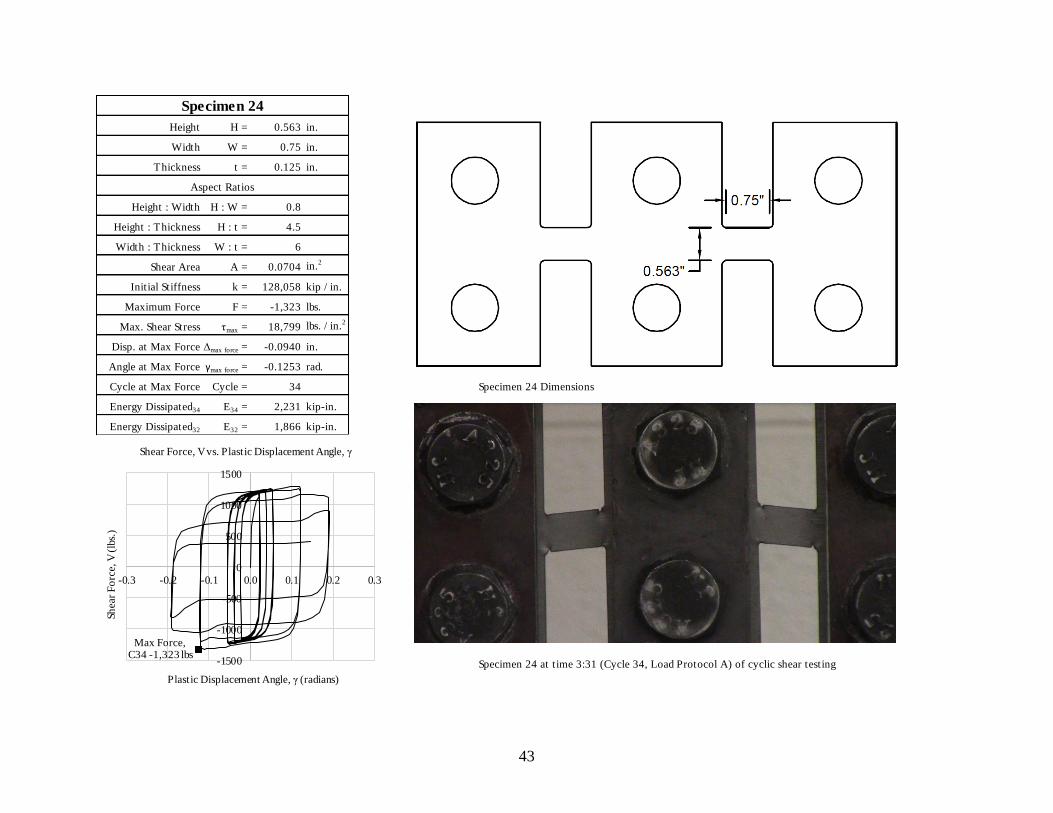
Height H = 0.563 in.
Width W = 0.75 in.
Thickness t = 0.125 in.
Height : Width H : W = 0.8
Height : Thickness H : t = 4.5
Width : Thickness W : t = 6
Shear Area A = 0.0704 in.2
Initial Stiffness k = 128,058 kip / in.
Maximum Force F = -1,323 lbs.
Max. Shear Stress τmax = 18,799 lbs. / in.2
Disp. at Max Force Δmax force = -0.0940 in.
Angle at Max Force γmax force = -0.1253 rad.
Cycle at Max Force Cycle = 34 Specimen 24 Dimensions
Energy Dissipated34 E34 = 2,231 kip-in.
Energy Dissipated32 E32 = 1,866 kip-in.
Specimen 24 at time 3:31 (Cycle 34, Load Protocol A) of cyclic shear testing
Specimen 24
Aspect Ratios
Max Force, C34 -1,323 lbs
-1500
-1000
-500
0
500
1000
1500
-0.3 -0.2 -0.1 0.0 0.1 0.2 0.3
Sh
ear
Fo
rce,
V (
lbs.
)
Plastic Displacement Angle, γ (radians)
Shear Force, V vs. Plastic Displacement Angle, γ

44
Height H = 0.38 in.
Width W = 0.75 in.
Thickness t = 0.125 in.
Height : Width H : W = 0.5
Height : Thickness H : t = 3
Width : Thickness W : t = 6
Shear Area A = 0.0475 in.2
Initial Stiffness k = 67,869 kip / in.
Maximum Force F = -643 lbs.
Max. Shear Stress τmax = 13,534 lbs. / in.2
Disp. at Max Force Δmax force = -0.0476 in.
Angle at Max Force γmax force = -0.0634 rad.
Cycle at Max Force Cycle = 26 Specimen 25 Dimensions
Energy Dissipated34 E34 = 695 kip-in.
Energy Dissipated32 E32 = 980 kip-in.
Specimen 25 at time 2:10 (Cycle 26, Load Protocol A) of cyclic shear testing
Specimen 25
Aspect Ratios
Max Force, C26 -643 lbs
-800
-600
-400
-200
0
200
400
600
800
-0.3 -0.2 -0.1 0.0 0.1 0.2 0.3
Sh
ear
Fo
rce,
V (
lbs.
)
Plastic Displacement Angle, γ (radians)
Shear Force, V vs. Plastic Displacement Angle, γ

45
Height H = 0.38 in.
Width W = 0.5 in.
Thickness t = 0.125 in.
Height : Width H : W = 0.8
Height : Thickness H : t = 3
Width : Thickness W : t = 4
Shear Area A = 0.0475 in.2
Initial Stiffness k = 96,246 kip / in.
Maximum Force F = -870 lbs.
Max. Shear Stress τmax = 18,326 lbs. / in.2
Disp. at Max Force Δmax force = -0.0476 in.
Angle at Max Force γmax force = -0.0951 rad.
Cycle at Max Force Cycle = 26 Specimen 26 Dimensions
Energy Dissipated34 E34 = 995 kip-in.
Energy Dissipated32 E32 = 1,381 kip-in.
Specimen 26 at time 2:10 (Cycle 26, Load Protocol A) of cyclic shear testing
Specimen 26
Aspect Ratios
Max Force, C26 -870 lbs
-1000
-800
-600
-400
-200
0
200
400
600
800
1000
-0.4 -0.2 0.0 0.2 0.4
Sh
ear
Fo
rce,
V (
lbs.
)
Plastic Displacement Angle, γ (radians)
Shear Force, V vs. Plastic Displacement Angle, γ

46
Height H = 0.25 in.
Width W = 0.5 in.
Thickness t = 0.125 in.
Height : Width H : W = 0.5
Height : Thickness H : t = 2
Width : Thickness W : t = 4
Shear Area A = 0.0313 in.2
Initial Stiffness k = 47,672 kip / in.
Maximum Force F = -443 lbs.
Max. Shear Stress τmax = 14,192 lbs. / in.2
Disp. at Max Force Δmax force = -0.0357 in.
Angle at Max Force γmax force = -0.0713 rad.
Cycle at Max Force Cycle = 16 Specimen 27 Dimensions
Energy Dissipated34 E34 = 256 kip-in.
Energy Dissipated32 E32 = 705 kip-in.
Specimen 27 at time 1:17 (Cycle 16, Load Protocol A) of cyclic shear testing
Specimen 27
Aspect Ratios
Max Force, C16 -443 lbs -500
-400
-300
-200
-100
0
100
200
300
400
500
-0.4 -0.2 0.0 0.2 0.4
Sh
ear
Fo
rce,
V (
lbs.
)
Plastic Displacement Angle, γ (radians)
Shear Force, V vs. Plastic Displacement Angle, γ

47
APPENDIX B.
Load-Displacement Hysteresis:
1. Displacement vs. Load, Specimens 11-17, 14B, 21-27
2. Plastic Displacement vs. Load, Specimens 11-17, 14B, 21-27
3. Displacement Angle vs. Load, Specimens 11-17, 14B, 21-27
4. Plastic Displacement Angle vs. Load, Specimens 11-17, 14B, 21-27

48
Displacement vs. Load (Test 3: Specimens 11-17 & 14B)
-4000
-2000
0
2000
4000
-0.2 -0.1 0.0 0.1 0.2
Sh
ear
Forc
e, V
(l
bs.
)
Displacement (in.)
Displacement vs. Load, Specimen 11
-4000
-2000
0
2000
4000
-0.2 -0.1 0.0 0.1 0.2
Sh
ear
Forc
e, V
(l
bs.
)
Displacement (in.)
Displacement vs. Load, Specimen 12
-4000
-2000
0
2000
4000
-0.2 -0.1 0.0 0.1 0.2
Sh
ear
Forc
e, V
(l
bs.
)
Displacement (in.)
Displacement vs. Load, Specimen 13
-4000
-2000
0
2000
4000
-0.2 -0.1 0.0 0.1 0.2
Sh
ear
Forc
e, V
(l
bs.
)
Displacement (in.)
Displacement vs. Load, Specimen 14
-4000
-2000
0
2000
4000
-0.2 -0.1 0.0 0.1 0.2
Sh
ear
Forc
e, V
(l
bs.
)
Displacement (in.)
Displacement vs. Load, Specimen 15
-4000
-2000
0
2000
4000
-0.2 -0.1 0.0 0.1 0.2
Sh
ear
Forc
e, V
(l
bs.
)
Displacement (in.)
Displacement vs. Load, Specimen 16
-4000
-2000
0
2000
4000
-0.2 -0.1 0.0 0.1 0.2
Sh
ear
Forc
e, V
(l
bs.
)
Displacement (in.)
Displacement vs. Load, Specimen 17
-4000
-2000
0
2000
4000
-0.2 -0.1 0.0 0.1 0.2
Sh
ear
Forc
e, V
(l
bs.
)
Displacement (in.)
Displacement vs. Load, Specimen 14B

49
Displacement vs. Load (Test 4: Specimens 21-27)
-4000
-2000
0
2000
4000
-0.2 -0.1 0.0 0.1 0.2
Sh
ear
Forc
e, V
(l
bs.
)
Displacement (in.)
Displacement vs. Load, Specimen 21
-4000
-2000
0
2000
4000
-0.2 -0.1 0.0 0.1 0.2
Sh
ear
Forc
e, V
(l
bs.
)
Displacement (in.)
Displacement vs. Load, Specimen 22
-4000
-2000
0
2000
4000
-0.2 -0.1 0.0 0.1 0.2
Sh
ear
Forc
e, V
(l
bs.
)
Displacement (in.)
Displacement vs. Load, Specimen 23
-4000
-2000
0
2000
4000
-0.2 -0.1 0.0 0.1 0.2
Sh
ear
Forc
e, V
(l
bs.
)
Displacement (in.)
Displacement vs. Load, Specimen 24
-4000
-2000
0
2000
4000
-0.2 -0.1 0.0 0.1 0.2
Sh
ear
Forc
e, V
(l
bs.
)
Displacement (in.)
Displacement vs. Load, Specimen 25
-4000
-2000
0
2000
4000
-0.2 -0.1 0.0 0.1 0.2
Sh
ear
Forc
e, V
(l
bs.
)
Displacement (in.)
Displacement vs. Load, Specimen 26
-4000
-2000
0
2000
4000
-0.2 -0.1 0.0 0.1 0.2
Sh
ear
Forc
e, V
(l
bs.
)
Displacement (in.)
Displacement vs. Load, Specimen 27

50
Platic Displacement vs. Load (Test 3: Specimens 11-17 & 14B)
-4000
-2000
0
2000
4000
-0.2 -0.1 0.0 0.1 0.2
Sh
ear
Forc
e, V
(l
bs.
)
Displacement (in.)
Plastic Displacement vs. Load, Specimen 11
-4000
-2000
0
2000
4000
-0.2 -0.1 0.0 0.1 0.2
Sh
ear
Forc
e, V
(l
bs.
)
Displacement (in.)
Plastic Displacement vs. Load, Specimen 12
-4000
-2000
0
2000
4000
-0.2 -0.1 0.0 0.1 0.2
Sh
ear
Forc
e, V
(l
bs.
)
Displacement (in.)
Plastic Displacement vs. Load, Specimen 13
-4000
-2000
0
2000
4000
-0.2 -0.1 0.0 0.1 0.2
Sh
ear
Forc
e, V
(l
bs.
)
Displacement (in.)
Plastic Displacement vs. Load, Specimen 14
-4000
-2000
0
2000
4000
-0.2 -0.1 0.0 0.1 0.2
Sh
ear
Forc
e, V
(l
bs.
)
Displacement (in.)
Plastic Displacement vs. Load, Specimen 15
-4000
-2000
0
2000
4000
-0.2 -0.1 0.0 0.1 0.2
Sh
ear
Forc
e, V
(l
bs.
)
Displacement (in.)
Plastic Displacement vs. Load, Specimen 16
-4000
-2000
0
2000
4000
-0.2 -0.1 0.0 0.1 0.2
Sh
ear
Forc
e, V
(l
bs.
)
Displacement (in.)
Plastic Displacement vs. Load, Specimen 17
-4000
-2000
0
2000
4000
-0.2 -0.1 0.0 0.1 0.2
Sh
ear
Forc
e, V
(l
bs.
)
Displacement (in.)
Plastic Displacement vs. Load, Specimen 14B

51
Plastic Displacement vs. Load (Test 4: Specimens 21-27)
-4000
-2000
0
2000
4000
-0.2 -0.1 0.0 0.1 0.2
Sh
ear
Forc
e, V
(l
bs.
)
Displacement (in.)
Plastic Displacement vs. Load, Specimen 21
-4000
-2000
0
2000
4000
-0.2 -0.1 0.0 0.1 0.2
Sh
ear
Forc
e, V
(l
bs.
)
Displacement (in.)
Plastic Displacement vs. Load, Specimen 22
-4000
-2000
0
2000
4000
-0.2 -0.1 0.0 0.1 0.2
Sh
ear
Forc
e, V
(l
bs.
)
Displacement (in.)
Plastic Displacement vs. Load, Specimen 23
-4000
-2000
0
2000
4000
-0.2 -0.1 0.0 0.1 0.2
Sh
ear
Forc
e, V
(l
bs.
)
Displacement (in.)
Plastic Displacement vs. Load, Specimen 24
-4000
-2000
0
2000
4000
-0.2 -0.1 0.0 0.1 0.2
Sh
ear
Forc
e, V
(l
bs.
)
Displacement (in.)
Plastic Displacement vs. Load, Specimen 25
-4000
-2000
0
2000
4000
-0.2 -0.1 0.0 0.1 0.2
Sh
ear
Forc
e, V
(l
bs.
)
Displacement (in.)
Plastic Displacement vs. Load, Specimen 26
-4000
-2000
0
2000
4000
-0.2 -0.1 0.0 0.1 0.2
Sh
ear
Forc
e, V
(l
bs.
)
Displacement (in.)
Plastic Displacement vs. Load, Specimen 27

52
Displacement Angle vs. Load (Test 3: Specimens 11-17 & 14B)
-4000
-2000
0
2000
4000
-0.3 -0.2 -0.1 0.0 0.1 0.2 0.3
Sh
ear
Forc
e, V
(l
bs.
)
Displacement Angle, γ (radians)
Displacement Angle vs. Load, Specimen 11
-4000
-2000
0
2000
4000
-0.3 -0.2 -0.1 0.0 0.1 0.2 0.3
Sh
ear
Forc
e, V
(l
bs.
)
Displacement Angle, γ (radians)
Displacement Angle vs. Load, Specimen 12
-4000
-2000
0
2000
4000
-0.3 -0.2 -0.1 0.0 0.1 0.2 0.3
Sh
ear
Forc
e, V
(l
bs.
)
Displacement Angle, γ (radians)
Displacement Angle vs. Load, Specimen 13
-4000
-2000
0
2000
4000
-0.3 -0.2 -0.1 0.0 0.1 0.2 0.3
Sh
ear
Forc
e, V
(l
bs.
)
Displacement Angle, γ (radians)
Displacement Angle vs. Load, Specimen 14
-4000
-2000
0
2000
4000
-0.3 -0.2 -0.1 0.0 0.1 0.2 0.3
Sh
ear
Forc
e, V
(l
bs.
)
Displacement Angle, γ (radians)
Displacement Angle vs. Load, Specimen 15
-4000
-2000
0
2000
4000
-0.3 -0.2 -0.1 0.0 0.1 0.2 0.3
Sh
ear
Forc
e, V
(l
bs.
)
Displacement Angle, γ (radians)
Displacement Angle vs. Load, Specimen 16
-4000
-2000
0
2000
4000
-0.3 -0.2 -0.1 0.0 0.1 0.2 0.3
Sh
ear
Forc
e, V
(l
bs.
)
Displacement Angle, γ (radians)
Displacement Angle vs. Load, Specimen 17
-4000
-2000
0
2000
4000
-0.3 -0.2 -0.1 0.0 0.1 0.2 0.3
Sh
ear
Forc
e, V
(l
bs.
)
Displacement Angle, γ (radians)
Displacement Angle vs. Load, Specimen 14B
53
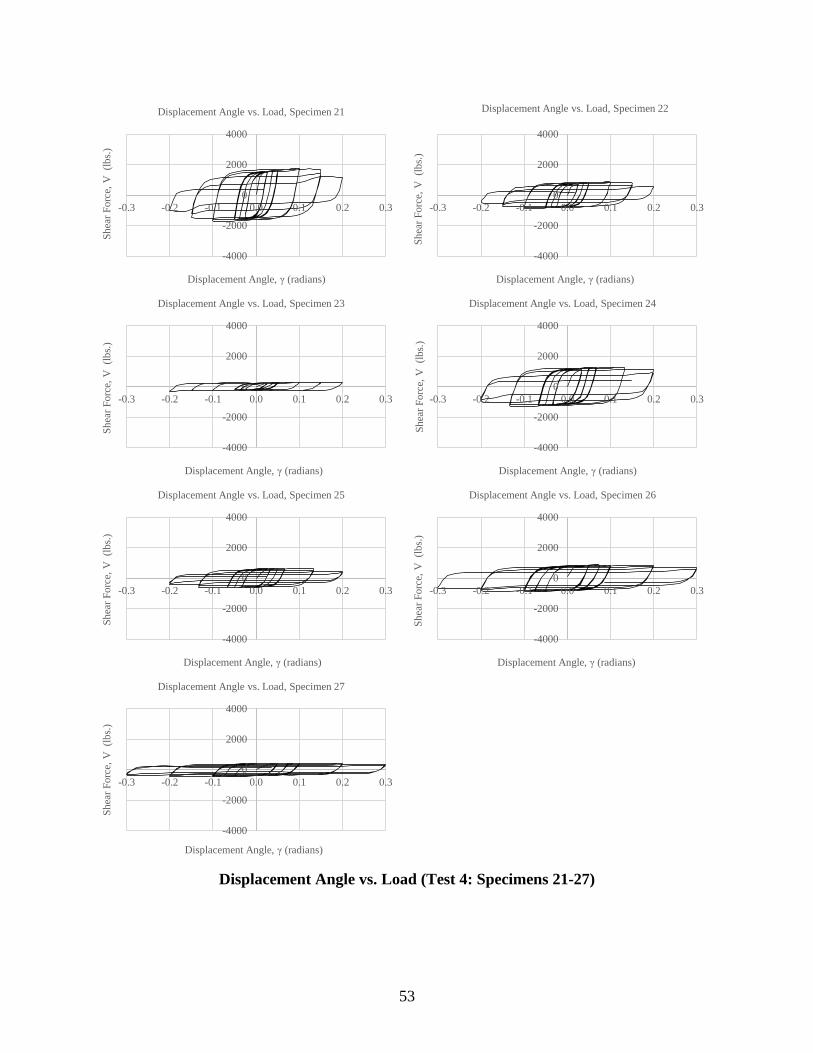
Displacement Angle vs. Load (Test 4: Specimens 21-27)
-4000
-2000
0
2000
4000
-0.3 -0.2 -0.1 0.0 0.1 0.2 0.3
Sh
ear
Forc
e, V
(l
bs.
)
Displacement Angle, γ (radians)
Displacement Angle vs. Load, Specimen 21
-4000
-2000
0
2000
4000
-0.3 -0.2 -0.1 0.0 0.1 0.2 0.3
Sh
ear
Forc
e, V
(l
bs.
)
Displacement Angle, γ (radians)
Displacement Angle vs. Load, Specimen 22
-4000
-2000
0
2000
4000
-0.3 -0.2 -0.1 0.0 0.1 0.2 0.3
Sh
ear
Forc
e, V
(l
bs.
)
Displacement Angle, γ (radians)
Displacement Angle vs. Load, Specimen 23
-4000
-2000
0
2000
4000
-0.3 -0.2 -0.1 0.0 0.1 0.2 0.3
Sh
ear
Forc
e, V
(l
bs.
)
Displacement Angle, γ (radians)
Displacement Angle vs. Load, Specimen 24
-4000
-2000
0
2000
4000
-0.3 -0.2 -0.1 0.0 0.1 0.2 0.3
Sh
ear
Forc
e, V
(l
bs.
)
Displacement Angle, γ (radians)
Displacement Angle vs. Load, Specimen 25
-4000
-2000
0
2000
4000
-0.3 -0.2 -0.1 0.0 0.1 0.2 0.3
Sh
ear
Forc
e, V
(l
bs.
)
Displacement Angle, γ (radians)
Displacement Angle vs. Load, Specimen 26
-4000
-2000
0
2000
4000
-0.3 -0.2 -0.1 0.0 0.1 0.2 0.3
Sh
ear
Forc
e, V
(l
bs.
)
Displacement Angle, γ (radians)
Displacement Angle vs. Load, Specimen 27

54
Plastic Displacement Angle vs. Load (Test 3: Specimens 11-17 & 14B)
-4000
-2000
0
2000
4000
-0.3 -0.2 -0.1 0.0 0.1 0.2 0.3
Sh
ear
Forc
e, V
(l
bs.
)
Displacement Angle, γ (radians)
Plastic Displacement Angle vs. Load, Specimen 11
-4000
-2000
0
2000
4000
-0.3 -0.2 -0.1 0.0 0.1 0.2 0.3
Sh
ear
Forc
e, V
(l
bs.
)
Displacement Angle, γ (radians)
Plastic Displacement Angle vs. Load, Specimen 12
-4000
-2000
0
2000
4000
-0.3 -0.2 -0.1 0.0 0.1 0.2 0.3
Sh
ear
Forc
e, V
(l
bs.
)
Displacement Angle, γ (radians)
Plastic Displacement Angle vs. Load, Specimen 13
-4000
-2000
0
2000
4000
-0.3 -0.2 -0.1 0.0 0.1 0.2 0.3
Sh
ear
Forc
e, V
(l
bs.
)
Displacement Angle, γ (radians)
Plastic Displacement Angle vs. Load, Specimen 14
-4000
-2000
0
2000
4000
-0.3 -0.2 -0.1 0.0 0.1 0.2 0.3
Sh
ear
Forc
e, V
(l
bs.
)
Displacement Angle, γ (radians)
Plastic Displacement Angle vs. Load, Specimen 15
-4000
-2000
0
2000
4000
-0.3 -0.2 -0.1 0.0 0.1 0.2 0.3
Sh
ear
Forc
e, V
(l
bs.
)
Displacement Angle, γ (radians)
Plastic Displacement Angle vs. Load, Specimen 16
-4000
-2000
0
2000
4000
-0.3 -0.2 -0.1 0.0 0.1 0.2 0.3
Sh
ear
Forc
e, V
(l
bs.
)
Displacement Angle, γ (radians)
Plastic Displacement Angle vs. Load, Specimen 17
-4000
-2000
0
2000
4000
-0.3 -0.2 -0.1 0.0 0.1 0.2 0.3
Sh
ear
Forc
e, V
(l
bs.
)
Displacement Angle, γ (radians)
Plastic Displacement Angle vs. Load, Specimen 14B
55
Plastic Displacement Angle vs. Load (Test 4: Specimens 21-27)
-4000
-2000
0
2000
4000
-0.3 -0.2 -0.1 0.0 0.1 0.2 0.3
Sh
ear
Forc
e, V
(l
bs.
)
Displacement Angle, γ (radians)
Plastic Displacement Angle vs. Load, Specimen 21
-4000
-2000
0
2000
4000
-0.3 -0.2 -0.1 0.0 0.1 0.2 0.3
Sh
ear
Forc
e, V
(l
bs.
)
Displacement Angle, γ (radians)
Plastic Displacement Angle vs. Load, Specimen 22
-4000
-2000
0
2000
4000
-0.3 -0.2 -0.1 0.0 0.1 0.2 0.3
Sh
ear
Forc
e, V
(l
bs.
)
Displacement Angle, γ (radians)
Plastic Displacement Angle vs. Load, Specimen 23
-4000
-2000
0
2000
4000
-0.3 -0.2 -0.1 0.0 0.1 0.2 0.3
Sh
ear
Forc
e, V
(l
bs.
)
Displacement Angle, γ (radians)
Plastic Displacement Angle vs. Load, Specimen 24
-4000
-2000
0
2000
4000
-0.3 -0.2 -0.1 0.0 0.1 0.2 0.3
Sh
ear
Forc
e, V
(l
bs.
)
Displacement Angle, γ (radians)
Plastic Displacement Angle vs. Load, Specimen 25
-4000
-2000
0
2000
4000
-0.3 -0.2 -0.1 0.0 0.1 0.2 0.3
Sh
ear
Forc
e, V
(l
bs.
)
Displacement Angle, γ (radians)
Plastic Displacement Angle vs. Load, Specimen 26
-4000
-2000
0
2000
4000
-0.3 -0.2 -0.1 0.0 0.1 0.2 0.3
Sh
ear
Forc
e, V
(l
bs.
)
Displacement Angle, γ (radians)
Plastic Displacement Angle vs. Load, Specimen 27