strategy to double sales in china and group update to double sales in china and group update...
TRANSCRIPT

Investor DayStrategy to double sales in China and Group update
ShanghaiNovember 11, 2014
Investor Day
ShanghaiNovember 11, 2014

China MarketFaurecia China
Jingcheng LiNovember 11, 2014

China believes that a strong central government will lead to a powerful Nation based on its 5,000 year history
Investor Day – Shanghai – November 11, 2014 4
Foundation of the Republic of China
Foundation of CPC
Foundation of the People’s Republic of China
The 100th Anniversary of CPC
The 3rd Plenary Session of the 18th Central Committee of the CPC for “Deepening Reform”
The 100th Anniversary of the People’s Republic of China
People’s Republic of China: 100 Years Development
Communist Party of China: 100 Years Development
1911 1921 1949 1978 2013 2021 2049
In 35 years:• 2nd World Eco Power• GDP +142 times• Urban revenue +71 times• Rural revenue +59 times
China is now going for the Chinese Dream: 1921 – 2021: 100 years of CPC foundation,
China will reach a comfortable level at the whole nation 1949 – 2049: 100 years of PRC foundation,
China will reach the same level as that of the developed countries
By the end of 21st century: China rejuvenationwill be realized step by step and China re-becomes the world first powerful country
The 3rd Plenary Session of the 11th
Central Committee of the CPC for “Reform and Opening “
Chinese Dream realization will improve people living conditions and boost consumption

2014 China dilemma: Stimulus or Reform China government has chosen to deepen the reforms
Investor Day – Shanghai – November 11, 2014 5
China GDP
Drivers
Export
Investment
Consumption
Super-imposed effect in 2014 Speed shift of GDP growth Pain of structure reform Digestion of post 4tr. Plan
30 “Golden Years” now limited by Natural resources Environment impact Labor force and cost
GDP drivers shift becomes must Public debt control & reduction Consumption and wage policy Core technologies & Innovation
“Global weak demand"
"Debubble! –post 4 trillion
Plan"
“Limited social protection"
China is committed to conduct further reforms aiming at the new development model

"The Rule of Law": main theme of 4th plenary session of 18th Central Committee of CPC, historical milestone
Investor Day – Shanghai – November 11, 2014 6
What does it mean?
What does it include?
How to understand?
Direction & Consequences
China history and culture deeply marked by Confucianism Confucianism privileges moralisim rather than laws In ancient China, "Law" means punishment, different from Western "Law" has no link to human rights and powers’ separation notion
Legislation: reinforcement of the role of People’s Congress Administration: the rule of the law for government Judicial organ: more independent and justice Respect of Law: population with law mindset in daily life
Under the leadership of CPC and socialist market economy Better balance between the rule of law and individual perfection Restriction of government power, thus reduce corruption source New reforms need to be conducted on the basis of laws
China will provide a more healthy business environment

2014 China automotive industry is marked by top level government exchange between Europe and China
Investor Day – Shanghai – November 11, 2014 7
Jan Mar May July Sept
Anti Trust InvestigationEuro V from
1/1/2015Scrap of Yellow Label vehicles
Incentivesfor new
energy cars
Car air Purifier
standardChild seats
In carsGerman PM Merkel
China visit
Anti trust fineOn OEM and
Auto parts
XI JinpingEurope visitDF / PSADaimlerBMWVW
Volvo
DF / Renault JV Yanfeng JCI Interior merger
DF Infiniti new JV
DF PSAChengdu new site
FVW new sitesIn Qingdao &
Tianjin
OctCapital increase of VW in
its JV with FAW: 49% vs. 40%
PV growth High H1 and Low H2 Local brands losing some share
Global OEMs capacity expansion Regulation: anti-trust, environment, safety
Main market trends
China automotive industry continues to grow, with more regulation and new norms

China market is maturing in terms of regulation and normsAir cleaning becomes a priority for government
Investor Day – Shanghai – November 11, 2014 8
Environment Safety Health
Emission
2010
China IV (EU IV)
2018Gasoline
China V (EU V)
Diesel2013
China IV
2015
China V
2018
China VI (TBD)
Fuel consumption limits (PV)
NEV subsidy plan
2015
6.9 L / 100 km
2020
5.0 L / 100 km
2025
4.0 L / 100 km
2010
• Pilot in 25 cities• Subsidy by battery energy
2013
• Focus on Beijing, Yangtze & Pearl river delta regions
• Subsidy by battery endurance distance
Request continuous attention and development on new material
Potential cost-up pressure
Product quality improvement is a priority
International standards move
Constant innovation required in emission technology to meet environment requirements
Lightweight solutions contribute to reach fuel consumption targets
Implications Implications Implications
2013, enlarge vehicle scope, defects definition, clarify responsible party, increase fine for OEMs who refuse recall
Recall policy
China Three Guarantees2013, Guarantee for repair, replacement, & return within 3 years cf car lifetime, provide more protection to consumer
Child seat2012, Restraint system of vehicles for children (ECER44), enhance the protection of children safety
Air quality (PV)2015, Air quality standards inside vehicles (PV), set mandatory standards for volatile organic compounds & specified pollutants' limits

CAR MODEL CAR PRICE (€)EU CAR PRICE (€) CN JV CAR PRICE (€) CAR MODEL
Car selling price comparison between China and Europe Margin on Premium and SUV under pressure
Investor Day – Shanghai – November 11, 2014 9
Global Brand Chinese Brand
A00
A0
A
B
C
D/E
SUV
4,000-7,000
5,000-7,000
8,000-14,000
11,000-23,000
10,000-13,000
Segment
9,000-14,000
12,000-18,000
19,000-26,000
24,000-42,000
36,000-56,000
71,000-134,000
24,000-31,000
Not produced
10,000-15,000
13,000-22,000
22,000-39,000
38,000-90,000
89,000-350,000
22,000-42,000
Note: EU car price incl. sales tax, exchange rate: EURO/RMB=1/8.2 Source: www.cars-of-europe.com, www.bitauto.com
Not present
Not present
Geely Panda
Geely SC6
Geely EC8
Geely GX7
Geely EC7
VW Tiguan
VW UP
VW Polo
VW Golf
Audi A6
BMW 7 Series
VW Passat

Six automakers share over 80% of the market
Investor Day – Shanghai – November 11, 2014 10
SAIC 26% 3,013FAW 16% 1,857
DongFeng 17% 1,977Chang'an 10% 1,121
BAIC 8% 961GAC 6% 750
GreatWall 3% 357Geely-Volvo 2% 241
BYD 2% 261Brilliance 3% 317
Chery 2% 257Others 5% 606
Market share 20% 4% 2% 1% 0% 10% 4% 5% 5% 5% 10% 3% 32%Volume ['000] 2,369 472 197 89 42 1,116 524 591 612 563 1,116 299 3,729
Others ChineseBrand
Market Share
Volume['000]
European U.S Japanese & Korean
JV
59%
24%
12%
Chinese OEM groupsPV brands
Source: Auto 2000 Aug, Faurecia internal analysis
Global OEMs enjoys 2014 market growth with continuous capacity expansion

2015 auto growth continues despite some pressure from macro economy and will be key for new China auto industry policy
Investor Day – Shanghai – November 11, 2014 11
Domestic Economic
Growth
Automotiveindustry
Development
Potential ImpactsForecasts
GDP between 7.0% to 7.3% Population at 1.37 billion Urbanization rate at 55.4% High pressure on CO2 control
PV volume growth around +9.9% Euro V nationally implemented New industrial policy release 13th Five Year Plan direction
Unemployment rate to increase Big consumer market to stimulate Public debt control and financing innovation Pillar industries support to maintain growth
2015 PV production volume at 18.7m units Yellow Label vehicles scrap plan results China local brands development Emission control, light weight, safety
Source: China State Information Center
2015 main focus: 3rd Edition of China Automotive Industry Policy

China automotive industry faces some strategic topics to be clarified in 2015 with long term impact
Investor Day – Shanghai – November 11, 2014 12
3rd Edition of China Automotive Industry Policy
1st Edition in 1994: Market against Technology Market open mainly to global OEMs2nd Edition in 2004: Consolidation by SOE OEMs Own Brands development difficulties3rd Edition in 2015: Powerful automotive country Mastering core technology / innovation
China Local Brand Support PolicyEach Chinese OEM will find out its own way to develop further the local brands
Anti-Trust Scrutiny EvolutionChina moves toward the international practices
13th Five Year Plan DirectionCO2 focus: China CO2 peak forecasted between 2025 and 2030, light weight and emission controls
OEM 50/50 JV EvolutionOEM Joint Venture Agreements extension, the latest is FVW for 25 yearsChinese and global OEMs relationship will be closer via different forms: cross participation, M&A etc.
Main Target "Perceived" Results
New China Automotive Industry Policy may focus on new energy cars and local brands
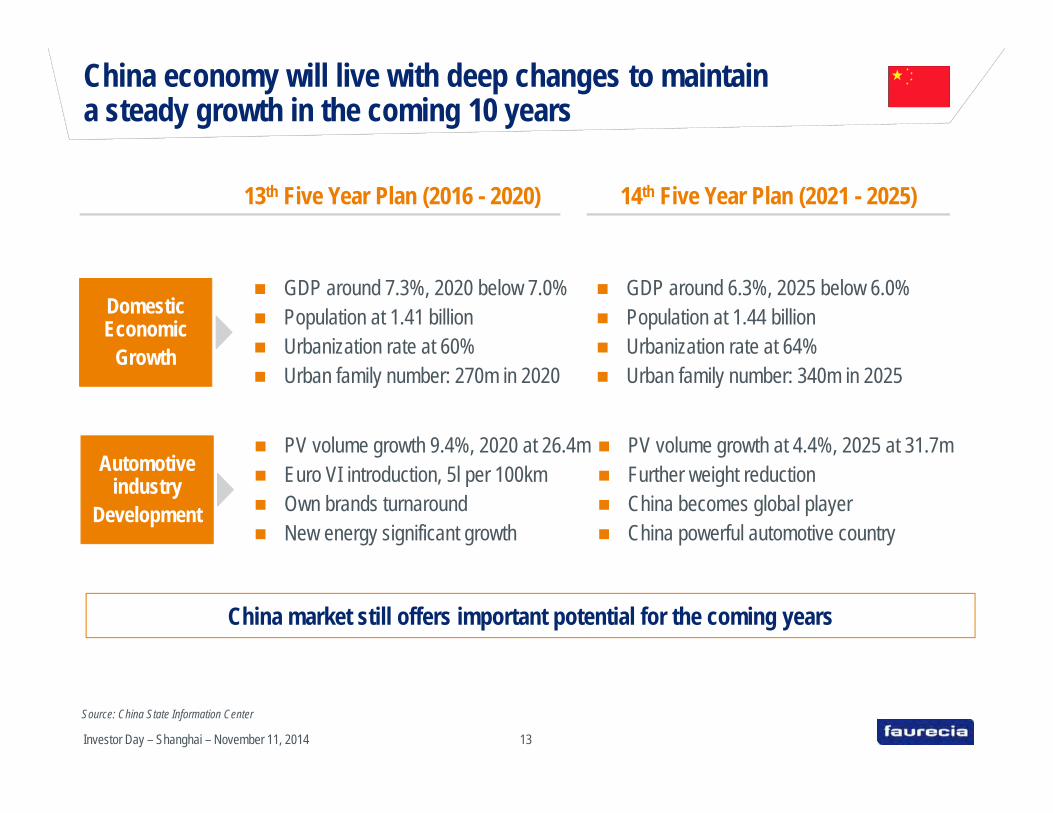
China economy will live with deep changes to maintain a steady growth in the coming 10 years
Investor Day – Shanghai – November 11, 2014 13
Source: China State Information Center
Domestic Economic
Growth
Automotiveindustry
Development
14th Five Year Plan (2021 - 2025)13th Five Year Plan (2016 - 2020)
GDP around 7.3%, 2020 below 7.0% Population at 1.41 billion Urbanization rate at 60% Urban family number: 270m in 2020
PV volume growth 9.4%, 2020 at 26.4m Euro VI introduction, 5l per 100km Own brands turnaround New energy significant growth
PV volume growth at 4.4%, 2025 at 31.7m Further weight reduction China becomes global player China powerful automotive country
GDP around 6.3%, 2025 below 6.0% Population at 1.44 billion Urbanization rate at 64% Urban family number: 340m in 2025
China market still offers important potential for the coming years

China vehicle production hits 22 m units in 2013, and will exceed 30 m units by 2017
Investor Day – Shanghai – November 11, 2014 14
Source: IHS 2014 Aug, Faurecia China internal analysis1) CVE refers to truck/bus above 3.5 tons 2) LCV refers to commercial vehicles up to 3.5 tons 3) PV refers to cars, incl. MPV and SUV 4) incl. Pickup
2017 E
31
22
6
33
2010
18
11
4
3
LCV
CVE
2020 E
33
2442
2011
19
12
6
3
2013
22
16
CAGR = ~6%
CAGR = 7%3
4
3
2012
19
13
PV
China vehicle production volume 2009 – 2020 E [m units]
1)
3)
CAGR
‘10-'13 '13-'20
Key figures of PV Market - 2013
Car owner -ship[units/1,000 people]
Total car parc[m units]
8% 6%
17% 6%
Total ProductionVolume[m units]
81111
16
63
490740
470
60
235213
85
W. Europe
4)
4)
1% 3%
2)
Market consensus on China automotive volume turn-point: 40m units

29% 29% 29%
66% 63% 61%
8% 10%
20% 28% 29%
16%15% 15%
47%40% 39%
12% 11% 11%
30% 31% 32%
26% 27% 27%
20% 19% 19%
14% 14% 14%10% 9% 8%
SUVs are increasingly favored by Chinese OEMs, premium and entry segments are also gradually gaining share
Investor Day – Shanghai – November 11, 2014 15Source: IHS 2014 Aug
China PV market is still dominated by C segment, accounting for ~40% M/S
SUVs are increasingly favored by Chinese customers, esp. for 2nd-time purchase, due to their roominess
As premium brands are pushingforward their localization in China, their share is expected to increase
Entry brands are now recovering and expected to achieve ~30% M/S
In general, the market is relatively stable, with Chinese brands increasing thanks to government support
Japanese OEM performance to be impacted by bilateral relationship
2013 2020 E2017 E 2013 2020 E2017 E 2013 2017 E 2020 E
16 2422 16 2422Sedan 16 24225% Premium
Entry
MID
U.S.Korea
China
Europe
Japan
SUV
MPVD/E
C
A/B
6%4%
6%
Growth and mix trend still support profitability improvement
Share of body-type[m units]
Share of brand tier[m units]
Share of brand origin[m units]

Chinese OEMs will become more and more global via partnership reinforcement and cross-border M&A operations
Investor Day – Shanghai – November 11, 2014 16
In the past In the future
Value chain coverage
Technology direction
Market focus
Missing to China
Work split
Market players
Vehicle, mainly PV Localizing foreign cars
Impact on suppliers
Full value chain including auto parts Specific car development for China
JV with OEM as key strength Differentiation and innovation
Passive Chinese partner In learning curve
More active Chinese partner More confident to drive decisions
Customer intimacy to focus Address decision makers
Chinese market Global car makers in China
Global market and own brands Chinese OEMs focus export / go global
6 SOEs / Global OEMs Captive and capitalistic
Internal combustion engine
Funds, market, HR Technology, brands
SOEs / POEs / Global OEMs All kinds of cooperation
New energy, hybrid, EV
Core technology Brands
China full service capabilities Global footprint
Business model challenge Capability and competitiveness
Regulation Light weighting
M&A - Partnership Local brands support
China has spent US$15bn for OEM and Auto Part acquisition outside ChinaStarting from Oct. 2014, 98% cross border M&A need no more approval from Beijing

China auto part market competition is well structured
Investor Day – Shanghai – November 11, 2014 17
China Top OEM have auto part integration strategy Global ambition to be realized via M&A operations Market is getting more and more open
Technology and innovation driven suppliers Market mix requiring higher technology and quality
performance Capable of managing global platforms
Cost driven competition and customer intimacy focus Lack of global presence and access to technology
OEM CAPTIVE PLAYERS
Faurecia is well armed to face the competition in China with a strong team
Technology, engineering localization rate and platform capabilitiesremain key success drivers
GLOBAL PLAYERS
LOCAL PLAYERS

Key takeaway for China market
Investor Day – Shanghai – November 11, 2014 18
1
2
3
4
China new government team has defined the development objectives, strategy and roadmap for the coming 10 years, positive impact on automotive industry is expected
China‘s PV market will continue to grow with 1.5 million units more per year till 2020 with a mix moving up and tightened regulation toward the international standards
China government support focuses on local brand and new energy solution development
Chinese partners will increase their decision power in the JV with global OEMs and 50/50 business model can be in further evolution in 5 to 10 years period
5 China market environment is positive for Faurecia who has already a solid presence and will accelerate the deployment of its strategy

Faurecia China development strategy definition takes fully into account market and Group’s expectations
Investor Day – Shanghai – November 11, 2014 19
Key AssumptionsImpact on
Strategy Design
Faurecia ChinaStrategy
2018 plan> € 4.0 bn
2016 plan> € 3.0 bn
2014 Forecast≈ € 2.3 bn
+ 17% vs. 2013
NeutralPolitical stability Geopolitical and social tension
PositiveGDP ≈7% per yearInflation ≈4%
PositiveNeutral
Local Brand supportNew energy car support
PositiveEnvironment focusSafety and health focus
Positive Challenging
Footprint strategyIncreasing decision power
PositiveChallenging
International standard moveM&A development
ChallengingTechnology and InnovationDifferentiation focus
Positive15% to 20% of Group salesProfitable and cash generating
ChinaPolitical Environment
ChinaMacro Economy
China AutomotiveIndustrial Policy
China Regulation
ChinaGlobal & Local OEMs
ChinaAuto Parts
China Competition
Faurecia GroupExpectation
Market components
Faurecia has solid presence and clear strategy roadmap in China

Investor Day
ShanghaiNovember 11, 2014

China StrategyFaurecia China
Jean-Michel VallinNovember 11, 2014

Faurecia celebrates in 2014 its 20 years’ localization in China, providing a solid base for business acceleration
Investor Day – Shanghai – November 11, 2014 22
2002 2011 2014 2015
Raw material, components, process, equipment
Quality system, lean production system
Manufacturing Engineering
and validation Program
management
Industrialization Tech Center fully autonomous Advanced development
for China market needs Local innovation
R&D and Innovation
WAVE 1 WAVE 2 WAVE 3 & 4
1994 2005 2013
>€1bn >€2bn
2010

A consistent strategy focused on 6 dimensionsto sustain profitable long term growth
Investor Day – Shanghai – November 11, 2014 23
Global program acquisition Customer portfolio diversification Product portfolio diversification
OEM connection Regional presence Business development booster
Organic growth with core and emerging clients
Partnership as OEM intimacy leverage
Manufacturing operational excellence at benchmark level
Quality & HSE best in class Flawless new launches Operation and cost optimization
KPI constant improvement ECRs efficient management VA/VE portfolio enhancement
Fully-owned, worldwide network Deep expertise localization Innovation and industrial style
Program development to drive profitability and cash
World class R&D providing value to customers
Strong leadership team to drive the growth plan
A strong Chinese mgmt. team Training and development plan Organization and resources
1
4 5 6
32

Faurecia has 23% CAGR for the past years and forecasts €2.3 Bn sales in 2014, a new faster-than-market growth year
Investor Day – Shanghai – November 11, 2014 24
≈ €2.3 Bn Sales*
38 Plants
≈ 12,800 employees
Present in 21 cities
R&D4 centers
750 engineersTotal Plants
€ bn
Total Sales
* Including €0.2bn non consolidated sales
2014 Forecast
1.0 1.21.5
2.0~2.3
2010 2011 2012 2013 2014
2530
35 36 38
2010 2011 2012 2013 2014
CAGR = 23%

Faurecia has now deployed its 4 Business Groups in China FECT and FAS Metal in market leading position
Investor Day – Shanghai – November 11, 2014 25
1) Consolidated sales 2) Consolidated and non-consolidated sales ; 3) mainly non-consolidated
First operation1994: Wuhan
16 plantsTotal sales: ≈ € 1,150m 1)
≈ 4,400 employees27% Market Share
First operation2002: Changchun (Structures)2003: Wuhan (Complete seat)
2004: Wuxi (Mechanism)
10 plantsTotal Sales: ≈ € 830m 1)
≈ 4,900 employees15% Market Share Metal5% M/S Complete Seat
First operation2005: Changchun
11 plantsTotal Sales: ≈ € 260m 2)
≈ 2,800 employees4% Market Share
First operation2011: Changchun
1 plantTotal Sales: ≈ € 80m 3)
≈ 550 employees2% Market Share
2014 Forecast 2014 Forecast 2014 Forecast 2014 Forecast

A manufacturing footprint of 38 plants in 2014, covering the 6 main auto regions
Investor Day – Shanghai – November 11, 2014 26
North1996200220052010201120112012
ChangchunChangchunChangchunChangchun ChangchunShenyangChangchun
West Region200320072010201120122012
ChongqingChongqingChengduChengduChongqing Chengdu
Central Region1994 200320062010201220132014
Wuhan WuhanWuhanWuhanXiangyangNanchangChangsha
East Region200020042005
2008201220122012201220132014
ShanghaiWuxiShanghaiShanghaiShanghaiNanjingShanghaiCixiYanchengNanjingCixiBeilun
★
South Region
ExhaustInteriorSeats R&D centersChina Headquarter Exterior★
201020102012
GuangzhouFoshanFoshan
201220122013
FoshanShenzhenShenzhen
YantaiQingdaoBeijing
200420072012
North-East Region
6
3
76
6
10

Investor Day – Shanghai – November 11, 2014 27
R&D Strategy FECT Tech Center Opened in April 2011
China HQ & New Tech Center Opened in March 2013 R&D and Program headcount evolution
3 fully owned R&D centers integrated in the global network with 750 engineers
Application centers in six regions Continuous reinforcement of local team
and competences More innovation focus Design and style as differentiation factor
R&D Strategy focused on competence and expertize full localization under 100% Faurecia control
2014 2015 2017
750900
1,200

Manufacturing strategy focused on best in class operations through full FES deployment and margin enhancement
Investor Day – Shanghai – November 11, 2014 28
Recognized by CustomersAmong best performing plants Customer PPM [2014]
New Plant Launching Model
8 Chinese Plants in Group Top 10 22 Chinese Plants audited
82%@A Rank; Average 64%(All plant managers are Chinese)
Dated on Sep. 2014
#1
#4
#8
Wuxi FASNanjing
Guangzhou FAS#9 Yantai FECT
#1 Anting FAS
#9 Chengdu FAS
#5 Wuhan FECTFIS
#9 Wuhan FIS
GM “2013 GM
Supplier Quality Excellence Award”
DPCA“2013 GM Special
Award”
FAW-VW“Top 10 Excellent
Quality Award”
KM&I“2013 Best
Supplier Award”
FAS FIS FECT FAE
1
6
4
8

Faurecia China targets to double its size in the coming years thanks to OEM volume growth and portfolio expansion
Investor Day – Shanghai – November 11, 2014 29
Faurecia to grow twice as fastas the market (15% CAGR)
Strengthening relationshipswith Chinese automakers: ChangAn for FIS, to extend Geely for FIS, FECT JMC for FECT Other opportunities
2016 20182014
> € 3bn
> € 4bn
≈ € 2.3bn
Sales forecast Comments

Investor Day – Shanghai – November 11, 2014 30
Partnerships objectives ChangAn Affiliated OEMs
JV footprintInterior Systems sales evolution
50/50 JV established in 2013 Interior business as first step scope Potential extension to other Faurecia product lines Significant businesses award since creation
Faurecia‘s partnership with China ChangAn Group progresses smoothly in line with the strategic plan
PV VolumeGrowth
2014 YTD1.7m+26%
Chang'an
2016 2018 2020
~20
~150~ 210
Faurecia will continute to deploy this strategy with other Chinese OEMs
€ M

Footprint strategy focused on business support and capex optimization through volume massification
Investor Day – Shanghai – November 11, 2014 31
New footprint focus regions – OEM new entry points
Shenyang
Wuhan
ChangchunBeijing
Nanjing
ShanghaiChengdu
Guangzhou
Chongqing
Changsha
Hangzhou
Key Strategy Core technology / standard
product / techno plants: densification of volume
JIT to follow customers Cross BG building solution Capex optimization Vertical integration
to catch added value
Plant Number 2014: 38 2018: 55 5 YR Investment: € 400 M

Human Resources strategy focused on supportinggrowth through leadership and competence build up
Investor Day – Shanghai – November 11, 2014 32
Balance of nationality, seniority and competence Chinese people in key Division Management Positions 100% Plant Managers are Chinese
Regular staffing reviews New employees induction and training plans Regular benchmarking to be competitive HR KPI close monitoring
University campus campaigns for new graduates Clear career path for management evolution FES China School to prepare Faurecia mindset
DEVELOP A STRONG LEADERSHIP TEAM Multi-cultural Highly motivated Result oriented
REINFORCE HR FOUNDATIONS Group key values in team’s daily behavior Full deployment of all Group HR tools C&B in line with Group guidelines and market
PROVIDE RIGHT RESOURCES FOR GROWTH Reservoir and retention Career path anticipation Training in China and abroad

Key takeaways
Investor Day – Shanghai – November 11, 2014 33
A solid presence and good financial results A clear vision and target A clear strategic roadmap A motivated team
Market providing significant growth potential toward international standards
Customer and product portfolio diversification focus Competition close follow-up and constant benchmarking
Deliver budget year by year Raise contribution to Group earnings in mid-term plan HR and management development
FaureciaChina
Market environment remains positive
High confidence to respect commitment
to Group

Investor Day
ShanghaiNovember 11, 2014

Human ResourcesFaurecia China
Kathy SunNovember 11, 2014

Prop
erty
of Fa
urec
ia-D
uplic
ation
pro
hibite
d
China demography overview
Source: Desktop research
The most populous country: 1.37 billion, 20% of total worldwide population; of which the 770 million workforce (56% of total Chinese population)
Dense population in East & Central China and sparse in West; 240 million migrant workers
Birth rate decreases becauseof the family planning policy from last century
Unemployment rate is about 4.3% in recent 5-year average
Manufacturing takes a larger proportion of GDP (40%) & fiscal revenue (50%)
Investor Day – Shanghai – November 11, 2014 36

Prop
erty
of Fa
urec
ia-D
uplic
ation
pro
hibite
d
CAGR = +11%
CAGR = +28%
1 0032 080
2 870 3 200
5 271
10 985
13 900
16 900
2010 2013 2015 2017
M&P* China all
Total Faurecia workforce in China reaches approx. 12,800 people in 2014 and will reach ~16,900 in 2017
Changchun
Shenyang
Beijing QingdaoYantai
Nanchang
NanjingYanchengWuxi
ShanghaiAntingCixiNingbo
GuangzhouFoshan
Shenzhen
Chongqing
Chengdu
Wuhan
Xiangyang
Xiangtan
NORTHERN REGIONTotal: 3,020
EASTERN REGIONTotal: 3,280
SOUTH WESTERN REGIONTotal: 2,350
CENTRAL REGIONTotal: 2,750
SH Office: 1,400SHANGHAI OFFICE
Distribution of Faurecia’s workforce in China (2014)
Total workforce in 2014: ≈12,800
Evolution of Faurecia’s workforce
With CAGR at 28% in the past, the increase in the coming years
is still significant, but at a moderate rate.
Investor Day – Shanghai – November 11, 2014 37
* Managers and professionals

Prop
erty
of Fa
urec
ia-D
uplic
ation
pro
hibite
d
Faurecia China has developed a local management team with limited expatriate support
The expatriate structure analysis
Expat vs total M&P Expat category Expat in mgt team
All Plant Managers are Chinese. With 27 expatriates dedicated to China, 14 are for Technical/Expert positions
The strategy is to promote Chinese people for the management functions and to have technical expatriates to transfer the know how
38Source: Desktop research
1%
99%
Expatriate
Total M&P
48%52%
ManagementTechnical expert 15%
85%Local
Expatriate
38Investor Day – Shanghai – November 11, 2014

Prop
erty
of Fa
urec
ia-D
uplic
ation
pro
hibite
d
HR Mission
HR STRATEGY
Develop strong leadership team and ensure key technical competence on board
Anticipate key resources growth to meet future business needs
Retain talents with Faurecia Values
HR foundation: make sure country alignment while managing diversity
Work on Employer Branding to boost company attractiveness
Promote in media communication channel Deploy CSR program in China Extend cooperation with target universities
Golden Triangle and localization deployment Strategic recruitment for next generation leaders Young Talents program to stabilize talent foundation
Promote Management & Technical parallel career path Prepare new leaders through Leadership & Management
program and Individual Development Plan
Focus on talent identification and internal mobility Individual Career path designed in advance Provide competitive package for talents
Ensure legal compliance and group alignment Respect regional guidelines HR Information System fully on board
KEY ACTIVITIES
Provide talented and committed people on time through systematic anticipation to enrich talent pipeline and develop Faurecia Culture
Investor Day – Shanghai – November 11, 2014 39

Prop
erty
of Fa
urec
ia-D
uplic
ation
pro
hibite
d
Faurecia golden triangle plan has been developed to ensure that new plants launch at Faurecia standards
New plantMother plant
28
54
82 peoplemoved
& promoted
Plant mgr
1 key funct. Mgr
1 key funct. Mgr
Golden Triangle: 1+2 1 plant manager 2 of 6 key functions filled internally
6 key functions = HR, ME, Quality, UAP, FES, PC&L
Local hiring in advance and train in mother plant For tech. plant, internal transfer experience
JP: "Young Talents Program" Operator: train in mother plant and involve from PMS phase 2
1st level: Plant Management Team
2nd level: Engineer & Professional
Below level: Junior Professional & operator
Investor Day – Shanghai – November 11, 2014 40

Prop
erty
of Fa
urec
ia-D
uplic
ation
pro
hibite
d
Faurecia university in Asia is also aimed at developing the Faurecia culture/value and strengthening the competency management
Mana
gem
ent S
kill
FES
Know
ledge
Func
tiona
l Kno
wled
ge
Lead
ersh
ip
Induction Program
Faurecia University in Asia
No. of trainees covered: 2014 – 1,000; 2015 – 1,200
41Investor Day – Shanghai – November 11, 2014

Prop
erty
of Fa
urec
ia-D
uplic
ation
pro
hibite
d
2012113 hired
2013177 hired
2014140 planned
Faurecia China talent acquisition strategy … Acquire Talents for Future
Executive
Sr. Manager
1st Line Manager
Junior Professional
Professional Experienced
Strategic Recruitment
Young Talents Program
83% RetainedTill 2013
201225 hired
201330 hired
201450 planned
Investor Day – Shanghai – November 11, 2014 42
Prop
erty
of Fa
urec
ia -D
uplic
ation
pro
hibite
d
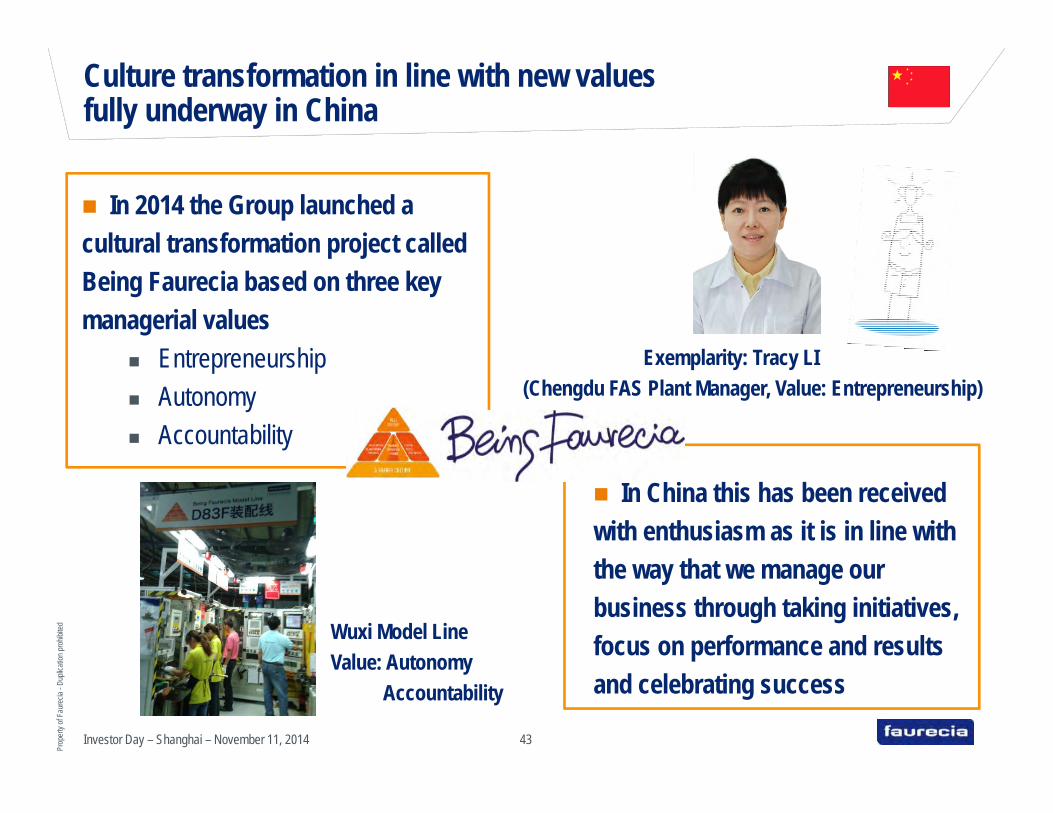
In 2014 the Group launched a cultural transformation project calledBeing Faurecia based on three key managerial values
Entrepreneurship Autonomy Accountability
Culture transformation in line with new values fully underway in China
Investor Day – Shanghai – November 11, 2014 43
In China this has been receivedwith enthusiasm as it is in line withthe way that we manage ourbusiness through taking initiatives, focus on performance and resultsand celebrating success
Exemplarity: Tracy LI (Chengdu FAS Plant Manager, Value: Entrepreneurship)
Wuxi Model LineValue: Autonomy
Accountability

Prop
erty
of Fa
urec
ia-D
uplic
ation
pro
hibite
d
Key take-away for Faurecia China HR
1
2
3
4
5
Investor Day – Shanghai – November 11, 2014 44
China headcount will increase from 12,800 today to 16,900 in 2017
China Government trend is to support the workers with more protection through regulations and salary increase in order to maintain social harmony.
Productivity is becoming a key objective.
Faurecia HR KPIs are globally outperforming the market, which is well highlighted by the company's internal Employee Engagement Survey of 2013
Internal promotion, talent attraction, retention and management development remain the key challenges, as the market will grow even more competitive,
especially at the manager level
Faurecia China organization has been reinforced with creation of Divisions supported by corporate functions, keeping Faurecia culture and value as a priority

Investor Day
ShanghaiNovember 11, 2014

Automotive SeatingFaurecia China
Sam XiaNovember 11, 2014

Prop
erty
of Fa
urec
ia-D
uplic
ation
pro
hibite
d
FAS China growth at 18% CAGR in the past 4 years
Investor Day – Shanghai – November 11, 2014 47
≈ € 830m Total Sales
10 Plants
≈ 4,900 employees
€M €M
2014: 10 Plants Complete Seat (3 Plants) Front Seat Frame (5 Plants) Mechanisms - Recliners (1 Plant) Mechanisms -Tracks (1 Plant)
R&D2 centers
300 engineers
CAGR = 18%
2014 Forecast Total Sales
Plant Number
Business Awards
5
89
10 10
2010 2011 2012 2013 2014
1,5601,920
> 2,400
2009+2010 2011+2012 2013+2014e
423 466583
712
2010 2011 2012 2013 2014e
≈ 830

Prop
erty
of Fa
urec
ia-D
uplic
ation
pro
hibite
d
FAS China is composed of 4 product families
Investor Day – Shanghai – November 11, 2014 48
First operation2003: Wuhan
2014 operation scale650k carsets /year
2014 Market Share 5%
First operation2002: Changchun
2014 operation scale2,700k carsets /year
2014 Market Share 13%
First operation2004: Wuxi
2014 operation scale15M recliners /year
15M tracks/year
2014 Market Share 16%
Frames Comfort &Trim
First operation2013: Wuhan
2014 operation scale350k carsets /year
Complete Seat Mechanisms
Prop
erty
of Fa
urec
ia-D
uplic
ation
pro
hibite
d
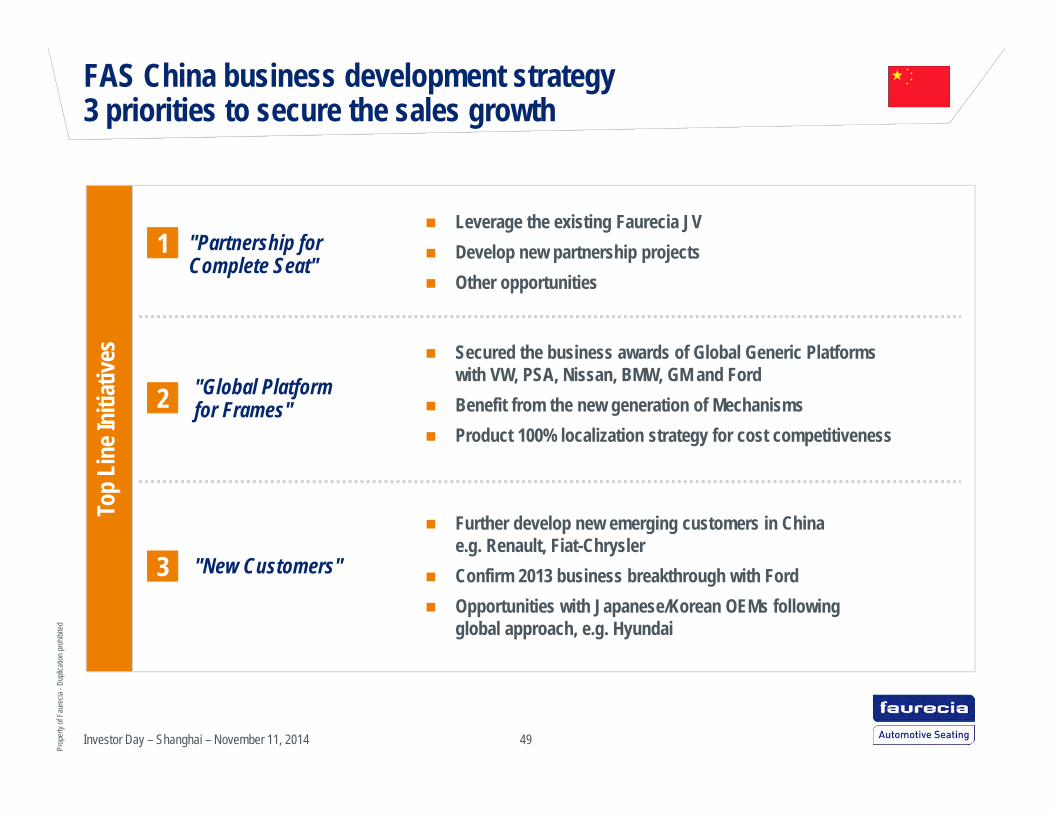
FAS China business development strategy3 priorities to secure the sales growth
Investor Day – Shanghai – November 11, 2014 49
1
2
3
"Partnership for Complete Seat"
"Global Platform for Frames"
"New Customers"
Leverage the existing Faurecia JV Develop new partnership projects Other opportunities
Secured the business awards of Global Generic Platforms with VW, PSA, Nissan, BMW, GM and Ford
Benefit from the new generation of Mechanisms Product 100% localization strategy for cost competitiveness
Further develop new emerging customers in Chinae.g. Renault, Fiat-Chrysler
Confirm 2013 business breakthrough with Ford Opportunities with Japanese/Korean OEMs following
global approach, e.g. Hyundai
Top
Line
Initi
ative
s

Prop
erty
of Fa
urec
ia-D
uplic
ation
pro
hibite
d
FAS China profitability enhancement strategy6 Priorities to sustain profitability
Investor Day – Shanghai – November 11, 2014 50
1
2
4
"Customer mix"
"Vertical integration"
"Footprint optimization"
Focus on Premium brands: BMW, Audi, Cadillac … Focus on product innovation & generic system solutions
Vertical integration for Complete Seat (Foams, Covers & Accessories) Stamping & painting for Frames
Maximum loading of current metal plants (fixed cost optimization) Low CAPEX JIT Plants
Botto
m L
ine I
nitia
tives
5 "Cost improvement" Purchasing (supplier panel, mandatory supplier management) Focus on value analysis / value engineering (VA/VE) & 6 sigma Engineering Change Request (ECR) managements in serial life phase
6 "Business Development & Program Management"
Constantly improve operating income / Upfront costs / IRR / Max Cash Out during each program phase
Reduce D&D, development core team cost Control the total upfront / CAPEX optimization
3 “Product mix" Maintain leadership in highly profitable mechanisms business Value-creating innovation in mechanisms and frames

Prop
erty
of Fa
urec
ia-D
uplic
ation
pro
hibite
d
FAS China is balancing its customer portfolioKey accounts remain global OEMs
Investor Day – Shanghai – November 11, 2014 51
VW remains 1st key account
2018 Sales split European 65% Japan/Korean 19% American 11% Chinese 5%
4 customers above € 200m Sales2016 20182014
€ 1.2bn
€ 1.7bn
€ 830m

Prop
erty
of Fa
urec
ia-D
uplic
ation
pro
hibite
d
Mechanisms
FAS China will have 17 plants in 2018: 6 new JIT plants and 1 new metal plant are in preparation
Investor Day – Shanghai – November 11, 2014 52
Number of plants every year
+ 1 plant+ 6 plants + 0 plant
• Northeast 1• Central 2
• Northeast 1• Central 2• East 1• South 1
• East 2
5 plants3 plants 2 plants
"Footprint Centralization""JIT Module" "Base Area"
JIT plants: Plan 6 new footprints
Metal plants: Densify the production by main automotive regions to benefit from volume effect
Mechanisms plants: Fully load the current ones
JIT Frame
‘13 ‘14 ‘15 ‘16 ‘17 ‘18Year
10 10 14 15 16 17Plan number
201410 plants
2018+7 plants

Prop
erty
of Fa
urec
ia-D
uplic
ation
pro
hibite
d
Investor Day – Shanghai – November 11, 2014 53
FAS China R&D strategyGlobal network and local presence with customer proximity
R&D Strategy China HQ & New Tech Center Opened in March 2013
Validation Recognized by OEMVW 100%
Ford 85%
GM
Local OEM
R-N
100%PSA
90%
100%
100%146
196244
300
2011 2012 2013 2014
CAGR 28%
Headcount Evolution
2 (Shanghai and Wuxi) fully owned R&D centers, 1 D&D plateau in Wuhan, 1 JV R&D in Changchun, integrated in the global R&D network,
Test facilities certified by global OEMs Continuous reinforcement of local team and competences Industrial style as differentiation factor “East Works” for advanced innovation

Prop
erty
of Fa
urec
ia-D
uplic
ation
pro
hibite
d
FAS China product plan on Complete Seats Global & Customization – Next generation
Investor Day – Shanghai – November 11, 2014 54
We Focus
We Focus
Offboard Wellness Assessment
Foot massage module 2nd social row Removable cover Safety Cover Carving
Air CleanerBamboo
Luxury trend for brand
Personalized trend
Environment trend
OEM Focus
End User Focus
Global Concern
Self Adjustment Connected with smart accessories Shape adjustment for comfort Tactile Seat Display Smart Fit
Audio & comfort Health “Magic” flexibility Heat & Vent
We Focus Customization - Integrated Intelligence

Prop
erty
of Fa
urec
ia-D
uplic
ation
pro
hibite
d
FAS China product plan on Front Seat Structure Generic & Modular – Next generations with weight & cost reduction
Investor Day – Shanghai – November 11, 2014 55
1-2
3-1
1-1
3-2
10.5 Kg
2009 SOP2011 20132012 20142006 2015 2016
8.5 Kg
12.0 Kg
11.5 Kg
5-1
11.9 Kg
2013-2018 CHINA
2013-2022 CHINA
2013-2022 CHINA
2014-2021 CHINA
Next generation
5-2
11.5 Kg
11.5 Kg
~15.0 Kg
2-1
17.07 Kg
2-2
15.59 Kg
2015-2023 CHINA
Developed in China
4-2
11.5 Kg
4-1
13.7 Kg
4-3
Customer A
Customer C
Customer D
Customer E
Customer B

Prop
erty
of Fa
urec
ia-D
uplic
ation
pro
hibite
d
FAS China product plan on MechanismsGlobal & Standard – Next generations with size, weight & cost reduction
Investor Day – Shanghai – November 11, 2014 56
Recliner III Recliner IVRecliner II
Track IIITrack IITrack I
E-Pump I E-Pump II
2006 SOP2008 20112010 20122003 2013 2014
Recliners
Tracks
E-Pumps
2015 2016
Recliner I
-19% vs. Recliner I -35% vs. Recliner III
-16% vs. Track II
-10% vs. E-pump1
Only 1 worldwide production facility in China

Prop
erty
of Fa
urec
ia-D
uplic
ation
pro
hibite
d
Key takeaways
Investor Day – Shanghai – November 11, 2014 57
1
2
3
4
FAS China achieved 18% CAGR in the past 4 years, reaching €830m by 2014.It has developed leading market shares in Frames (#2 at 13%)
and Mechanisms (#1 at 16%)
FAS China targets to maintain sales at 20% CAGR in the next 4 years which will lead to 3% to 6% market share increase per product line,
sales of €1.7b in 2018
FAS China has formulated clear customer, product, manufacturing strategies to ensure growth and profitability, including customer mix, footprint optimization,
vertical integration, and program cost improvements
FAS China benefits from solid HR foundation on which it will further develop the organization strength and competitiveness, with 7,700 people in 2018

Investor Day
ShanghaiNovember 11, 2014

Emissions Control TechnologiesFaurecia China
Thierry AubryNovember 11, 2014

Prop
erty
of Fa
urec
ia-D
uplic
ation
pro
hibite
d
Investor Day – Shanghai – November 11, 2014 60
CAGR = 23%
2014 Forecast Total Sales
Total Plants
Business Awards
2009+2010 2011+2012 2013+2014e2010 2012 2014e
≈ € 1.1bn Total Sales
≈ € 660m Product Sales
15 Plants
> 4,400 employees
R&D1 center
288 engineers 911 12
14 15
2010 2011 2012 2013 2014
2011 2013
FECT is the market leader of emission control in China
499607
778990
≈ 1,100
1,680
2,440 ~2,300
€m €m

Prop
erty
of Fa
urec
ia-D
uplic
ation
pro
hibite
d
FECT China is composed of 4 product families
Investor Day – Shanghai – November 11, 2014 61
Catalytic Converters Complete LinesManifolds Mufflers
First operation2008: Qingdao
2014 operation scale> 2 Mio parts / year
First operation1998: Changchun
2014 operation scale> 4 Mio parts / year
First operation1994: Wuhan
2014 operation scale> 3 Mio parts / year
First Operation1994: Wuhan
2014 operation scale> 1 Mio parts / year
Prop
erty
of Fa
urec
ia-D
uplic
ation
pro
hibite
d
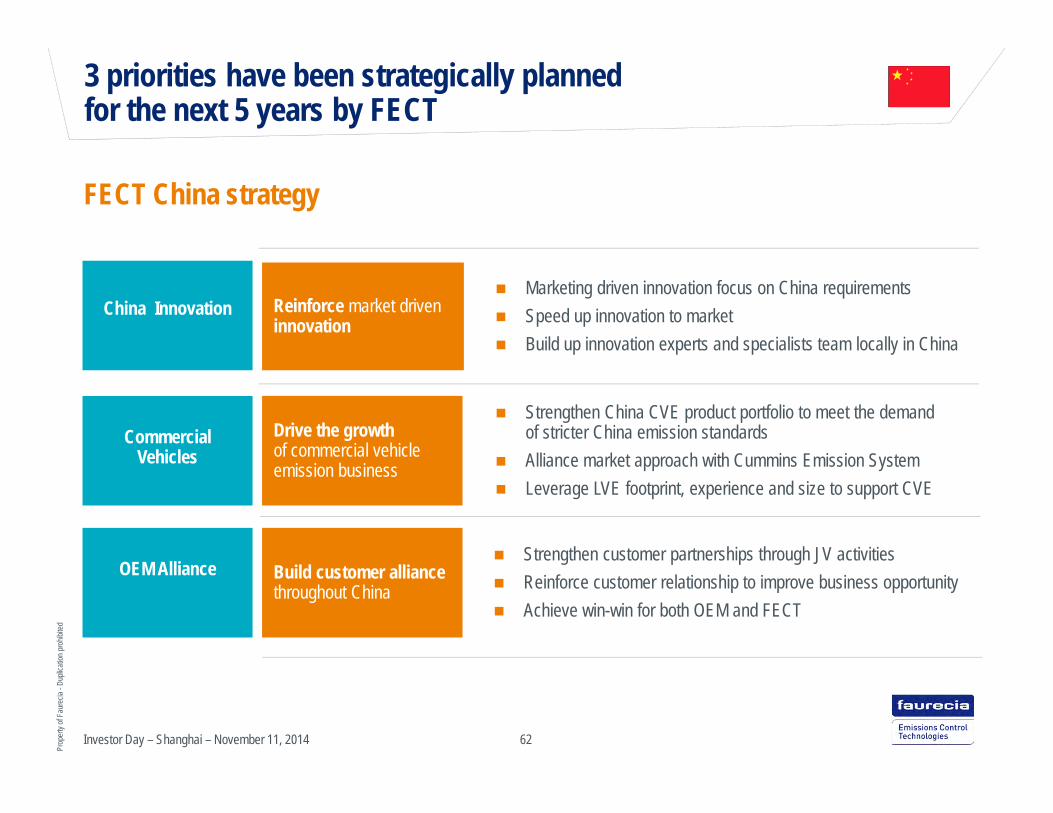
3 priorities have been strategically planned for the next 5 years by FECT
FECT China strategy
62
Strengthen customer partnerships through JV activities Reinforce customer relationship to improve business opportunity Achieve win-win for both OEM and FECT
Build customer alliance throughout China
Reinforce market driveninnovation
Marketing driven innovation focus on China requirements Speed up innovation to market Build up innovation experts and specialists team locally in China
Drive the growth of commercial vehicle emission business
Strengthen China CVE product portfolio to meet the demand of stricter China emission standards
Alliance market approach with Cummins Emission System Leverage LVE footprint, experience and size to support CVE
China Innovation
Commercial Vehicles
OEM Alliance
Investor Day – Shanghai – November 11, 2014

Prop
erty
of Fa
urec
ia-D
uplic
ation
pro
hibite
d
63
FECT in superior position through technology and global organization
FECT is clear market leader with 27% market share
Diversified competition
Technology is FECT strength
Global program management is key competitive advantage
Market share in 2013
Competition landscape in China
Source: FECT China
Tenneco
27% Faurecia
Sejong
Calsonic KanseiSangoLihe
OthersTotal
of around 20 Competitors
Investor Day – Shanghai – November 11, 2014

Prop
erty
of Fa
urec
ia-D
uplic
ation
pro
hibite
d
FECT China with very balanced customer portfolio
64
2016 20182014
€ 1.4bn€ 1.6bn
€ 1.1bn
LVE
CVE
Investor Day – Shanghai – November 11, 2014

Prop
erty
of Fa
urec
ia-D
uplic
ation
pro
hibite
d
FECT China will reach 30% market share in CVE in 2018
Investor Day – Shanghai – November 11, 2014 65
CVE Business development
Market volume evolution on road (M Units)
Driving CVE business growth by the alliance with CES (Cummins Emission System) and partnership with local players
Develop technology co-operation with Chinese CV OEMs
After treatment systems shall reach 3.6 M Units in 2018
FECT is targeting to reach 30% market share in the next 5 years
After treatment systemNon emissionized
2014 2015 2016 2017 2018
3.6 3.8 4.1 4.4 4.5
2020
3.6

Prop
erty
of Fa
urec
ia-D
uplic
ation
pro
hibite
d
CVE
FECT China Footprint
Investor Day – Shanghai – November 11, 2014 66
Number of plants every year
+ 3 plants+ 0 plant + 0 plant
6 plants8 plants 1 plant
"JIT Sequence delivery""Technology capacity"
JIT plants: Plan 3 new footprints Techno plants: Complete exhaust systemproduction capacity, key components manufacturingCVE: Fully loading the current one and use LVE actual footprints
Techno plants JIT plants
201415 plants
2018+3 plants
‘13 ‘14 ‘15 ‘16 ‘17 ‘18Year
14 15 16 17 18 18Plan number
• Central 2• East 3• South 1
• Central• Northeast:1• Central 2• East: 4• West: 1

Prop
erty
of Fa
urec
ia-D
uplic
ation
pro
hibite
d
Acoustic Performance EDST (3) Noise dampersEVO valve/Electric valve
Emissions reduction ASDS (2) GPF (1)
Weight reduction LW hot endBrazed cold end
Energy recovery EHRM (4) Compact EHRS (5) RankineDirect oil gear box heating
Fabricated T ManifoldMono and Airgap
Closed couple SCR : U shape – C-mixer
Ultra light-weight cold end
Modular NVH solution
Our focus in the next 5 years will be reinforcing product strategy and promoting innovation
Investor Day – Shanghai – November 11, 2014 67
2015 20202013 2017
1. Gasoline Particulate Filter
Product & Technology roadmap
3. Exhaust Dynamic Sound Technologies
2015 20202013 2017
5. Exhaust Heat Recovery System4. Exhaust Heat Recovery Manifold 2. Ammonia Storage and Delivery System

Prop
erty
of Fa
urec
ia-D
uplic
ation
pro
hibite
d
Key takeaways
Investor Day – Shanghai – November 11, 2014 68
1
2
3
4
FECT has a clear market leader position on China market with over 25% market share
With 10% CAGR over the 2014-2018 period, FECT will increase market share in China
Innovation and technology, strong growth in CVE market and alliance strategy with OEMs as main pillars of FECT China strategy plan
FECT China has proven operational excellence including program management, footprint optimization and talent management and retention

Investor Day
ShanghaiNovember 11, 2014

Interior SystemsFaurecia China
Richard ZhangNovember 11,2014

Prop
erty
of Fa
urec
ia-D
uplic
ation
pro
hibite
d
FIS China Growth at 24% CAGR in the past 4 years
Investor Day – Shanghai – November 11, 2014 71
≈ € 270m Total Sales
13 Plants
≈ 2,800 employees
€m €m
2014: 13 Plants 12 Technology Plants 1 JIT Plant
R&D1 center
300 engineers
CAGR = 24%
2014 Forecast Total Sales
Plant Number
Business Awards
257477
>1,000
2009+2010 2011+2012 2013+2014e
116 136
~270
2010 2012 2014e
5
8
13
2010 2012 2014

Prop
erty
of Fa
urec
ia-D
uplic
ation
pro
hibite
d
FIS China is Composed of 4 product families
Investor Day – Shanghai – November 11, 2014 72
Instrument Panel Acoustic ModulesCockpit Door Panel
First operation2006: Chongqing
2013 operation scale> 300k units / year
First operation2005: Changchun
2013 operation scale1 Mio parts / year
First operation2005: Changchun
2013 operation scale2.2 Mio parts / year
First operation2010: Changchun
2013 operation scale0.7 Mio parts / year

Prop
erty
of Fa
urec
ia-D
uplic
ation
pro
hibite
d
Investor Day – Shanghai – November 11, 2014 73
Current merging of the market leaders open great opportunities for Faurecia Interior Systems
Market share in 2014 Market consolidation underway
Current merging of both leaders combined with an "over-splitting" of the market by local players is creating a very favorable business and partnership momentum for Faurecia Interior System
Yanfeng and Visteon had long-standing joint venture covering all automotive regions and OEMs
Yanfeng purchased all shares of joint venture in 2013
Yanfeng Interior China estimated sales € 2.1 bnin 2012
Yanfeng is now in the process of absorbing JCI Interiors (excluding electronics)
JCI Interiors has JVs with FAW, BAIC and GAC groups
JCI China Interior sales (excluding electronics) € 1.04 bn
Yanfeng
JCI
Yanfeng
Others
MobisCalsonic Kansei Faurecia
4%
Numberof player
42 (mainly Chinese)

Prop
erty
of Fa
urec
ia-D
uplic
ation
pro
hibite
d
Our sustainable business model is based on 4 key drivers
Toward 10% Market Share through a sustainable business model
Strategic Partnership
Product &Innovation
Programs & Operations efficiency
Entrepreneur and committed People
74Investor Day – Shanghai – November 11, 2014

Prop
erty
of Fa
urec
ia-D
uplic
ation
pro
hibite
d
Partnership and customer strategyStrategic partnership will be a key success factor
Standalone approach DiversificationStrategic Partnerships
Select Relevantand Sustainable Business
SVW FVWGeely
Diversify customer portfolioGuangdong Auto Group-CFA
Others
Enhance Market ShareChang An
(Ford , DS and CA own brand)Other opportunities
Reinforced customer intimacy, to better address: 1
Ford remains our Number one customer 2018 Sales split
European 38% Japan/Korean 18% American 32% Chinese 12%
CAGR around 30%
75Investor Day – Shanghai – November 11, 2014
Expected turnover
€ 270m~ € 400m
~ € 750m
2014 2016 2018
2 3 4
Our customer strategy is based on 4 main pillars

Prop
erty
of Fa
urec
ia-D
uplic
ation
pro
hibite
d
Industrial StrategyPriority is to saturate our existing "Technology" footprint
Investor Day – Shanghai – November 11, 2014 76
Number of plants every year
+ 6 plants+ 1 plant
201413 plants
2018+7 plants
1 plant12 plants
"Fast response""Ensure capacity"
Techno plants: To saturate our existing footprint which covers the main automotive basins.
JIT plants: To set up 6 new JITs supplied by our technoplant an ensuring quick responseto customer needs while limiting investments.
Techno JIT
‘14 ‘15 ‘16 ‘17 ‘18Year
13 14 15 18 20Plan number
• Northeast 1• East 3• South 2• Central 2
• Central 1

Prop
erty
of Fa
urec
ia-D
uplic
ation
pro
hibite
d
Product & innovation strategyAddressing upgrading, personalization and environment trend
Upgrading Premium Quality Cut & SewLOCOPSlush Lite Decostitich PipingIMP
Personalized trend Aluminum Ambient LightingSliding Dock Wi-charging
Environment trend
Air PurificationNAFI
77Investor Day – Shanghai – November 11, 2014
Matching with growing perceived quality expectations of Chinese market
Addressing enrichment and technology trends of Chinese market
Introducing global green technologies as well as specific technologies for China

Prop
erty
of Fa
urec
ia-D
uplic
ation
pro
hibite
d
Key Takeaways
78Investor Day – Shanghai – November 11, 2014
1
2
3
4
FIS China has engaged a successful growth and profitability allowing to target more than € 750m total sales by 2018
Strategic partnership with OEM is a key driver to address this ambitious plan. Our recent but successful CCAG JV is demonstrating the relevance of this approach
Operations and programs optimization are a must to be able to propose a competitive and profitable business model in China Interior market
People are at the center of this strategy. Priority is to develop and reinforce our team, enhancing entrepreneurship, continuous improvement and execution mindset

Investor Day
ShanghaiNovember 11, 2014

Investor DayStrategy update
Yann DelabrièreNovember 11, 2014

Benefit from selective resource allocation strategy
Accelerate in Asia
Leverage global platforms
Develop value-added technologies
2014 - 2016: Selective growth strategy confirmed
Investor Day – Shanghai – November 11, 2014 81

Faurecia Automotive SeatingOn track to meet its 2016 targets
Investor Day – Shanghai – November 11, 2014 82
Key drivers Mechanisms leadership and Generic frames China and Asian customer growth Customer diversification in particular growth with Nissan and Ford Value creating innovations based on fuel economy (weight reduction) and
smart comfort
Update on priorities Mechanisms and frames on track to reach over 8% operating margin in 2016 Back to growth in North America, with significant launches in H2 2014
and operational turnaround confirmed Single European division successfully created, profitability improving Renault-Nissan on track to become second largest client China opportunities confirmed
2016 Targets Total sales > € 7.1bn Operating margin > 5.0% ROCE* > 20%

Faurecia Emissions Control TechnologiesAhead of its roadmap, 2016 targets upgraded
Investor Day – Shanghai – November 11, 2014 83
Key drivers Capture the growth of the Commercial Vehicle markets especially in China Increase value-added through innovations: environmental performance
(NOx and particulates); fuel economy (weight reduction, energy recovery); acoustic performance (sound design)
Update on priorities Europe recovery is well engaged, further optimization to come North America turnaround ahead of plan Product and process standardization well underway CVE growth rate of around 20% CAGR confirmed, driven by partnership
with Cummins and regulation introduction especially in China moving to Euro 5
Business awards for energy recovery systems and SCR and interest in sound design demonstrate relevance of technology strategy
2016 new Targets Total sales > € 7.4bn (value-added sales > € 4.0bn) Operating margin close to 5.0%, (up from > 4.0%)
now above 8.0% on value-added sales ROCE* > 25% (up from around 25%)
*: Pre-tax and including goodwill

Faurecia Interior SystemsImproving in evolving environment, 2016 targets adjusted
Investor Day – Shanghai – November 11, 2014 84
Key drivers Selective growth strategy with focus on cash model Profitability increased through operational improvement Benefit from trend towards consolidation in the market Accelerate in Asia Expand higher profitability product lines (decoration, HMI)
Update Consolidation underway should improve competitive environment Strong operational improvement in Europe, North America
is progressing China growth acceleration confirmed Breakthrough in bio materials with clear roadmap
towards 30% weight reduction
2016 Targets Total sales > € 4.5bn Operating margin > 4.0% (from > 4.5%) ROCE* around 15% (from around 20%)
*: Pre-tax and including goodwill

Faurecia Automotive ExteriorsOn track to meet its 2016 targets
Investor Day – Shanghai – November 11, 2014 85
Key drivers Remain market leader in Europe Front End Modules (FEM) strategic review South America turnaround Develop long term potential for Composite Technologies
Priorities update Awarded first composite tailgate business and composite floorsco-development with OEMs
Margin improvement actions in North Europe (ex. Plastal) to accelerate South America capacity utilization rate close to 100% in 2016
and operational cost management underway
2016 Targets Total sales > € 2.0bn (or > € 1.5bn excl. FEM) Operating margin 4.5% - 5.0% ROCE* > 20%
*: Pre-tax and including goodwill
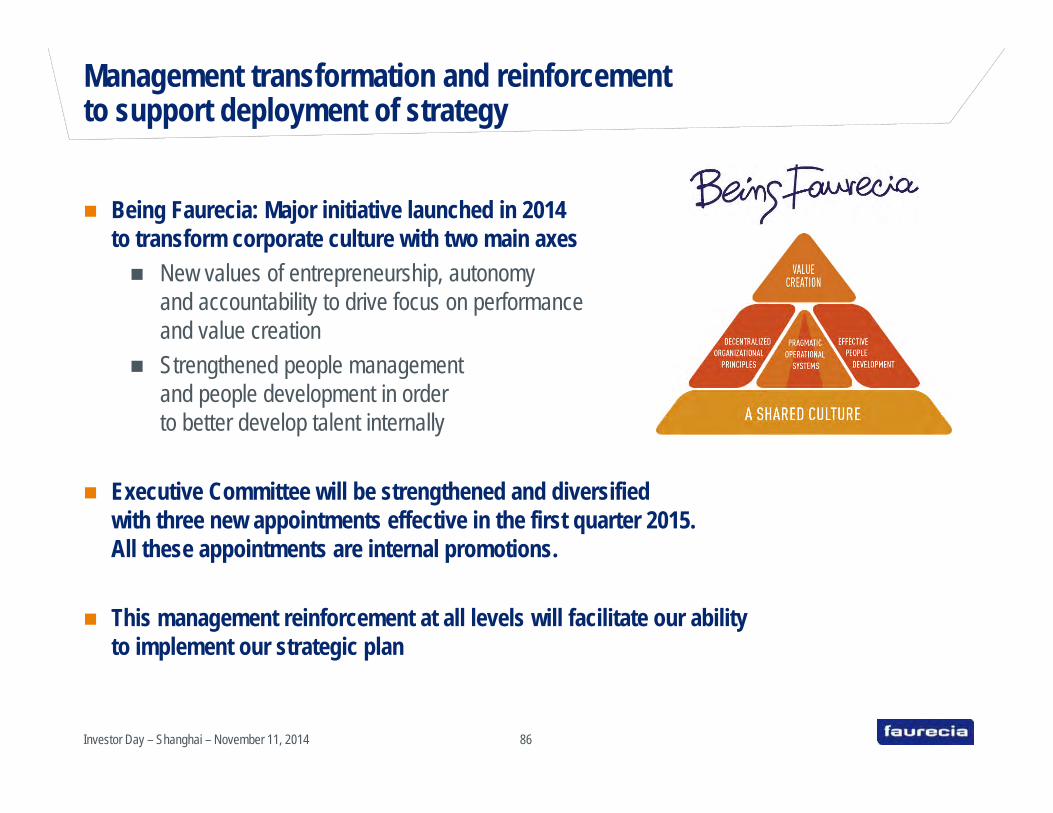
Being Faurecia: Major initiative launched in 2014 to transform corporate culture with two main axes New values of entrepreneurship, autonomy
and accountability to drive focus on performance and value creation
Strengthened people management and people development in order to better develop talent internally
Executive Committee will be strengthened and diversified with three new appointments effective in the first quarter 2015. All these appointments are internal promotions.
This management reinforcement at all levels will facilitate our ability to implement our strategic plan
Management transformation and reinforcement to support deployment of strategy
Investor Day – Shanghai – November 11, 2014 86

2016 Targets are fully confirmed
Investor Day – Shanghai – November 11, 2014 87
Sales above 21 billion eurosOperating margin 4.5 – 5.0%
Net cash flow around 300 million eurosROCE* > 20%
*: Pre-tax and including goodwill

Investor Day
ShanghaiNovember 11, 2014

Investor DayGroup financial strategy and targets
Michel FavreNovember 11, 2014

Prop
erty
of Fa
urec
ia -D
uplic
ation
pro
hibite
d
Increasing operating margin from 3.0% in 2013 to 4.5% - 5.0% in 2016
Capex + capitalized R&D around € 800m
Asset turn to improve by 20bp to close to 5x
* Pre-tax and including goodwill
2012 2013 2014 2015 2016
Reminder of financial targetsROCE to increase by 50% from 14% in 2013 to over 20% in 2016
> 20%
13% 14%
Investor Day – Shanghai – November 11, 2014 90
ROCE *

Prop
erty
of Fa
urec
ia -D
uplic
ation
pro
hibite
d
Increasing EBITDA margin (>150bps gain or > € 300m contribution)
Improved Capital Employed
Additional factoring of receivables in 2014
Reduced financial expenses (€ 150m objective in 2016 vs € 200m in 2013)
2013 2014 2016
Positive144
Around 300
Reminder of the financial targetsNet Free Cash Flow generation around € 300m in 2016
Investor Day – Shanghai – November 11, 2014 91
Net Free Cash Flow in €m

Prop
erty
of Fa
urec
ia -D
uplic
ation
pro
hibite
d
Priority to strategic OEMs
Priority to the two Business Groups (Emissions Control Technologies and Automotive Seating) which require lower Capex and capitalized R&D
Priority to new footprint expansion mainly in Asia
Negotiate better financing terms with OEMs for development cost
Reminder of the financial targetsOptimize resource allocation
4 key priorities
Investor Day – Shanghai – November 11, 2014 92

Prop
erty
of Fa
urec
ia -D
uplic
ation
pro
hibite
d
Financial priorities and resource allocation
€ 100m per year dedicated to research and innovation expenses (within the R&D budget)
€ 50m per year from 2015 onwards for restructuring expenses to continue to optimize the industrial footprint and increase the average size of our plants
€ 100m of Capex for process standardization
Around € 100m capital allocation over 2015-2016 to buy-back minorities
Investor Day – Shanghai – November 11, 2014 93

Prop
erty
of Fa
urec
ia -D
uplic
ation
pro
hibite
d
Main profitability drivers by regionAsia >8% and N. America and Europe >4% operating margin
Investor Day – Shanghai – November 11, 2014 94
Main drivers
Growth(volume & mix)
Asia is our top priority and it is where growth prospects are the best North America is restarting a cycle of secular growth
Commercial margin(Project management & re-pricing)
North America is where better project and commercial management should help the most
In South America, re-pricing to take into account high inflation, lower volumes and currency swing is key to a margin recovery
Footprint optimization Footprint optimization is an ongoing process and will lead to sizeable margin expansion
Standardization North America and Europe is where standardization is expectedto yield savings
Operational performance North America and to a certain degree South America will benefit from operational improvements
Geographical mix With Asia being the fastest growing region and also the most profitable region, it is helping overall margin expansion
Operating margin improvement(2014-2016)
100 – 150bp

Prop
erty
of Fa
urec
ia -D
uplic
ation
pro
hibite
d
Investor Day – Shanghai – November 11, 2014 95
Financial targets by region (updated vs initial)
> 21.0 (> 20.5 excl. FEM)
4.5% to 5.0%
Group total sales (in €bn)
Operating marginas % of total sales
> 10.7 (> 10.2 excl. FEM)> 5.4
Close to 4.0Close to 1.0
Total sales (in €bn)EuropeNorth AmericaAsiaSouth America & rest of world
4.5% - 5.0%> 4.0%> 8.0%
Breakthrough in profitabilityand focus on cash generation
Operating margin(% of total sales)
EuropeNorth AmericaAsiaSouth America & rest of world
2016 updatedFAURECIA Comment
Depending on strategicreview outcome
Depending on strategicreview outcome
UpgradedAdjusted
Upgraded
UpgradedAdjusted
> 21.0
4.5% to 5.0%
> 10.7> 5.4> 3.8> 1.1
4.0% - 5.0%5.0%
> 7.0%Breakthrough in profitability
and focus on cash generation
2016 initial

Prop
erty
of Fa
urec
ia -D
uplic
ation
pro
hibite
d
2014 2016
56%25%
14%5%
Europe
North America
South America & rest of world
Asia
26%
52% Europe
18%4%
South America & rest of world
North America
Asia
Investor Day – Shanghai – November 11, 2014 96
Regional perspectiveBetter balanced portfolio
Product sales by region

Prop
erty
of Fa
urec
ia -D
uplic
ation
pro
hibite
d
Investor Day – Shanghai – November 11, 2014 97
Main profitability drivers by Business GroupAll Business Groups above 4% operating margin
Main drivers
Growth(volume & mix)
Automotive Seating & Emissions Control Technologies are the fastest growing Business Groups
Commercial margin(Project management & re-pricing)
Interior Systems will benefit the most from improved project management and also re-pricing
Footprint optimization Automotive Seating, Emissions Control Technologies and Interior Systems will benefit the most from continuous footprint optimization
Standardization Automotive Seating with generic frames and Emissions Control Technologies with industrial standardization will generate sizeable savings
Operational performance Interior Systems is where improved operational performance especially in North America will yield significant margin expansion
Geographical mix Interior Systems will grow very fast in Asia where margins are higher and therefore will benefit from a favorable mix improvement.
Operating margin improvement (2014-2016) 100 – 150bp

Prop
erty
of Fa
urec
ia -D
uplic
ation
pro
hibite
d
98
Financial targets by Business Group (updated vs initial)
> 21.0 (> 20.5 excl. FEM)4.5% to 5.0%
> 20%around 300
Group total sales (in €bn)Operating marginas % of total salesROCE *Net cash flow (in €m)
> 7.4
Total sales (in €bn)
Emissions Control Technologies> 4.5Interior Systems
> 2.0 (>1.5 excl. FEM)Automotive Exteriors
> 7.1Automotive Seating
close to 5.0%
Operating margin (% of total sales)
> 4.0%4.5% - 5.0%
> 5.0%Emissions Control TechnologiesInterior SystemsAutomotive Exteriors
Automotive Seating
around 15%
ROCE **> 20%> 25%
> 20%
Emissions Control TechnologiesInterior SystemsAutomotive Exteriors
Automotive Seating
* pre-tax and including goodwill
2016 updatedFAURECIA
Investor Day – Shanghai – November 11, 2014
Comment
Depending on strategic review outcome
Depending on strategic review outcome
Upgraded (> 8.0% on value-added sales) Adapted
UpgradedAdapted
> 21.04.5% to 5.0%
> 20%around 300
> 7.4> 4.5> 2.0
> 7.1
> 4.0%> 4.5%
4.5% - 5.0%
> 5.0%
around 20%
> 20%around 25%
> 20%
2016 initial

Prop
erty
of Fa
urec
ia -D
uplic
ation
pro
hibite
d
Significant profitability increase from 3.0% to 4.5% - 5.0% OM
Capex and capitalized R&Daround at € 800m
Tight WCR control€ 5m additional for 1%
sales change
Investor Day – Shanghai – November 11, 2014 99
Generate strong cash flow in 2016
Free cash flow before interest and tax of around 80% of operating income
Optimize financial expenses and taxes (around 32% tax rate)
Net cash flow around € 300m

Prop
erty
of Fa
urec
ia -D
uplic
ation
pro
hibite
d
Investor Day – Shanghai – November 11, 2014 100
Cash Flow generationMain drivers
EBITDA
Change in WCR
Capex + capitalized R&D
Restructuring
Finance expenses
Tax & Other
Net cash flow
Driver
Higher operating income (> 150bp margin improvement between 2013 and 2016) and higher D&A
Improvement partially offsetting sales growth
Strong discipline and selective capital allocation according to new footprint opportunities
Continuous footprint optimization
Refinancing will generate sizeable savings (Objective € 150m in 2016 vs€ 200m in 2013)
Higher taxes from higher PBT to be partially offset by recovery of tax lossescarry forward
Objective of around € 300m by 2016

Prop
erty
of Fa
urec
ia -D
uplic
ation
pro
hibite
d
Investor Day – Shanghai – November 11, 2014 101
WCR optimizationZoom on main drivers
Driver
Receivables Reduction of customer overdues & alignment of customer terms Factoring programs extension with additional lines in new countries and general
business growth
Inventories Reduction of minimum 1 day (out of 11 days)
Payables Gain of 1 day through alignment and reverse factoring
Other Geographical mix & contingencies will weigh on WCR

Prop
erty
of Fa
urec
ia -D
uplic
ation
pro
hibite
d
Objective to be 100% financed by capital markets (factoring customer receivables and issuing bonds)
Ensure liquidity and independence through a 5 year syndicated credit facility (€1.2bn) with our core international partner banks
Go back to the bond market to refinance our existing and expensive bonds through a new bond
Investor Day – Shanghai – November 11, 2014 102
Debt & financing
Financing strategy
Prop
erty
of Fa
urec
ia -D
uplic
ation
pro
hibite
d
Investor Day – Shanghai – November 11, 2014 103
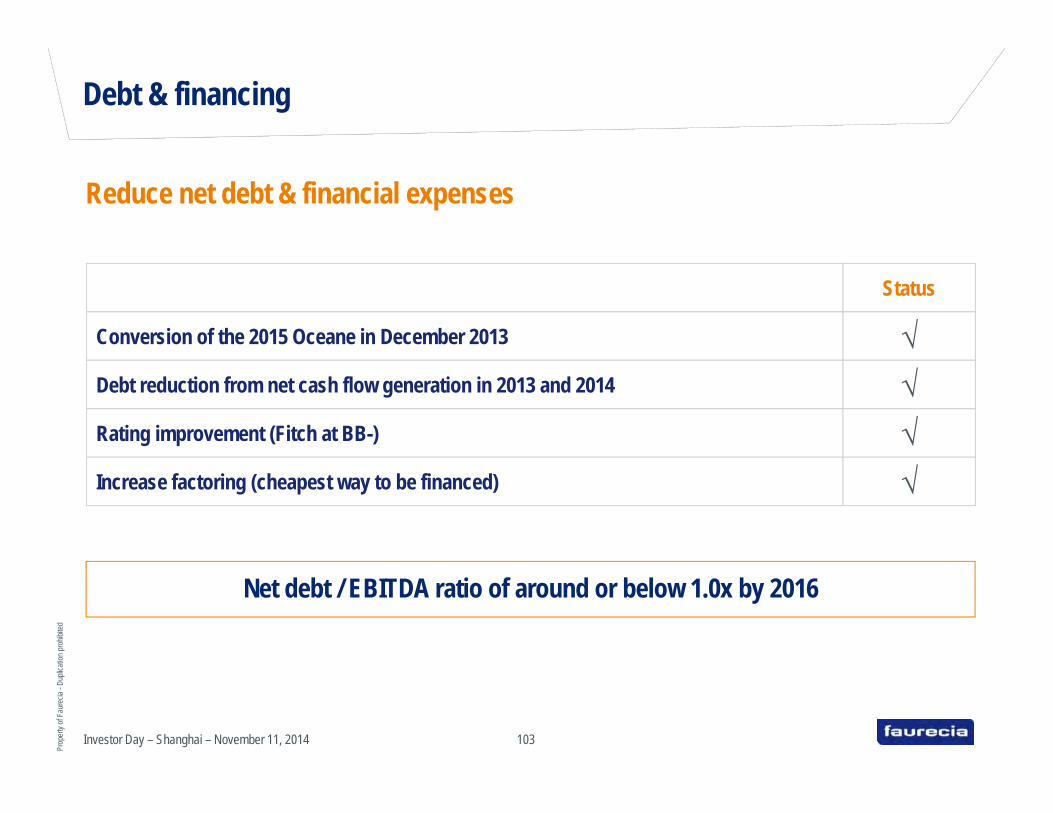
Debt & financing
Reduce net debt & financial expenses
Net debt / EBITDA ratio of around or below 1.0x by 2016
Status
Conversion of the 2015 Oceane in December 2013 √Debt reduction from net cash flow generation in 2013 and 2014 √Rating improvement (Fitch at BB-) √Increase factoring (cheapest way to be financed) √

Prop
erty
of Fa
urec
ia -D
uplic
ation
pro
hibite
d
Investor Day – Shanghai – November 11, 2014 104
Update on refinancing
Status
Renewal of the € 1.2bn, 5 year syndicated facility at better conditions √
Refinancing of the 2019 HY bond (€ 250m) at better conditions Call option in June 2015
Refinancing of the 2016 HY bond (€ 490m) at better conditions Maturity in December 2016
Conversion of the 2018 convertible bond (€ 250m) Option to force conversion in early January 2016 if share price above € 25
Net debt / EBITDA ratio of around or below 1.0x by 2016

Prop
erty
of Fa
urec
ia -D
uplic
ation
pro
hibite
d
Investor Day – Shanghai – November 11, 2014 105
Conclusion
Large opportunities with refinancingFirst phase is accomplished
Faurecia is well on track to achieve its 2016 targets

Prop
erty
of Fa
urec
ia -D
uplic
ation
pro
hibite
d
106
Contact & Share data
Investor Relations
Eric-Alain Michelis2, rue Hennape92735 NanterreFrance
Tel: +33 1 72 36 75 70Cell: +33 6 64 64 61 29Fax: +33 1 72 36 70 30E-mail: [email protected] site: www.faurecia.com
Share DataBloomberg Ticker: EO:FPReuters Ticker: EPED.PADatastream: F:BERTISIN Code: FR0000121147
ADR DataTicker: FURCYRatio: 2 ADRs for 1 shareAgent: Citi Group
2013 Results & 2014 Objectives – February 12, 2014
Bonds ISIN Codes2016 bonds : XS0704870392 2019 bonds : XS07789178142018 convertible : FR0011321363
Investor Day – Shanghai – November 11, 2014

Prop
erty
of Fa
urec
ia -D
uplic
ation
pro
hibite
d
107
Safe Habor Statement
This report contains statements that are not historical facts but rather forward-looking statements. The words"will," "may," "designed to," "outlook," "believes," "should," "anticipates," "plans," "expects," "intends,""estimates" and similar expressions identify these forward-looking statements. All such statements are basedupon our current expectations and various assumptions, and apply only as of the date of this report.
Our expectations and beliefs are expressed in good faith and we believe there is a reasonable basis for them.
However, there can be no assurance that forward-looking statements will materialize or prove to be correct.Because such statements involve risks and uncertainties such as automotive vehicle production levels, mixand schedules, financial distress of key customers, energy prices, raw material prices, the strength of theEuropean or other economies, currency exchange rates, cancellation of or changes to commercial contracts,liquidity, the ability to execute on restructuring actions according to anticipated timelines and costs, theoutcome could differ materially from those set out in the statements.
Except for our ongoing obligation to disclose information under law, we undertake no obligation to updatepublicity any forward-looking statements whether as a result of new information or future events.
Investor Day – Shanghai – November 11, 2014

Investor Day
ShanghaiNovember 11, 2014
