strategic resource planning at ericsson research...
TRANSCRIPT

Strategic Resource Planning at Strategic Resource Planning at Strategic Resource Planning at Ericsson Research CanadaEricsson Research CanadaEricsson Research Canada
Eduardo MirandaEduardo MirandaEduardo Miranda
Enterprise PerformanceEnterprise PerformanceEnterprise Performance
PMI Global Congress 2003PMI Global Congress 2003PMI Global Congress 2003

Ericsson Worldwide• Present in more than 140 countries
• International operations for more than 120 years
• R&D centers worldwide
• Leader in mobile infrastructure
• Listed on major international stock exchanges
• Net sales 2002: SEK 145.8 billion
• 60,000 employees

The Swedish TelecommunicationsPioneer
• Company founded in 1876 by Lars Magnus Ericsson
• First export orders in 1881
• Trademark registered in 1894
• Manufacturing abroad in 1897
Ericsson Products

Ericsson Research Canada
• 150M US$ in R&D investment in 2002
• Ranked 5th in overall R&D spending in Canada
• Ericsson’s largest R&D centre outside of Sweden
• 1,600 employees

Ericsson’s Worldwide OrganizationGlobal Market and Sales Organization
America, Asia Pacific, Europe, Middle East and Africa
Business Units
Transmission &Transport NetworksGlobal ServicesMobile Systems
CDMASystems
Core Units
Core NetworkDevelopment
Radio NetworkDevelopment Supply Service Network
& Application
Montreal Design Center
TDMA Systems CDMA CoreNetworks
Service NetworkApplication Dev.
CDMA Radio Access Network
MMSProvisioning

Ordering of workEricsson
Research Canada
CDMA
MMS
Core Units
Core NetworkDevelopment
Service Network& Application
Global Services Services
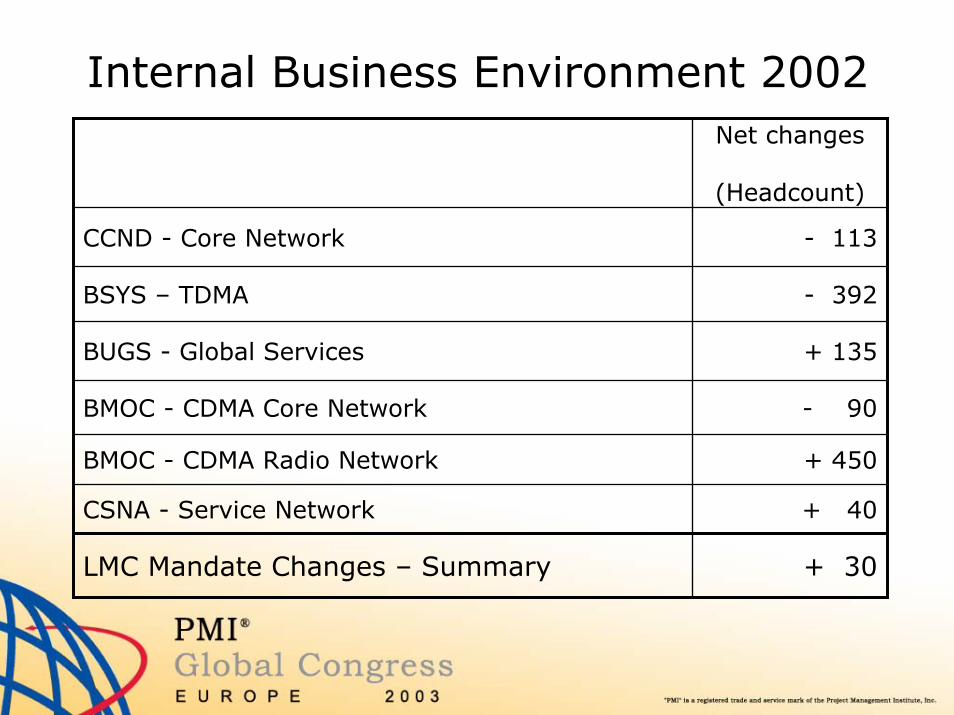
Internal Business Environment 2002
+ 30LMC Mandate Changes – Summary
+ 40CSNA - Service Network
+ 450BMOC - CDMA Radio Network
- 90BMOC - CDMA Core Network
+ 135BUGS - Global Services
- 392BSYS – TDMA
- 113CCND - Core Network
Net changes
(Headcount)

Two levels of Resource Planning
Line Managers
On-going
MS-Project 2002 / Project Server
Satisfy the needs of the projects
Develop individuals by providing challenging assignments
Shorter horizon (3 to 6 months)
Assignment at the task level
Named individuals
Operational
Senior Management
Performed quarterly or when major changes mandate
Home-grown tool (ResourcePlanner)
Strengthen ability to plan for resource build-up, competence shifts, reduction or transfers on a company wide basis
Provide a factual base for negotiations of new or changed mandates
Longer horizon (2 to 3 years)
Allocation done at project level
Competence based
Strategic
PerformancePurposeCharacteristics

Key Success Factors
• Provides information management can act upon
• Low maintenance
• Data ownership

Provides information management can act upon
• Do we have enough people to meet our current demand?
• Do we know what are we going to be doing next year?
• Do we have a balanced workload?
• Where is people need next? When?
• Where is people available? When?
• What competencies are required next? When?
• What can we move to make room for an urgent request?

Low maintenance
• Uses available data
– Project name– Start date– Duration– Effort required– Market availability date– Product life span– Post sale support
• Does not require detailed planning
• Does not require detailed allocations
Data ownership
• Units own the profiles used to calculate the resources needed by each project
• Emphasis is put on resolving problems and not in drawing nice looking charts
• Independent review of the data submitted keeps the units honest

Strategic Resource Planning Process
Plans are reviewed by the Unit’s
Manager and LMC GM
The data is consolidated in the LMC ResourcePlanner tool by Enterprise Performance. Plans are reviewed and issues
clarified.
Development profiles are agreed with the units’ Project Offices. Each profile comprises: Effort breakdown per competence area, Effort spread per competence area. This is only done when the system is set-up or when the need for a new profile arises.
Individual resource plans
are consolidated
Plan is executed
1
3
6
Approved plan is
released
8
Joint Management Review
Units define their working patterns
Project Profiles
Adjustments are
requested (if needed)
Clarifications are
requested (if needed)
4
7
The likelihood of the projects/technology happening is independently assessed by
Strategic Business DEvelopment
Projects likelihood is independently
assessed
5
Quarterly, each unit updates its own list of projects in their copy of the ResourcePlanner tool. The information required includes: the unit’s headcount, project names, start/end dates, project types and
effort required. The individual plans are sent to Enterprise Performance via e-mail.
2
Unit’s resource plans are prepared

Step 1. Units define their own work patterns
Waterfall TDMA RUP

Step 2, 3 & 4. Compiling the Information
• Start & duration• Total effort• Profile
Unit Resource Load
Company Resource LoadAveraged Quarterly Headcount
0.00
200.00
400.00
600.00
800.00
1000.00
1200.00
1400.00
1600.00
1800.00
Jan-
02
Apr-0
2
Jul-0
2
Oct
-02
Jan-
03
Apr-0
3
Jul-0
3
Oct
-03
Jan-
04
Apr-0
4
Jul-0
4
Oct
-04
Pers
ons
Project Mgmt. Sys. Design Soft. Dev. Sys. Integration Config. Mgmnt. Sys. Deplymnt. Tech. WritingOps. Dev. Network Supp. Research Customer PM LM & Supp. P&B Mgmt. IS/ITIPR Mark. & Comm. Other -1 Std +1 Std Current Headcount
Project Project Project

Step 5, 6 & 7. Reviewing the resource situation

Forecasted workloadCurrent
Headcount
Year’s end Headcount
Required resources
broken down by
competence
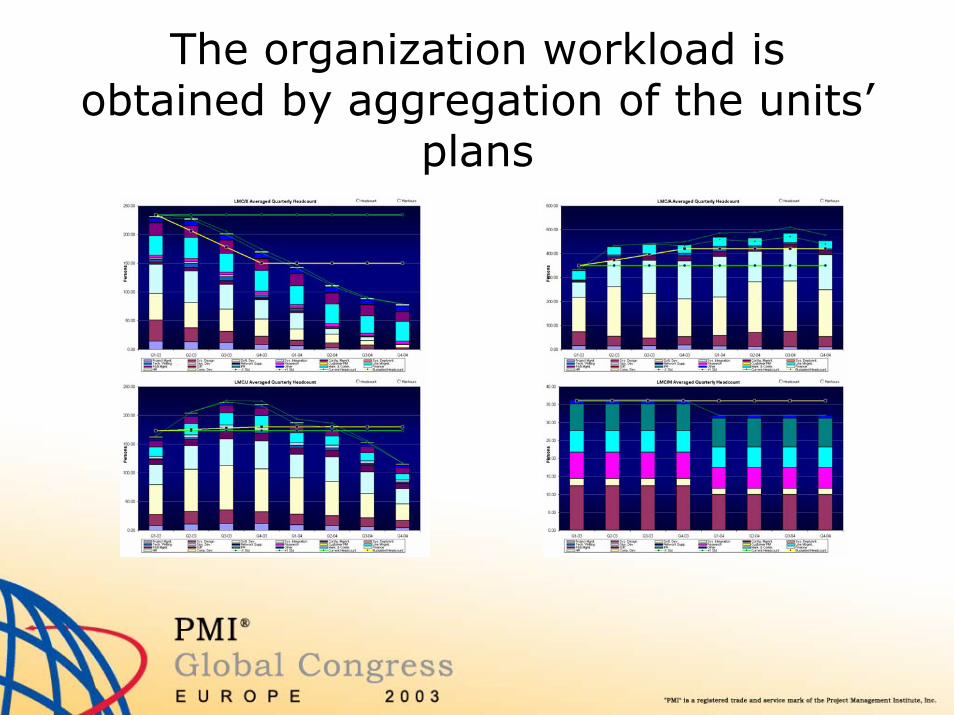
The organization workload is obtained by aggregation of the units’
plans

Workload Views
Likelihood
Technology
Unit Work Spectrum
Budget
Status

Capacity Vs. Demand ChartsCurrent
Headcount
Previous plan
Current plan
Competence area
Quarter
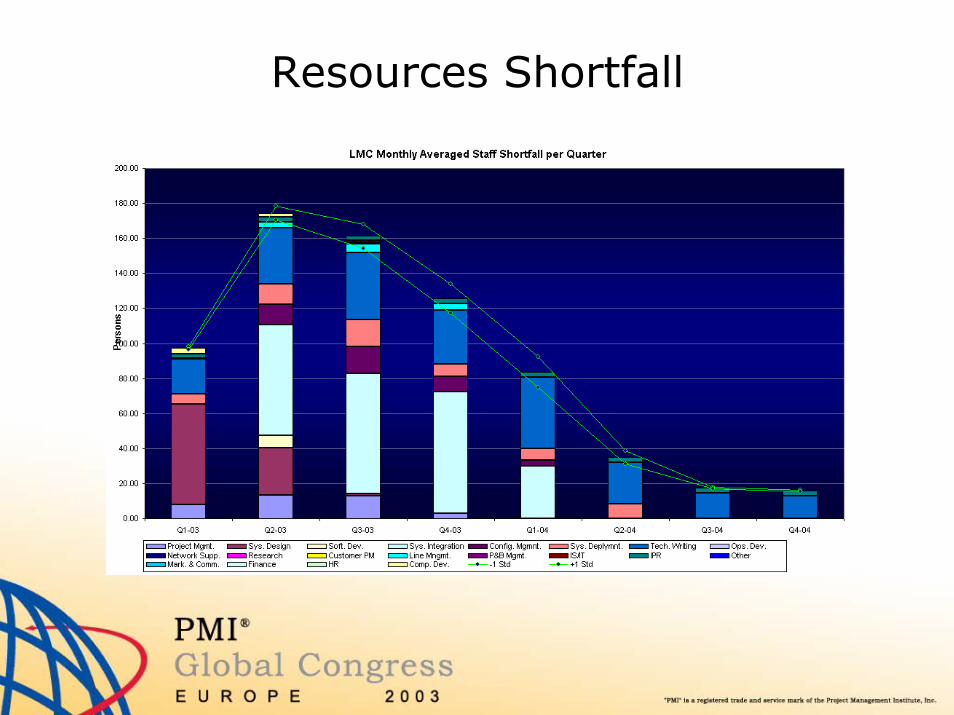
Resources Shortfall

Resources Availability

Due Dates

Time lines
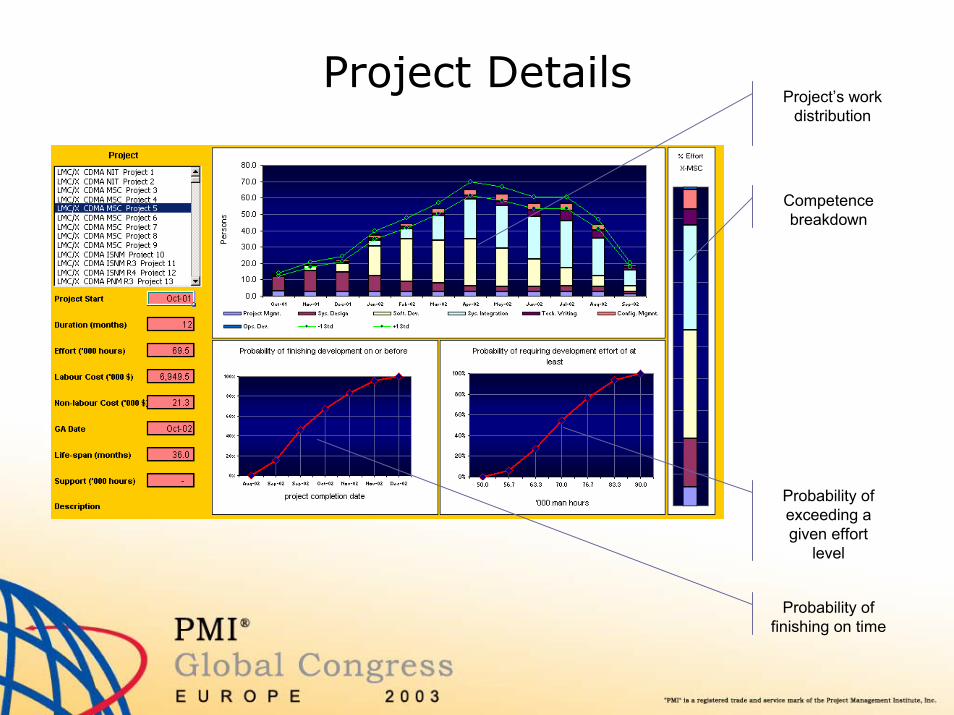
Project DetailsProject’s work
distribution
Competence breakdown
Probability of finishing on time
Probability of exceeding a given effort
level

Text output enables the creation of user defined graphs

Step 8. Executing the resource plan
• Frame Agreements
• Transfers
• Competence development
• Downsizing
• Recruiting

Calculating demand

ExamplePr
ojec
t dur
atio
n 10
mon
ths
(est
imat
ion)
Total Project Effort 10,000 hrs (estimation)
Software Development 40%System Design 20%Project Management 10% Testing & Integration 30%
Software Development 4,000 hrs
System Design 2,000 hrs
Project Management 1,000 hrs
Testing & Integration 3,000 hrs
100, 100, …, 100 hrs/mth
150, 200, 300, …, 50 hrs/mth 50, 100, 300,…, 600 hrs/mth
500, 100, 200…, 100, 50 hrs/mth

Block Diagram
Project man-hours per competence area spread over time
Stored Project Profiles
Project Man-Hours
XEffort breakdown per competence area
Project man-hours per competence area
Project Duration
Normalized effort spread per
competence areaX
Effort spread per competence area
X

Summary

• The strategic resource planning process provides the project oriented organization with the capability to coordinate the use of scarce resources.
• Key success factors in the implementation of the process are:
– Provide information management can act upon– Low maintenance– Data ownership

References
• Running the Successful Hi-tech Project Office, E. Miranda, Artech House, March 2003
• Strategic Resource Planning Process, Ericsson Internal, January 2001
• Revolutionizing Product Development Quantum Leaps in Speed, Efficiency, and Quality, S. Wheelwright and K. Clark, The Free Press, 1992