designing to combining critical chain planning andchain...
TRANSCRIPT

Designing To Schedule:Schedule:
Combining Critical Chain Planning andChain Planning and
Incremental Development inDevelopment in
Software Projects
SWT05SWT05
Eduardo MirandaEduardo MirandaEricsson Research Canada

Agenda
• Defining hard deadlines
• Critical issues in projects with hard deadlines• Critical issues in projects with hard deadlines
• The fundamentals
• Combining Critical Chain Planning with Incremental Development
• Summary

Defining hard deadlines
• Trade shows, campaign launches and regulatory dateslaunches and regulatory dates are a reality.
• In the cases above, and in many others, the date of d li i i t t thdelivery is as important as the delivery itself.
Critical issues in projects with hard deadlinesp j
• Scope of the project
• Allowances for variations on the execution of the tasks that made up the project
• Assessing remaining work

Dealing with scope
• It is no the same…
– To start with a twelve months To start with a twelve months project than to start with a six one, that is latter extended by an additional six.additional six.
– To start with a small product than cutting in half a large
d b h iddl f hproduct by the middle of the project to meet the deadlines.
– To start a project with the rightTo start a project with the right amount of people than to add resources anytime after.

The consequences of starting with the wrong estimateestimate
TTL O i ff
nt Newcomers effortTTR
TTL
R
Overtime effort
Hea
dcou
n
Overtime effort
TTD
E = H x PS, planned level of effort H
Time
PS
CoachingPC x R
PS

Definitions
• TTD (Time To Delay). The time it takes to the project team to realize/accept that the project is going to be late and they need to do somethingsomething.
• TTR (Time To Recruit). The time it takes to get additional resources after the decision has been made.
• TTL (Time To Learn). The times it takes to a new comer to became fully functional in the project.
• H Original project headcount• H. Original project headcount
• R. Additional resources
• PS Planned schedulePS. Planned schedule
• PC. Percentage of time devoted to coaching for each new resource brought late into the project.

How do different companies deal with the scope issue?
Correlation between schedule presure and functionality drops at HP-Agilent
Project start First prototype Systemintegration
Beta Release
•After Rapid And Flexible Product Development: An Analysis Of S ft P j t At H l tt P k d A d A il t bOf Software Projects At Hewlett Packard And Agilent by Sharma Upadhyayula, MIT, 2001
•How Microsoft Builds Software, M. Cosumano and A. Selby, Communications of the ACM, 1997

Schedule allowances
• Allowances to compensate for:
– Errors in estimations
– Number of un-plannedNumber of un planned iterations
– Activity familiarity
– Team capacity
– Unknown unknowns
• How big and where should they be located?

What is a realistic completion date for the project if we are not sure when each individual
tasks will be finished?
B = 40 50 75
A = 7, 15, 45 D = 25, 30, 35
B 40, 50, 75
C = 10 20 80C = 10, 20, 80
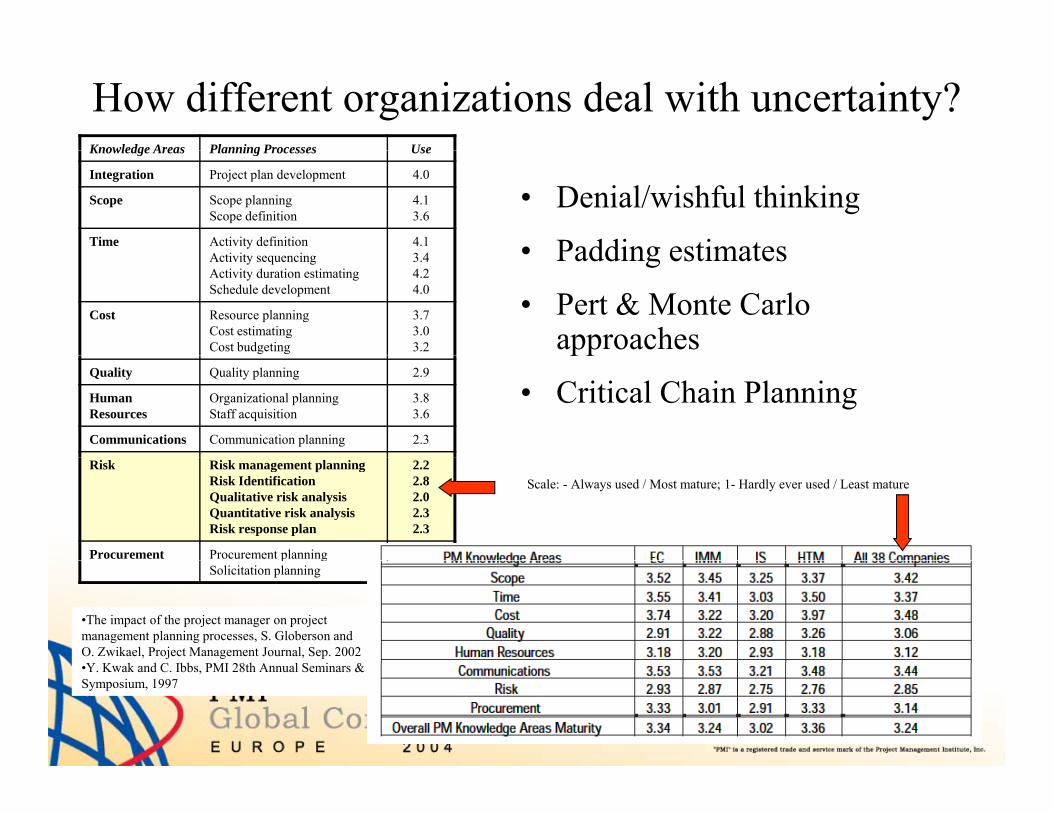
How different organizations deal with uncertainty?Knowledge Areas Planning Processes UseKnowledge Areas Planning Processes Use
Integration Project plan development 4.0
Scope Scope planningScope definition
4.13.6
Time Activity definitionA i i i
4.13 4
• Denial/wishful thinking
• Padding estimatesActivity sequencingActivity duration estimatingSchedule development
3.44.24.0
Cost Resource planningCost estimatingCost budgeting
3.73.03.2
• Padding estimates
• Pert & Monte Carlo approaches
Quality Quality planning 2.9
Human Resources
Organizational planningStaff acquisition
3.83.6
Communications Communication planning 2.3
pp
• Critical Chain Planning
Risk Risk management planningRisk IdentificationQualitative risk analysisQuantitative risk analysisRisk response plan
2.22.82.02.32.3
Procurement Procurement planning 3.3
Scale: - Always used / Most mature; 1- Hardly ever used / Least mature
p gSolicitation planning
•The impact of the project manager on project management planning processes, S. Globerson and O. Zwikael, Project Management Journal, Sep. 2002
k d C bb 28 h A l S i &•Y. Kwak and C. Ibbs, PMI 28th Annual Seminars & Symposium, 1997

Assessing remaining work
Target date
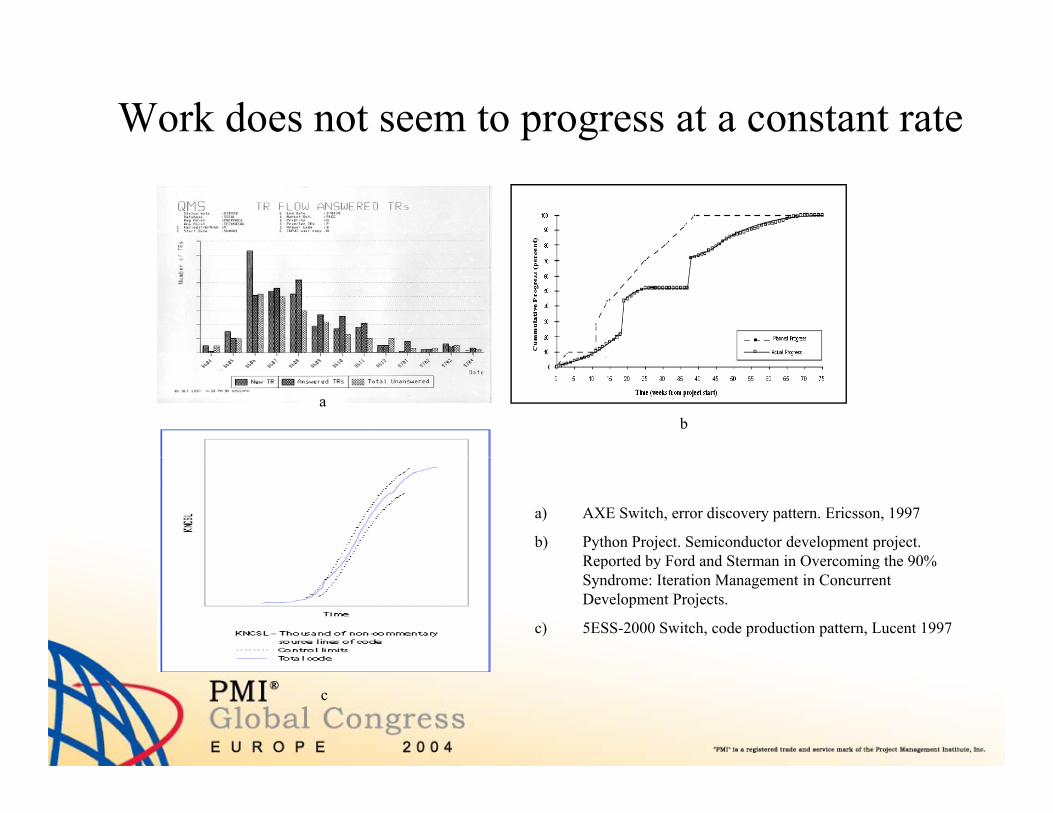
Work does not seem to progress at a constant rate
ab
a) AXE Switch, error discovery pattern. Ericsson, 1997
b) Python Project. Semiconductor development project. Reported by Ford and Sterman in Overcoming the 90%Reported by Ford and Sterman in Overcoming the 90% Syndrome: Iteration Management in Concurrent Development Projects.
c) 5ESS-2000 Switch, code production pattern, Lucent 1997
c
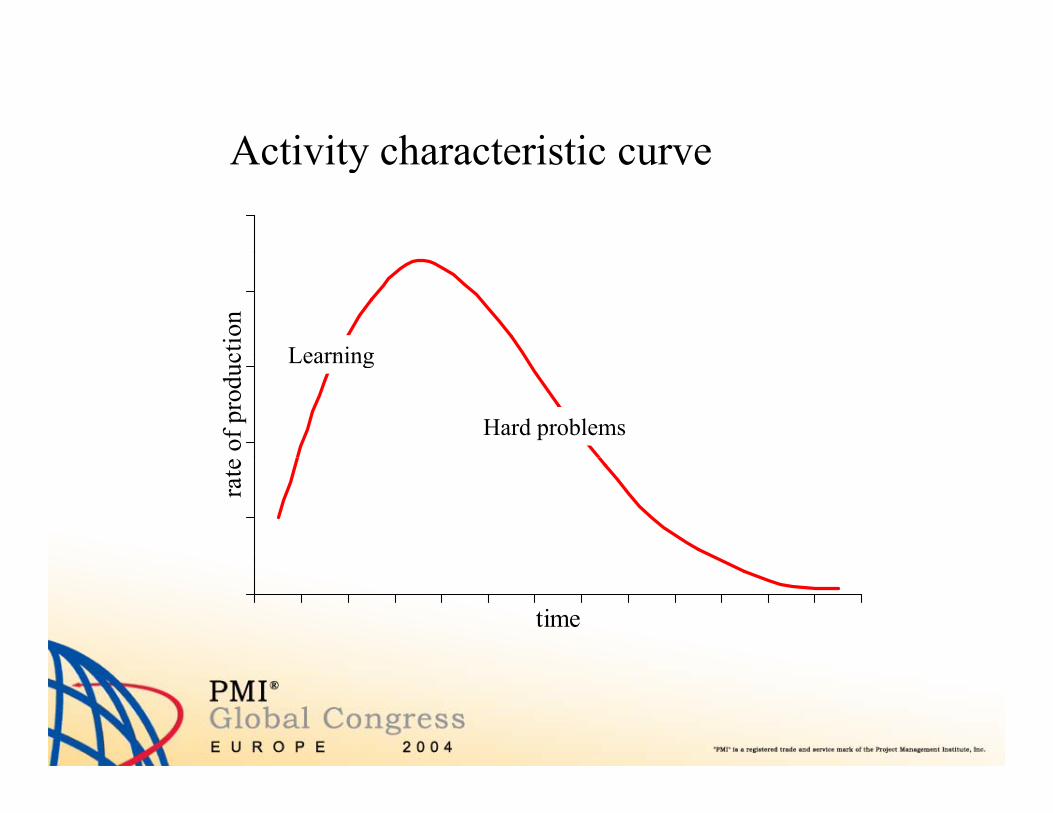
Activity characteristic curveActivity characteristic curve
ctio
n
Learning
of p
rodu
c Learning
Hard problems
rate
time

Forecasting task completiondu
ctio
nul
ativ
e pr
odcu
mu
timeRayleigh Linear
Forecasting error

Fundamentals
• The incremental approach
• Probabilities as a measure of the strength of a belief• Probabilities as a measure of the strength of a belief in an estimate
P bl i h di i l l i• Problems with traditional planning
• Critical Chain– Dealing with uncertainty
– Resource conflicts & multitaskingResource conflicts & multitasking
– Buffer management

The incremental approach
Increment 1
Concept Development
Increment 2
Increment 3
• Each increment includes a functionally complete set of requirements
• Each increment delivers a working system from the user perspectiveg y p p
• How big should an increment be?
– Microsoft’s criteria for defining increments is 1/3, 1/3, 1/3 of the total scope
– Nortel CliP’s criteria for defining increments is feature sets important to the customer

Probabilities as a measure of the strength of a belief in an estimate
0 12
0.14
0 04
0.06
0.08
0.1
0.12
CDF
Pl d0.5
0.6
0.7
0.8
0.9
1
0
0.02
0.04
10 12 14 16 18 20 22 24 26 28 30 32 34 36 38 40
E li t LPlanned Completion
Date
0
0.1
0.2
0.3
0.410 12 14 16 18 20 22 24 26 28 30 32 34 36 38 40
Earliest Completion
Date
Latest Completion
Date
75% On-time Probability
Date
Expected Completion
Date
Planned Completion
Date
10 12 14 16 18 20 22 24 26 28 30 32 34 36 38 40

The standard deviation (σ) of the distribution th l l f t i tmeasures the level of uncertainty
0.12
0.14
0.04
0.06
0.08
0.1
0
0.02
10 12 14 16 18 20 22 24 26 28 30 32 34 36 38 40
E li t Pl d L t t 0 5
0.6
0.7
0.8
0.9
1
Earliest Completion
Date
Planned Completion
Date
Latest Completion
Dates
0
0.1
0.2
0.3
0.4
0.50 2 4 6 8 0 2 4 6 8 0 2 4 6 8 010 12 14 16 18 20 22 24 26 28 30 32 34 36 38 40
Expected Completion
Dates
75% On-time Probability
Dates
Planned Completion
Date

Problems with traditional critical path calculationsProblems with traditional critical path calculations and planning
• Merging paths
• The independence assumption
k l l i i• Task level contingencies

Merging Paths
B = 50 ± 30
A = 15 ± 5 E = 30 ± 10C = 50 ± 30
D = 50 ± 30
Path merging acts like a filter that eliminates positive fl t ti d th l t d lfluctuations, and passes on the longest delay.

The independence assumption• It is generally assumed, that the duration of the tasks in a
project are independent, so if one takes a little bit longer others might take a little bit less and in the end everything will be compensated. This assumption is correct, unless there is an underlying cause linking those tasks.
• If the tasks are correlated all durations tend to shift in the• If the tasks are correlated, all durations tend to shift in the same direction
B = 40, 50, 75
A = 7, 15, 45 D = 25, 30, 35
, ,
C = 10, 20, 80C 10, 20, 80

Effect of a common cause in the amount of riskEffect of a common cause in the amount of risk
35
25
30
35
Dev
iatio
n
ρ = 0.75
fully correlated
15
20
tand
ard
D
ρ = 0.25
ρ = 0.50
0
5
10
Tim
es S
independent
00 5 10 15 20 25 30 35
Number of sequential tasks
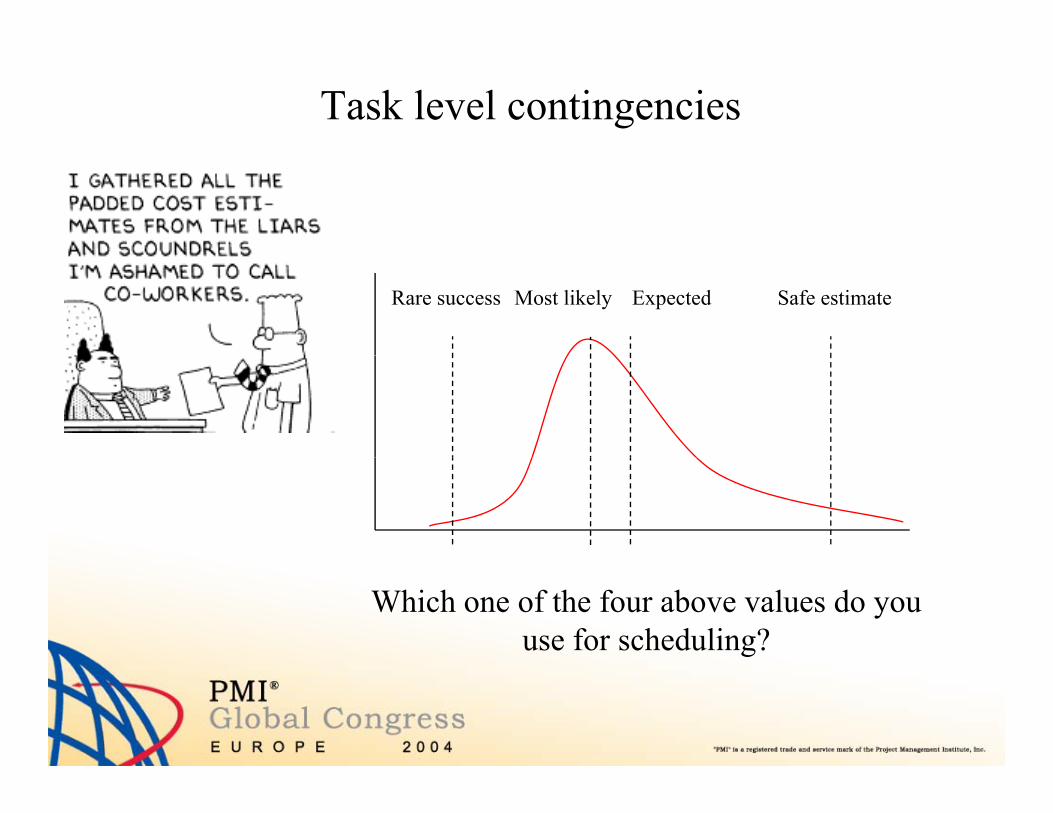
Task level contingencies
Rare success Expected Safe estimateMost likely
Which one of the four above values do you use for scheduling?
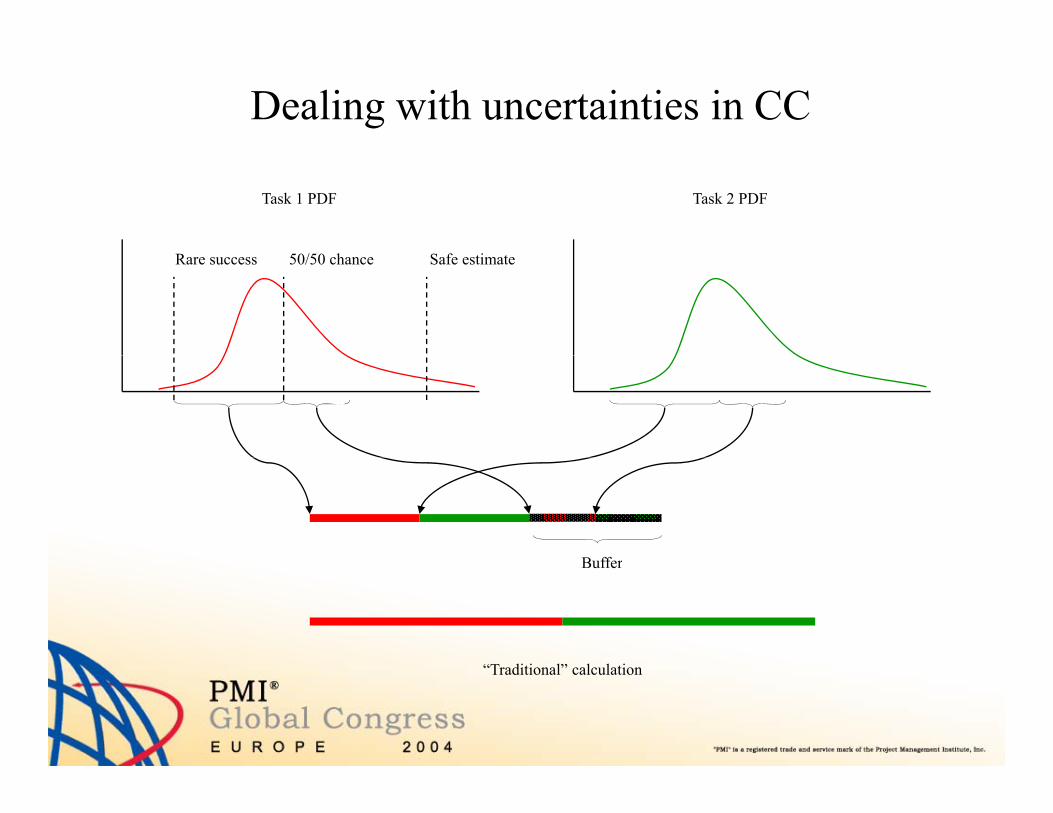
Dealing with uncertainties in CC
Task 1 PDF Task 2 PDF
Rare success 50/50 chance Safe estimate
B fferBuffer
“Traditional” calculation
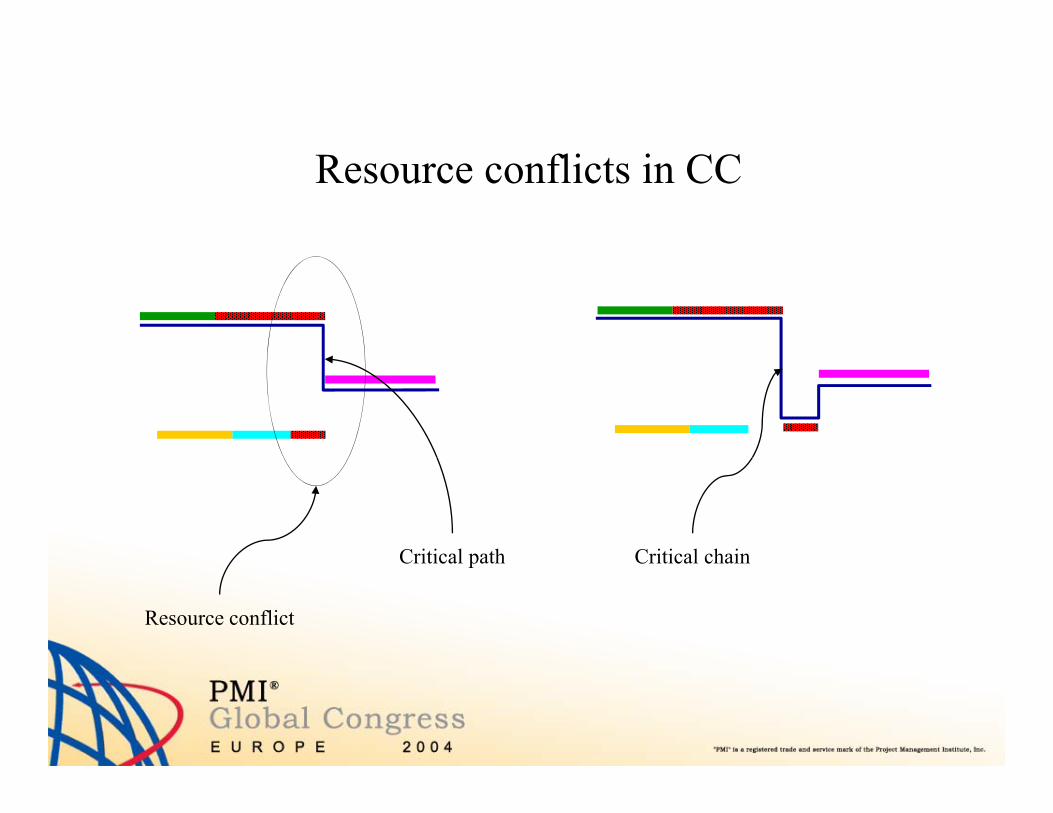
Resource conflicts in CC
Critical chainCritical path
Resource conflict
Critical chainCritical path

Buffer management in CC
Estimates to complete
+ / -
Buffer
Do nothing Plan ActDo nothing Plan Act

Pros and cons of Critical Chain Planning
Critical chain, The longest sequence of dependent tasks or resource usageg
Make safety explicit
Aggregate all safety into project and feeder buffers Aggregate all safety into project and feeder buffers
Control the project by monitoring the buffers
Plan resource readiness alerts along the critical chain Plan resource readiness alerts along the critical chain
Goldratt’s method is based on the idea that everybody introduces a lot of safety on their estimates
Does not account for correlated tasks

Still there is a problem• The Standish Group research shows that in the year 2000, 49% of the
projects were over-budget, over the time estimate, and offer fewer features and functions than originally specified.
* 1994 Data4.6% of the challenged
projects deliver less
27.2% delivered betw een 25 and 49%
p jthan 25% of the
planned fuctionality
39 1% d li d
21.8% delivered betw een 50 and 74%31%
53%
16%
only 7.3% of the challenged projects
delivered all the
39.1% delivered betw een 75 and 99%
of the planned functionality
delivered all the functionality
Successful Impaired Challenged

Combining Critical Chain and Incremental D l tDevelopment
IncrementPlanning
SystemEngineering
SystemArchitecting
D lDevelopIncrement 1
Develop
Buffer 1
Buffer 2pIncrement 2
DevelopIncrement 3
Buffer 2
Increment 3
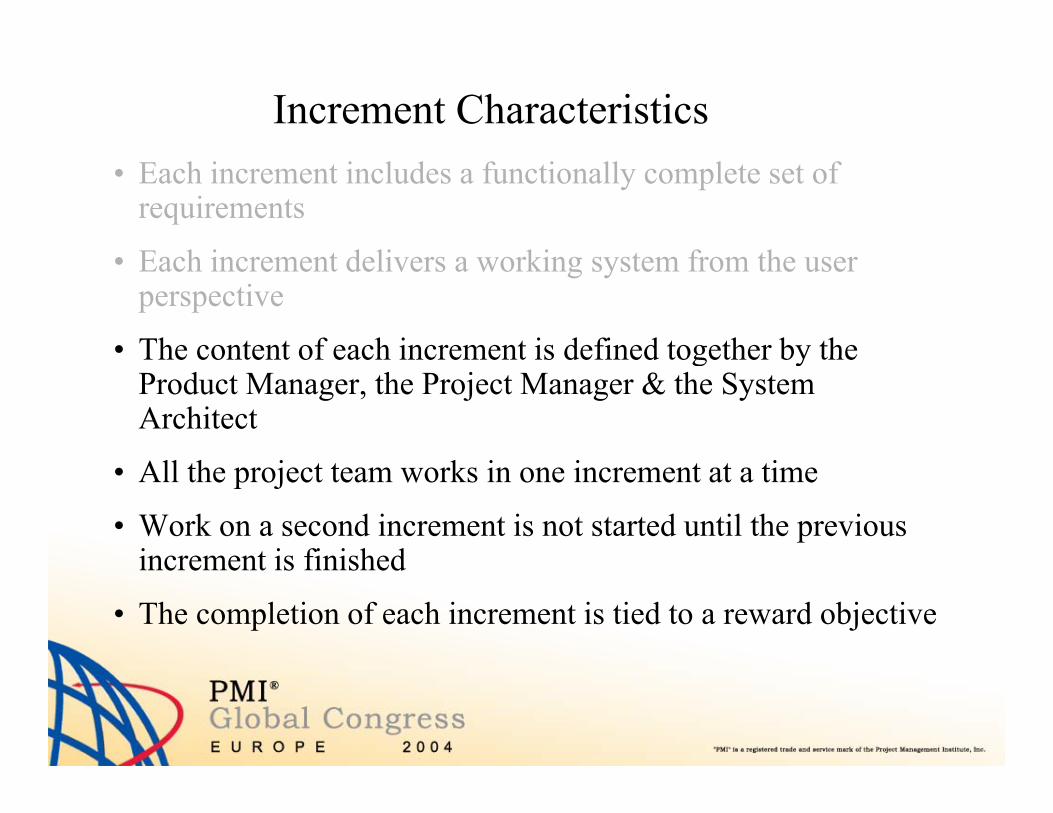
Increment Characteristics• Each increment includes a functionally complete set of
requirements
E h i t d li ki t f th• Each increment delivers a working system from the user perspective
• The content of each increment is defined together by theThe content of each increment is defined together by the Product Manager, the Project Manager & the System Architect
• All the project team works in one increment at a time
• Work on a second increment is not started until the previous increment is finishedincrement is finished
• The completion of each increment is tied to a reward objective

Planning example12 months12 months

Planning processRequirements Time allottedRequirements
Select priority n Plan increment n at high
Time allotted
Project YesSelect priority n
requirementsPlan increment n at high
confidence level fits time allotted?
NoReduce scope increment
n
No
Scheduleincrement’s tasks at
50% confidence
Plan next increment
50% confidence
Buffer n Calculate buffer size

Planning example using MinimumTime

Behind the scenes
2
i ii included
i i j iji included i included j included
ProjectDuration TaskDuration Lag
ProjectVariance TaskVariance TaskVariance TaskVariance
i included i included j included
ProjectContingency k ProjectVarianceSafeProjectDuration Proj
1
ectDuration ProjectContingency
1 1 1
1
(Single tail Chebyshev inequality)
(C d M id ll i li )
kSafetyLevel
or
k
1 (Camp and Meidell ine quality)
2.25 1
i i included
kSafetyLevel
Buffer SafeProjectDuration TaskDur
i ii included
ation Lag
Max ,i included i i ii
Buffer SafeProjectDuration TaskDuration Lag k TaskVariance

Calculating contingency
Desired safety level
K
Normal Camp & Meidell Single tail ChebyshevNormal Distribution1 Inequality2 Unimodal,
symmetric distribution Chebyshev Inequality3
Chebyshev Inequality4
75% 0.68 1.331.73
2.0
80% 0.84 1.49 2.0 2.23
85% 1.03 1.72 2.38 2.58
90% 1.28 2.10 3.0 3.16
ProjectContingency k ProjectVariance
1. Common assumption in the PM literature1. Common assumption in the PM literature2. Practical Software Measurement: Measuring for Process Management and Improvement W. Florac R. Park & A. Carleton, SEI, 19973. The Economic Analysis of Industrial Projects, L. Bussey, Prentice-Hall series in Industrial and System Engineering, 19784. Probability and Statistics in Aerospace Engineering M.Rheinfurth and L. Howell, NASA, 1998

Incremental Development - Features dependency & completeness (Anatomy)p ( y)
• Two aspects to be
F
Two aspects to be considered
TechnicalC
G
– Technical dependencies
F i lABD
H
– Functional completeness from the user point of view
E
I

Anatomy example
3.1.5Payload
3.1.11.1Cancel Location
Green = Not executedBlue = PassedRed = FailedMagenta = External events
3.1.3PDP
3.1.12.1RAU
3.1.12.2RAU
3.1.12.3RAU
3.1.6P l d
3.3.2HLR PDP D f
3.3.3HLR PDP D l
3.4.1Large Restart
3.4.4HLR Restart
3.3.4HLR NAM changePDP
3.1.4PDP
3.1.8.1GPRS paging 3.1.10
RAU
3.1.12.6RAU
Payload
3.1.12.7RAU
3.1.14.1Impl Detach 3.3.1
S b i ti R
HLR PDP Def HLR PDP DelHLR Restart HLR NAM change
PDP
3 2 2
3.1.7.1CS paging
3.1.7.2CS paging
RAU
3.2.1SMS MO
Subscription Rem
3.1.1Attach
SIM for PLMN2
3.2.2SMS MTGs Working
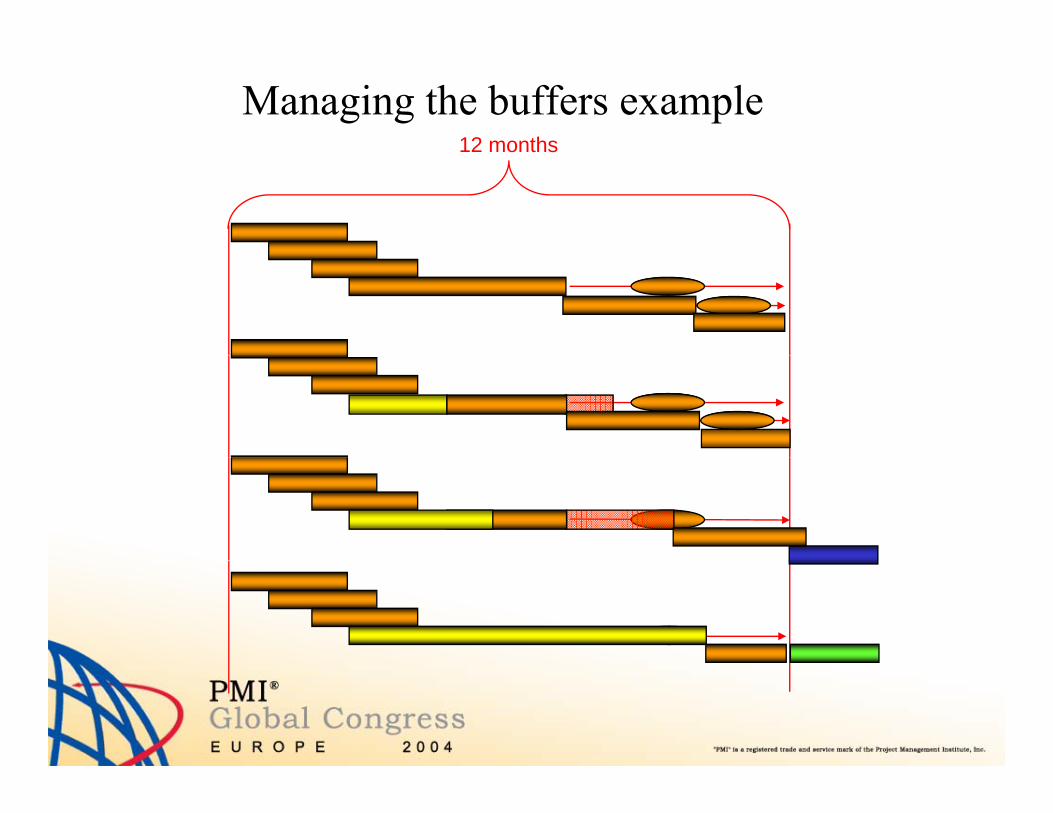
Managing the buffers example12 months12 months

Buffer managementWork performedp
measured output
Continuously forecast
increment’s completion date
Overrun +25%
Re-plan next increment
Activity Characteristic
Curvep 25%
Adjust buffer size
Buffer n
increment
completion date
size
Overrun 0%
Re-plan current
Performance Baseline
+50% current increment

Work does not seem to progress at a constant rate
ab
a) AXE Switch, error discovery pattern. Ericsson, 1997
b) Python Project. Semiconductor development project. Reported by Ford and Sterman in Overcoming the 90%Reported by Ford and Sterman in Overcoming the 90% Syndrome: Iteration Management in Concurrent Development Projects.
c) 5ESS-2000 Switch, code production pattern, Lucent 1997
c
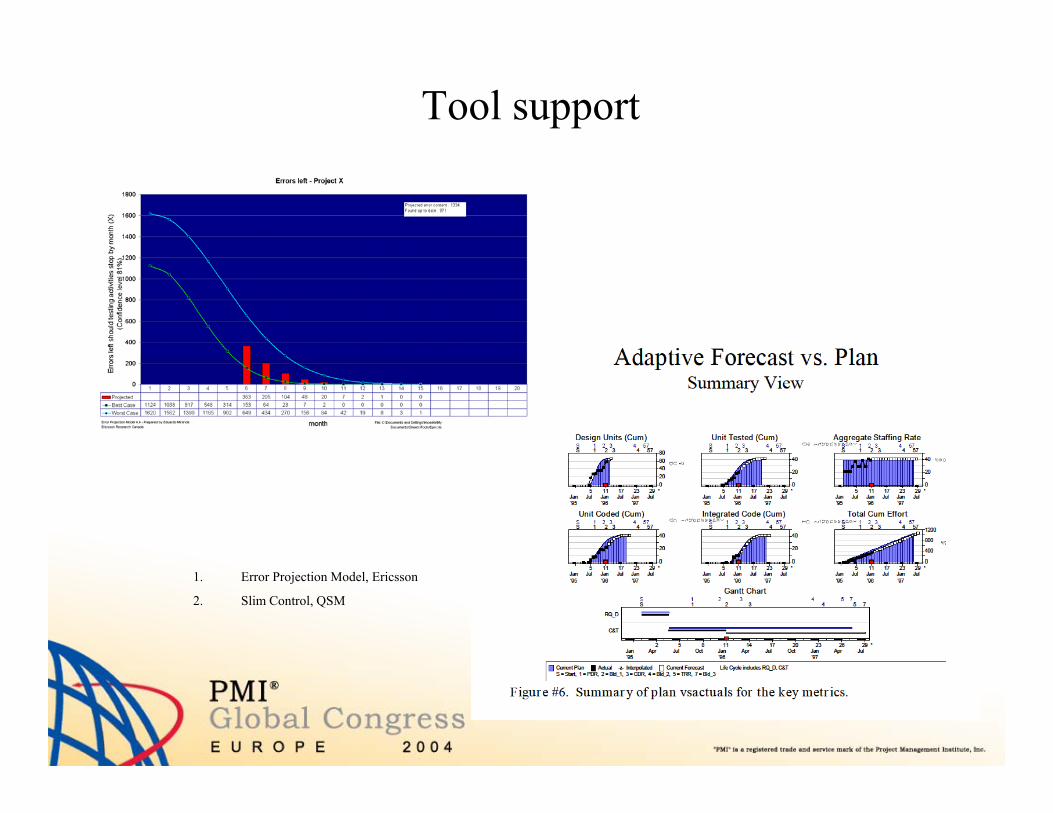
Tool support
1. Error Projection Model, Ericsson
2. Slim Control, QSM

Rewards and Incentives• Employee rewards associated with increment completion, suppress
overtime and provide larger bonuses after successful deployment
• Contracts could include price incentives to be paid on increment deliveryContracts could include price incentives to be paid on increment delivery
• Amount of reward and incentive should be calculated using the probabilities of a successful delivery, i.e. :
– increment 2 probability of success = 40%, bonus = 5,000$, expected value of the reward = 2,000$
– increment 3 probability of success = 10% bonus = 10 000$ expectedincrement 3 probability of success 10%, bonus 10,000$, expected value of the reward = 1,000$
– To act as a motivator bonuses should be re-structured, for example i t 2 3 000$ d i t 3 18 000$ I b th thincrement 2 = 3,000$ and increment 3 = 18,000$. In both cases the total expected pay-out is the same 3,000$ but the motivation power very different.

Summary
• Delivery reliability
• Simplified product project and resource planning• Simplified product, project and resource planning
• Higher productivity
• The above are accomplished by:
– Limiting scope at the outset of the project, thus preventing people from working in things that may never get implemented anywayworking in things that may never get implemented anyway
– Creating buffers that protect the delivery date of the most important features from the uncertainty of project work
– Focusing the work of people in a single set of objectives at a time
– Having small, integrated product teams

References• Miranda E., Planning Time Bounded Projects, IEEE Computer, March 2002,Volume 35, Number 3
• Goldratt E., Critical Chain, The North River Press, 1997
• Newbold R., Project Management in the Fast Lane, St. Lucie Press, 1998
• McConnelS. l, Rapid Development, Taming Wild Software Schedules, Microsoft Press, 1996
• Pisano N., Technical Performance Measurement, Earned Value and Risk Management: An Integrated Diagnostic Tool for Program Management
G S P ti l Ri k A t f P j t M t J h Wil & S 1995• Grey S., Practical Risk Assessment for Project Management, John Wiley & Sons, 1995
• Pillai K. and Nair S., A Model for Software Development Effort and Cost Estimation, IEEE Transactions on Software Engineering, Vol. 23, No.8, 1997
• Putnam G., Measures for Excellence – Reliable Software On Time, Within Budget, Prentice-Hall, 1992
• Martino J., Technological Forecasting for Decision Making, McGraw-Hill, 1993
• Miranda E., The Use of Reliability Growth Models in Project Management, 9th International Symposium in Software Reliability, IEEE, 1998
• Gaffney J., On Predicting Software Related Performance of Large-Scale Systems, CMG XV, San Francisco 1984
• Miranda E., Running the Successful Hi-Tech Project Office, Artech House, 2003

Contact InformationContact InformationEduardo Miranda
Ericsson Research Canadad d i d @ [email protected]

The End