strategic plan 2018 road map to 2020 - fluidra es … · strategic plan 2018 road map to 2020...
TRANSCRIPT
STRATEGIC PLAN 2018 ROAD MAP TO 2020
STRATEGICPLAN 2018 ROAD MAP TO 2020
17 November 2015

STRATEGIC PLAN 2018 ROAD MAP TO 2020
Disclaimer
2
This document is for information only and does not constitute an offer to sell, exchange or buy, or an invitation to make offers tobuy, securities issued by any of the companies mentioned. This financial information has been prepared in accordance withInternational Financial Reporting Standards (IFRS), however, not being audited information is not definitive information and maybe modified in the future.
No representation or warranty is given by Fluidra S.A. as to the accuracy, completeness or fairness or any information containedin this document and nothing in this report should be relied upon as a promise or representation as to the past, current situationor future of the company and its group
The information contained in this document may contain statements regarding intentions, expectations or future prospects. Allstatements, other than those based on historical fact are forward-looking statements, including, without limitation, thoseregarding our financial position, business strategy, management plans and objectives for future operations. Such forward-lookingstatements are affected, as such, by risks and uncertainties that could cause what happens in reality does not correspond withthem.
These risks include, among others, seasonal fluctuations that may change demand, industry competition, economic conditionsand legal restrictions on free trade and / or political instability in the markets where the Group Fluidra is present or in thosecountries where the Group's products are manufactured or distributed. Fluidra Group makes no commitment to issue updates orrevisions concerning the forward-looking statements included in this financial information, expectations or in events, conditionsor circumstances on which underlying these forward-looking statements.
In any case, Fluidra Group provides information on these and other factors that may affect forward-looking statements, businessand financial results of the Company, in documents filed with the Comisión Nacional del Mercado de Valores of Spain. We inviteall interested persons or entities to consult those documents.
STRATEGIC PLAN 2018 ROAD MAP TO 2020
Index
3
1. Framework for the Plan2. Trends & Market and how we compete & win3. Best practices for profitable growth
Case of Fluidra Comercial EspañaCase of Metalast
4. Opportunities for profitable growth by geography5. Financial outlook6. Closing remarks

STRATEGIC PLAN 2018 ROAD MAP TO 2020
Today’s Speakers
4
Eloi PlanesChief Executive
Officer (CEO)
Carlos FranquesaSales & Operations
General Manager
With Fluidra since 2007; started as a COO; 2013 General Manager Europe; 2015 appointed GM for Sales & Operations MBA & Degree in Business Administration by ESADE52 years old
With Fluidra for 23 years; appointed General Manager in 2004; CEO since 2006Industrial Engineer (UPC) and MBA (EADA)46 years old
Xavier TintoréCorporate
General Manager
Joined Fluidra in 2010 as CFO; in 2015 appointed Corporate General ManagerMBA&Degree in Business Administration by ESADE, Master CEMS (HEC), PDG (IESE)48 years old
STRATEGIC PLAN 2018 ROAD MAP TO 2020
Today’s Speakers
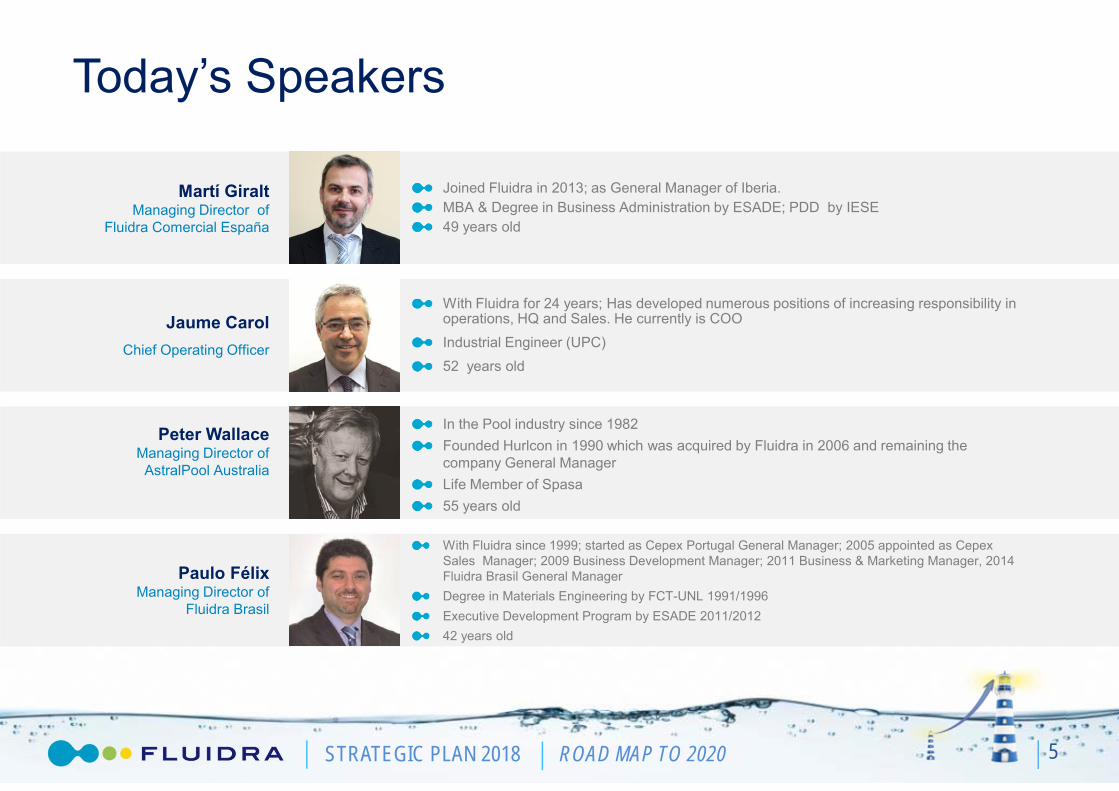
Martí GiraltManaging Director of
Fluidra Comercial España
Joined Fluidra in 2013; as General Manager of Iberia.MBA & Degree in Business Administration by ESADE; PDD by IESE 49 years old
Peter WallaceManaging Director of AstralPool Australia
In the Pool industry since 1982Founded Hurlcon in 1990 which was acquired by Fluidra in 2006 and remaining the company General ManagerLife Member of Spasa55 years old
Paulo FélixManaging Director of
Fluidra Brasil
With Fluidra since 1999; started as Cepex Portugal General Manager; 2005 appointed as CepexSales Manager; 2009 Business Development Manager; 2011 Business & Marketing Manager, 2014 Fluidra Brasil General ManagerDegree in Materials Engineering by FCT-UNL 1991/1996Executive Development Program by ESADE 2011/201242 years old
Jaume Carol Chief Operating Officer
With Fluidra for 24 years; Has developed numerous positions of increasing responsibility in operations, HQ and Sales. He currently is COOIndustrial Engineer (UPC)52 years old
5
STRATEGIC PLAN 2018 ROAD MAP TO 2020STRATEGIC PLAN 2018 ROAD MAP TO 2020
Framework for the Plan
STRATEGIC PLAN 2018 ROAD MAP TO 2020
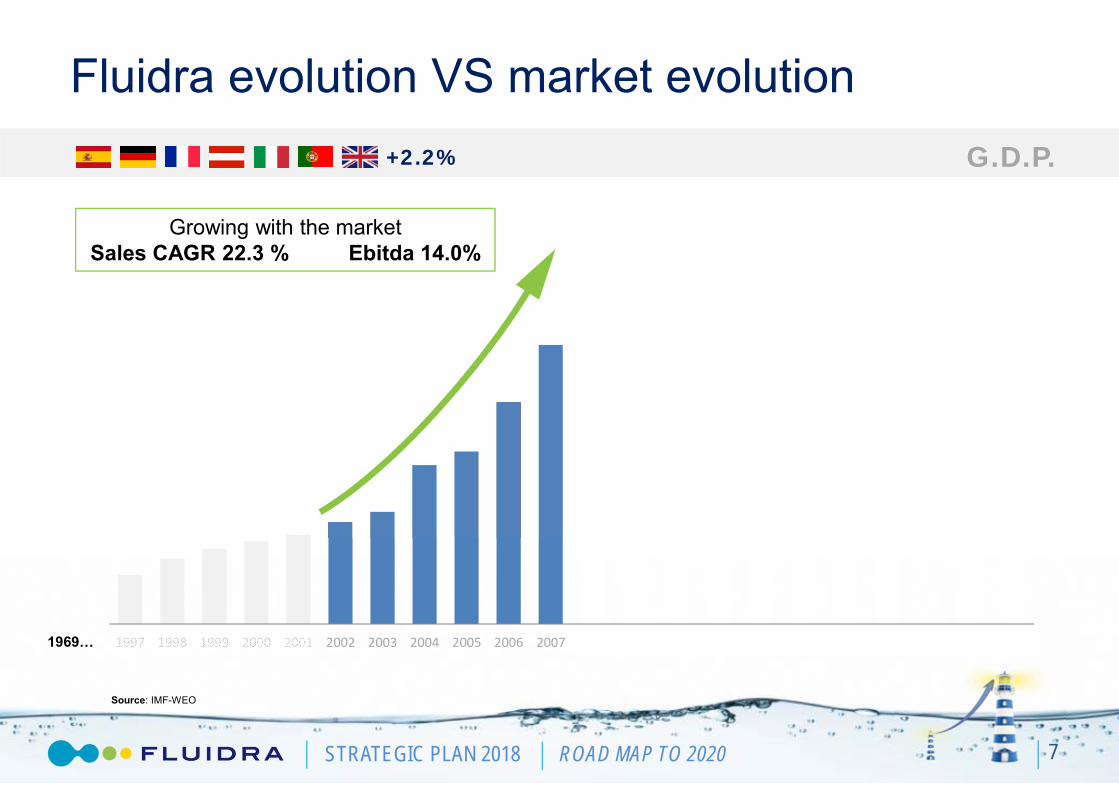
Fluidra evolution VS market evolution
7
1997 1998 1999 2000 2001 2002 2003 2004 2005 2006 2007 2008 2009 2010 2011 2012 2013 2014 2015 … 2018 2020
1m€+2.2%
1969…
Source: IMF-WEO
G.D.P.
Growing with the marketSales CAGR 22.3 % Ebitda 14.0%
STRATEGIC PLAN 2018 ROAD MAP TO 2020
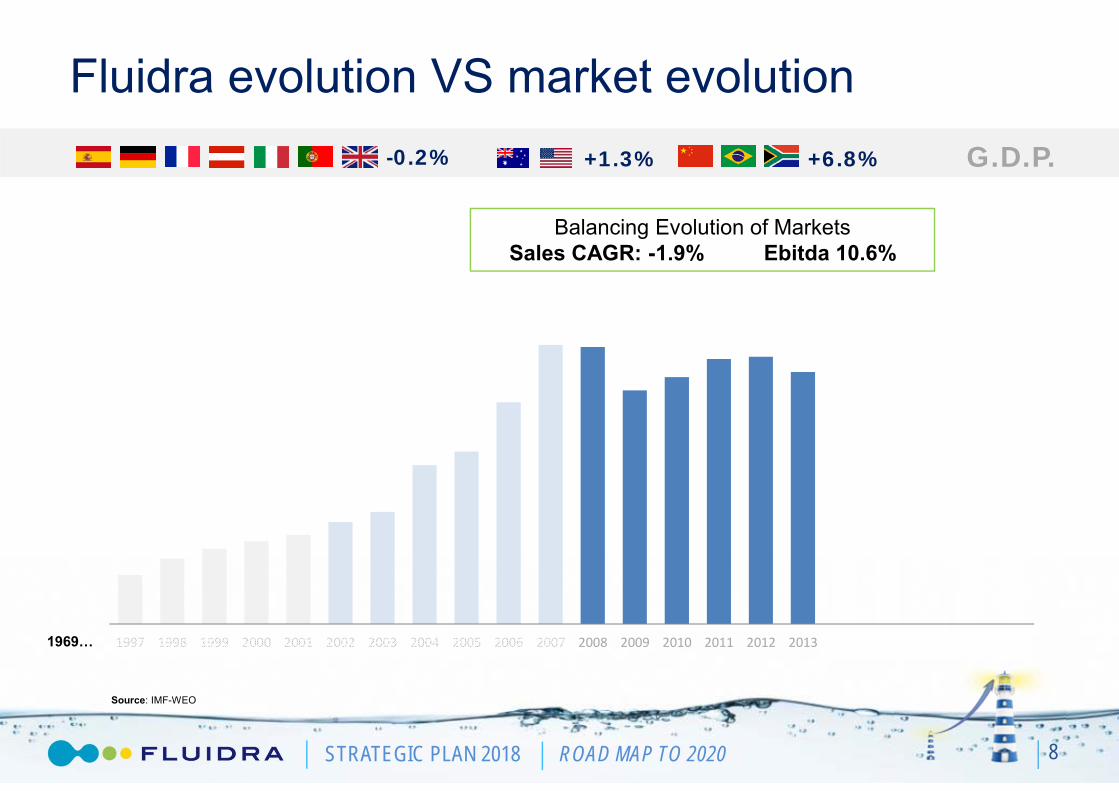
1997 1998 1999 2000 2001 2002 2003 2004 2005 2006 2007 2008 2009 2010 2011 2012 2013 2014 2015 … 2018 2020
Fluidra evolution VS market evolution
8
-0.2% +1.3% +6.8%
Balancing Evolution of MarketsSales CAGR: -1.9% Ebitda 10.6%
Source: IMF-WEO
G.D.P.
1969…
STRATEGIC PLAN 2018 ROAD MAP TO 2020
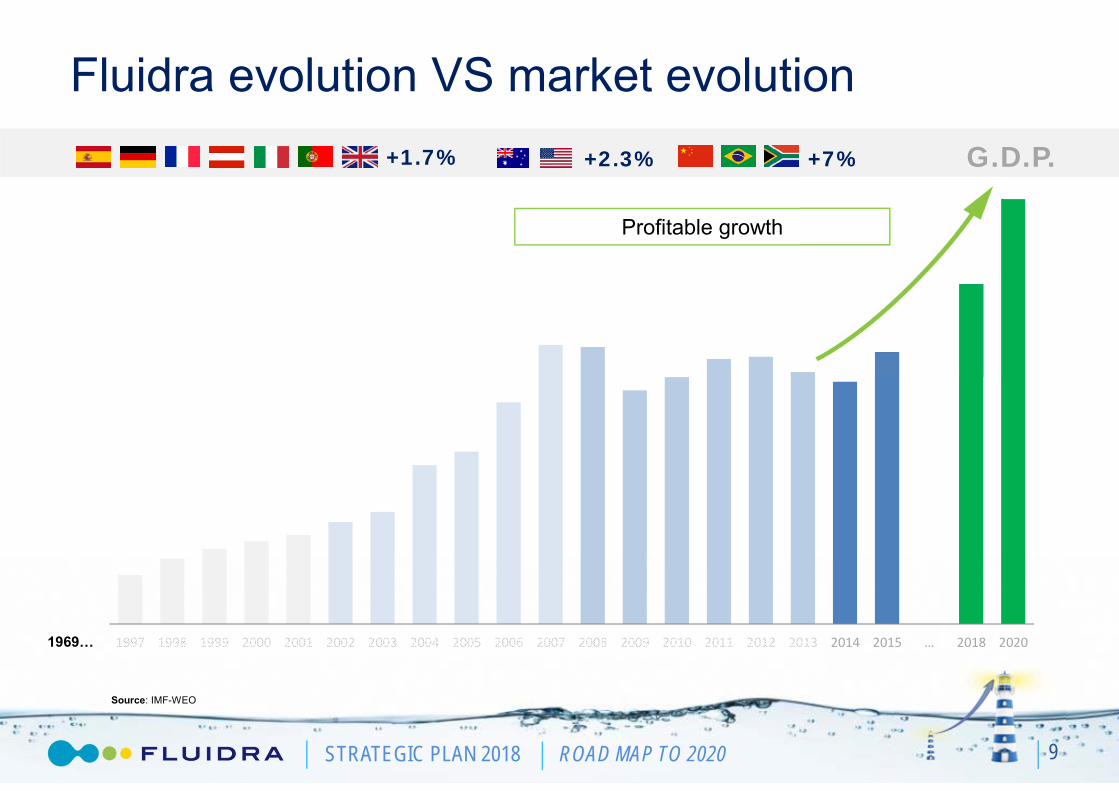
Fluidra evolution VS market evolution
9
1997 1998 1999 2000 2001 2002 2003 2004 2005 2006 2007 2008 2009 2010 2011 2012 2013 2014 2015 … 2018 2020
1m€+1.7% +2.3% +7%
1969…
Profitable growth
Source: IMF-WEO
G.D.P.

STRATEGIC PLAN 2018 ROAD MAP TO 2020
Evolution of the Global Pool Market
10
Growth of pool market across the board expected to boost the industry and increase the size of the potential market
Continued recovery of global pool market after the 2008 financial crisisStrong recovery expected in mature markets (Europe & North America). Sustained growth in emerging markets.
Source: Associations’ reports, trade publications, annual reports, Internal studies & estimatesNote: Only refers to In Ground Pools
Global Evolution of Total Pool Base (In 000) Global Evolution of New Pools (In 000)
2007 2009 2011 2013 2015E 2007 2009 2011 2013 2015E
Europa Australia N. America Asia LatAm Africa&RoW Europa Australia N. America Asia LatAm Africa&RoW
18,000
15,000
12,000
9,000
6,000
3,000
600
500
400
300
200
100

STRATEGIC PLAN 2018 ROAD MAP TO 2020 11
Europe-Evolution of New Pools (in 000) North America-Evolution of New Pools (in 000)
2007 2009 2011 2013 2015E2007 2009 2011 2013 2015E
New pool builds is at its lowest point and should recover in the next years reflecting a healthier industry
Source: Associations’ reports, trade publications, annual reports, Internal studies & estimatesNote: Only refers to In Ground Pools
Evolution new pools in key markets
Europa Spain
180
160
140
120
100
80
200
180
160
140
120
100
60
40
20
80
60
40
20
STRATEGIC PLAN 2018 ROAD MAP TO 2020
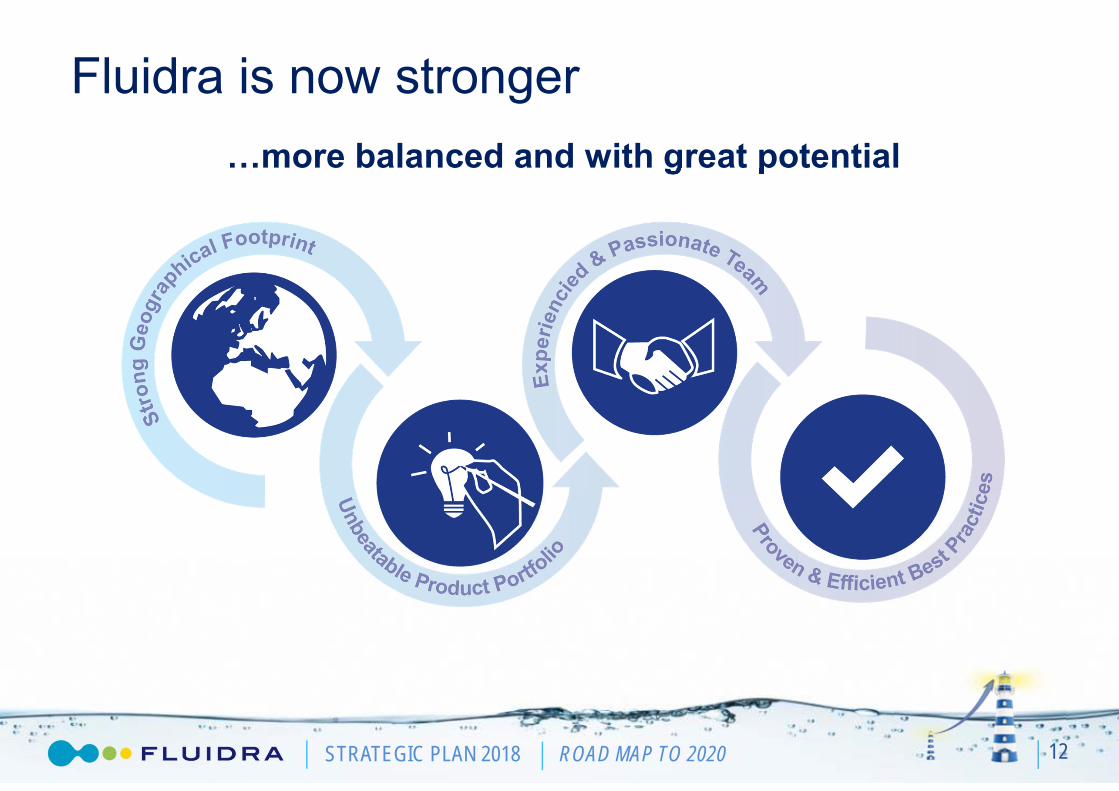
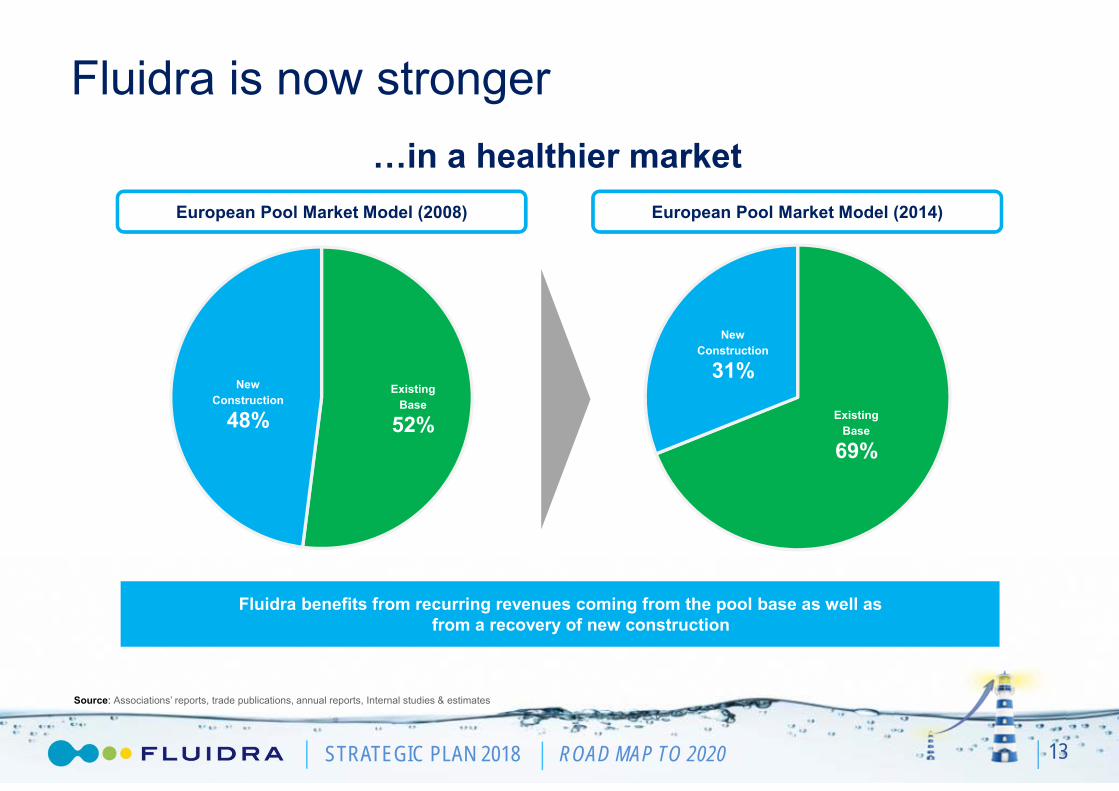
Fluidra is now stronger
12
…more balanced and with great potential
STRATEGIC PLAN 2018 ROAD MAP TO 2020
Existing Base
52%
New Construction
48% Existing Base
69%
New Construction
31%
Fluidra is now stronger
13
…in a healthier market
Fluidra benefits from recurring revenues coming from the pool base as well as from a recovery of new construction
European Pool Market Model (2008) European Pool Market Model (2014)
Source: Associations’ reports, trade publications, annual reports, Internal studies & estimates
STRATEGIC PLAN 2018 ROAD MAP TO 2020
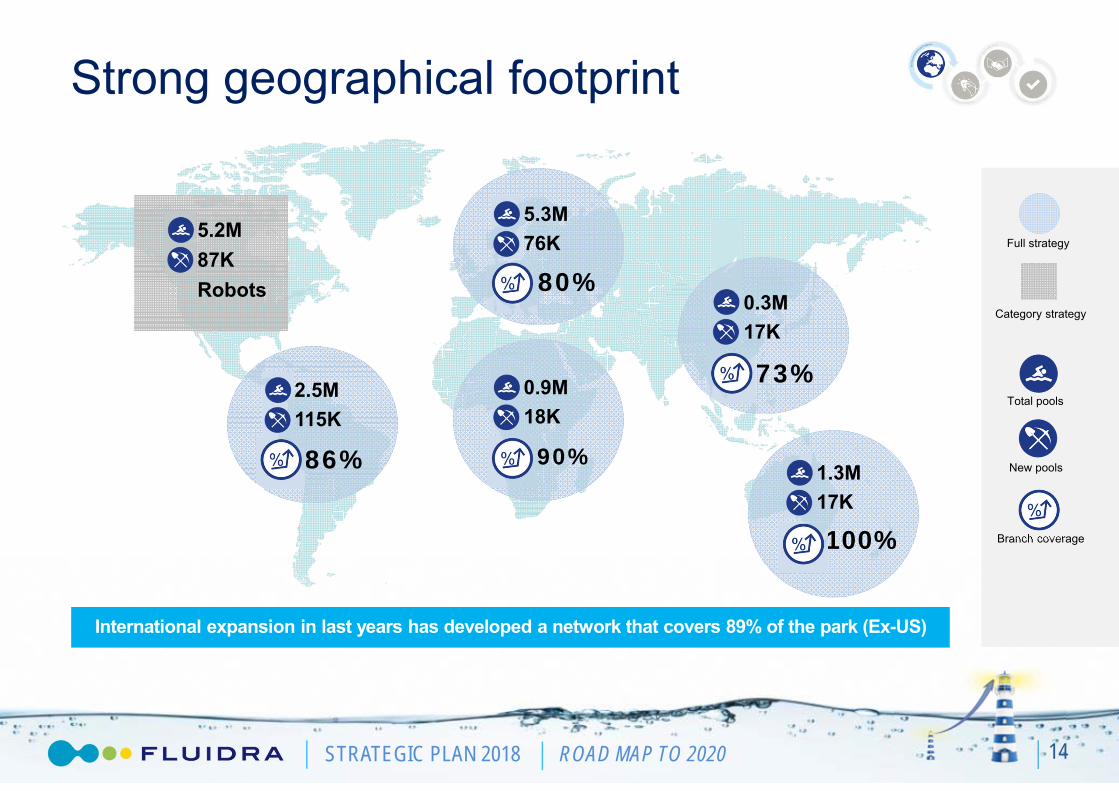
Strong geographical footprint
14
Branch coverage
5.2M87KRobots
2.5M115K
86%
5.3M76K
80%
0.9M18K
90%
0.3M17K
73%
1.3M17K
100%
Total pools
New pools
Category strategy
Full strategy
International expansion in last years has developed a network that covers 89% of the park (Ex-US)

STRATEGIC PLAN 2018 ROAD MAP TO 2020
Consistent investment in R&D and integration of new technologies has built an unbeatable offering
Unbeatable product portfolio
15
Basic
Maintenance
Added value
2006
2015
2006
2015
2006
2015
INNOVATION CATEGORIESMARKET POSITION
45
>70
50
>100
15
>80
2
1
4
2
3
1/2
STRATEGIC PLAN 2018 ROAD MAP TO 2020
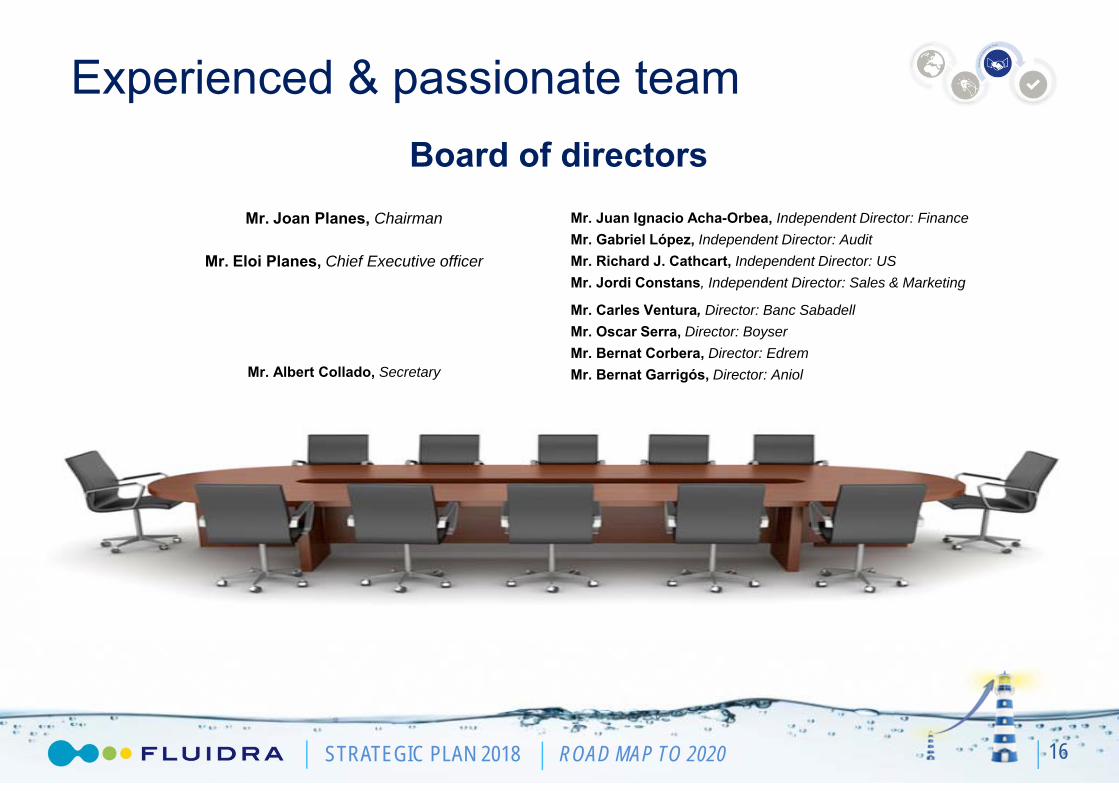
Experienced & passionate teamBoard of directors
Mr. Juan Ignacio Acha-Orbea, Independent Director: FinanceMr. Gabriel López, Independent Director: AuditMr. Richard J. Cathcart, Independent Director: USMr. Jordi Constans, Independent Director: Sales & Marketing
Mr. Carles Ventura, Director: Banc SabadellMr. Oscar Serra, Director: BoyserMr. Bernat Corbera, Director: EdremMr. Bernat Garrigós, Director: Aniol
Mr. Joan Planes, Chairman
Mr. Eloi Planes, Chief Executive officer
Mr. Albert Collado, Secretary
16
STRATEGIC PLAN 2018 ROAD MAP TO 2020
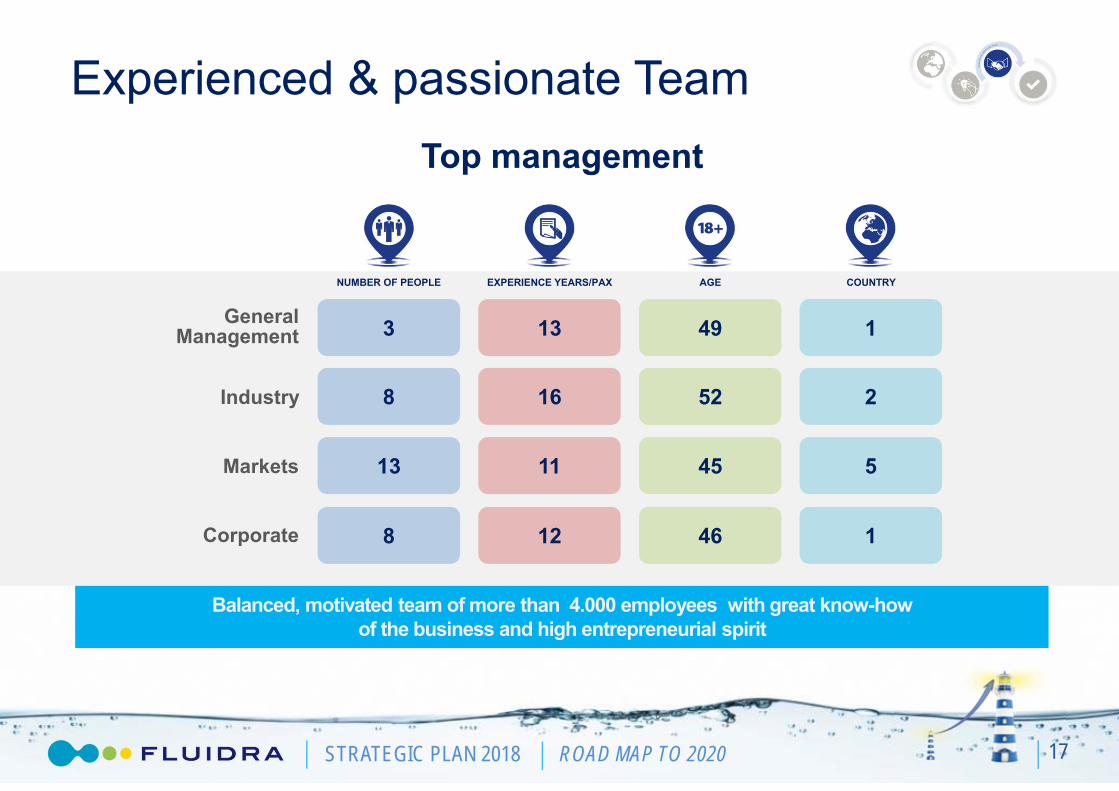
Balanced, motivated team of more than 4.000 employees with great know-how of the business and high entrepreneurial spirit
Experienced & passionate Team
17
Industry 8 16 52 2
3 13 49 1General Management
13 11 45 5Markets
8 12 46 1Corporate
Top management
NUMBER OF PEOPLE EXPERIENCE YEARS/PAX AGE COUNTRY
STRATEGIC PLAN 2018 ROAD MAP TO 2020
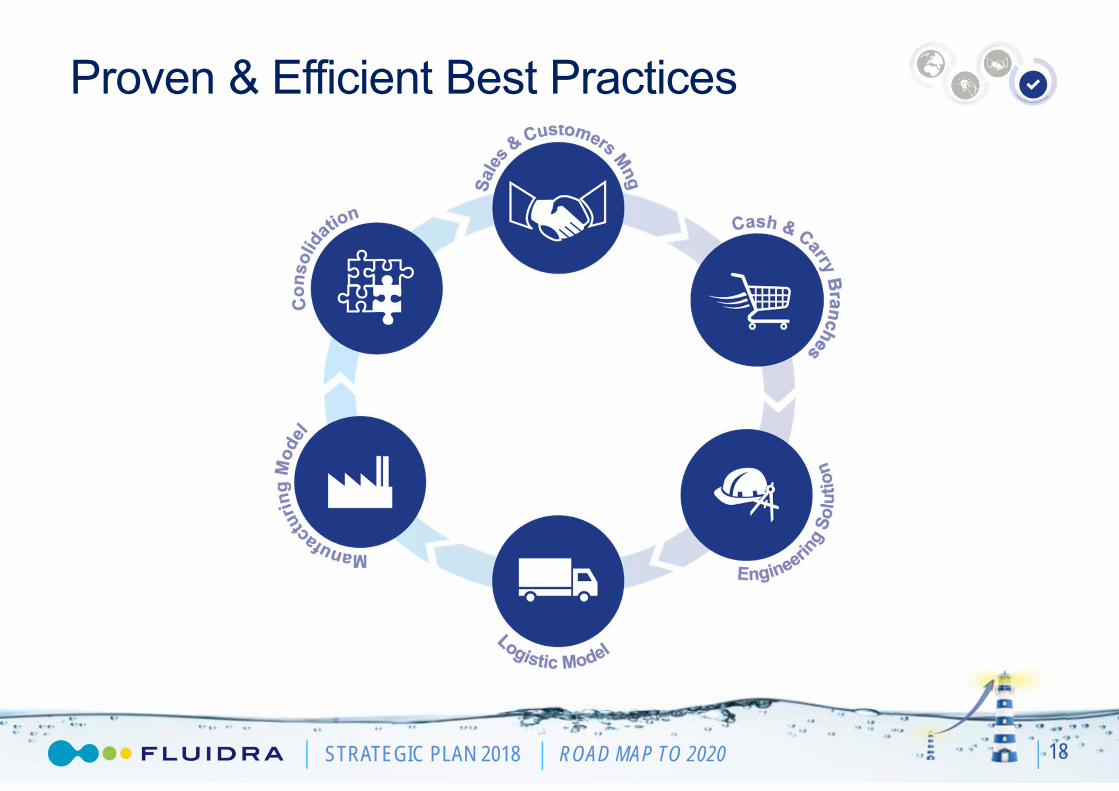
Proven & Efficient Best Practices
18

STRATEGIC PLAN 2018 ROAD MAP TO 2020
….but heterogeneous in product categories
19
Achieving homogeneous penetration in all categories will drive incremental sales
EUROPE AUSTRALIA ASIA AFRICA LATAMCategory 1
Category 2
Category 3
Category 4
Category 5
Category 6
Category 7

STRATEGIC PLAN 2018 ROAD MAP TO 2020
Achieving homogeneous best practices will drive incremental sales & profitability
….but heterogeneous in best practices
20
EUROPE AUSTRALIA ASIA AFRICA LATAM USA
Sales & Customer Mng
Logistic Model
Consolidation
Cash & Carry Branches
Manufacturing Model
Engineering Solution
STRATEGIC PLAN 2018 ROAD MAP TO 2020
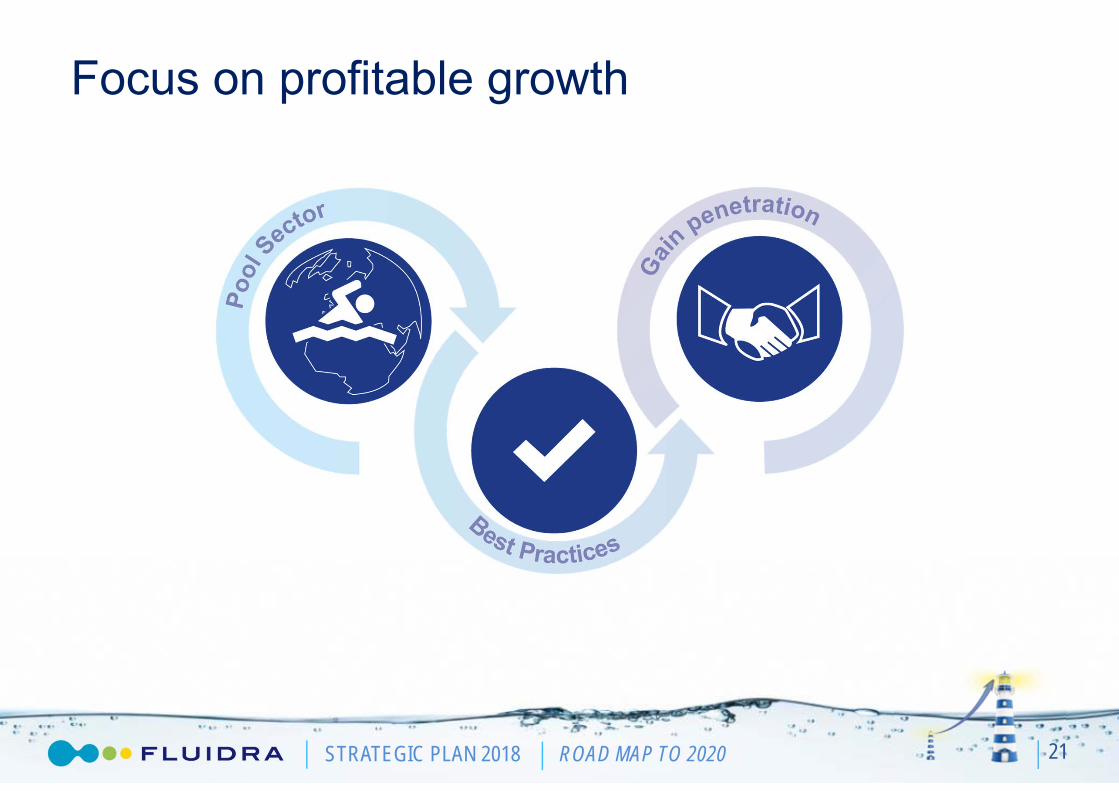
Focus on profitable growth
21
STRATEGIC PLAN 2018 ROAD MAP TO 2020
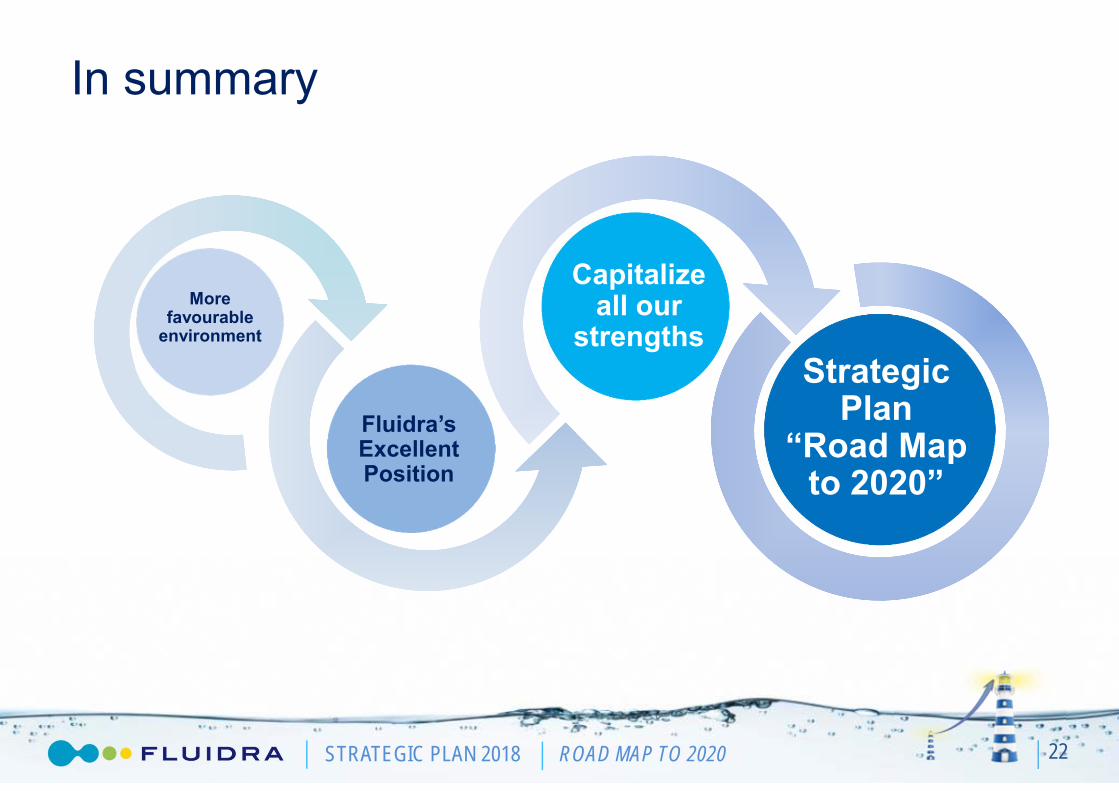
In summary
22
Strategic Plan
“Road Map to 2020”
Strategic Plan
“Road Map to 2020”
Capitalize all our
strengths
Capitalize all our
strengths
Fluidra’sExcellentPosition
More favourable
environment

STRATEGIC PLAN 2018 ROAD MAP TO 2020 23
STRATEGIC PLAN 2018 ROAD MAP TO 2020STRATEGIC PLAN 2018 ROAD MAP TO 2020
Trends & MarketHow we compete & win

STRATEGIC PLAN 2018 ROAD MAP TO 2020
Better prospects in key markets
25
GDP per Capita (US$)- Developed GDP per Capita (US$)- Emerging
Housing recovery will drive pool construction.
Better outlook will increase refurbishment/remodeling market.
Source: International Monetary Fund-WEONote: Refers to GDP per Capita at current prices in US dollars
0
2.000
4.000
6.000
8.000
10.000
12.000
14.000
2000 2005 2010 2015 2020
Brazil China India Mexico South Africa Turkey
0
10.000
20.000
30.000
40.000
50.000
60.000
70.000
80.000
2000 2005 2010 2015 2020
Euro Area USA Australia
Developed countries have overcome the ‘09 crisis
Wealth increase will push pool construction.
Tourism will drive increase in commercial segment of pool industry.

STRATEGIC PLAN 2018 ROAD MAP TO 2020
Key trends help industry fundamentals
26
Growth in Number of Megacities (population>10m) Increased Life Expectancy
Development of commercial pool & wellness facilities
Source: Data360, Global Cities Institute, United Nations, World Bank
40
50
60
70
80
90
1960 1980 2000 2020 2040 2060
USA Europe Asia
0
20
40
60
80
100
1990 2014 2030 2050 2075 2100
Number of megacities has almost tripled between 1990‐2014
x8
Development of health and well-being products
Larger older population will live in big cities
STRATEGIC PLAN 2018 ROAD MAP TO 2020
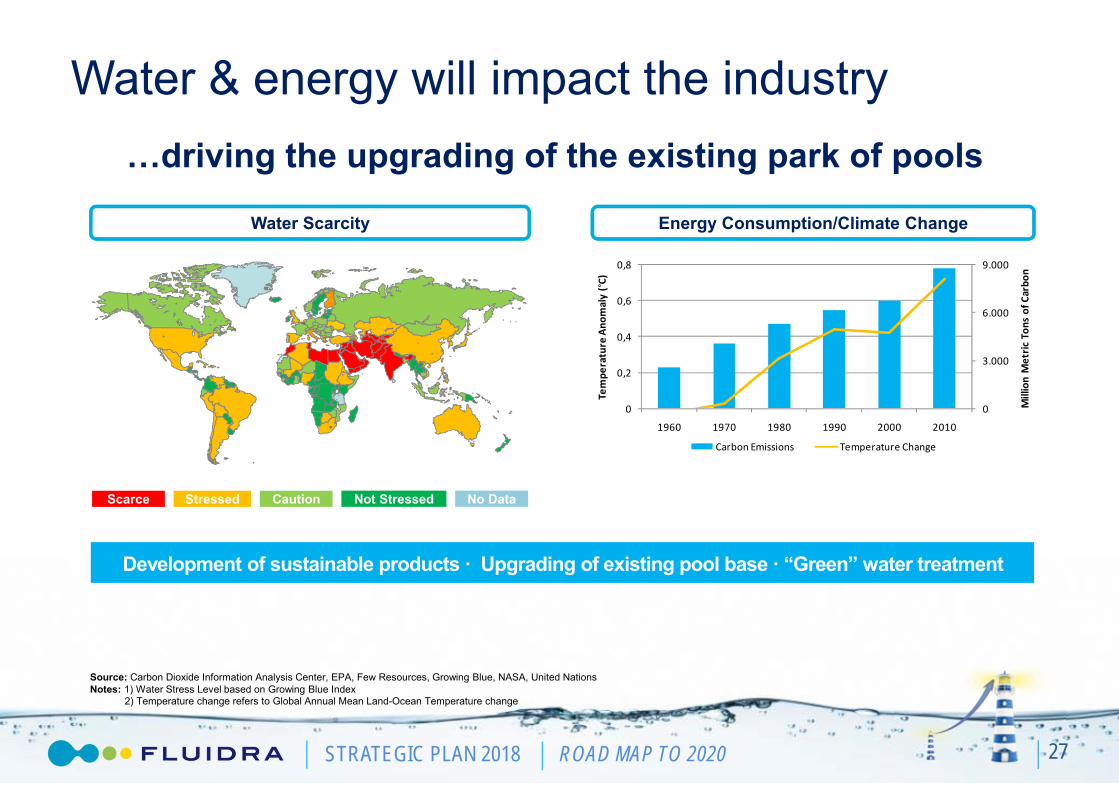
Water & energy will impact the industry
27
Water Scarcity Energy Consumption/Climate Change
Source: Carbon Dioxide Information Analysis Center, EPA, Few Resources, Growing Blue, NASA, United NationsNotes: 1) Water Stress Level based on Growing Blue Index
2) Temperature change refers to Global Annual Mean Land-Ocean Temperature change
Development of sustainable products · Upgrading of existing pool base · “Green” water treatment
Scarce Stressed Caution Not Stressed No Data
0
3.000
6.000
9.000
0
0,2
0,4
0,6
0,8
1960 1970 1980 1990 2000 2010
Million Metric
Ton
s of Carbo
n
Tempe
rature Ano
maly (°C
)
Carbon Emissions Temperature Change
…driving the upgrading of the existing park of pools
STRATEGIC PLAN 2018 ROAD MAP TO 2020
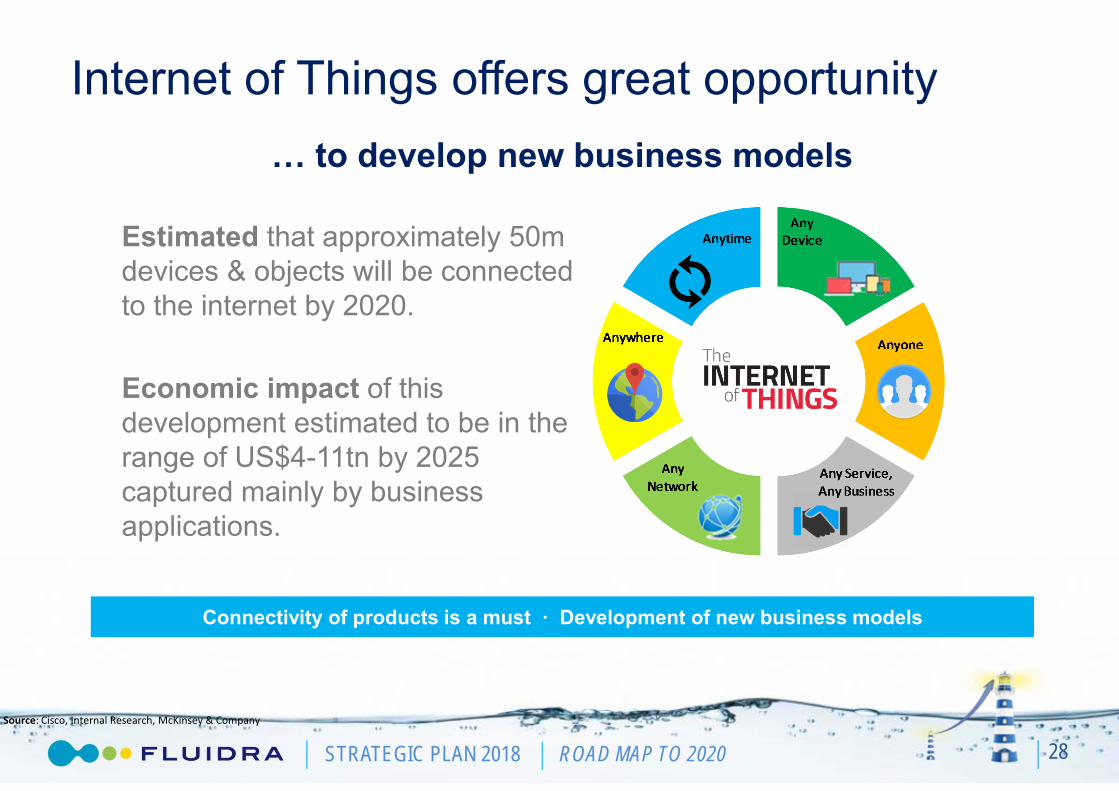
Internet of Things offers great opportunity
28
Estimated that approximately 50m devices & objects will be connected to the internet by 2020.
Economic impact of this development estimated to be in the range of US$4-11tn by 2025 captured mainly by business applications.
Source: Cisco, Internal Research, McKinsey & Company
… to develop new business models
Connectivity of products is a must · Development of new business models

STRATEGIC PLAN 2018 ROAD MAP TO 2020
Our business revolves around the pool
Building on our strengths
Focus on Pool
Pool WaterTreatment13%
Pool68%
Pool FluidHandling
8%Irrigation& D.W.T
7%Industrial & Others
4%
Pool & Wellness
89%
29
Note: Sales by business unit as % of total sales.
STRATEGIC PLAN 2018 ROAD MAP TO 2020
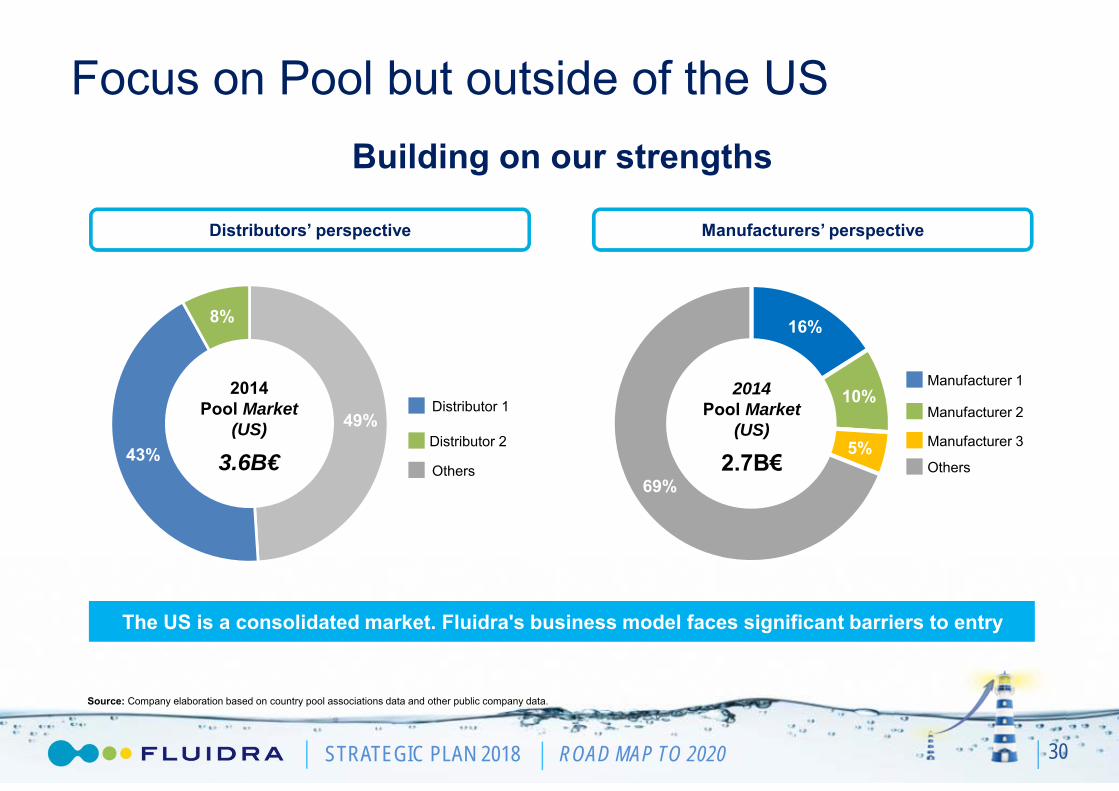
16%
10%
5%
69%
49%
43%
8%
Building on our strengths
Focus on Pool but outside of the US
The US is a consolidated market. Fluidra's business model faces significant barriers to entry
30
2014 Pool Market
(US)
2.7B€
2014Pool Market
(US)
3.6B€
Distributors’ perspective Manufacturers’ perspective
Manufacturer 2
Manufacturer 1
Manufacturer 3
Others
Distributor 1
Distributor 2
Others
Source: Company elaboration based on country pool associations data and other public company data.

STRATEGIC PLAN 2018 ROAD MAP TO 2020
56%
5%
14%
17%
8%
The opportunity is significant…
31
16%
84%
2014 Pool Market
(ex US)
3.2B€
In terms of product and geographies
Europe
Africa
Australia
LatAm
Asia & ME
41%
19%
22%
18% Basic-Filter, Pump…
Maintenance
Added Value - Robots, Chlorinators
Commercial equipment
Source: Company elaboration based on country pool associations data and other public company data.
Fluidra
Others

STRATEGIC PLAN 2018 ROAD MAP TO 2020
Source: Company elaboration based on country pool associations data and other public company data.
Clear #1 in most relevant markets…
Market Leader
Export Leader
Key Player
Export Player
32
No. of Countries
31
12
13
4
% of Global
Pool Base
40%
1%
21%
5%
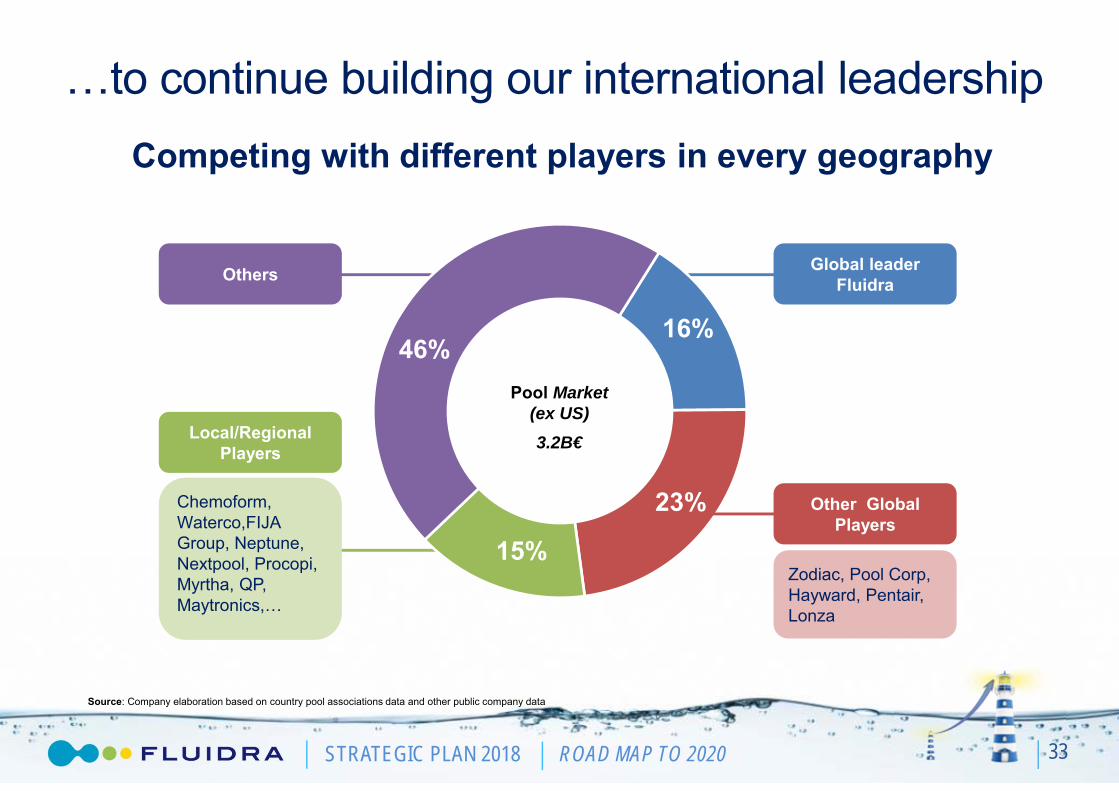
…to continue building our international leadership
STRATEGIC PLAN 2018 ROAD MAP TO 2020
Pool Market(ex US)3.2B€
16%
15%
23%
46%
Source: Company elaboration based on country pool associations data and other public company data
Competing with different players in every geography
33
Global leader Fluidra
Other Global Players
Zodiac, Pool Corp, Hayward, Pentair, Lonza
Local/RegionalPlayers
Chemoform, Waterco,FIJAGroup, Neptune, Nextpool, Procopi, Myrtha, QP, Maytronics,…
Others
…to continue building our international leadership
STRATEGIC PLAN 2018 ROAD MAP TO 2020
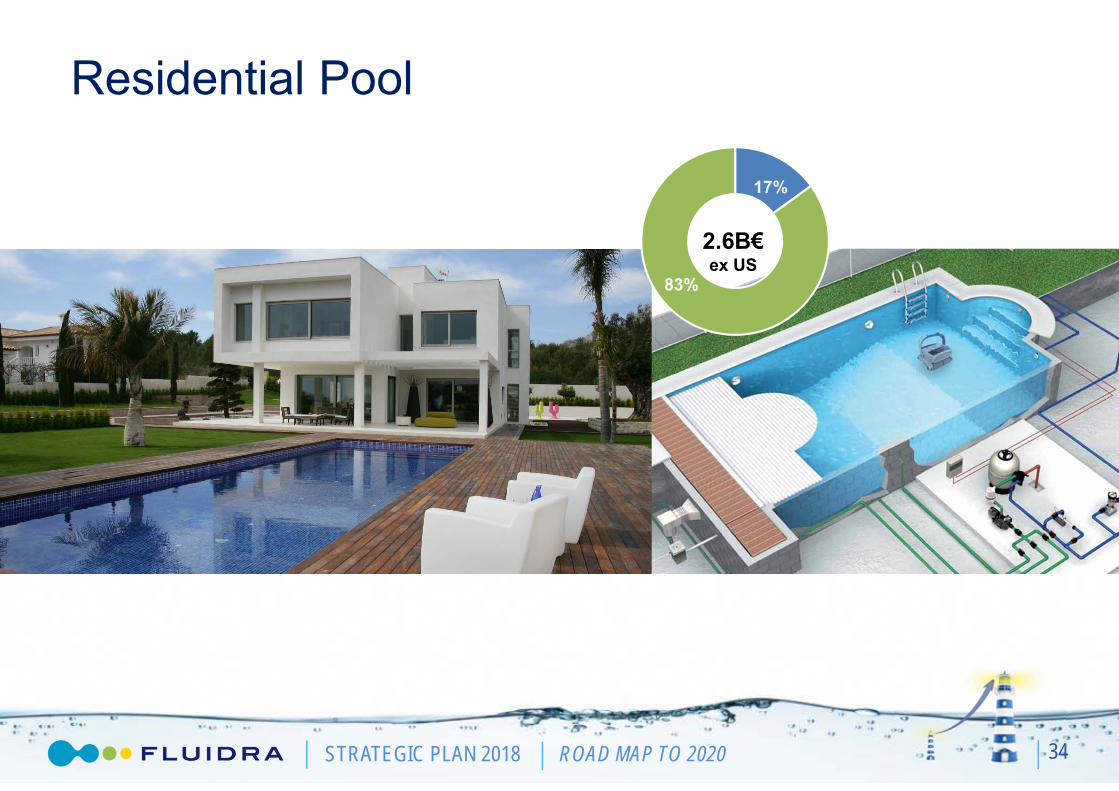
Residential Pool
17%
83%
2.6B€ex US
34
STRATEGIC PLAN 2018 ROAD MAP TO 2020
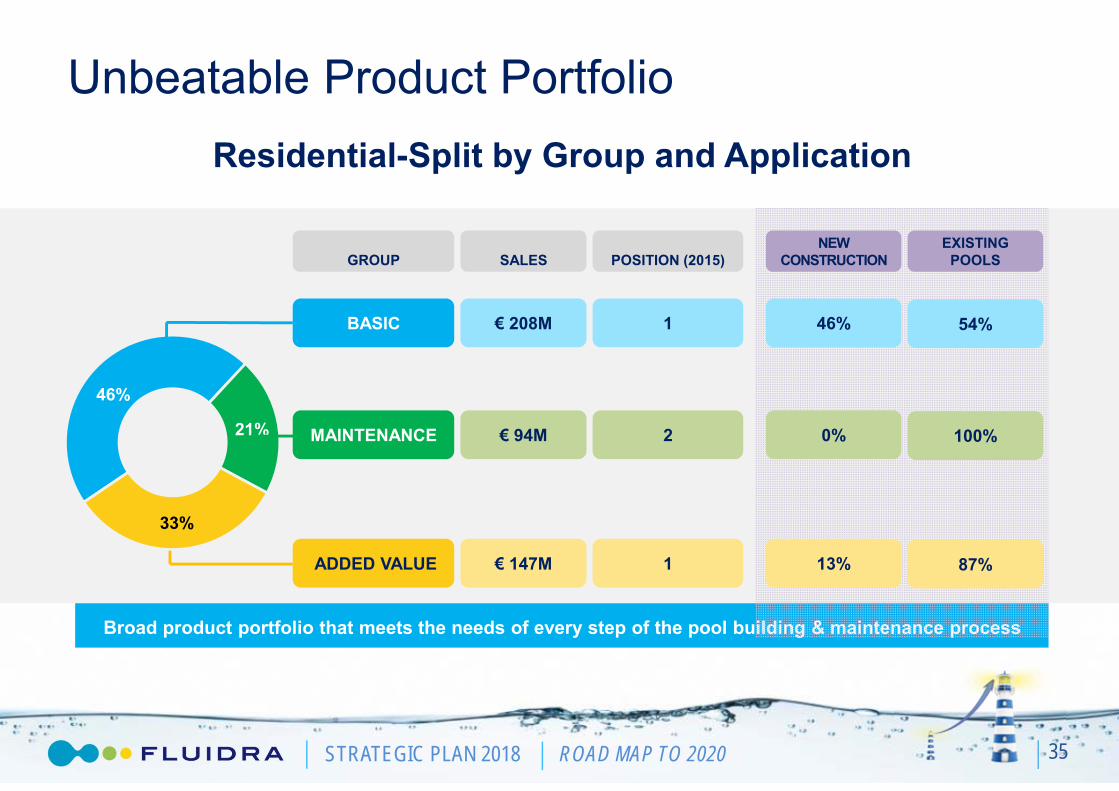
Broad product portfolio that meets the needs of every step of the pool building & maintenance process
46%
21%
33%
Unbeatable Product PortfolioResidential-Split by Group and Application
GROUP
BASIC
ADDED VALUE
MAINTENANCE
SALES
€ 208M
€ 94M
€ 147M
POSITION (2015)
1
2
1
NEW CONSTRUCTION
46%
0%
13%
EXISTING POOLS
54%
100%
87%
35

STRATEGIC PLAN 2018 ROAD MAP TO 2020
VIRON VARIABLE SPEED PUMP• The Viron pump was developed in Australia to deliver numerous advantages vs.
a traditional pump:• Energy savings of up to 85% (€ 900/year). • Up to 75% quieter.
• Strong performance both in new pools, and in upgrading of existing pools. • Sold over 25,000 units in Australia, and recently launched in Europe with great success.
Unbeatable Residential offeringBasic Category Products SALES
€208M
POSITION(2015)
1
NEW CONSTR.
46%
EXISTING POOLS
54%
36
STRATEGIC PLAN 2018 ROAD MAP TO 2020
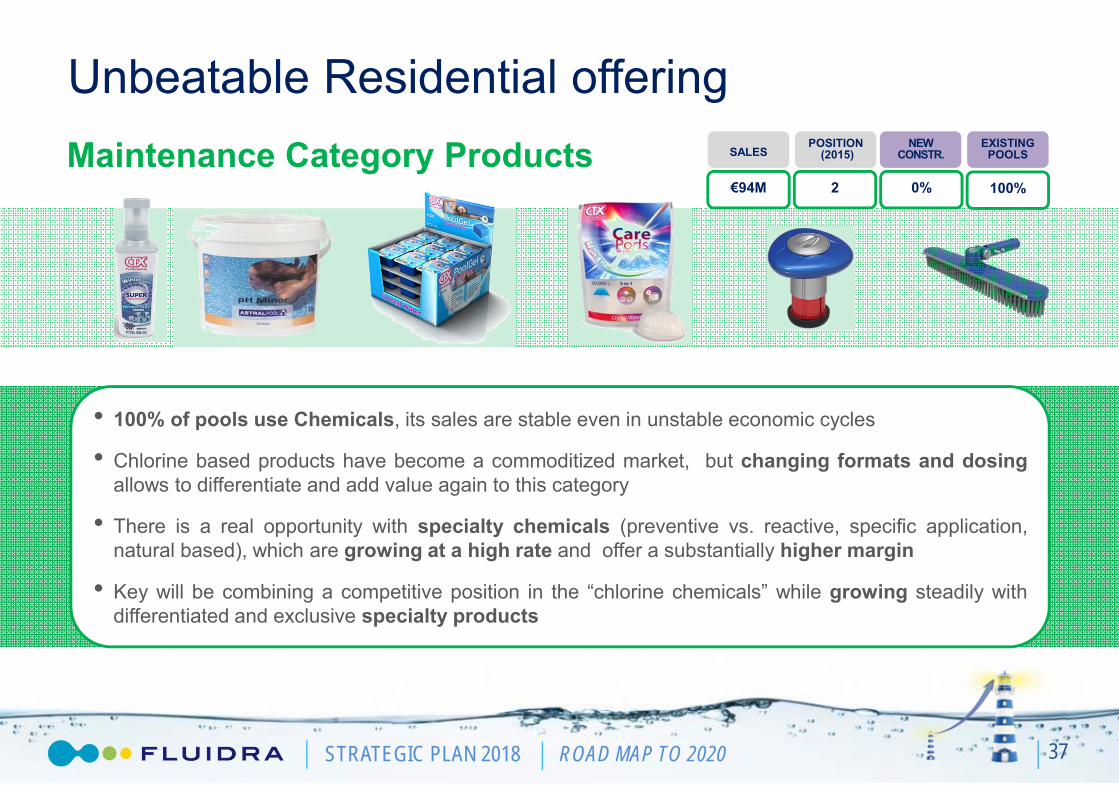
Unbeatable Residential offeringMaintenance Category Products
• 100% of pools use Chemicals, its sales are stable even in unstable economic cycles
• Chlorine based products have become a commoditized market, but changing formats and dosingallows to differentiate and add value again to this category
• There is a real opportunity with specialty chemicals (preventive vs. reactive, specific application,natural based), which are growing at a high rate and offer a substantially higher margin
• Key will be combining a competitive position in the “chlorine chemicals” while growing steadily withdifferentiated and exclusive specialty products
SALES
€94M
POSITION(2015)
2
NEW CONSTR.
0%
EXISTING POOLS
100%
37
STRATEGIC PLAN 2018 ROAD MAP TO 2020
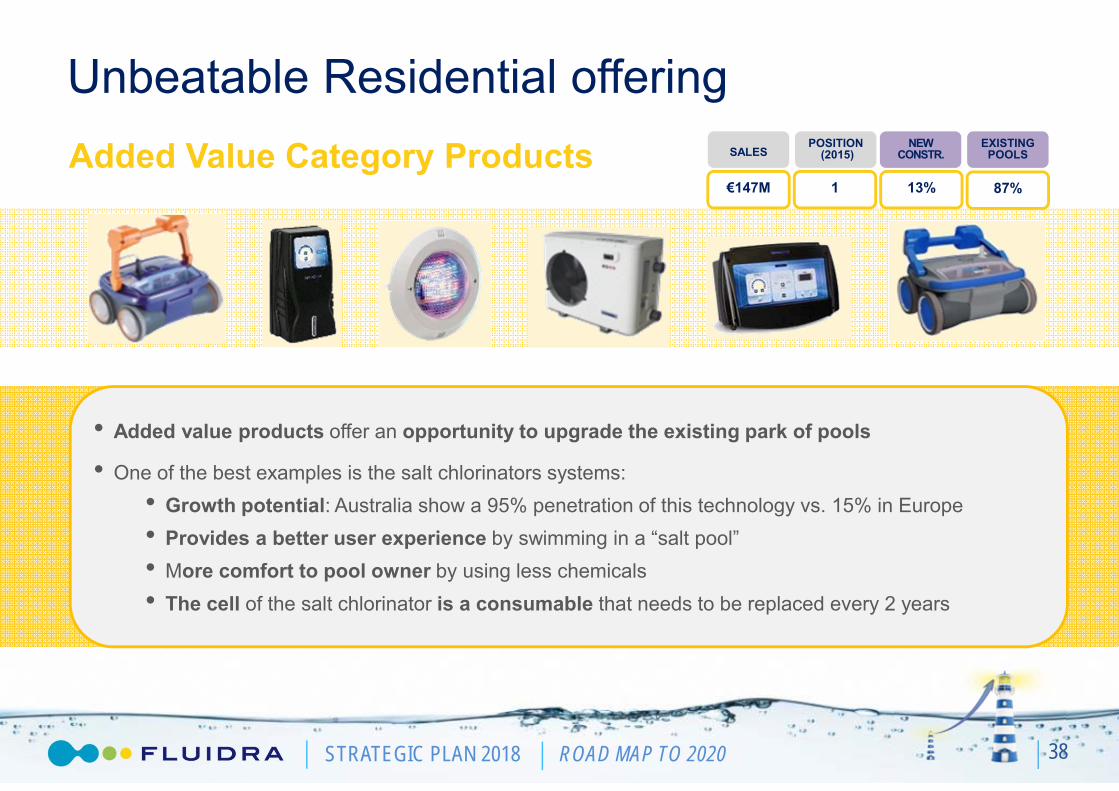
Unbeatable Residential offeringAdded Value Category Products
• Added value products offer an opportunity to upgrade the existing park of pools
• One of the best examples is the salt chlorinators systems:• Growth potential: Australia show a 95% penetration of this technology vs. 15% in Europe• Provides a better user experience by swimming in a “salt pool”• More comfort to pool owner by using less chemicals• The cell of the salt chlorinator is a consumable that needs to be replaced every 2 years
SALES
€147M
POSITION(2015)
1
NEW CONSTR.
13%
EXISTING POOLS
87%
38

STRATEGIC PLAN 2018 ROAD MAP TO 2020
Continued leadership in innovation
39
R&D+i
InnovationCommittee
Centers of Excellence
13
Customers
Partners’Network
R&D Invested: 1,4% of salesNew Product Sales: 10% - 2015
15% - 2018
Multi-center & open R&D model
STRATEGIC PLAN 2018 ROAD MAP TO 2020
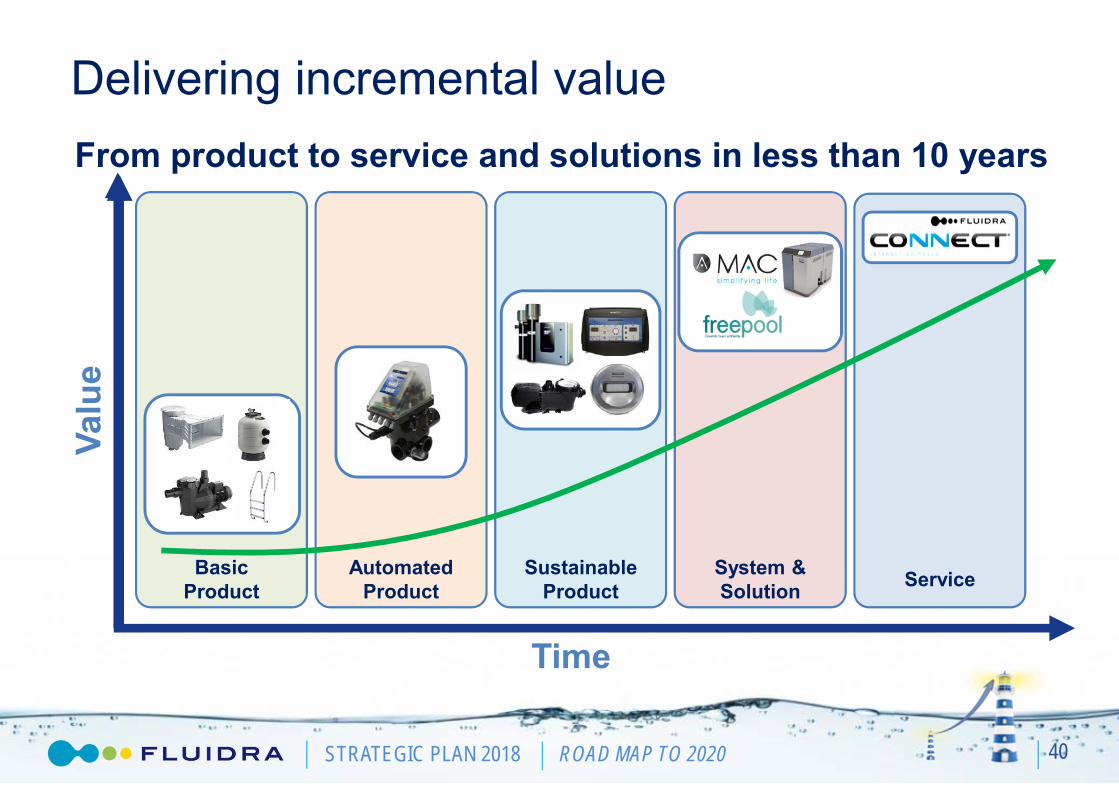
Delivering incremental value
40
Basic Product
AutomatedProduct
SustainableProduct
System & Solution Service
Valu
e
Time
From product to service and solutions in less than 10 years

STRATEGIC PLAN 2018 ROAD MAP TO 2020
Potential for new revenue streams
Fluidra Connect: the Internet of Pools
41
Pool Professional1. Expand Business2. Gain efficiency3. Increase customer loyalty
Pool owner1. Peace of mind2. Manage comfort features
The smart solution offering to the pool professional a complete online pool control, diagnosis and management.
STRATEGIC PLAN 2018 ROAD MAP TO 2020
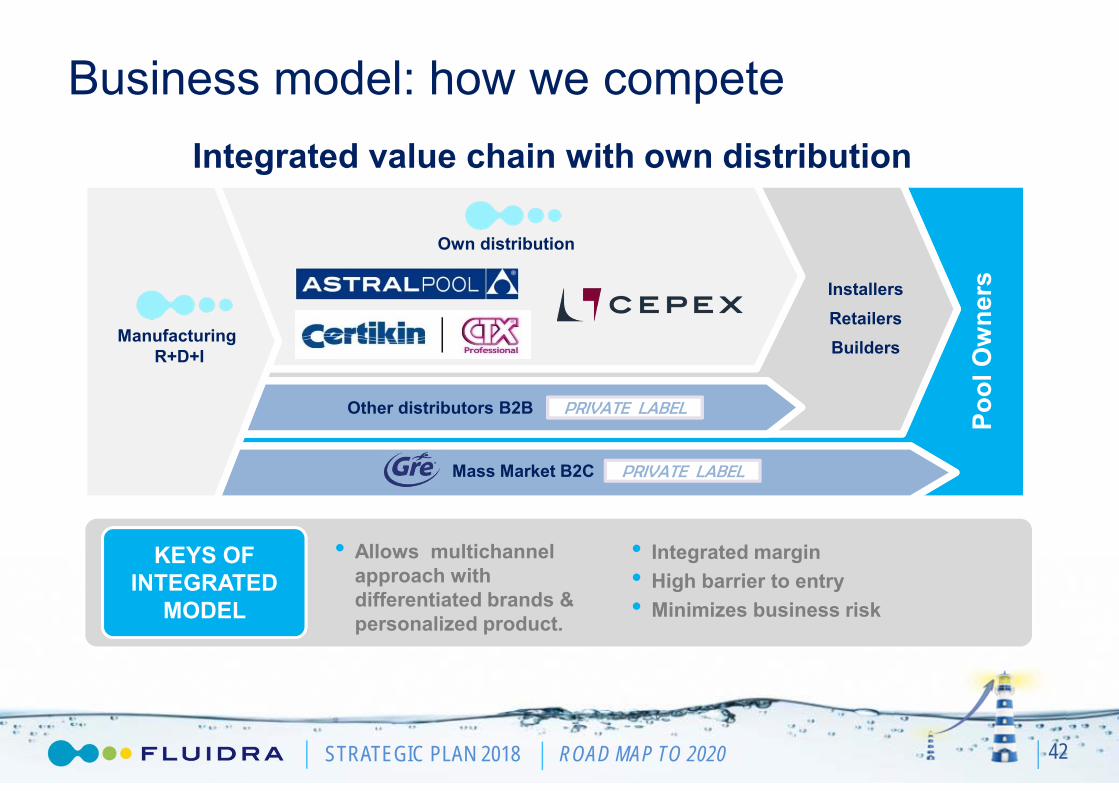
Business model: how we compete
42
Own distribution
ManufacturingR+D+I
Other distributors B2B PRIVATE LABEL
Mass Market B2C PRIVATE LABEL
InstallersRetailersBuilders
Pool
Ow
ners
Integrated value chain with own distribution
KEYS OF INTEGRATED
MODEL
• Allows multichannel approach with differentiated brands & personalized product.
• Integrated margin• High barrier to entry• Minimizes business risk
STRATEGIC PLAN 2018 ROAD MAP TO 2020
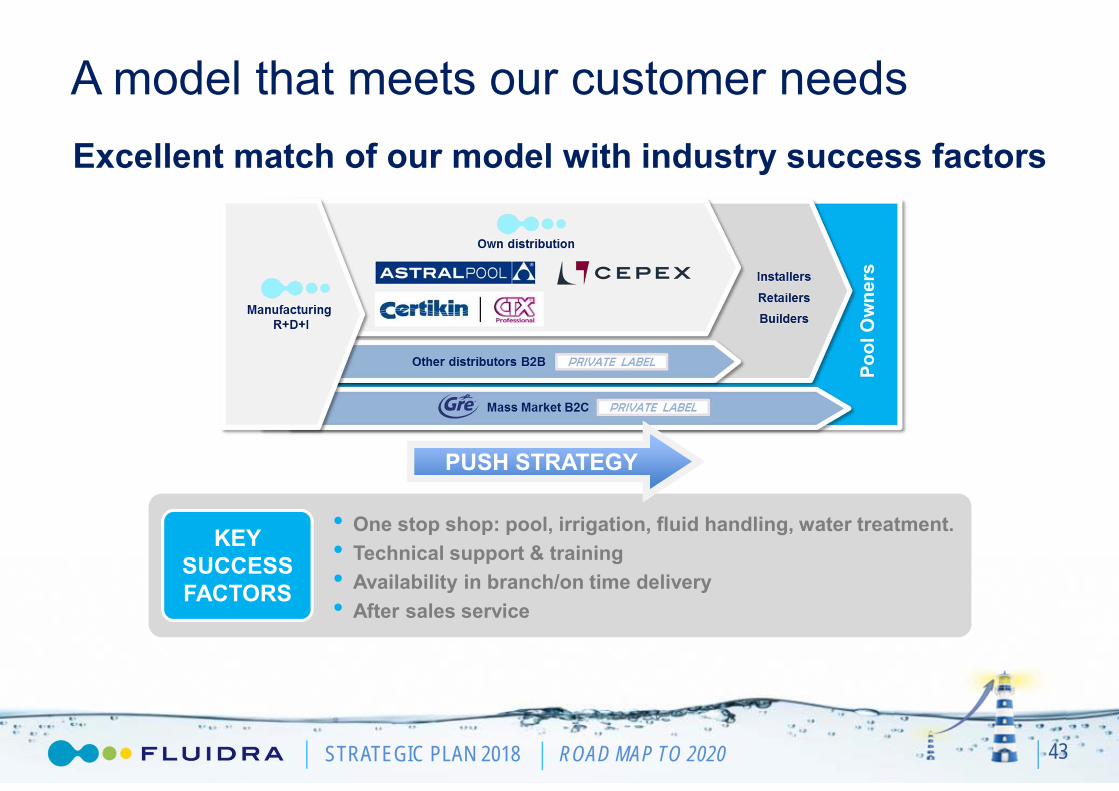
KEYSUCCESS FACTORS
• One stop shop: pool, irrigation, fluid handling, water treatment.• Technical support & training• Availability in branch/on time delivery• After sales service
A model that meets our customer needs
43
Excellent match of our model with industry success factors
PUSH STRATEGY

STRATEGIC PLAN 2018 ROAD MAP TO 2020
11%
89%
0.6B€ex US
Commercial Pool
44
STRATEGIC PLAN 2018 ROAD MAP TO 2020
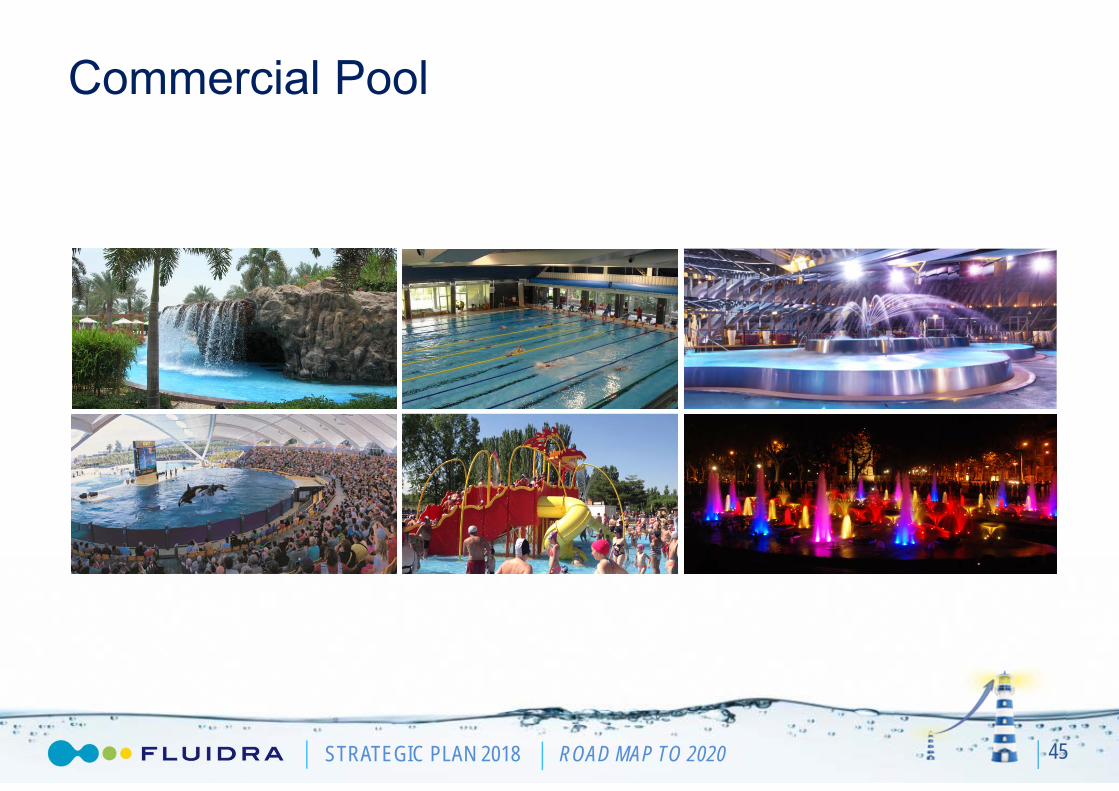
Commercial Pool
45

STRATEGIC PLAN 2018 ROAD MAP TO 2020
SALES
€67M
POSITION(2015)
1
NEW CONSTR.
54%
EXISTING POOLS
46%
Unbeatable Product Portfolio
46
Commercial Products
• Development has been directed towards energy and water efficient products and systems
• An example of an innovative solution is a water treatment system validated by
• Efficient: saves water and energy (-66% water renewal)
• Health: avoids skin irritation, reduces ocular and respiratory problems (-20% reduction of combined chloramines)
• Comfort: clean environment without the smell of chlorine (-75% concentration of oxidants)
STRATEGIC PLAN 2018 ROAD MAP TO 2020
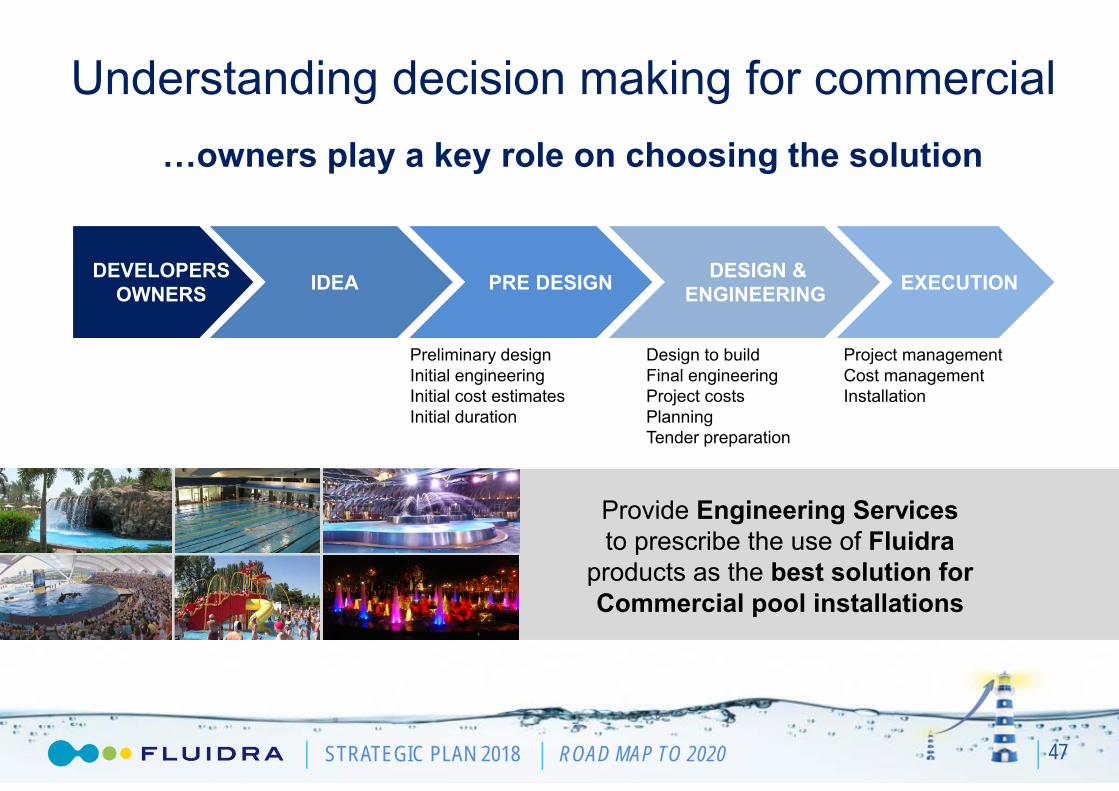
Understanding decision making for commercial
47
…owners play a key role on choosing the solution
DEVELOPERSOWNERS IDEA PRE DESIGN DESIGN &
ENGINEERING EXECUTION
Preliminary designInitial engineering Initial cost estimatesInitial duration
Design to buildFinal engineering Project costsPlanningTender preparation
Project managementCost managementInstallation
Provide Engineering Services to prescribe the use of Fluidra
products as the best solution for Commercial pool installations

STRATEGIC PLAN 2018 ROAD MAP TO 2020
A model that delivers to our customer needs
48
Complete match of industry success factor and our model
KEYSUCCESS FACTORS
Technical support & trainingOn time deliveryAfter sales service
Design & EngineeringIntegrated solutionsProject management
Ow
ners
PUSHPUSH PULLPULL

STRATEGIC PLAN 2018 ROAD MAP TO 2020
In summary
49

STRATEGIC PLAN 2018 ROAD MAP TO 2020 50
STRATEGIC PLAN 2018 ROAD MAP TO 2020STRATEGIC PLAN 2018 ROAD MAP TO 2020
Best practicesfor profitable growth

STRATEGIC PLAN 2018 ROAD MAP TO 2020
Proven & Efficient Best Practices
52
STRATEGIC PLAN 2018 ROAD MAP TO 2020
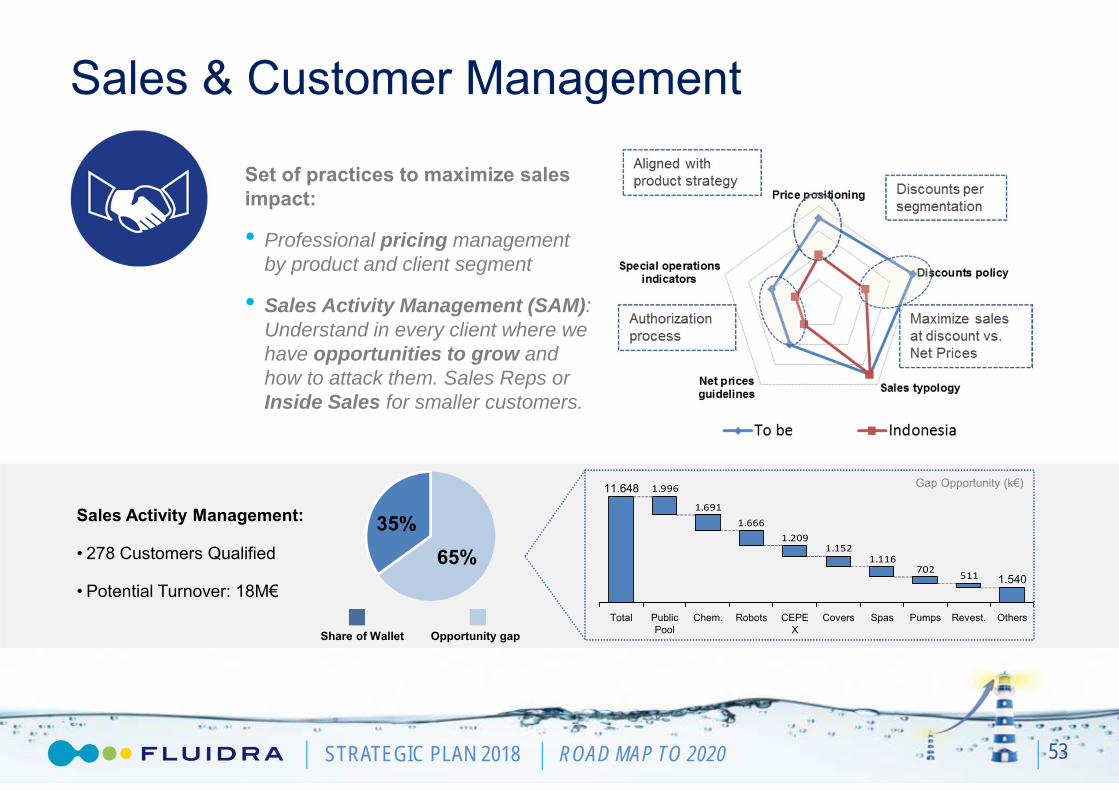
65%35%
Sales & Customer Management
Sales Activity Management:
• 278 Customers Qualified
• Potential Turnover: 18M€
35%
Set of practices to maximize sales impact:
• Professional pricing management by product and client segment
• Sales Activity Management (SAM): Understand in every client where we have opportunities to grow and how to attack them. Sales Reps or Inside Sales for smaller customers.
Share of Wallet Opportunity gap
5117021.116
1.1521.209
1.6661.691
1.996
Covers Spas Revest.Pumps
1.540
OthersCEPEX
RobotsChem.Public Pool
Total
11.648 Gap Opportunity (k€)
53
STRATEGIC PLAN 2018 ROAD MAP TO 2020
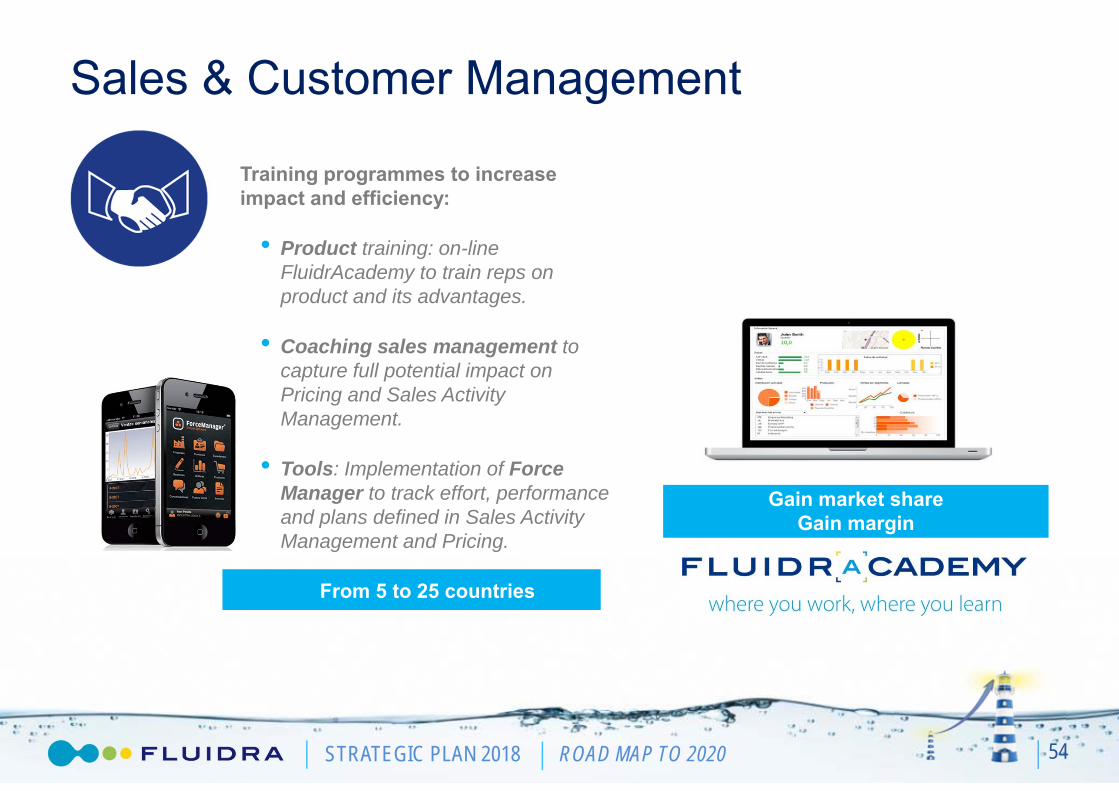
Sales & Customer Management
35%
Training programmes to increase impact and efficiency:
• Product training: on-line FluidrAcademy to train reps on product and its advantages.
• Coaching sales management to capture full potential impact on Pricing and Sales Activity Management.
• Tools: Implementation of Force Manager to track effort, performance and plans defined in Sales Activity Management and Pricing.
From 5 to 25 countries
54
Gain market shareGain margin
STRATEGIC PLAN 2018 ROAD MAP TO 2020
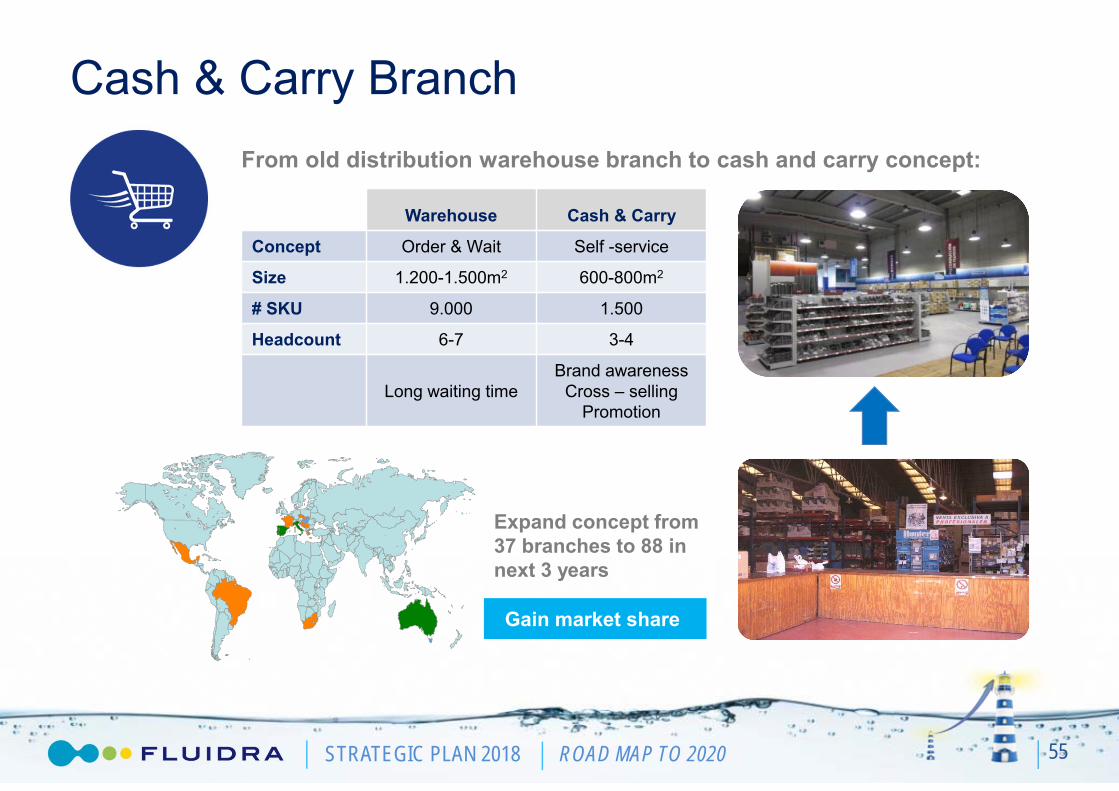
Cash & Carry Branch
35%
From old distribution warehouse branch to cash and carry concept:
Warehouse Cash & Carry
Concept Order & Wait Self -service
Size 1.200-1.500m2 600-800m2
# SKU 9.000 1.500
Headcount 6-7 3-4
Long waiting timeBrand awareness
Cross – sellingPromotion
Expand concept from 37 branches to 88 in next 3 years
Gain market share
55
STRATEGIC PLAN 2018 ROAD MAP TO 2020
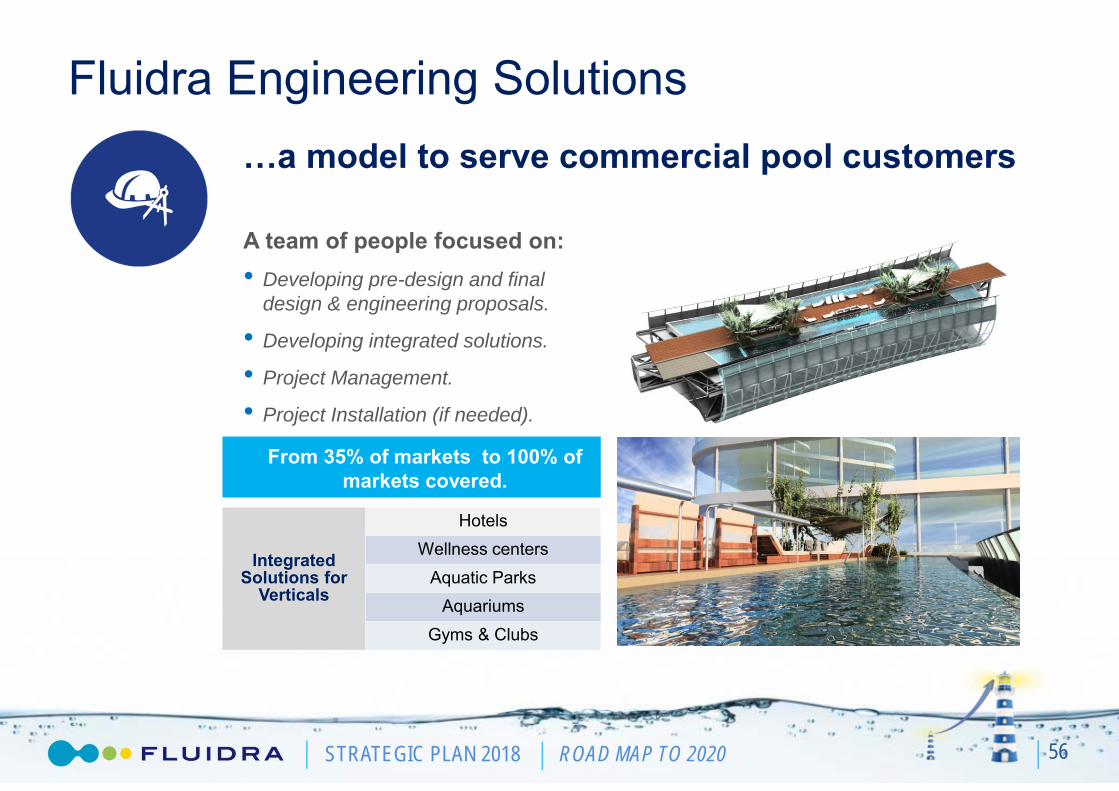
35% A team of people focused on:• Developing pre-design and final
design & engineering proposals.
• Developing integrated solutions.
• Project Management.
• Project Installation (if needed).
From 35% of markets to 100% of markets covered.
Fluidra Engineering Solutions
56
…a model to serve commercial pool customers
Integrated Solutions for
Verticals
HotelsWellness centers
Aquatic ParksAquariums
Gyms & Clubs

STRATEGIC PLAN 2018 ROAD MAP TO 2020
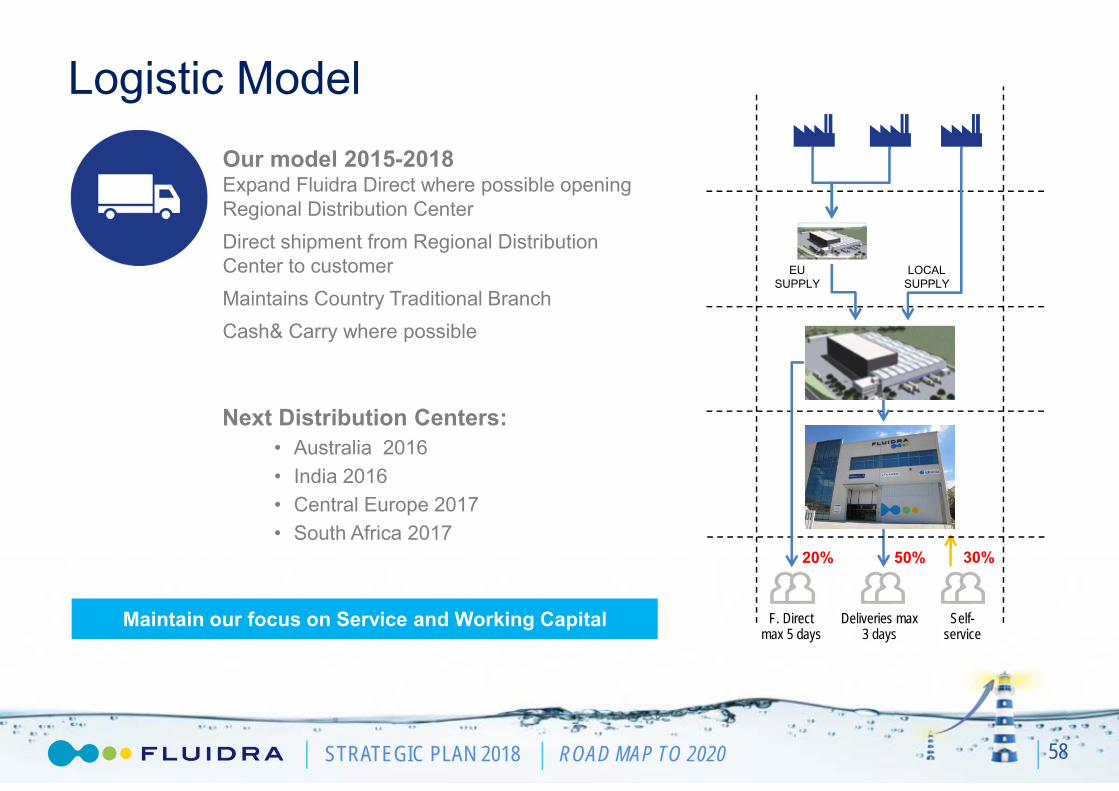
Logistic Model
Our model in Europe before 2011:Shipments to customer from our branches.Inefficiencies:
• 3 levels of warehouse generating excess of inventory and logistic cost.
• Irregular delivery service.
57
Drivers for our logistic model:• Availability• Service at right cost
Our model in South Europe from 2011: Fluidra Direct• Direct shipment from Distribution Center to customer• Eliminates old style Fluidra branches and creates opportunity
to Cash& Carry concept in all potential branches.• 27% inventory & 15% logistic cost reductions.
Now
24-48hSelf-
service
75%25%
Before
STRATEGIC PLAN 2018 ROAD MAP TO 2020
Self-service
Logistic Model
58
Next Distribution Centers:• Australia 2016• India 2016• Central Europe 2017• South Africa 2017
Our model 2015-2018Expand Fluidra Direct where possible opening Regional Distribution CenterDirect shipment from Regional Distribution Center to customerMaintains Country Traditional BranchCash& Carry where possible
Maintain our focus on Service and Working Capital
50% 30%
Deliveries max3 days
EUSUPPLY
LOCALSUPPLY
F. Directmax 5 days
20%
STRATEGIC PLAN 2018 ROAD MAP TO 2020
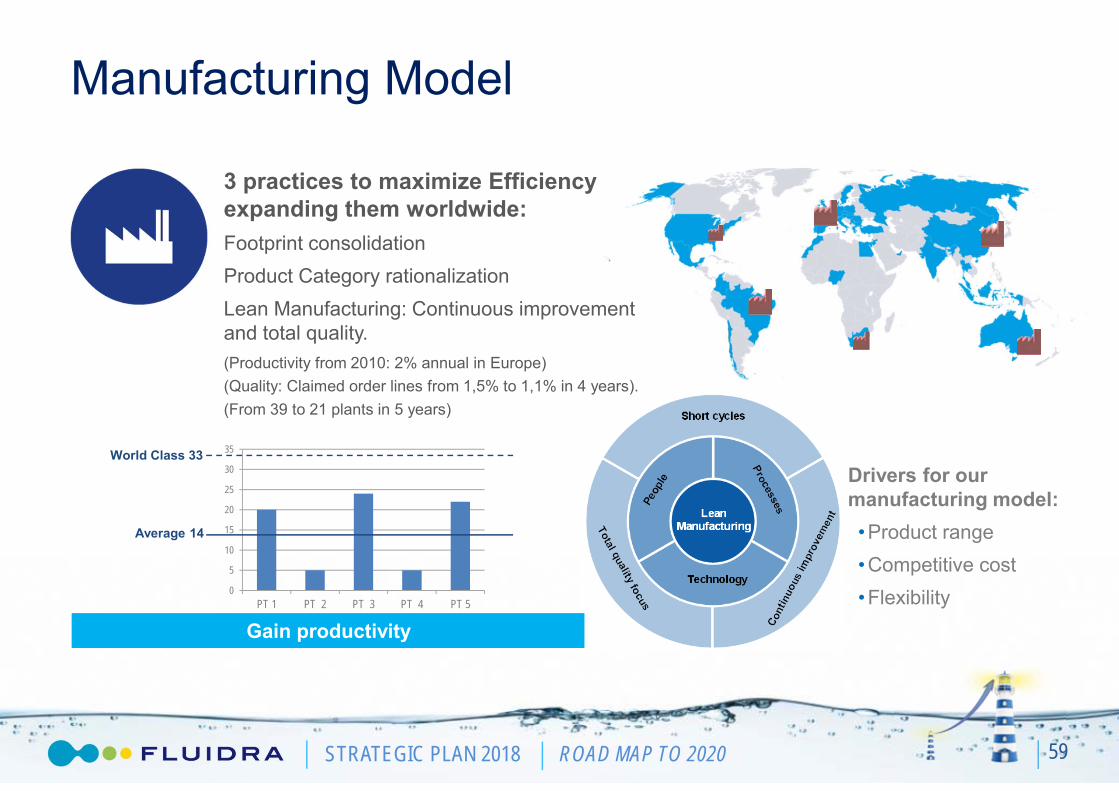
Manufacturing Model
59
3 practices to maximize Efficiency expanding them worldwide:Footprint consolidationProduct Category rationalizationLean Manufacturing: Continuous improvement and total quality.(Productivity from 2010: 2% annual in Europe)(Quality: Claimed order lines from 1,5% to 1,1% in 4 years).(From 39 to 21 plants in 5 years)
Drivers for our manufacturing model:•Product range•Competitive cost•Flexibility
Gain productivity
0
5
10
15
20
25
30
35
PT 1 PT 2 PT 3 PT 4 PT 5
Average 14
World Class 33

STRATEGIC PLAN 2018 ROAD MAP TO 2020
Consolidator in a fragmented industry
60
Fluidra has been the consolidator of the industry outside of the US since year 2000 with:
Technology: Salt chlorinators, Robots.
Distribution: Australia, Austria, Brazil, Indonesia, China, UK, Russia, South Africa.
Acquisition approach: Small size acquisitonsof family run businesses with a risk/benefit sharing approach that fits well with our industry.
Acquisition plan 2018
Sales size 1-35M€
Type Distribution, [Technology]
Valuationcriteria Target ≤4X EBITDA in 3 years
Number 8-10
Inorganic growth % 2-4% per year
Geography Europe, LatAm, Asia
Gain market share

STRATEGIC PLAN 2018 ROAD MAP TO 2020
Proven & Efficient Best Practices
61

STRATEGIC PLAN 2018 ROAD MAP TO 2020STRATEGIC PLAN 2018 ROAD MAP TO 2020
DistributionSpain: Provensuccessful practices

STRATEGIC PLAN 2018 ROAD MAP TO 2020
30%
17%7%6%
40%
Spain: Pool Market today
63
85%
15%
The Spanish pool market has 1.1M installed pools and is valued at € 300M
•On average, Spain has 1 pool for every 37 people.
•New Pools: 16.000 built in 2014 / (estim.) 18.000 in 2015.
•Market trend is back to growth (+2%).
•Business remains on renovation/upgrade of the installed pool park.
Fluidra Comercial España
Competitor 1
Competitor 2
Competitor 3
Rest. Compet.
Residential
Commercial
90M€
208 Employees
19 Branches
Fluidra Comercial España
Note: Fluidra’s share does not include sales done in Spain through other channels by other group companies..

STRATEGIC PLAN 2018 ROAD MAP TO 2020 64
2011 2015
30 19
17 M€ 6 M€
5.8 3.5
5.1% 4.0%
New logistic model
Branches(From Old Branches to C&C)
Inventory level
Logistic FTEs(Average per Branch)
Transport Cost(% of Net Sales)
“Closer to market”, better service and more efficiently
80% 90%Service Level(% Perfect & Full Order delivery)
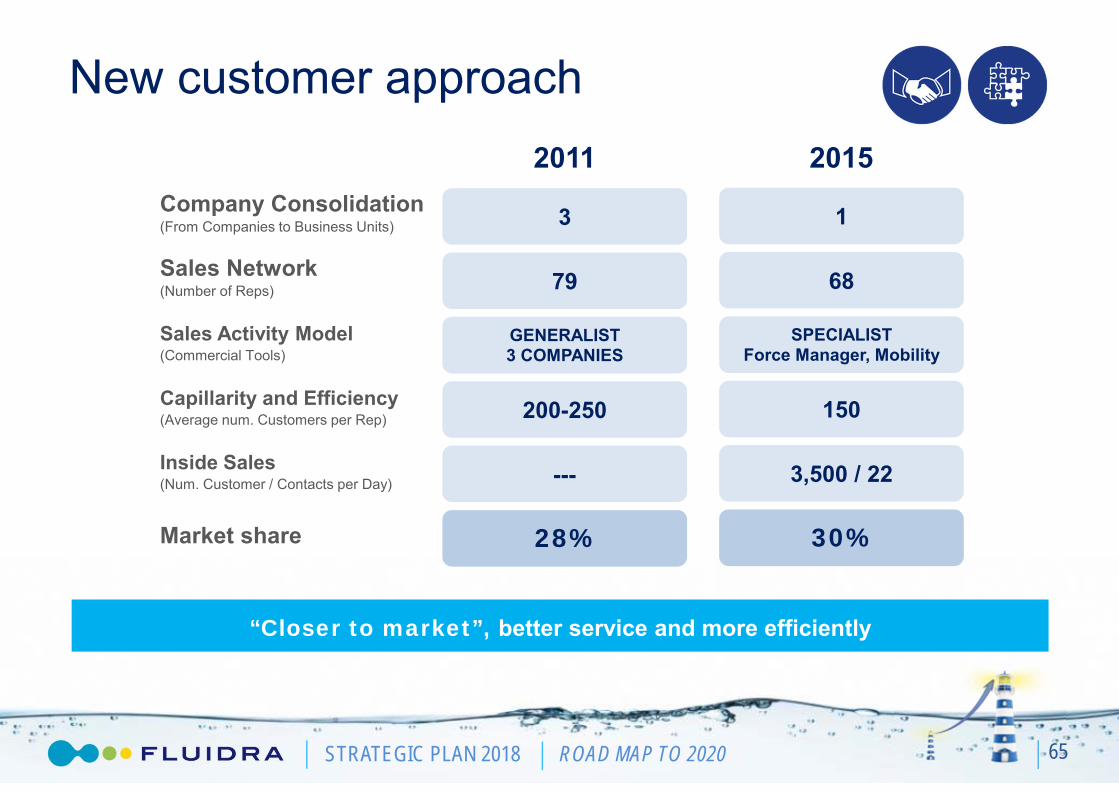
STRATEGIC PLAN 2018 ROAD MAP TO 2020 65
2011 2015
3 1
79 68
GENERALIST3 COMPANIES
SPECIALISTForce Manager, Mobility
--- 3,500 / 22
New customer approach
Company Consolidation(From Companies to Business Units)
Sales Network(Number of Reps)
Sales Activity Model(Commercial Tools)
Inside Sales(Num. Customer / Contacts per Day)
“Closer to market”, better service and more efficiently
28% 30%Market share
200-250 150Capillarity and Efficiency(Average num. Customers per Rep)

STRATEGIC PLAN 2018 ROAD MAP TO 2020
Results 2008 - 2015
66
Proven best practices deliver excellent operating leverage
126
9588
81 8391
2008 2011 2012 2013 2014 E2015
6.3
2.8
1.2
3.3
4.9
6.8
2008 2011 2012 2013 2014 E2015
SALES EBITDA
-57.1%
175.0%-7.4%
48.5%
38.8%
-8.0% 2.5% 9.6%

STRATEGIC PLAN 2018 ROAD MAP TO 2020
• Extend our current capillarity with 3 new Cash&Carry.
• Consolidate our reliable Logistic Model.
• Reinforcing and fostering our continuous training for a more specialized sales force.
• Full speed on the implementation of SAM.
• Replicate model in Portugal creating an Integrated team in Iberia.
Spain: Strategy 2018
67
Share 201832%
Perfect Delivery
95%
Sales Growth +3%
EbitdaTarget9.1%
STRATEGIC PLAN 2018 ROAD MAP TO 2020STRATEGIC PLAN 2018 ROAD MAP TO 2020
Manufacturing Metalast: Proven successful practices

STRATEGIC PLAN 2018 ROAD MAP TO 2020
Business development until 2007:•Continued annual sales growth:
2001: 33M. – 2007: 59M. CAGR. 10%
•Manufacturing of new family products addressed to new construction•Industrial management focused on growing.
From 2008 until 2015:•Decrease in sales volume:
2007: 59M. – 2015: 36M. CAGR. -4,3%
Metalast
69
Adapt to environment by continuous improvement: gain profitability
Established: 1969Location: Polinyà (Barcelona)Number of employees in 2015: 144Production technology: Metal processing - Thermoplastics blowing

STRATEGIC PLAN 2018 ROAD MAP TO 2020 70
2007 201523.000 m2 18.000 m2
5 / 33 20 / 33
5 1
188 176
40,9% Gross Mg 45,5% Gross Mg
…Our Changes: Lean Manufacturing
Lay-out optimization
Continuous improvement (Level of excellence)
Footprint integration
Inventory turns(In days)
Product redesign andnew developments
Implantation of LEAN manufacturing and new product development
STRATEGIC PLAN 2018 ROAD MAP TO 2020
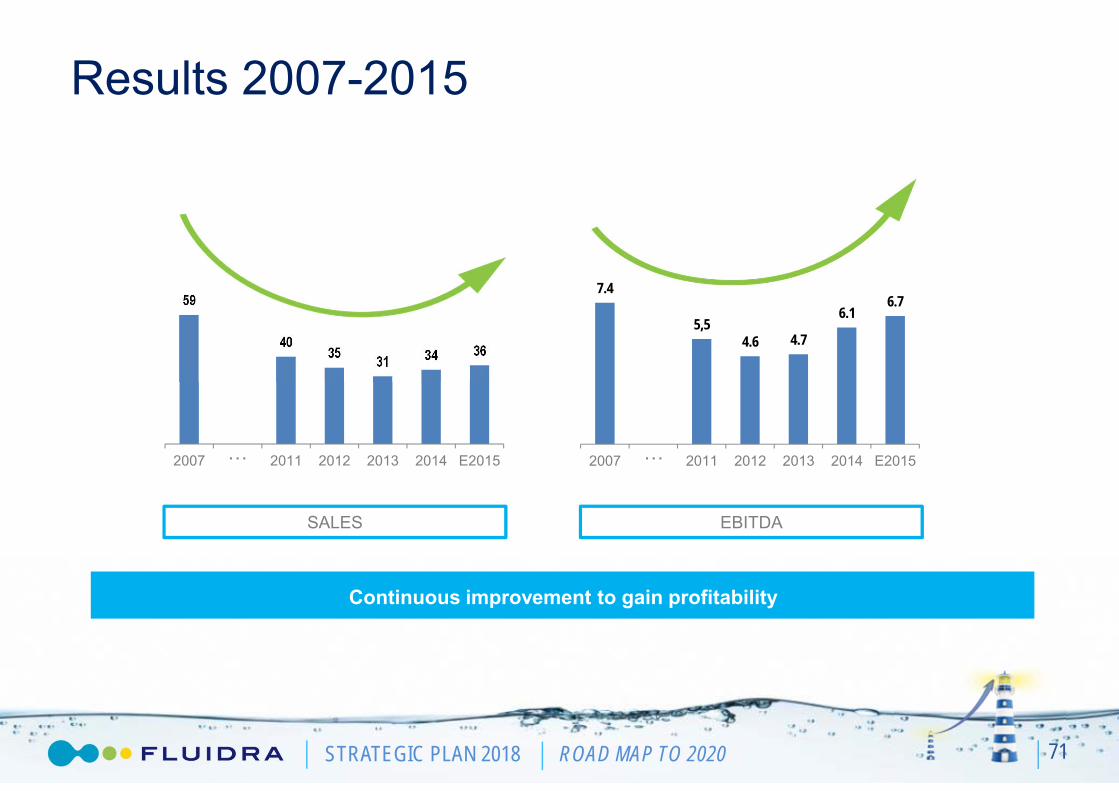
Results 2007-2015
71
Continuous improvement to gain profitability
59
4035 31 34 36
2007 2011 2012 2013 2014 E2015
7.4
5,54.6 4.7
6.16.7
2007 2011 2012 2013 2014 E2015
SALES EBITDA
… …

STRATEGIC PLAN 2018 ROAD MAP TO 2020
• Full speed on the Lean implementation to reach 100% excellence• Productive plants consolidation.• Adapt capacity to support sales growth.• Reengineering and product development.• Reinforcing our continuous training for a deeper involvement of the staff.
• Expand experience to rest of Int´l plants: France, China and South Africa.
Strategy 2018
72
Level of Excellence
33/33
Inventory Turns151
Growth + 7,5% Annual
Ebitda Target19,0%

STRATEGIC PLAN 2018 ROAD MAP TO 2020 73

STRATEGIC PLAN 2018 ROAD MAP TO 2020STRATEGIC PLAN 2018 ROAD MAP TO 2020
Opportunities for profitable growthGeographical markets

STRATEGIC PLAN 2018 ROAD MAP TO 2020
Geographical Markets
75
USA: Robotic cleaner niche strategy • Market size 65 M€• 4% of our sales
• Market size 2.5B€• 77% of our sales
• Market size 684 M€• 19% of our sales
Emerging for pool: Mainly commercial pool business through projects
Core for pool: Mainly business of residential pool and a huge base of professional customers
STRATEGIC PLAN 2018 ROAD MAP TO 2020
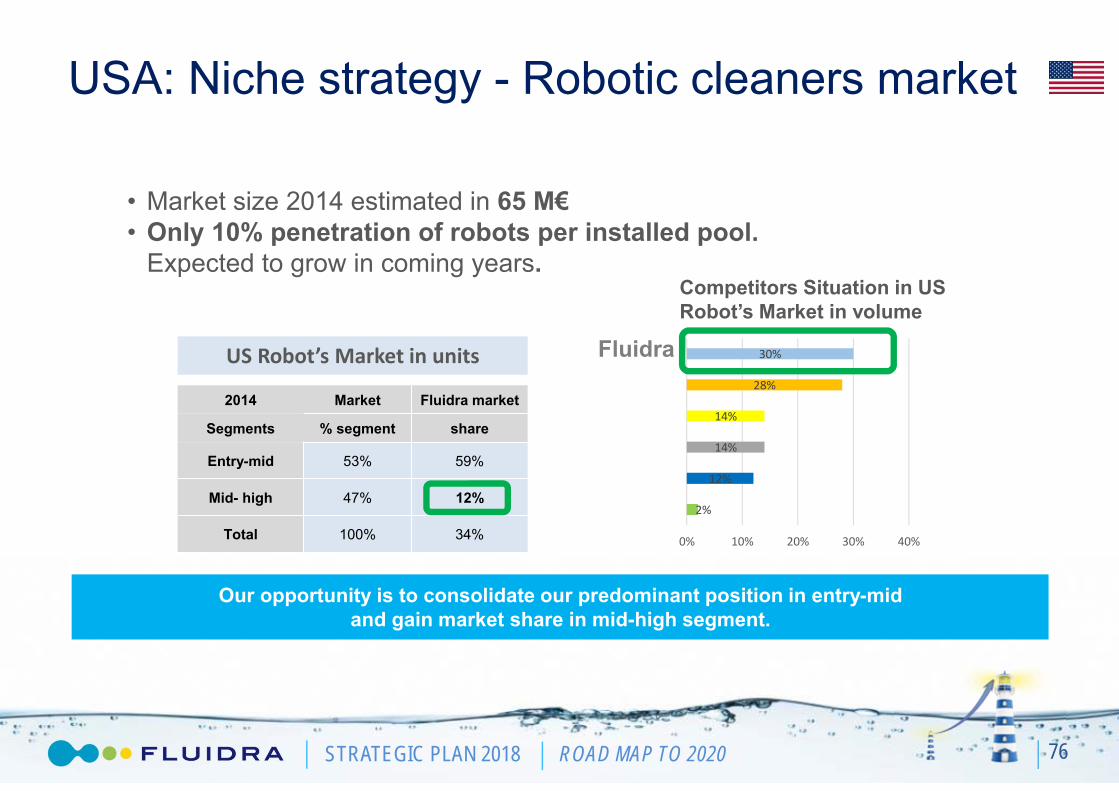
USA: Niche strategy - Robotic cleaners market
76
• Market size 2014 estimated in 65 M€• Only 10% penetration of robots per installed pool.
Expected to grow in coming years.
2014 Market Fluidra market
Segments % segment share
Entry-mid 53% 59%
Mid- high 47% 12%
Total 100% 34%
Competitors Situation in US Robot’s Market in volume
2%
12%
14%
14%
28%
30%
0% 10% 20% 30% 40%
US Robot’s Market in units Fluidra
Our opportunity is to consolidate our predominant position in entry-mid and gain market share in mid-high segment.
STRATEGIC PLAN 2018 ROAD MAP TO 2020
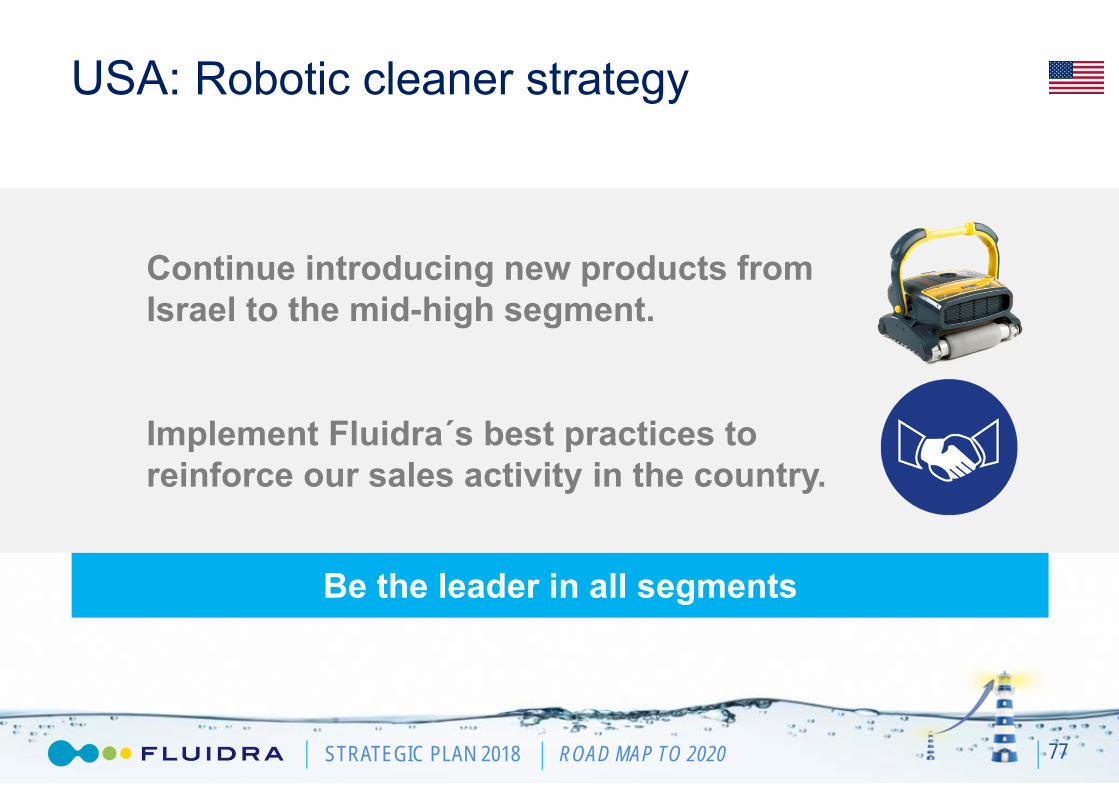
Be the leader in all segments
USA: Robotic cleaner strategy
77
Continue introducing new products from Israel to the mid-high segment.
Implement Fluidra´s best practices to reinforce our sales activity in the country.

STRATEGIC PLAN 2018 ROAD MAP TO 2020
Core Pool Markets: Penetration
78
Our opportunity is to further develop our business model to gain penetration
Total pools
Market size
Market share
Market trends:• Capillarity• Focus on installed base pools: Added value • Perfect service level• Commercial market already developed by actual customers• Few global players & major competitors are locals
8.5M
2.5B€
16%
€
STRATEGIC PLAN 2018 ROAD MAP TO 2020
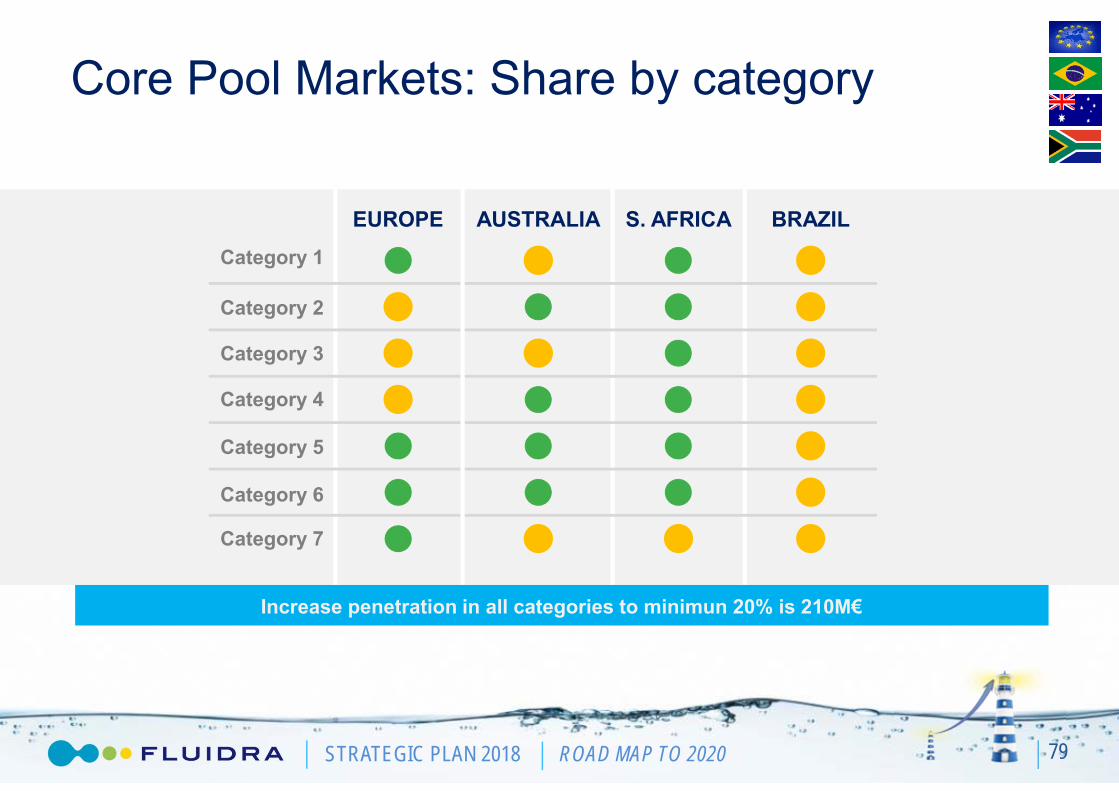
Core Pool Markets: Share by category
79
Increase penetration in all categories to minimun 20% is 210M€
EUROPE AUSTRALIA S. AFRICA BRAZILCategory 1
Category 2
Category 3
Category 4
Category 5
Category 6
Category 7

STRATEGIC PLAN 2018 ROAD MAP TO 2020
Expand success story of Spain and Australia
Core Pool Markets: Best practices at full speed
80
• Gain capillarity by opening new cash & carry branches.
• Perfect delivery to our customers.
• Customer management to optimize share.
• Introduce new product in added value categories.
• Engineering solutions to improve penetration.
STRATEGIC PLAN 2018 ROAD MAP TO 2020STRATEGIC PLAN 2018 ROAD MAP TO 2020
Australia: Capillarity and local vertical integration
STRATEGIC PLAN 2018 ROAD MAP TO 2020STRATEGIC PLAN 2018 ROAD MAP TO 2020
Brazil: Replicate successful Australian case

STRATEGIC PLAN 2018 ROAD MAP TO 2020
Emerging Pool Markets: Focus on Commercial Pool
83
• Market based on Commercial Pool• Residential market is not relevant• Highly fragmented markets• Market size: 684 M€• Fluidra share: 15%• Fluidra Coverage from 73% to 90%
Market trends:• Tourism is the major driver • Prescription in Developers/Engineering companies
Our opportunity is to become a reference in Engineering Solutions

STRATEGIC PLAN 2018 ROAD MAP TO 2020
Emerging Pool Markets: Our strategy
84
Develop Engineering solutions concept: From product prescription to project management.
Further development of regional centres of engineering (existing in Dubai and Singapore).
Global leader in Commercial Pool

STRATEGIC PLAN 2018 ROAD MAP TO 2020
Organic growth expected in all continents
85
Note: Net sales for 2014 adjusted for divestitures. Expected organic CAGR from 2014 to 2018.
38M€+6%
15M€+9%
384M€+3%
19M€+6%
71M€+5%
52M€+8%
Global organic growth will be around 5%

STRATEGIC PLAN 2018 ROAD MAP TO 2020 86
STRATEGIC PLAN 2018 ROAD MAP TO 2020STRATEGIC PLAN 2018 ROAD MAP TO 2020
Financial outlook & Closing
STRATEGIC PLAN 2018 ROAD MAP TO 2020
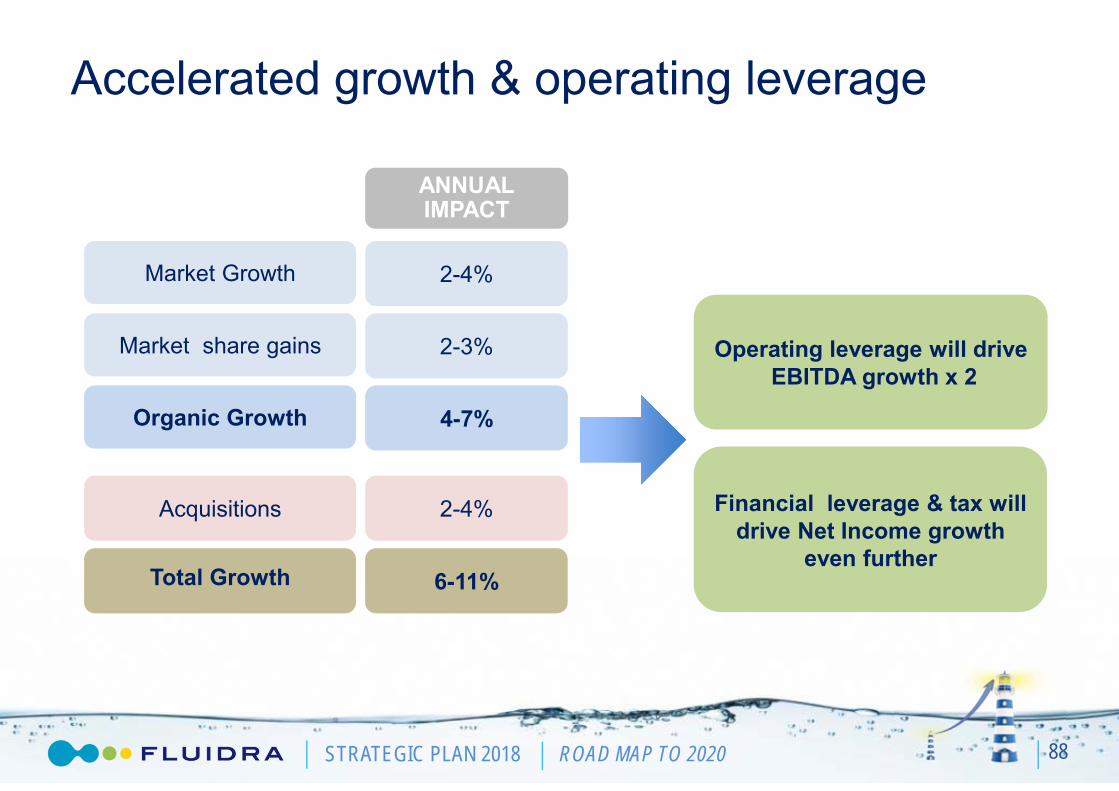
Accelerated growth & operating leverage
88
Operating leverage will driveEBITDA growth x 2
Financial leverage & tax will drive Net Income growth
even further
ANNUALIMPACT
Market Growth 2-4%
Acquisitions 2-4%
Total Growth 6-11%
Market share gains 2-3%
Organic Growth 4-7%
STRATEGIC PLAN 2018 ROAD MAP TO 2020
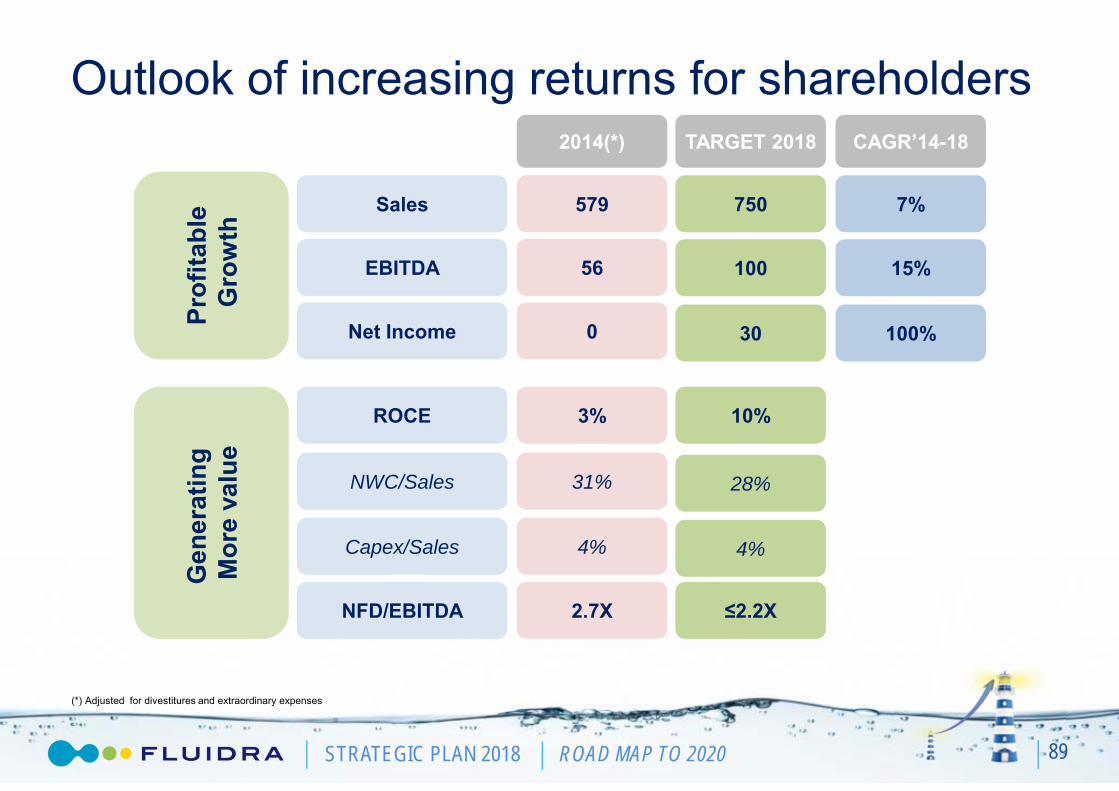
Outlook of increasing returns for shareholders
89
(*) Adjusted for divestitures and extraordinary expenses
2014(*) TARGET 2018 CAGR’14-18
Prof
itabl
eG
row
thG
ener
atin
g M
ore
valu
eSales 579
EBITDA 56
Net Income 0
ROCE 3%
NWC/Sales 31%
Capex/Sales 4%
NFD/EBITDA 2.7X
750
100
30
10%
28%
4%
≤2.2X
7%
15%
100%
STRATEGIC PLAN 2018 ROAD MAP TO 2020
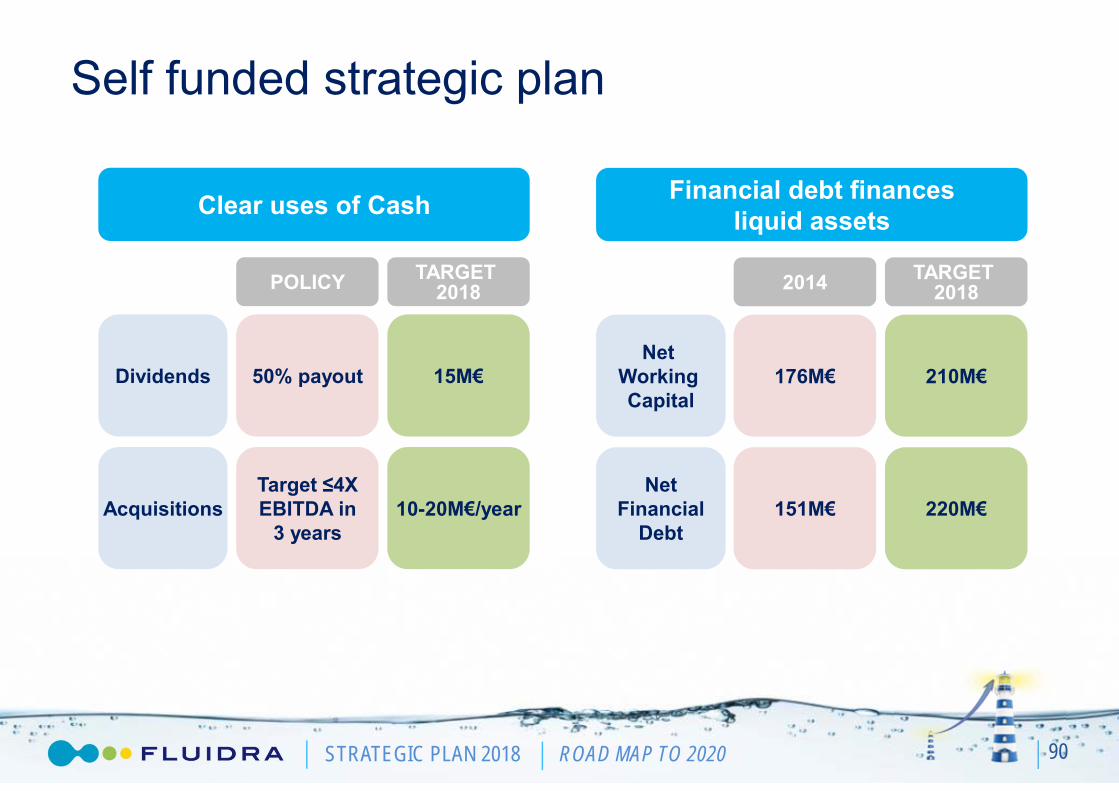
Self funded strategic plan
90
POLICY TARGET 2018
Dividends
Acquisitions
50% payout
Target ≤4X EBITDA in
3 years
15M€
10-20M€/year
Clear uses of Cash Financial debt financesliquid assets
2014 TARGET 2018
Net WorkingCapital
NetFinancial
Debt
176M€
151M€
210M€
220M€

STRATEGIC PLAN 2018 ROAD MAP TO 2020
Cash generation & uses of cash
91
ACCUMULATED2018
ACCUMULATED2018
31M€Earn out
Other cash items 13M€
191M€
123M€Free Cash Flow 52M€Dividends
Change in NFD 68M€ Acquisitions 80M€
191M€ Minority interest 15M€
Note 1: Minority interest reflects cash used to purchase shares from minority owners in subsidiaries.Note 2: Other cash items includes bank refinancing fees, purchase of shares and other balance sheet accounts of minor value.

STRATEGIC PLAN 2018 ROAD MAP TO 2020 92
Are we on the right track for 2018?
CAGR’147%
CAGR’1415%
579642
680714
750
2014 Guidance2015
Guidance2016
2017 Target 2018
56
7283
92100
2014 Guidance 2015Guidance 2016 2017 Target 2018
10%
SALES EBITDA
6%
37%
29%15%
The evolution of 2015 and preliminary guidance for 2016 show that we are on the path to achieving targets
Note: 2014 adjusted for divestitures and extraordinary expenses
STRATEGIC PLAN 2018 ROAD MAP TO 2020STRATEGIC PLAN 2018 ROAD MAP TO 2020
Closing Remarks

STRATEGIC PLAN 2018 ROAD MAP TO 2020
Fluidra is in growth mode again
94
1997 1998 1999 2000 2001 2002 2003 2004 2005 2006 2007 2008 2009 2010 2011 2012 2013 2014 2015 … 2018 20201969…
Profitable growth
Source: IMF-WEO

STRATEGIC PLAN 2018 ROAD MAP TO 2020
Fluidra is now a stronger company
95
…in a healthier market

STRATEGIC PLAN 2018 ROAD MAP TO 2020
…with proven best practices…
96

STRATEGIC PLAN 2018 ROAD MAP TO 2020 97
2015 2018
37 88
84% 95%
14 over 33 22 over 33
5 countries 25 countries
…and a clear roadmap
Cash & Carry(C&C over total branches)
Logistic Model(% perfect delivery)
Manufacturing Model(Level of excellence)
Sales & Customer Mng(Number of countries implemented
35% 100%Engineering Solutions(% regions implementing)
8-10Consolidator(Acquisitions)
STRATEGIC PLAN 2018 ROAD MAP TO 2020 98
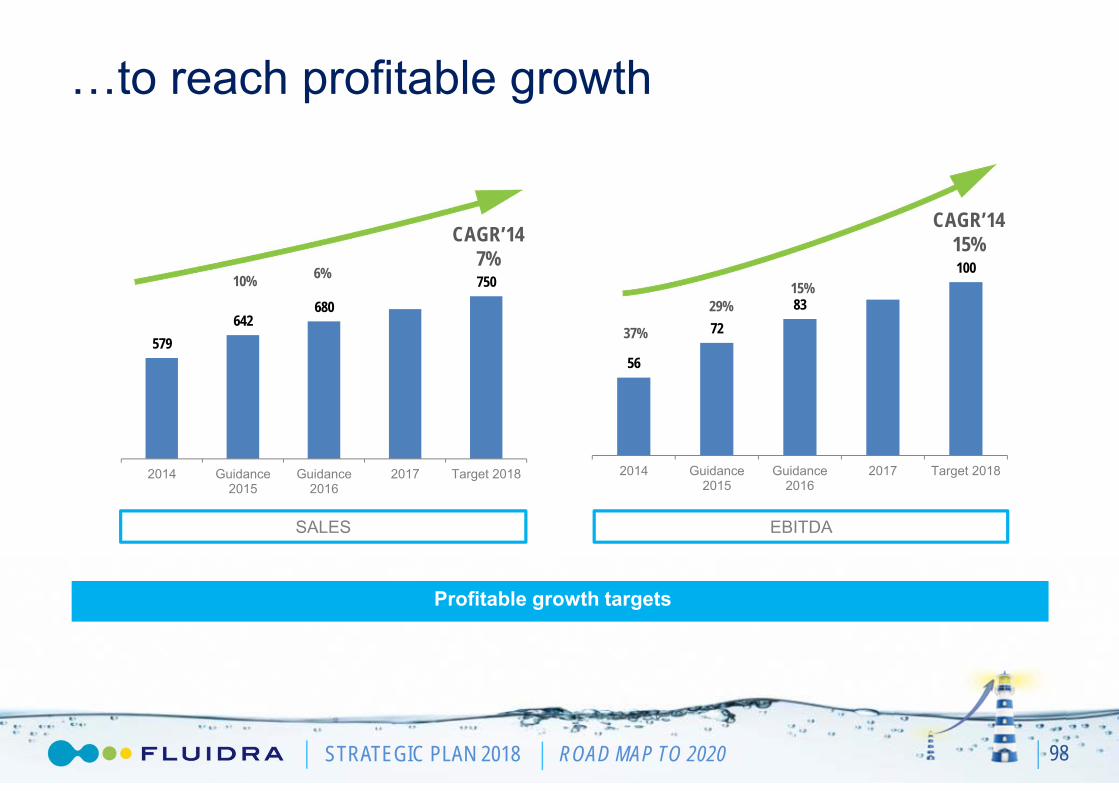
…to reach profitable growth
CAGR’147%
CAGR’1415%
579642
680750
2014 Guidance2015
Guidance2016
2017 Target 2018
56
7283
100
2014 Guidance2015
Guidance2016
2017 Target 2018
10%
SALES EBITDA
6%
37%
29%15%
Profitable growth targets
STRATEGIC PLAN 2018 ROAD MAP TO 2020
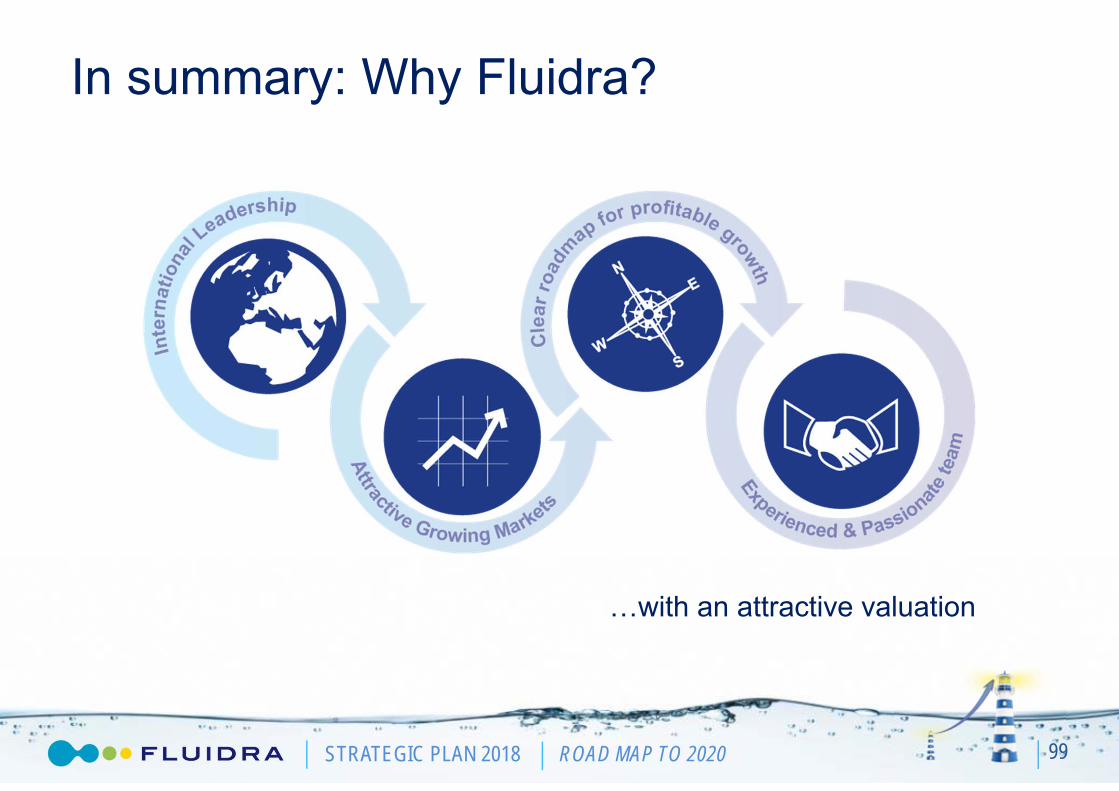
In summary: Why Fluidra?
99
…with an attractive valuation
STRATEGIC PLAN 2018 ROAD MAP TO 2020
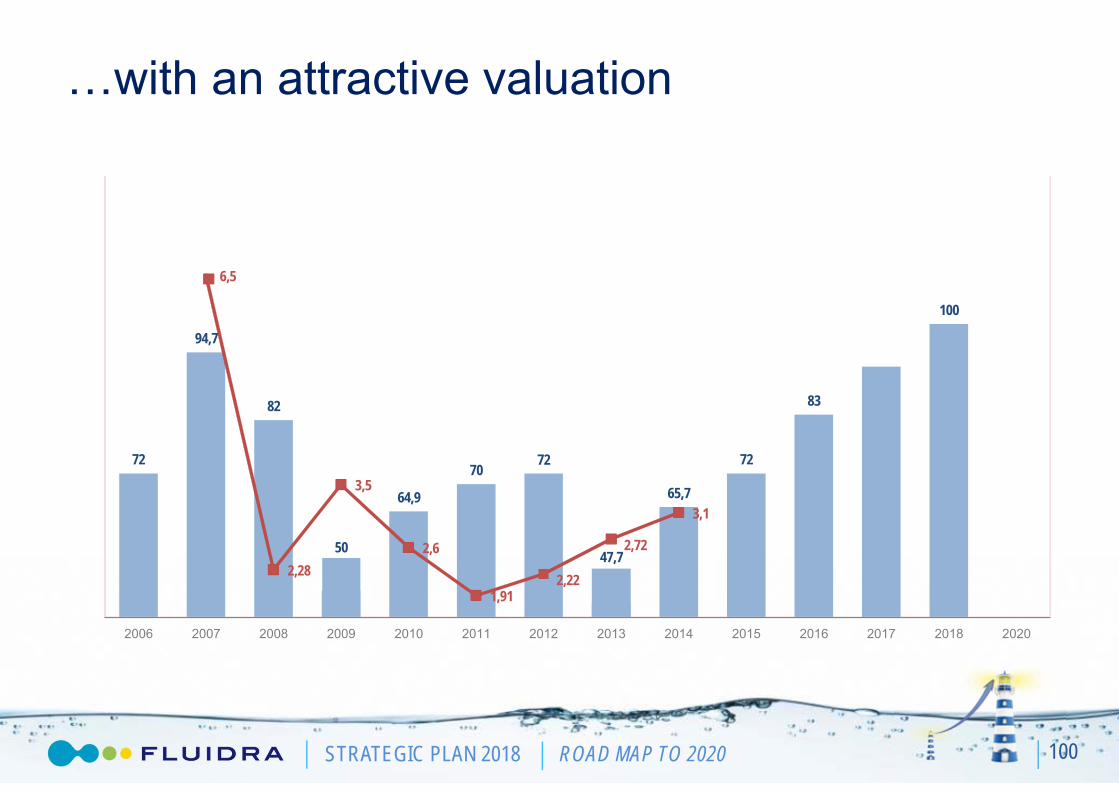
…with an attractive valuation
100
7272
94,7
82
50
64,9
70
47,7
65,7
72
83
100
6,5
2,28
3,5
2,6
1,912,22
2,72
3,1
2006 2007 2008 2009 2010 2011 2012 2013 2014 2015 2016 2017 2018 2020
STRATEGIC PLAN 2018 ROAD MAP TO 2020
THANK YOU