str global 2014 importance of hotel data congreso nacional de hoteleros de chile thomas emanuel...
TRANSCRIPT
STR Global 2014 www.strglobal.comwww.strglobal.com
Importance of Hotel DataCongreso Nacional de Hoteleros de ChileThomas Emanuel
Director of Business Development
Valdivia
28th September 2014
STR Global 2014 www.strglobal.com
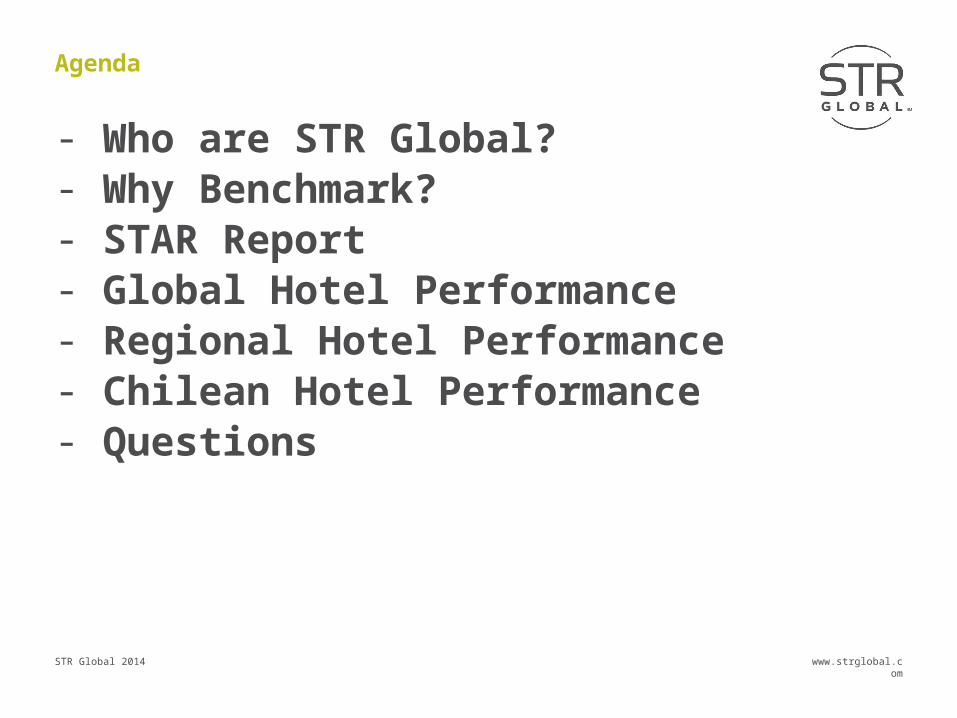
Agenda
- Who are STR Global?- Why Benchmark?- STAR Report- Global Hotel Performance- Regional Hotel Performance- Chilean Hotel Performance- Questions
STR Global 2014 www.strglobal.com
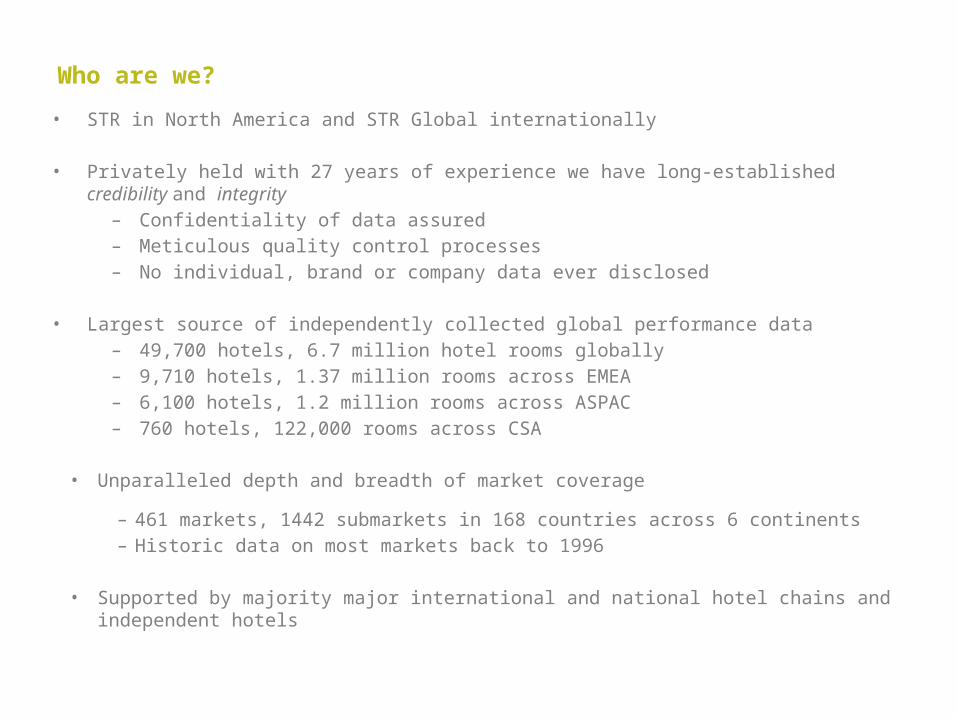
Who are we?
• STR in North America and STR Global internationally
• Privately held with 27 years of experience we have long-established credibility and integrity– Confidentiality of data assured– Meticulous quality control processes– No individual, brand or company data ever disclosed
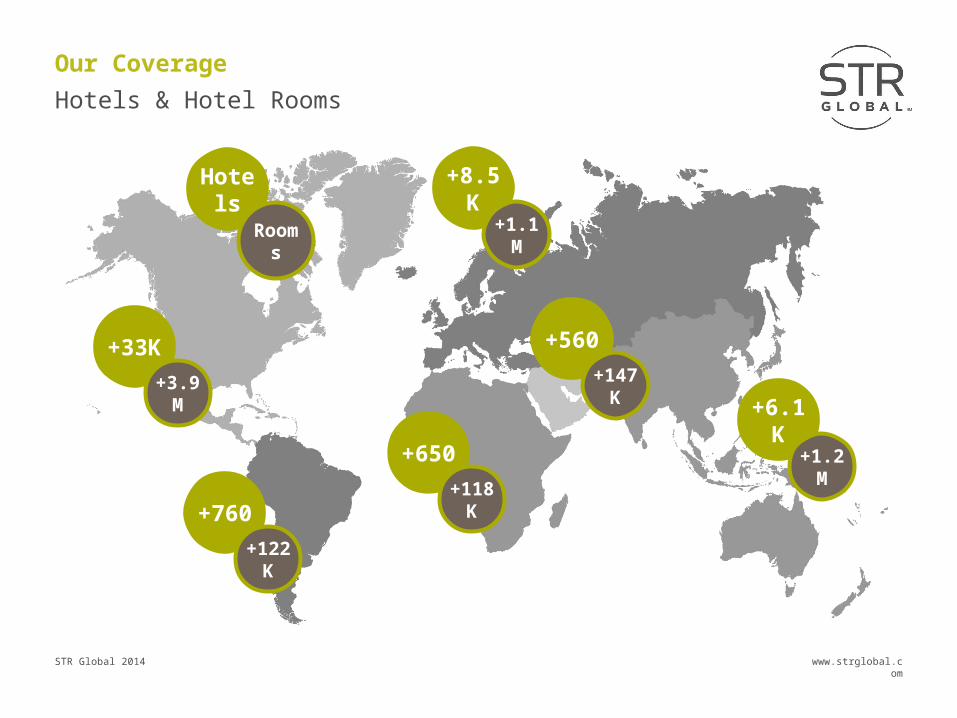
• Largest source of independently collected global performance data– 49,700 hotels, 6.7 million hotel rooms globally– 9,710 hotels, 1.37 million rooms across EMEA– 6,100 hotels, 1.2 million rooms across ASPAC– 760 hotels, 122,000 rooms across CSA
• Unparalleled depth and breadth of market coverage
– 461 markets, 1442 submarkets in 168 countries across 6 continents– Historic data on most markets back to 1996
• Supported by majority major international and national hotel chains and independent hotels
STR Global 2014 www.strglobal.com
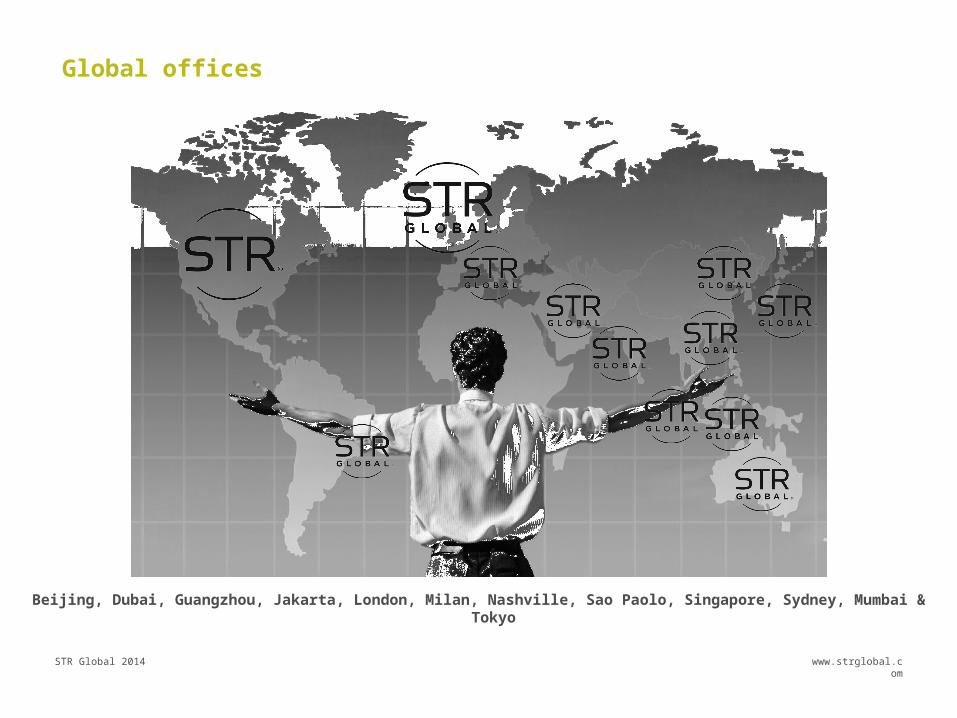
Global offices
Beijing, Dubai, Guangzhou, Jakarta, London, Milan, Nashville, Sao Paolo, Singapore, Sydney, Mumbai & Tokyo

STR Global 2014 www.strglobal.com
Why should hotels benchmark?

STR Global 2014 www.strglobal.com
‘In the business world, the rear view mirror is always clearer than the windshield’
Warren Buffett

STR Global 2014 www.strglobal.com
‘Bad news is not like a fine wine, it doesn’t improve with age.’
Colin Powell

STR Global 2014 www.strglobal.com
‘Benchmarking is simply about making comparisons with other organisations and then learning the lessons that those comparisons throw up.’
European Benchmarking Code of Conduct
STR Global 2014 www.strglobal.com
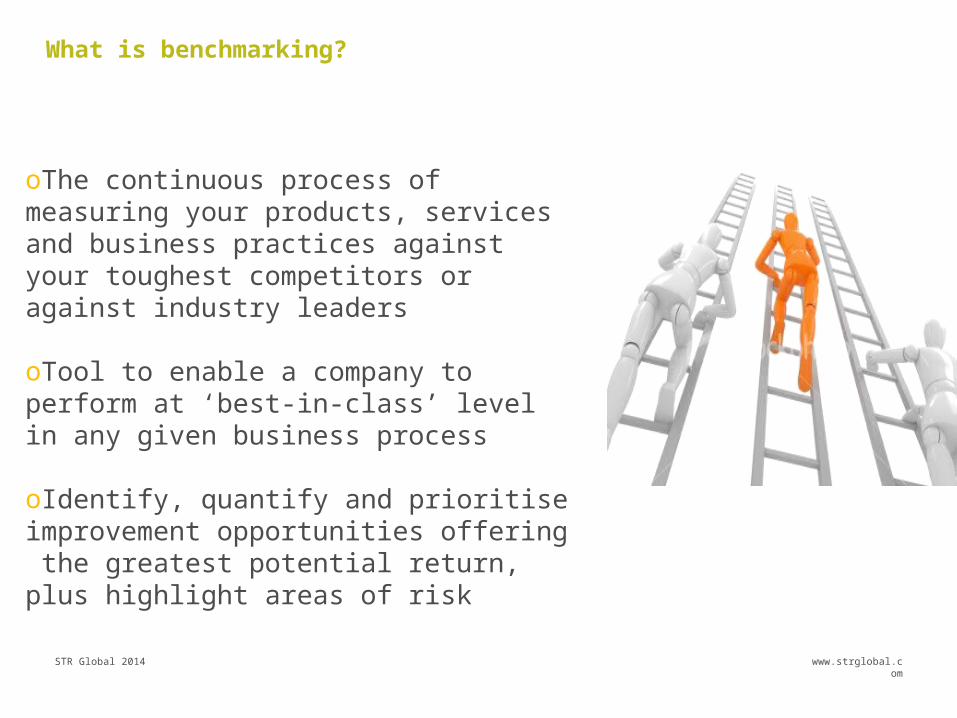
What is benchmarking?
oThe continuous process of measuring your products, services and business practices against your toughest competitors or against industry leaders
oTool to enable a company to perform at ‘best-in-class’ level in any given business process
oIdentify, quantify and prioritise improvement opportunities offering the greatest potential return, plus highlight areas of risk
STR Global 2014 www.strglobal.com
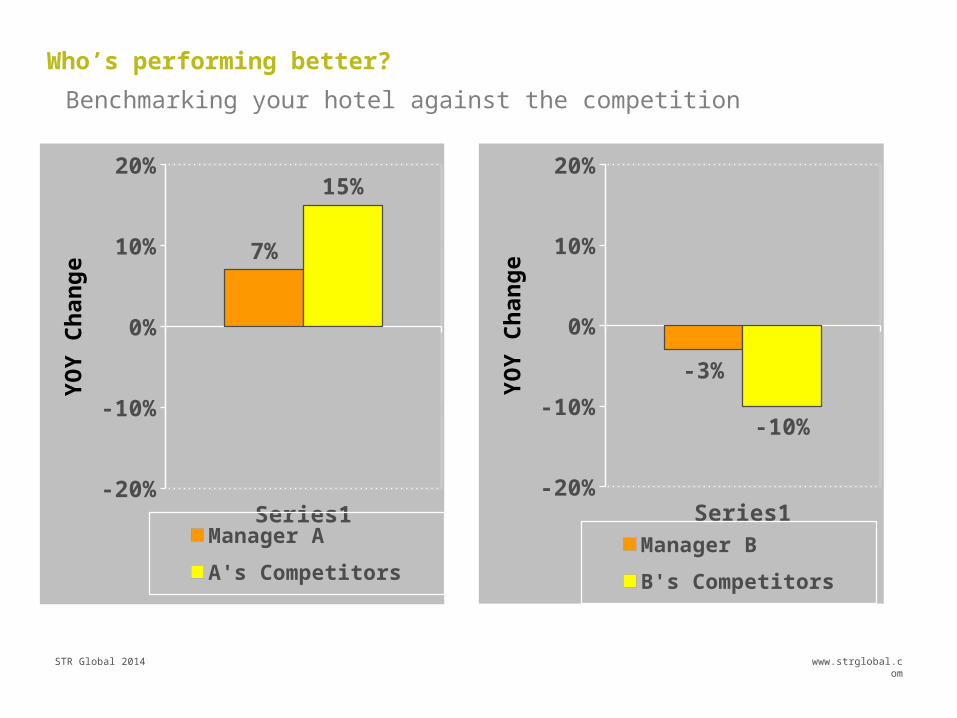
Who’s performing better?
Series1-20%
-10%
0%
10%
20%
7%
15%
Manager A
A's Competitors
YO
Y C
ha
ng
e
Series1-20%
-10%
0%
10%
20%
-3%
-10%
Manager B
B's Competitors
YO
Y C
ha
ng
e
Benchmarking your hotel against the competition
STR Global 2014 www.strglobal.com
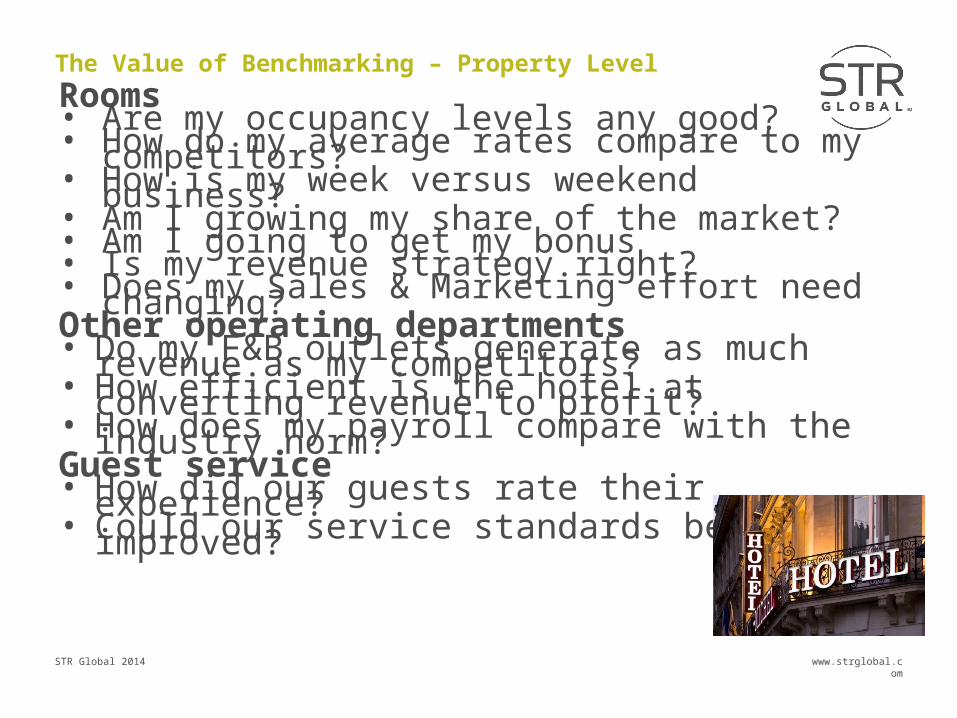
The Value of Benchmarking – Property Level
Rooms• Are my occupancy levels any good?• How do my average rates compare to my competitors?• How is my week versus weekend business?• Am I growing my share of the market?• Am I going to get my bonus• Is my revenue strategy right?• Does my Sales & Marketing effort need changing?Other operating departments• Do my F&B outlets generate as much revenue as my competitors?• How efficient is the hotel at converting revenue to profit?• How does my payroll compare with the industry norm?Guest service• How did our guests rate their experience?• Could our service standards be improved?

STR Global 2014 www.strglobal.com
Why Benchmark ?
• Identify and maximise revenue opportunities
• Make informed business decisions – based on facts
• Assist with Budgeting process
• Plan marketing and sales activities
• Fine-tune your pricing strategies
• Analyse competitive markets specific to your hotel
• Spot trends and be alerted to changes in market conditions
• Be profitable during a downturn
• Forecast changes in demand and supply

STR Global 2014 www.strglobal.com
Measurements of Performance
• Occupancy No. of rooms sold %No. of rooms available
• ADR Net Room RevenueRooms sold
• RevPAR Net Room Revenue OR Occupancy X ADRNo. of rooms available
• Market Indices MPI, ARI, RGI
subject hotel divided by comp set
• Financial GOPPAR, TrevPAR
STR Global 2014 www.strglobal.com
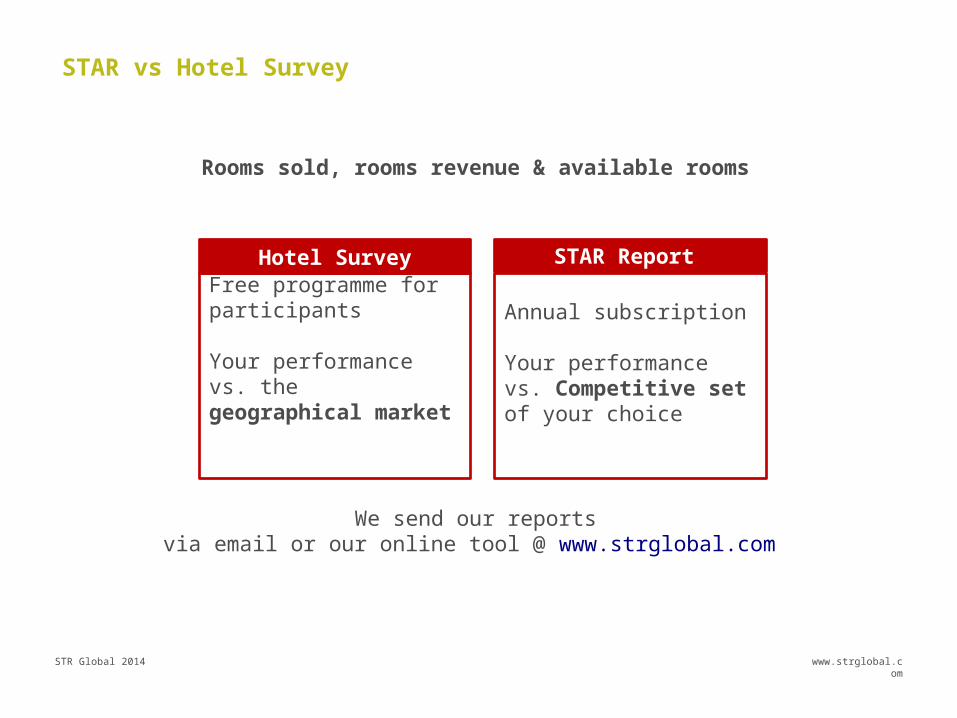
STAR vs Hotel Survey
Rooms sold, rooms revenue & available rooms
We send our reportsvia email or our online tool @ www.strglobal.com
Free programme for participants
Your performance vs. the geographical market
Hotel Survey
Annual subscription
Your performance vs. Competitive set of your choice
STAR Report

STR Global 2014 www.strglobal.com
Report: Hotel Survey
Information about the market
FREE

STR Global 2014 www.strglobal.com
STAR Report
Information about a specific group of competitors
FREE$
Information about the market

STR Global 2014 www.strglobal.com
The STAR Report
Simply submit:
• Rooms sold
• Rooms available
• Rooms revenue
STR Global 2014 www.strglobal.com
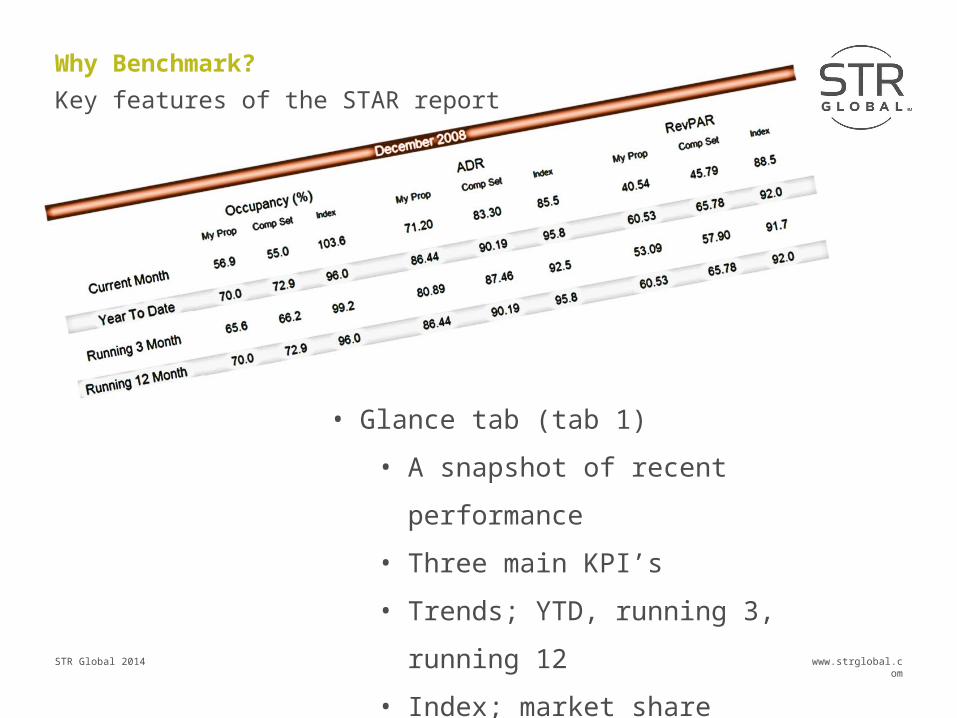
Why Benchmark?
Key features of the STAR report
• Glance tab (tab 1)
• A snapshot of recent performance
• Three main KPI’s
• Trends; YTD, running 3, running 12
• Index; market share
STR Global 2014 www.strglobal.com
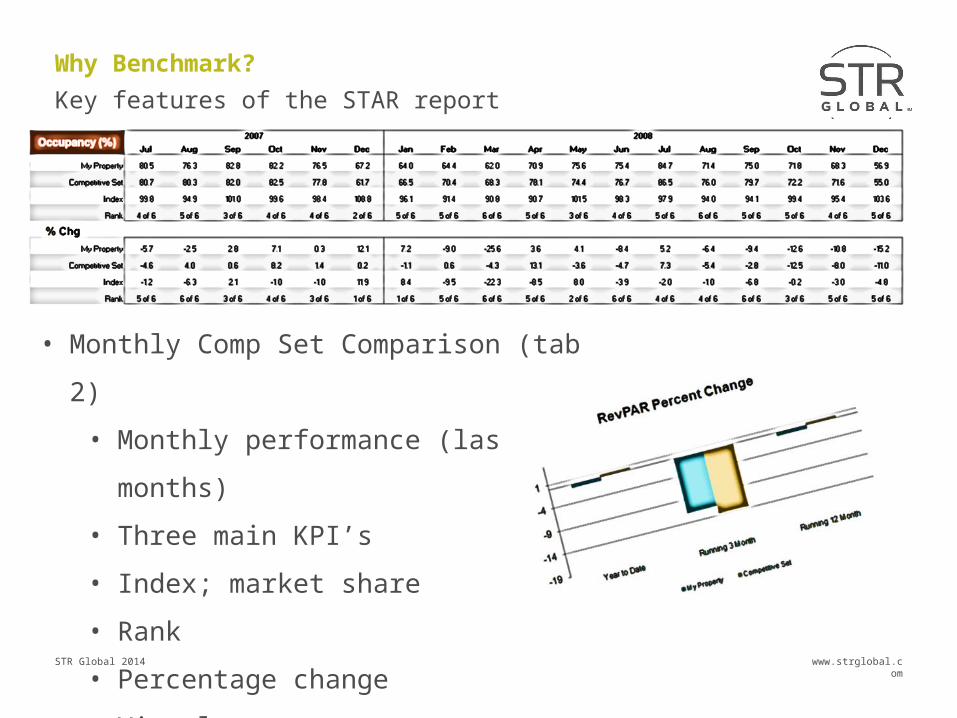
Why Benchmark?
Key features of the STAR report
• Monthly Comp Set Comparison (tab 2)
• Monthly performance (last 18 months)
• Three main KPI’s
• Index; market share
• Rank
• Percentage change
• Visuals
STR Global 2014 www.strglobal.com
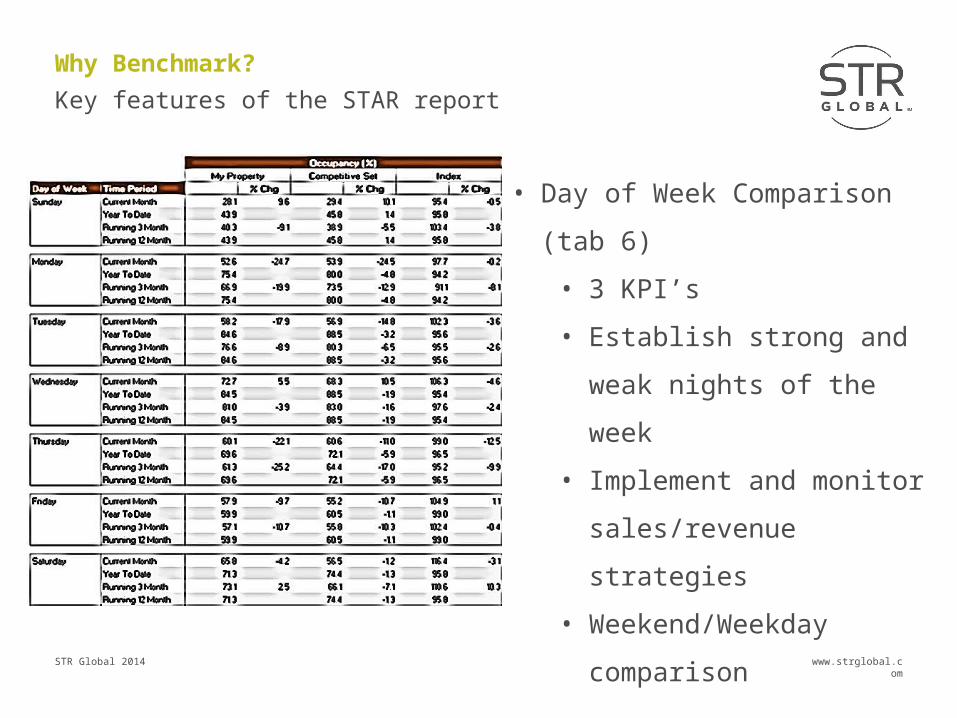
Why Benchmark?
Key features of the STAR report
• Day of Week Comparison (tab 6)
• 3 KPI’s
• Establish strong and weak
nights of the week
• Implement and monitor
sales/revenue strategies
• Weekend/Weekday
comparison
STR Global 2014 www.strglobal.com
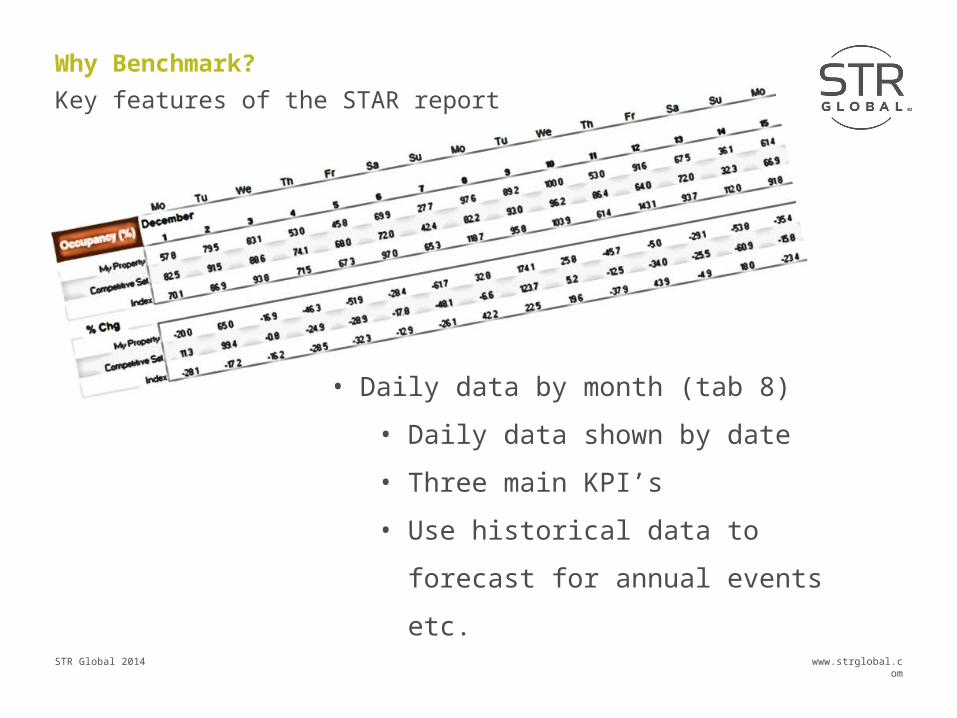
Why Benchmark?
Key features of the STAR report
• Daily data by month (tab 8)
• Daily data shown by date
• Three main KPI’s
• Use historical data to forecast for annual
events etc.
STR Global 2014 www.strglobal.com
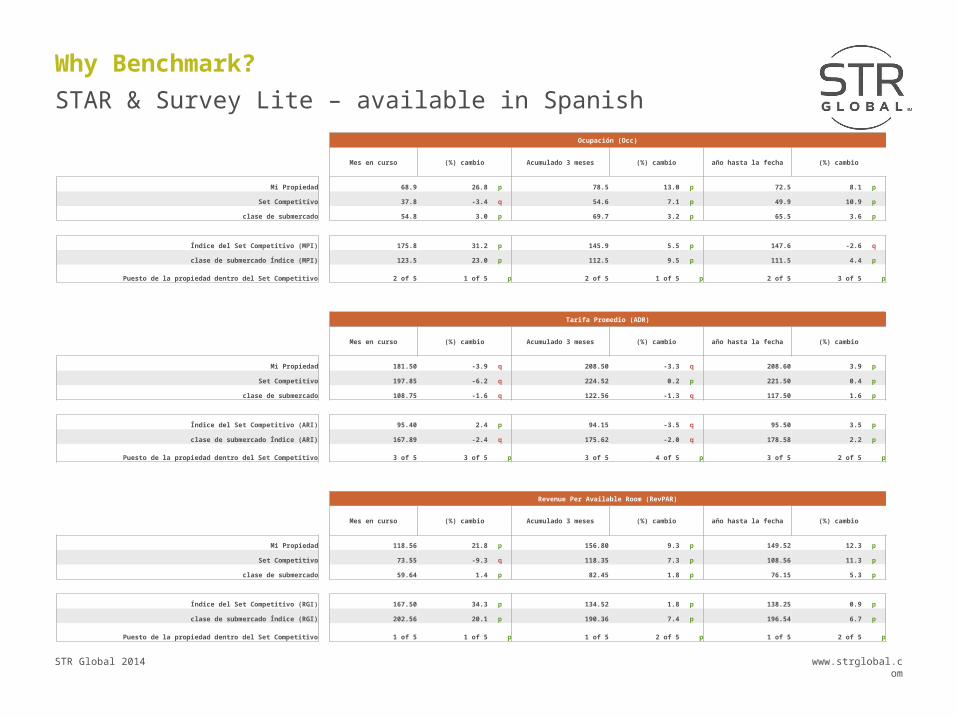
Why Benchmark?
STAR & Survey Lite – available in Spanish
Ocupación (Occ)
Mes en curso (%) cambio Acumulado 3 meses (%) cambio año hasta la fecha (%) cambio
Mi Propiedad 68.9 26.8 p 78.5 13.0 p 72.5 8.1 p
Set Competitivo 37.8 -3.4 q 54.6 7.1 p 49.9 10.9 p
clase de submercado 54.8 3.0 p 69.7 3.2 p 65.5 3.6 p
Índice del Set Competitivo (MPI) 175.8 31.2 p 145.9 5.5 p 147.6 -2.6 q
clase de submercado Índice (MPI) 123.5 23.0 p 112.5 9.5 p 111.5 4.4 p
Puesto de la propiedad dentro del Set Competitivo 2 of 5 1 of 5 p 2 of 5 1 of 5 p 2 of 5 3 of 5 p
Tarifa Promedio (ADR)
Mes en curso (%) cambio Acumulado 3 meses (%) cambio año hasta la fecha (%) cambio
Mi Propiedad 181.50 -3.9 q 208.50 -3.3 q 208.60 3.9 p
Set Competitivo 197.85 -6.2 q 224.52 0.2 p 221.50 0.4 p
clase de submercado 108.75 -1.6 q 122.56 -1.3 q 117.50 1.6 p
Índice del Set Competitivo (ARI) 95.40 2.4 p 94.15 -3.5 q 95.50 3.5 p
clase de submercado Índice (ARI) 167.89 -2.4 q 175.62 -2.0 q 178.58 2.2 p
Puesto de la propiedad dentro del Set Competitivo 3 of 5 3 of 5 p 3 of 5 4 of 5 p 3 of 5 2 of 5 p
Revenue Per Available Room (RevPAR)
Mes en curso (%) cambio Acumulado 3 meses (%) cambio año hasta la fecha (%) cambio
Mi Propiedad 118.56 21.8 p 156.80 9.3 p 149.52 12.3 p
Set Competitivo 73.55 -9.3 q 118.35 7.3 p 108.56 11.3 p
clase de submercado 59.64 1.4 p 82.45 1.8 p 76.15 5.3 p
Índice del Set Competitivo (RGI) 167.50 34.3 p 134.52 1.8 p 138.25 0.9 p
clase de submercado Índice (RGI) 202.56 20.1 p 190.36 7.4 p 196.54 6.7 p
Puesto de la propiedad dentro del Set Competitivo 1 of 5 1 of 5 p 1 of 5 2 of 5 p 1 of 5 2 of 5 p

STR Global 2014 www.strglobal.com
STR Competitive Set Guidelines
1. Minimum 4 reporting hotels (excluding my property)
2. Single hotel or chain can’t have more than 40% of the room supply
3. Single company can’t have more than 60% of the room supply
Your competitors have one or several similarities with you this could be:
• Geographic - Location
• Services – Amenities
• Target market
May have multiple competitive sets & include/ exclude your own hotel.
Individual data is confidential and will never be isolated/published
STR Global 2014 www.strglobal.com
Confidentiality & security
• Our business is your business – it’s in our best interest to ensure confidentiality and security of data
• Trustworthy, third party provider• Aggregated data – your individual performance is never
isolated• Never report on less than 4 properties – to eliminate
potential isolation• Strict data reporting guidelines• Data checks• GIGO – Garbage In Garbage Out
STR Global 2014 www.strglobal.com
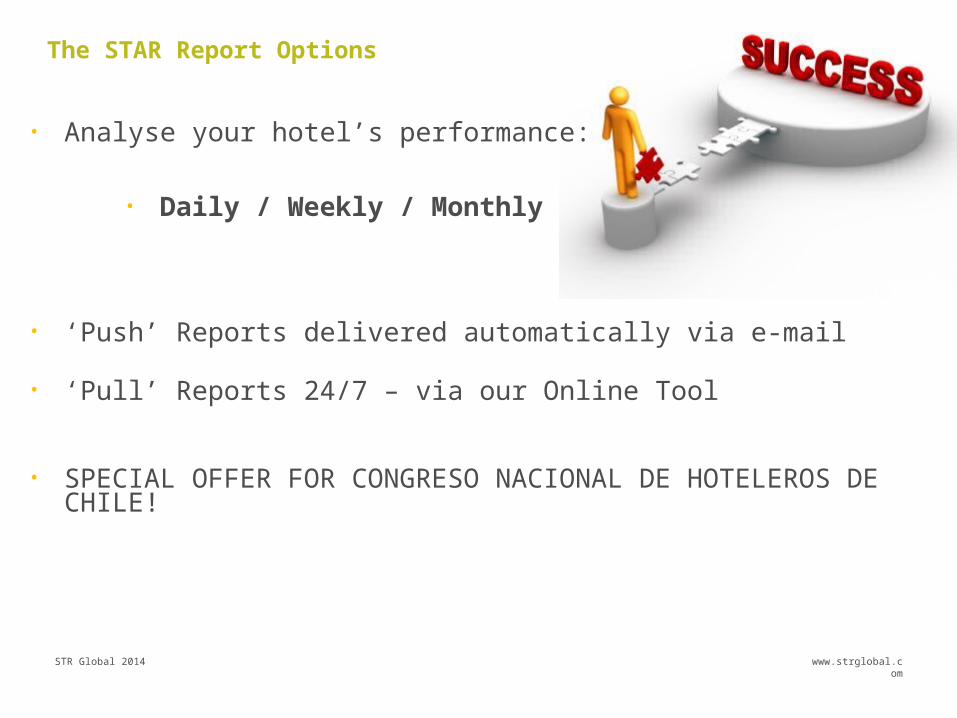
The STAR Report Options
• Analyse your hotel’s performance:
• Daily / Weekly / Monthly
• ‘Push’ Reports delivered automatically via e-mail
• ‘Pull’ Reports 24/7 – via our Online Tool
• SPECIAL OFFER FOR CONGRESO NACIONAL DE HOTELEROS DE CHILE!

STR Global 2014 www.strglobal.comwww.strglobal.com
Global Performance
STR Global 2014 www.strglobal.com
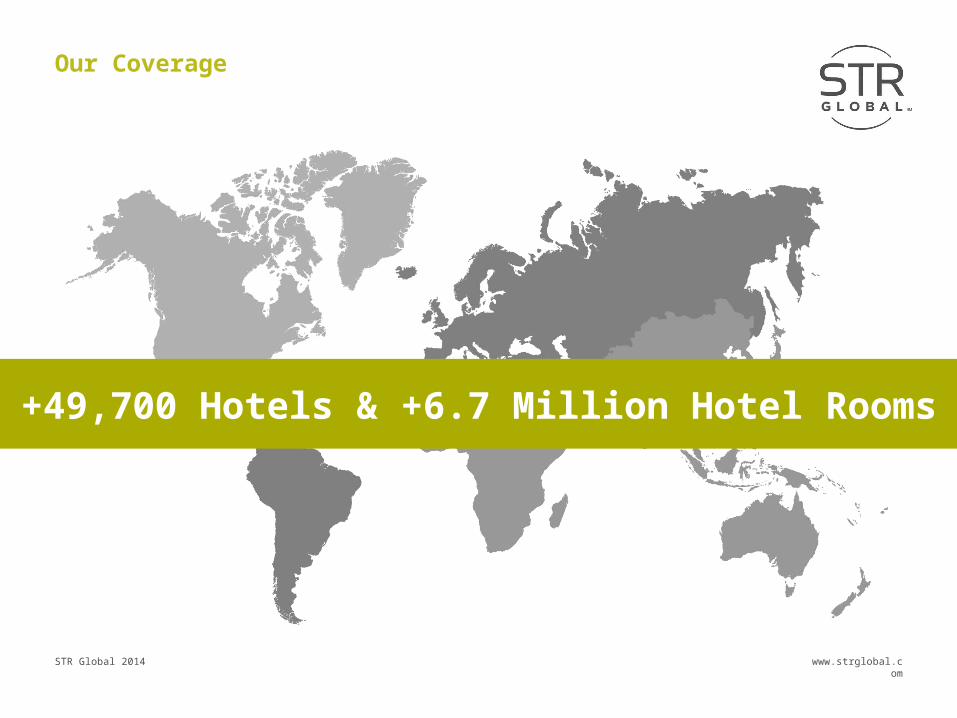
Our Coverage
+49,700 Hotels & +6.7 Million Hotel Rooms
STR Global 2014 www.strglobal.com
Our Coverage
Hotels & Hotel Rooms
+8.5K
+1.1M
+6.1K
+1.2M+650
+118K+760
+122K
+33K
+3.9M
+560
+147K
Hotels
Rooms

STR Global 2014 www.strglobal.com
Census Global Picture
Branded vs. Unbranded rooms – July 2014
41%
59%
50%
50%
42%
58%
65%
35%
58%
42%
Branded
Unbranded
38%
62%

STR Global 2014 www.strglobal.com
Global Picture
Pipeline % increase # of rooms
3%
41%
14%8%
15%
7%
STR Global 2014 www.strglobal.com
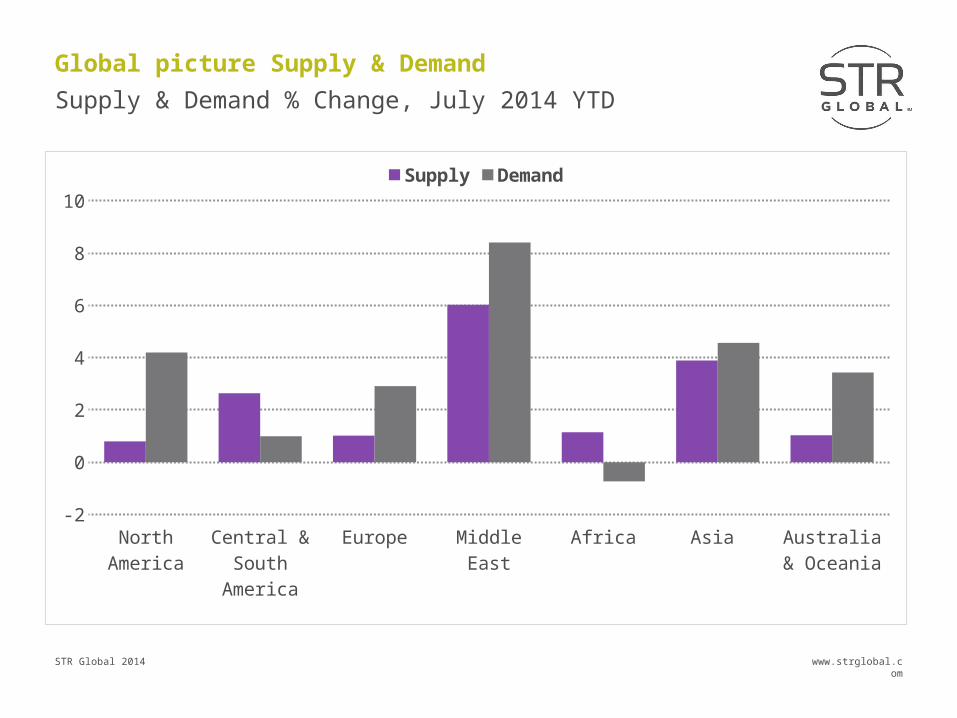
Global picture Supply & Demand
North A
meric
a
Central &
South
Am
erica
Europe
Mid
dle E
ast
Africa
Asia
Austra
lia &
Oce
ania-2
0
2
4
6
8
10
Supply Demand
Supply & Demand % Change, July 2014 YTD

STR Global 2014 www.strglobal.comSTR Global 2014 www.strglobal.com
Global RevPAR Map
July 2014 YTD RevPAR % change, in Constant Currency USD, Europe in EUR
+7.7% +4.4%€ +5.5%
+1%
+6.3%-3.0%
+17.1%
+3.5%
STR Global 2014 www.strglobal.comwww.strglobal.com
Regional Performance
STR Global 2014 www.strglobal.com
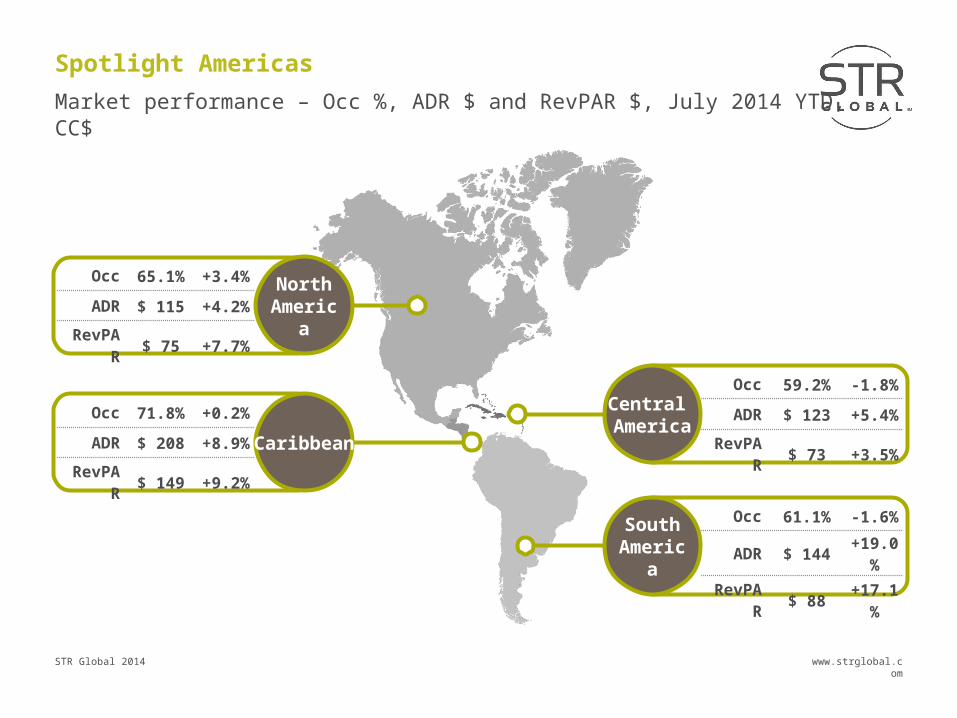
Spotlight Americas
Market performance – Occ %, ADR $ and RevPAR $, July 2014 YTD, CC$
Central America
Occ 59.2% -1.8%
ADR $ 123 +5.4%
RevPAR $ 73 +3.5%
North America
Occ 65.1% +3.4%
ADR $ 115 +4.2%
RevPAR $ 75 +7.7%
Caribbean
Occ 71.8% +0.2%
ADR $ 208 +8.9%
RevPAR $ 149 +9.2%
South America
Occ 61.1% -1.6%
ADR $ 144 +19.0%
RevPAR $ 88 +17.1%
STR Global 2014 www.strglobal.com
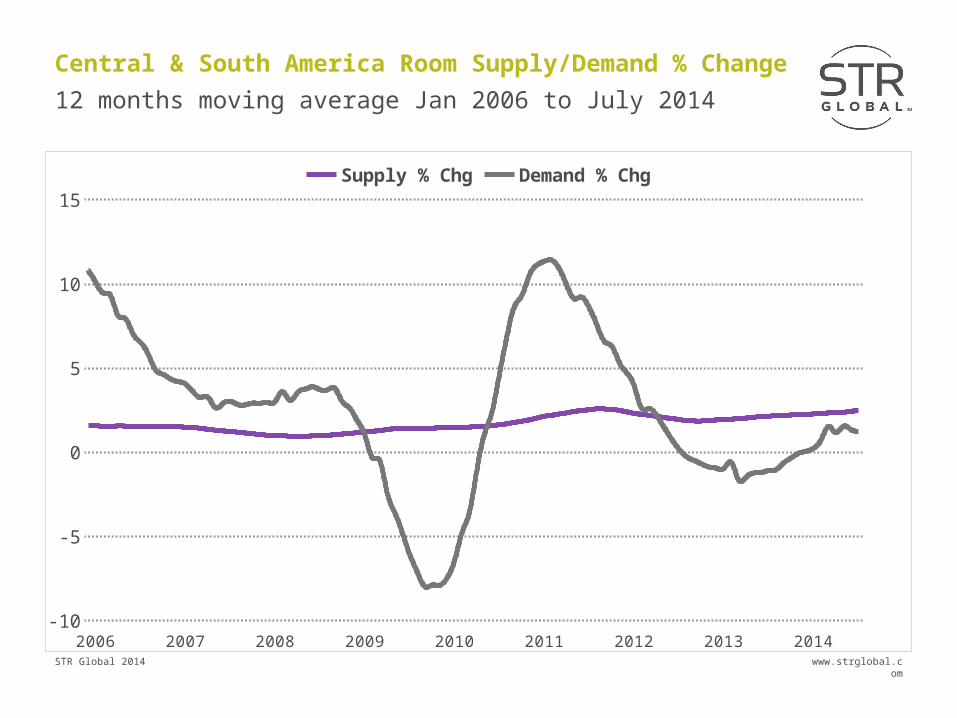
Central & South America Room Supply/Demand % Change
12 months moving average Jan 2006 to July 2014
2006 2007 2008 2009 2010 2011 2012 2013 2014-10
-5
0
5
10
15
Supply % Chg Demand % Chg
STR Global 2014 www.strglobal.com
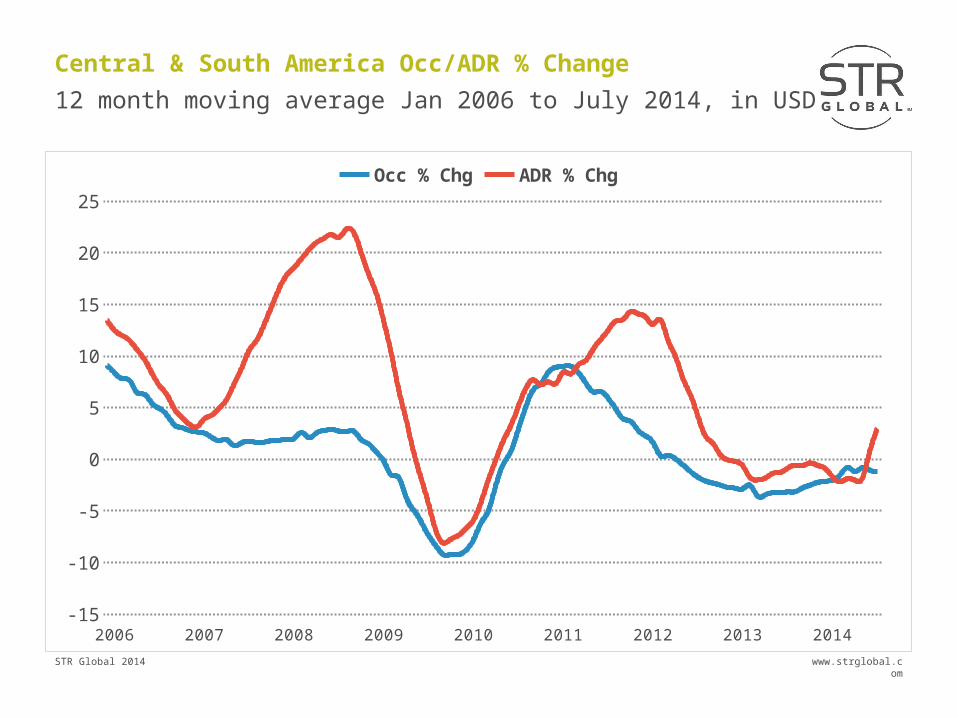
Central & South America Occ/ADR % Change
12 month moving average Jan 2006 to July 2014, in USD
2006 2007 2008 2009 2010 2011 2012 2013 2014-15
-10
-5
0
5
10
15
20
25
Occ % Chg ADR % Chg

STR Global 2014 www.strglobal.com
Central & South America Classes Occ and ADR
Luxury Upper Upscale Upscale Upper Midscale0%
10%
20%
30%
40%
50%
60%
70%
80%
$0
$50
$100
$150
$200
$250
$300
$350
$400
Occ 13 Occ 14 ADR 13 ADR 14+21.9%
+0.7%+8.8%
-6.2%
-2.0% -2.8%-3.5% +3.4%
July 2013 & 2014 YTD, in USD

STR Global 2014 www.strglobal.com
Central / South Americas Countries Occ, ADR
Argentina Brazil Chile Colombia Costa Rica
Ecuador Peru Uruguay Venezuela40%
45%
50%
55%
60%
65%
70%
$0
$100
$200
$300
$400
$500
$600
Occupancy ADR
July 2014 YTD, in USD
STR Global 2014 www.strglobal.com
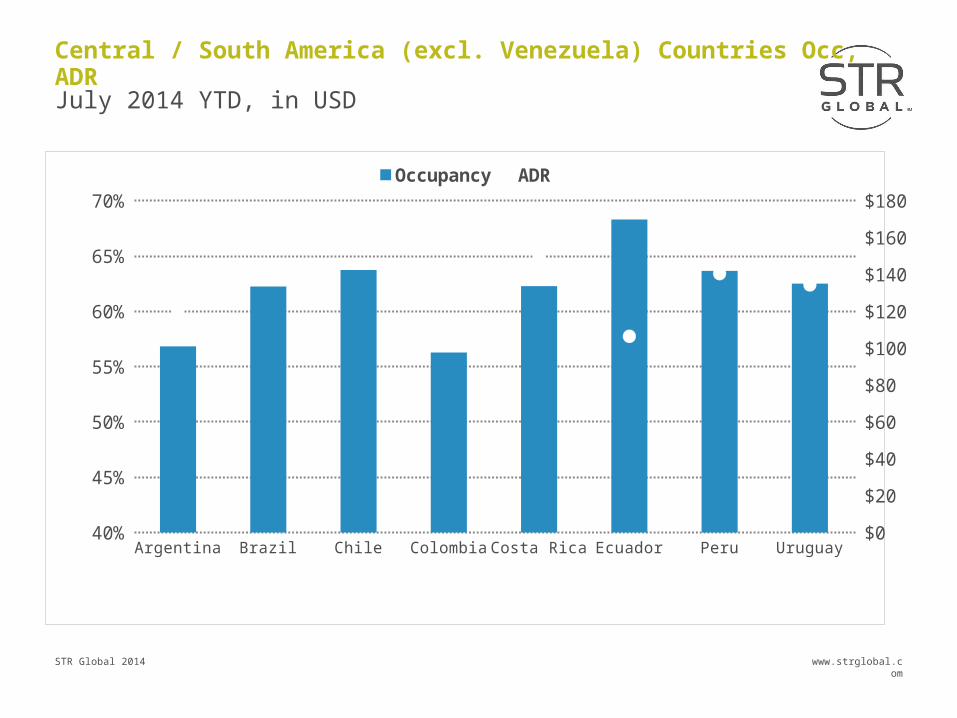
Central / South America (excl. Venezuela) Countries Occ, ADR
Argentina Brazil Chile Colombia Costa Rica Ecuador Peru Uruguay40%
45%
50%
55%
60%
65%
70%
$0
$20
$40
$60
$80
$100
$120
$140
$160
$180
Occupancy ADR
July 2014 YTD, in USD
STR Global 2014 www.strglobal.com
Central / South America Countries Occ, ADR % Chg
July 2014 YTD, in local currency
Argentin
a
Brazil
Chile
Colom
bia
Costa R
ica
Ecuador
Peru
Uruguay
Venezuela
-30%
-10%
10%
30%
50%
70%
90%
110%
130%Occupancy ADR

STR Global 2014 www.strglobal.com
Central / South America (Excl. Venezuela) Countries Occ, ADR % Chg
July 2014 YTD, in local currency
Argentina Brazil Chile Colombia Costa Rica
Ecuador Peru Uruguay-10%
0%
10%
20%
30%
40%
50%Occupancy ADR

STR Global 2014 www.strglobal.com
Central & South America Markets Occ, ADR
40%
50%
60%
70%
80%
$0
$50
$100
$150
$200
$250
$300
Occupancy ADR
July 2014 YTD, in USD
STR Global 2014 www.strglobal.com
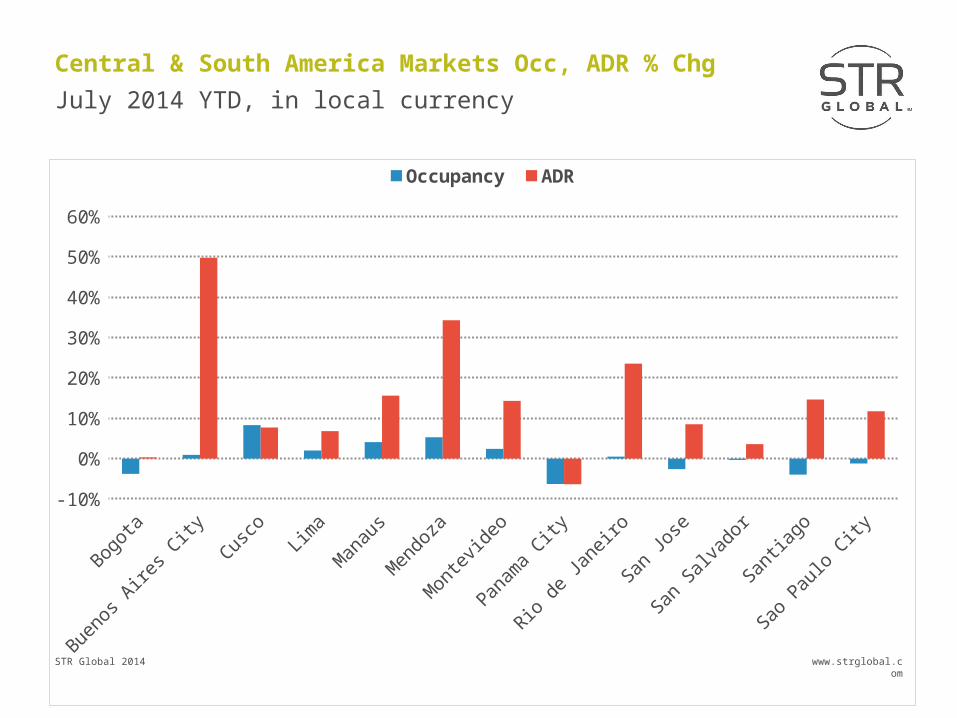
Central & South America Markets Occ, ADR % Chg
July 2014 YTD, in local currency
Bogota
Buenos Aire
s City
Cusco
Lima
Manaus
Mendoza
Monte
video
Panama C
ity
Rio d
e Janeiro
San Jose
San Salva
dor
Santiago
Sao Paulo
City
-10%
0%
10%
20%
30%
40%
50%
60%
Occupancy ADR
STR Global 2014 www.strglobal.comwww.strglobal.com
Chilean Performance

STR Global 2014 www.strglobal.com
Santiago Room Supply/Demand % Change
12 months moving average Jan 2006 to July 2014
2006 2007 2008 2009 2010 2011 2012 2013 2014-20
-15
-10
-5
0
5
10
15
20
25
Supply % Chg Demand % Chg

STR Global 2014 www.strglobal.com
Santiago Occ/ADR % Change
12 month moving average Jan 2006 to July 2014, in CLP
2006 2007 2008 2009 2010 2011 2012 2013 2014-30
-20
-10
0
10
20
30
40
Occ % Chg ADR % Chg
STR Global 2014 www.strglobal.com
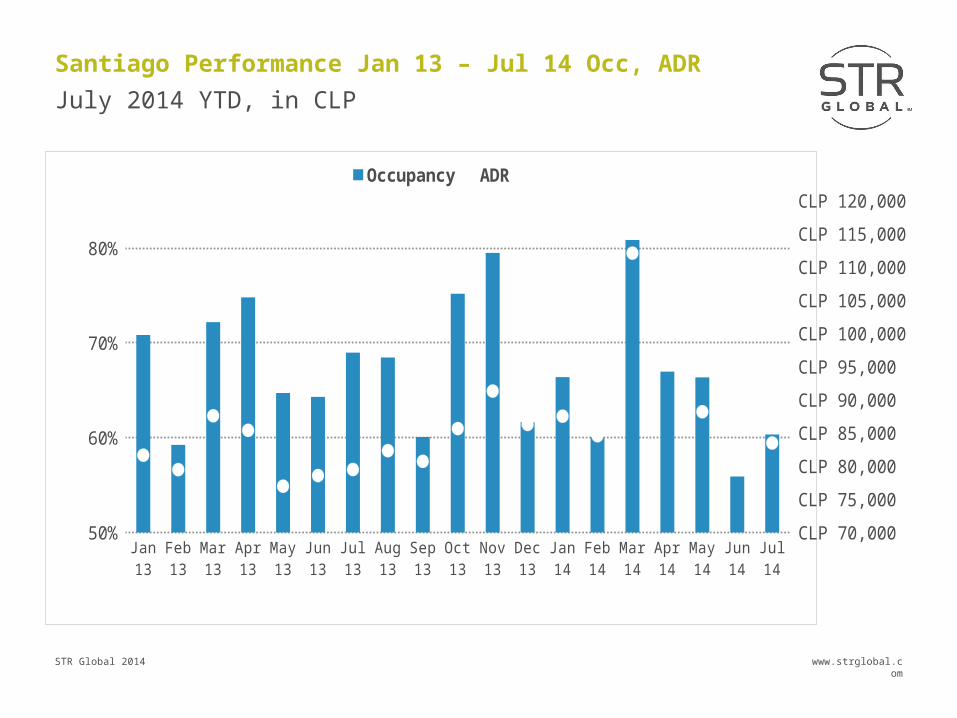
Santiago Performance Jan 13 – Jul 14 Occ, ADR
Jan 13
Feb 13
Mar 13
Apr 13
May 13
Jun 13
Jul 13
Aug 13
Sep 13
Oct 13
Nov 13
Dec 13
Jan 14
Feb 14
Mar 14
Apr 14
May 14
Jun 14
Jul 14
50%
60%
70%
80%
CLP 70,000
CLP 75,000
CLP 80,000
CLP 85,000
CLP 90,000
CLP 95,000
CLP 100,000
CLP 105,000
CLP 110,000
CLP 115,000
CLP 120,000
Occupancy ADR
July 2014 YTD, in CLP
STR Global 2014 www.strglobal.com
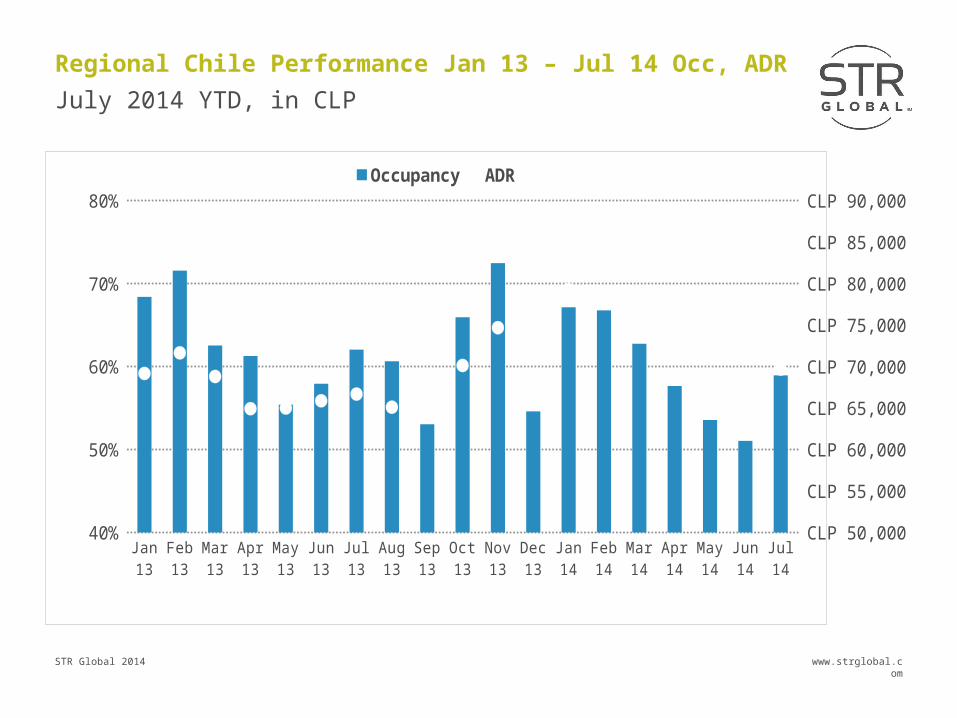
Regional Chile Performance Jan 13 – Jul 14 Occ, ADR
Jan 13
Feb 13
Mar 13
Apr 13
May 13
Jun 13
Jul 13
Aug 13
Sep 13
Oct 13
Nov 13
Dec 13
Jan 14
Feb 14
Mar 14
Apr 14
May 14
Jun 14
Jul 14
40%
50%
60%
70%
80%
CLP 50,000
CLP 55,000
CLP 60,000
CLP 65,000
CLP 70,000
CLP 75,000
CLP 80,000
CLP 85,000
CLP 90,000
Occupancy ADR
July 2014 YTD, in CLP
STR Global 2014 www.strglobal.com
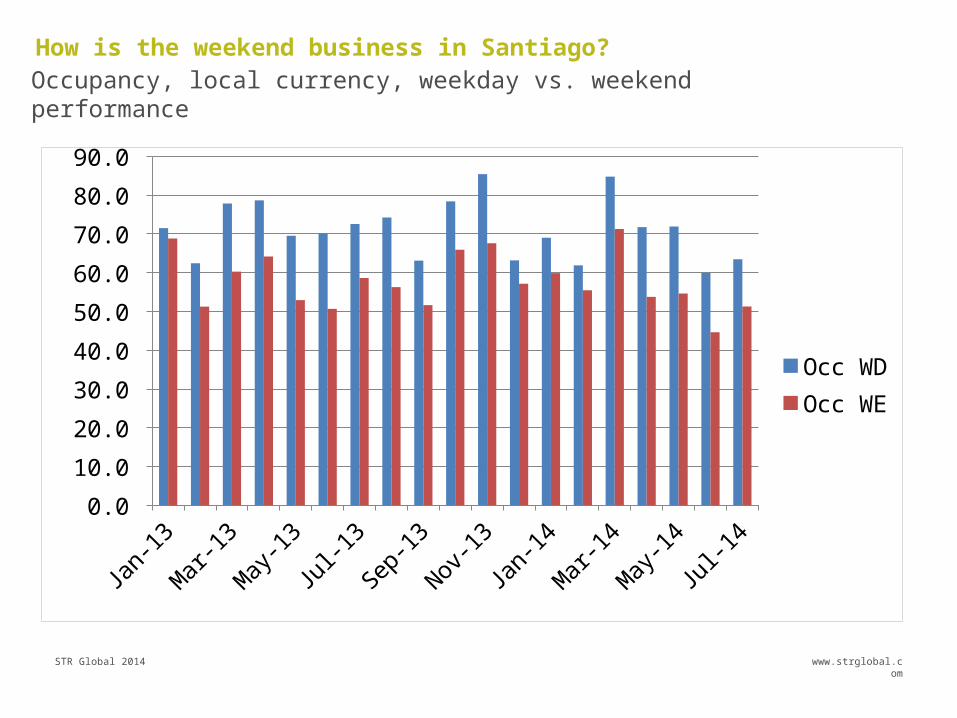
Jan
13
Mar
13
May
13
Jul 1
3
Sep 1
3
Nov 1
3
Jan
14
Mar
14
May
14
Jul 1
4 0.0
10.0
20.0
30.0
40.0
50.0
60.0
70.0
80.0
90.0
Occ WDOcc WE
How is the weekend business in Santiago? Occupancy, local currency, weekday vs. weekend performance
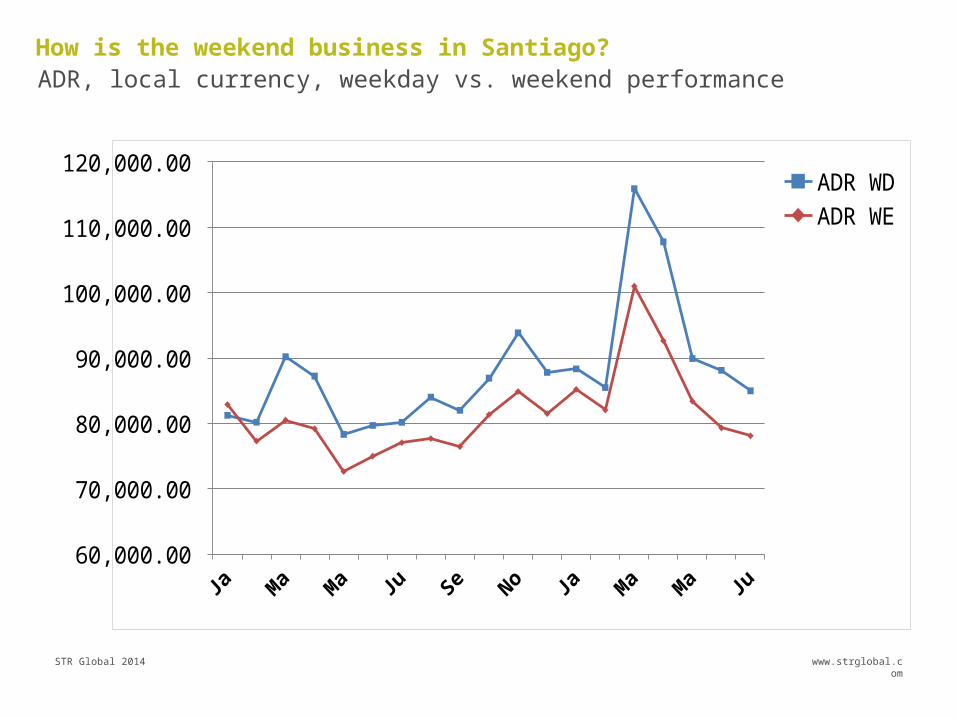
STR Global 2014 www.strglobal.com
60,000.00
70,000.00
80,000.00
90,000.00
100,000.00
110,000.00
120,000.00 ADR WDADR WE
How is the weekend business in Santiago? ADR, local currency, weekday vs. weekend performance

STR Global 2014 www.strglobal.comwww.strglobal.com
Pipeline

STR Global 2014 www.strglobal.com
Central & South America Pipeline by Chain Scale
As of August 01, 2014, Pipeline by Room Count
6%
9%
24%
22%
22%
11%
6%
Luxury Chains
Upper Upscale Chains
Upscale Chains
Upper Midscale Chains
Midscale Chains
Economy Chains
Unaffiliated
STR Global 2014 www.strglobal.com
Central & South America – Pipeline, Top 10
Bolivia
Uruguay
Paraguay
Peru
Costa Rica
Chile
Argentina
Panama
Colombia
Brazil
0 5,000 10,000 15,000 20,000 25,000 30,000 35,000 40,000 45,000
Pipeline
Pipeline
# Rooms, as of August 01, 2014
STR Global 2014 www.strglobal.com
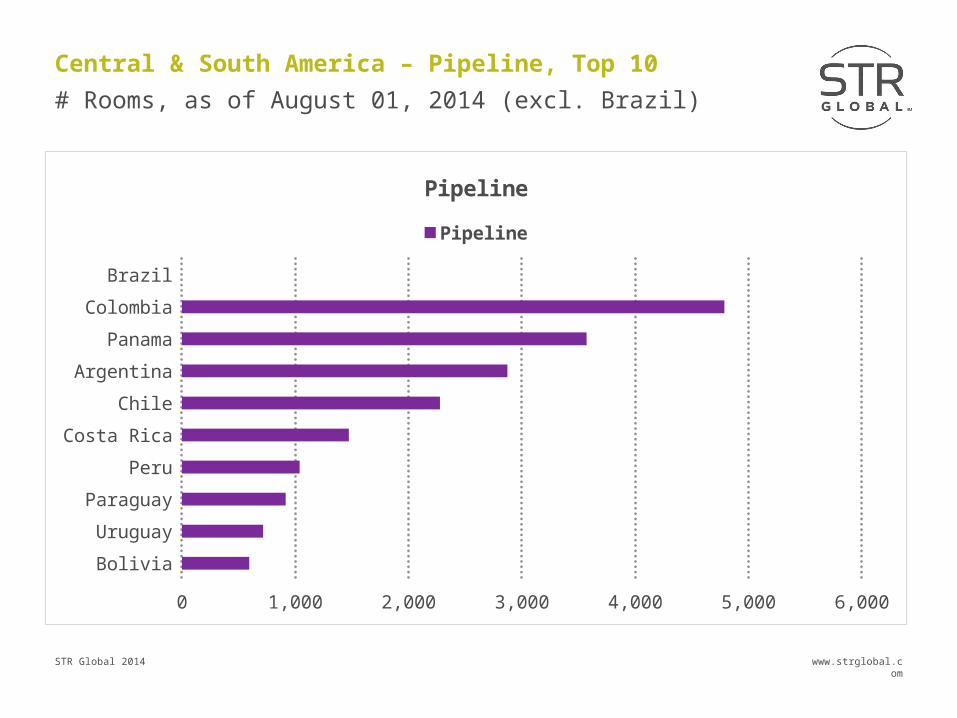
Central & South America – Pipeline, Top 10
Bolivia
Uruguay
Paraguay
Peru
Costa Rica
Chile
Argentina
Panama
Colombia
Brazil
0 1,000 2,000 3,000 4,000 5,000 6,000
Pipeline
Pipeline
# Rooms, as of August 01, 2014 (excl. Brazil)
STR Global 2014 www.strglobal.com
STR Global
www.strglobal.comYou can follow us on LinkedIn,Twitter, Facebook
STR Global, Ltd is the exclusive owner of all rights in this presentation and its content. Reproduction of all or a portion of this presentation for any purpose without prior approval of STR Global is strictly prohibited.
This presentation is based on information compiled by STR Global Ltd. No strategic or marketing recommendations or advice are intended or implied.
Importance of Hotel Data
Thomas Emanuel
0044 (0) 20 7922 1949